
Abstract
As capillaries exhibit heterogeneous and fluctuating dynamics even during baseline, a technique measuring red blood cell (RBC) speed and flux over many capillaries at the same time is needed. Here, we report that optical coherence tomography can capture individual RBC passage simultaneously over many capillaries located at different depths. Further, we demonstrate the ability to quantify RBC speed, flux, and linear density. This technique will provide a means to monitor microvascular flow dynamics over many capillaries at different depths at the same time.
INTRODUCTION
Interest in the brain's blood flow regulation has been evolving towards understanding the role of the spatio-temporal dynamics of capillary networks. In distinction to arterioles, capillaries have been reported to exhibit highly heterogeneous responses to neural activation, capillary by capillary,1,2 and nearly stochastic distributions during baseline 3 potentially masking neural activity-induced responses within single capillaries. 4 Therefore, a technique to measure red blood cell (RBC) flow characteristics at a number of capillaries at the same time is required, so that one can study capillary responses in a statistical manner with high statistical significance. Here, this Brief Communication reports that individual RBC passage can be captured in the signal time courses of high-speed optical coherence tomography (OCT) imaging and that RBC speed and flux over many capillaries located at different depths can be simultaneously quantified from the observed RBC passages.
OCT enables 3D imaging of tissue structures with μm resolution.
5
It needs no extrinsic contrast agents and can image at depth (up to ~1 mm in brain tissue). Furthermore, it simultaneously resolves all voxels along the axial direction over the depth of focus thus improving the volumetric imaging speed by 1–2 orders of magnitude
6
when compared with traditional confocal and two-photon microscopes.7,8 Meanwhile, according to the Mie scattering theory suggesting that 1-μm wavelength light scattering is sensitive to scatterers of 0.1-10μm in size (Supplementary Figure S1 of Lee
MATERIAL AND METHODS
Animal Preparation
Sprague Dawley rats (250–300 g,
All animal experimental procedures were reviewed and approved by the Massachusetts General Hospital Subcommittee on Research Animal Care, according to the guidelines and policies of office of laboratory animal welfare and public health service, National Institutes of Health.
Spectral-Domain Optical Coherence Tomography System
We optimized a spectral-domain OCT system (Thorlabs, Inc., Newton, NJ, USA) for rodent cerebral cortex imaging. 10 The transverse resolution is 3.5 and 7 μm with x 10 and x 5 objectives, respectively. The axial resolution is matched to the transverse one for isotropic voxels by manipulating the spectrum fringe data. The imaging speed is 47,000 A-scan/s. A-scan in OCT means a single acquisition of 1D data over the depth axis (z axis), while B-scan means a single acquisition of 2D data over a cross-sectional plane (z-x plane).
RESULTS
OCT Intensity Time Courses Capture Individual RBC Passage
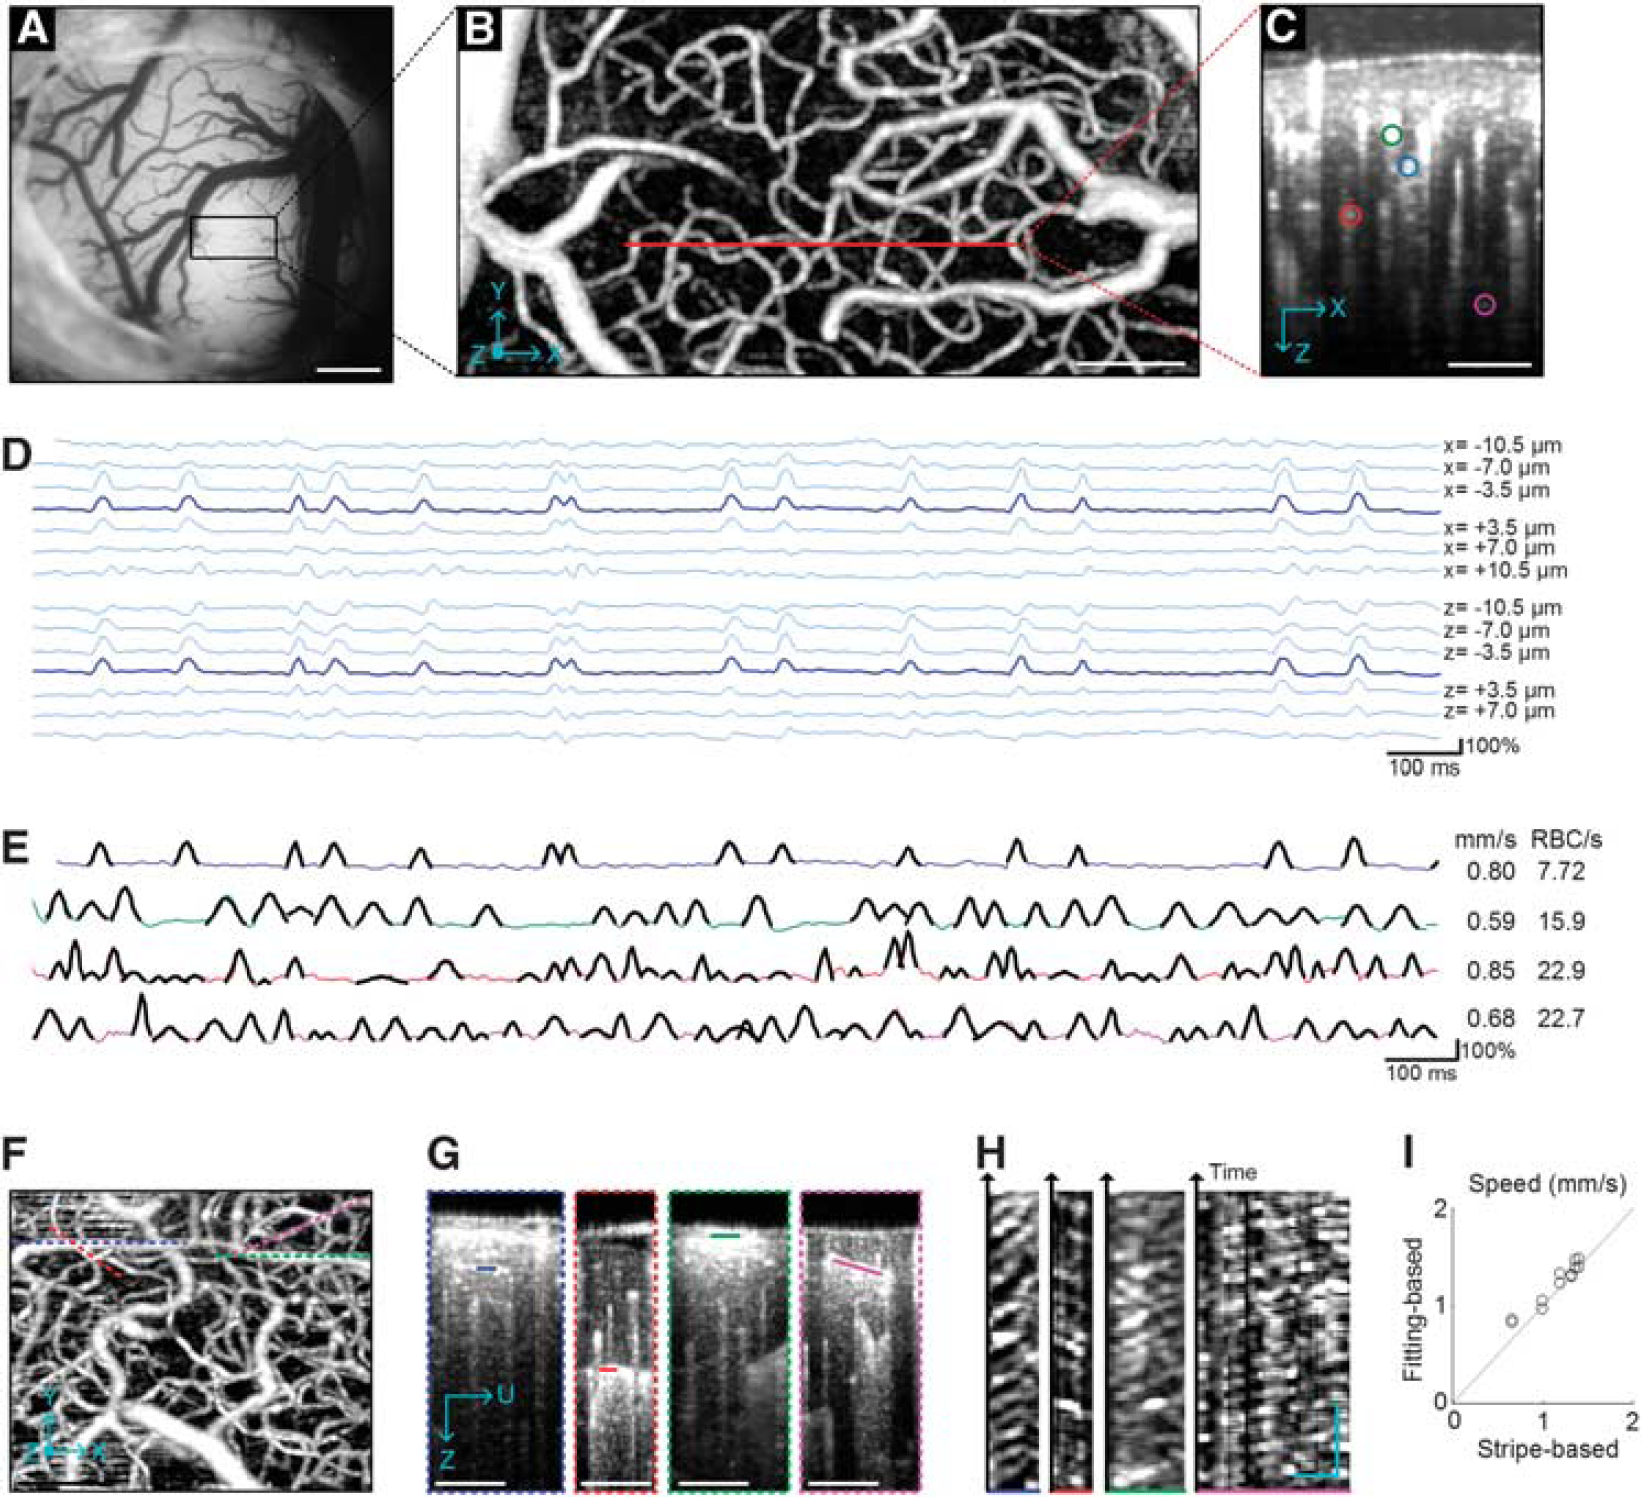
We first performed OCT angiogram imaging
6
through the cranial window (Figures 1A and 1B). Then, on a cross-sectional (z–x) plane (red line in Figure 1B), 1,024 B-scans were consecutively repeated (time gap Δt = 4 ms). This consecutive scanning produced three-dimensional data cubes of the OCT intensity,
(
First, the peaks were localized in space and time, with a spatial extent consistent with RBC size. For a capillary chosen from the cross-section of the angiogram (blue circle in Figure 1C), we plotted the first 2-s time courses of relative changes in the OCT intensity at the center of the capillary and its neighboring voxels (Figure 1D). The time course at the capillary center exhibited several peaks, spanning over 3-4 neighboring voxels (~10 μm in size). Voxels positioned in the tissue far from the capillary center did not exhibit such significant peaks. Second, the intensity peaks did not appear from animal motion (the dominant source of noise). OCT intensity has been shown to fluctuate owing to the animal's cardiac and respiratory motion; 10 however, the peaks appeared at different moments across different capillaries (Figure 1E), whereas motion artifact-oriented fluctuations are generally global in space. 10 Finally, the peaks move through the capillary. As shown in Figures 1F–1H, we found stripe patterns comparable to those found in traditional two-photon line scanning results 7 but without any fluorescence. This observation of the stripe patterns strongly supports that the peaks in the time courses represent RBC passage through capillaries.
Estimation of RBC Speed and Flux using Gaussian Fitting
We developed an algorithm to automatically detect RBC passage peaks in the time courses and fit the peaks with the Gaussian functions. The number of peaks per unit time will correspond to the RBC flux, while the mean width of the Gaussian fits will be negatively correlated with the mean RBC speed.
For each time course, the algorithm moves an 80-ms time window while fitting the data points within the window to a Gaussian function:
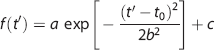
where
The RBC flux was simply estimated by counting the detected peaks per unit time. The RBC speed was estimated using the mean of the fitted b values, <
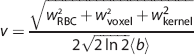
where
The precision of our estimation was tested by repeating 10 runs of OCT imaging at the same cross-section. The RBC speed and flux were reliably estimated, with relative variations across runs of 7% and 12%, respectively. Note that physiological fluctuations might have a role in these variations.
In addition, the accuracy was tested through comparison with traditional stripe pattern-based measurements. We obtained the RBC speed from the stripe pattern (Figure 1H) as in the two-photon line scanning method. 7 We also performed the above fitting-based estimation of speed from time courses extracted from the same data. These two estimations produced results within 9% of each other (Figure 1I).
Volumetric Imaging of Capillary RBC Flux, Speed, and Density
We repeated the above cross-sectional dynamic imaging over 96 adjacent planes within the volume region of interest (total scan time = 384 s). Capillaries in each plane were automatically identified, and their RBC speed and flux were estimated using the algorithm described above. In this 3D imaging, the x 5 objective was used for a larger imaging depth (Figure 2A). As a result, the RBC speed, flux, and density were estimated over a large number of positions across capillaries (
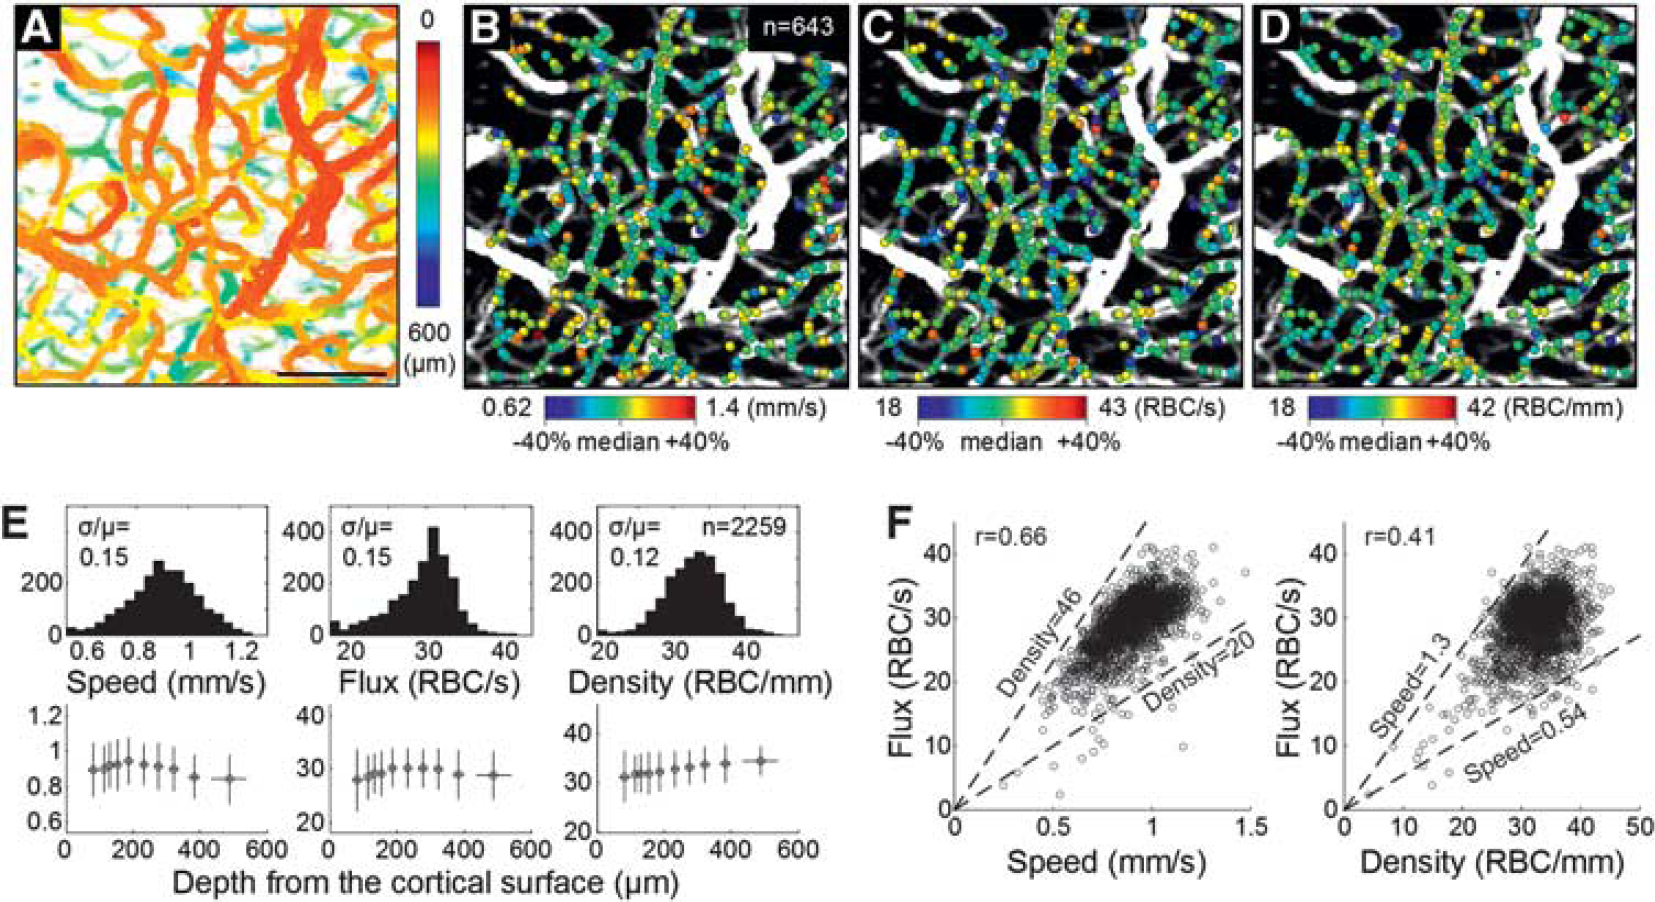
(
This 3D imaging was repeated over three animals. Measurements of the capillary RBC flow properties were gathered over 2,259 positions in total. The ranges of the measured speed and flux overall agreed with those in the literature.7,11,12 The histograms and depth profiles of the measurements are presented in Figure 2E, although physiological interpretation of the profiles will require further study.
DISCUSSION AND CONCLUSION
This Brief Communication demonstrates that OCT can be used to measure capillary RBC speed and flux over a large number of capillaries located at different depths at the same time. Although existing methods measure the flow properties capillary by capillary 7 or depth by depth, 3 the present method can measure them simultaneously over many capillaries located at different depths. This advantage makes it relatively easy to build spatial maps, as shown in Figures 2B–D, with a relatively short scan time. Here, we were able to estimate speed, flux, and density from ~ 750 locations in 384s. A shorter scan time will lead to less contamination arising from slow variations in the animal physiology. In addition, the present method can measure the flow properties even when a capillary is tortuous or spans through different depths. Our speed estimation does not depend, in principle, on the direction of RBC flow as it uses isotropic voxels.
Finally, OCT requires no exogenous contrast agent, which makes the present technique potentially ready for
One of the disadvantages is the assumption used in the speed estimation that RBCs have equivalently similar sizes. RBCs exhibit different orientations while flowing through capillaries
8
and thus different effective sizes in such imaging schemes as ours; however, its effect on speed estimation has been shown to be negligible (see Supplementary Figure S2 in Kamoun
The present technique will be useful for a range of cerebrophysiology studies, especially for those that benefit from simultaneous measurements over many capillaries. As an example, the technique will be used to measure flow responses during neural activation at several arterioles and capillaries at the same time, testing the hypothesis
DISCLOSURE/CONFLICT OF INTEREST
The authors declare no conflict of interest.