
Abstract
This paper describes a novel optical method for label-free quantitative imaging of cerebral blood flow (CBF) and intracellular motility (IM) in the rodent cerebral cortex. This method is based on a technique that integrates dynamic light scattering (DLS) and optical coherence tomography (OCT), named DLS–OCT. The technique measures both the axial and transverse velocities of CBF, whereas conventional Doppler OCT measures only the axial one. In addition, the technique produces a three-dimensional map of the diffusion coefficient quantifying nontranslational motions. In the DLS–OCT diffusion map, we observed high-diffusion spots, whose locations highly correspond to neuronal cell bodies and whose diffusion coefficient agreed with that of the motion of intracellular organelles reported
INTRODUCTION
The energy-consuming active motion of intracellular organelles is an important physiological quantity as it is directly related to cellular metabolism and viability. This intracellular motility (IM) has been shown to exhibit diffusion-like dynamics by using either fluorescence label-based methods1–2 or label-free methods based on dynamic light scattering (DLS) analysis.3–7 However, IM has not been imaged in the cerebral cortex of a living animal, probably because the dynamics are obscured by the larger contribution from cerebral blood flow (CBF). In this paper, we describe a novel method for label-free
The method is based on a technique integrating DLS and optical coherence tomography (OCT), named DLS–OCT. DLS is used to measure flow and diffusion of particles,8–9 while OCT is used for high-resolution three-dimensional (3D) imaging of tissue structure;10–11 and thus the integration enables 3D imaging of flow and diffusion of constituents in tissue. We show that the method enables simultaneous 3D imaging of IM and CBF in the cortex by exploiting the spatial resolution of OCT and using the fact that the former is diffusive while the latter is translational. This ability will provide a means of simultaneous long-term monitoring of blood perfusion and IM
In addition to IM, the DLS–OCT technique provides quantitative imaging of CBF, which is useful for the study of brain pathophysiology. Laser Doppler flowmetry is used to measure blood flow at a fixed point,12–13 and its imaging corollary provides the two-dimensional map of blood flow. 14 Doppler OCT enables depth-resolved measurement of axial flow velocity with microscopic resolution, resulting in a 3D map of blood flow. 15 Compared with these techniques, DLS–OCT can measure both the speed and angle of flow velocity in a volumetric way.
Dynamic light scattering–optical coherence tomography imaging of the rodent cerebral cortex resulted in 3D maps of the diffusion coefficient, the flow velocity, and the coefficient of determination that quantifies how much the motion is close to either flow or diffusion. Combining these information revealed CBF in vessels with capillary resolution and IM in neuronal cell bodies with cellular resolution. The utility of the method is shown by a preliminary application investigating the effect of ischemic stroke on CBF and IM in the animal model.
MATERIALS AND METHODS
Animal Preparation
Sprague–Dawley rats (250–300 g,
For the stroke animal model, 3-month-old mice (
All animal experimental procedures were reviewed and approved by the Massachusetts General Hospital Subcommittee on Research Animal Care, according to the guidelines and policies of office of laboratory animal welfare (OLAW) and public health service, National Institutes of Health.
Spectral-Domain–Optical Coherence Tomography System and Scanning Protocol
We optimized an spectral-domain–OCT system (Thorlabs, Newton, NJ, USA) for dynamic
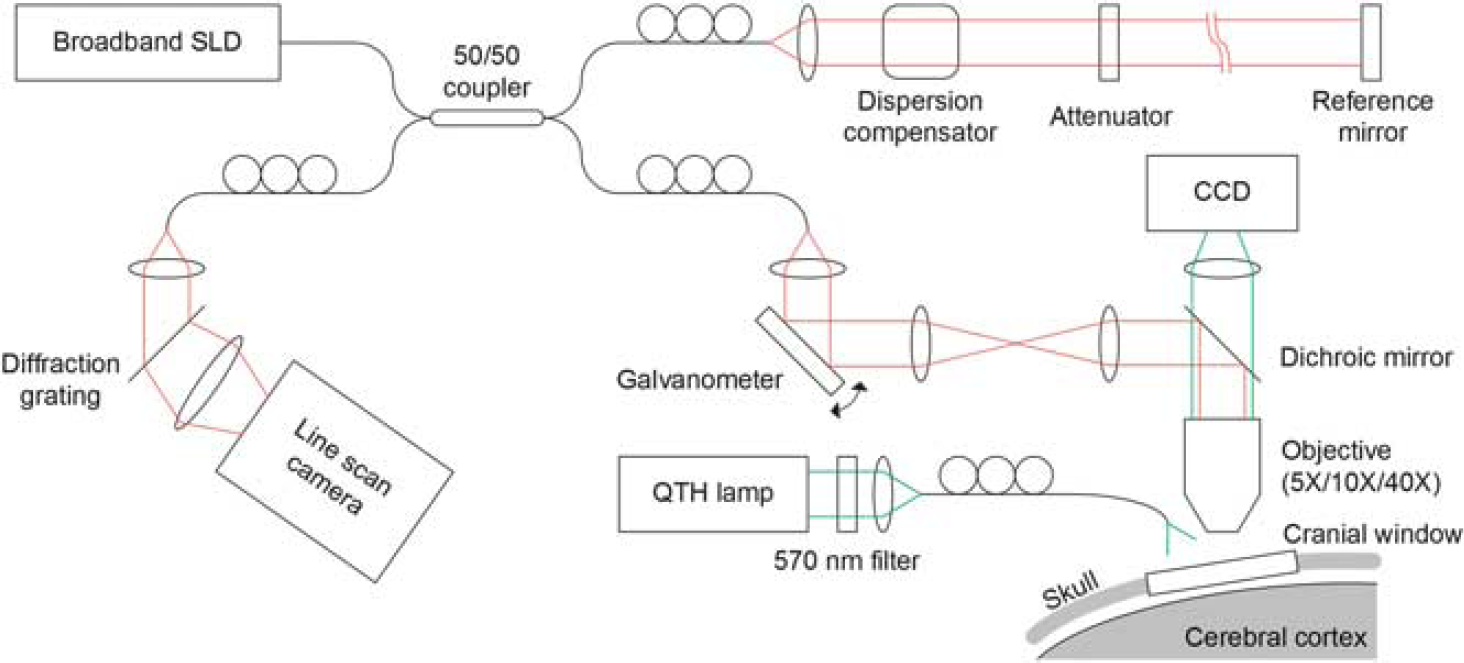
Schematics of the spectral-domain–optical coherence tomography (OCT) system for
A-scans (1D scans) were repeated 100 times at a fixed position, and this scanning was repeated in the raster manner to scan the 3D volume of interest in the cortex. Raw data of the OCT spectrum were acquired, and the complex-valued spectral-domain–OCT signals were obtained from the spectrum data. An angiogram was obtained using the method described previously.16–18
Dynamic Light Scattering–Optical Coherence Tomography Analysis
Technical details of DLS–OCT theory and analysis have been described in our previous publication.
19
In brief, dynamic OCT imaging of a sample produced four-dimensional (space and time) data of the complex-valued reflectivity,
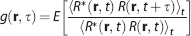
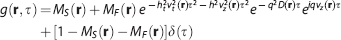
where
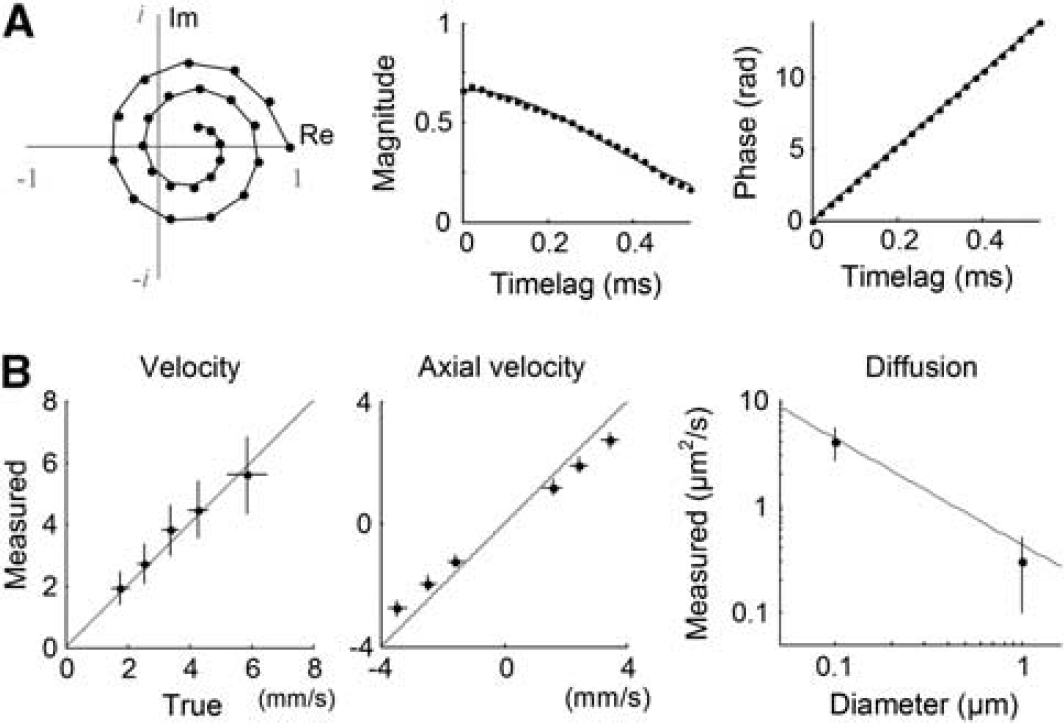
Validation of dynamic light scattering–optical coherence tomography (DLS–OCT) analysis. (
In practice, the four-dimensional field autocorrelation function (for 25 timelag points with the temporal difference of 20 μs) was convolved with a 3 × 3 × 3 (in voxels) spatial kernel, as the autocorrelation function requires the average over initial particle positions (Equation 1). While the axial size of the convolution kernel was constant as 10 μm, its lateral size varied across objectives: 8.4, 4.2, and 2.1 μm for the × 5, × 10, and × 40 objectives, respectively. Analysis of the autocorrelation function data led to 3D maps of the axial velocity, the transverse velocity, the diffusion coefficient, and the coefficient of determination. The values for poorly fitted voxels (
Validation of DLS–OCT Measurement
Phantom experiments validated DLS–OCT measurement of the flow velocity and diffusion (Figure 2B). For the velocity measurement, a piezoelectrically actuated static sample was used to simulate axial movements of particles, while transverse movements were implemented by galvanometric lateral scanning of OCT beam. The absolute and axial velocities were reliably measured across various true values of the flow velocity and angle, where the absolute velocity is
RESULTS
Dynamic light scattering–optical coherence tomography imaging of cerebral blood flow
Analysis of the autocorrelation function data obtained in the cerebral cortex led to 3D maps of the absolute and axial velocities, the diffusion coefficient, and the coefficient of determination (
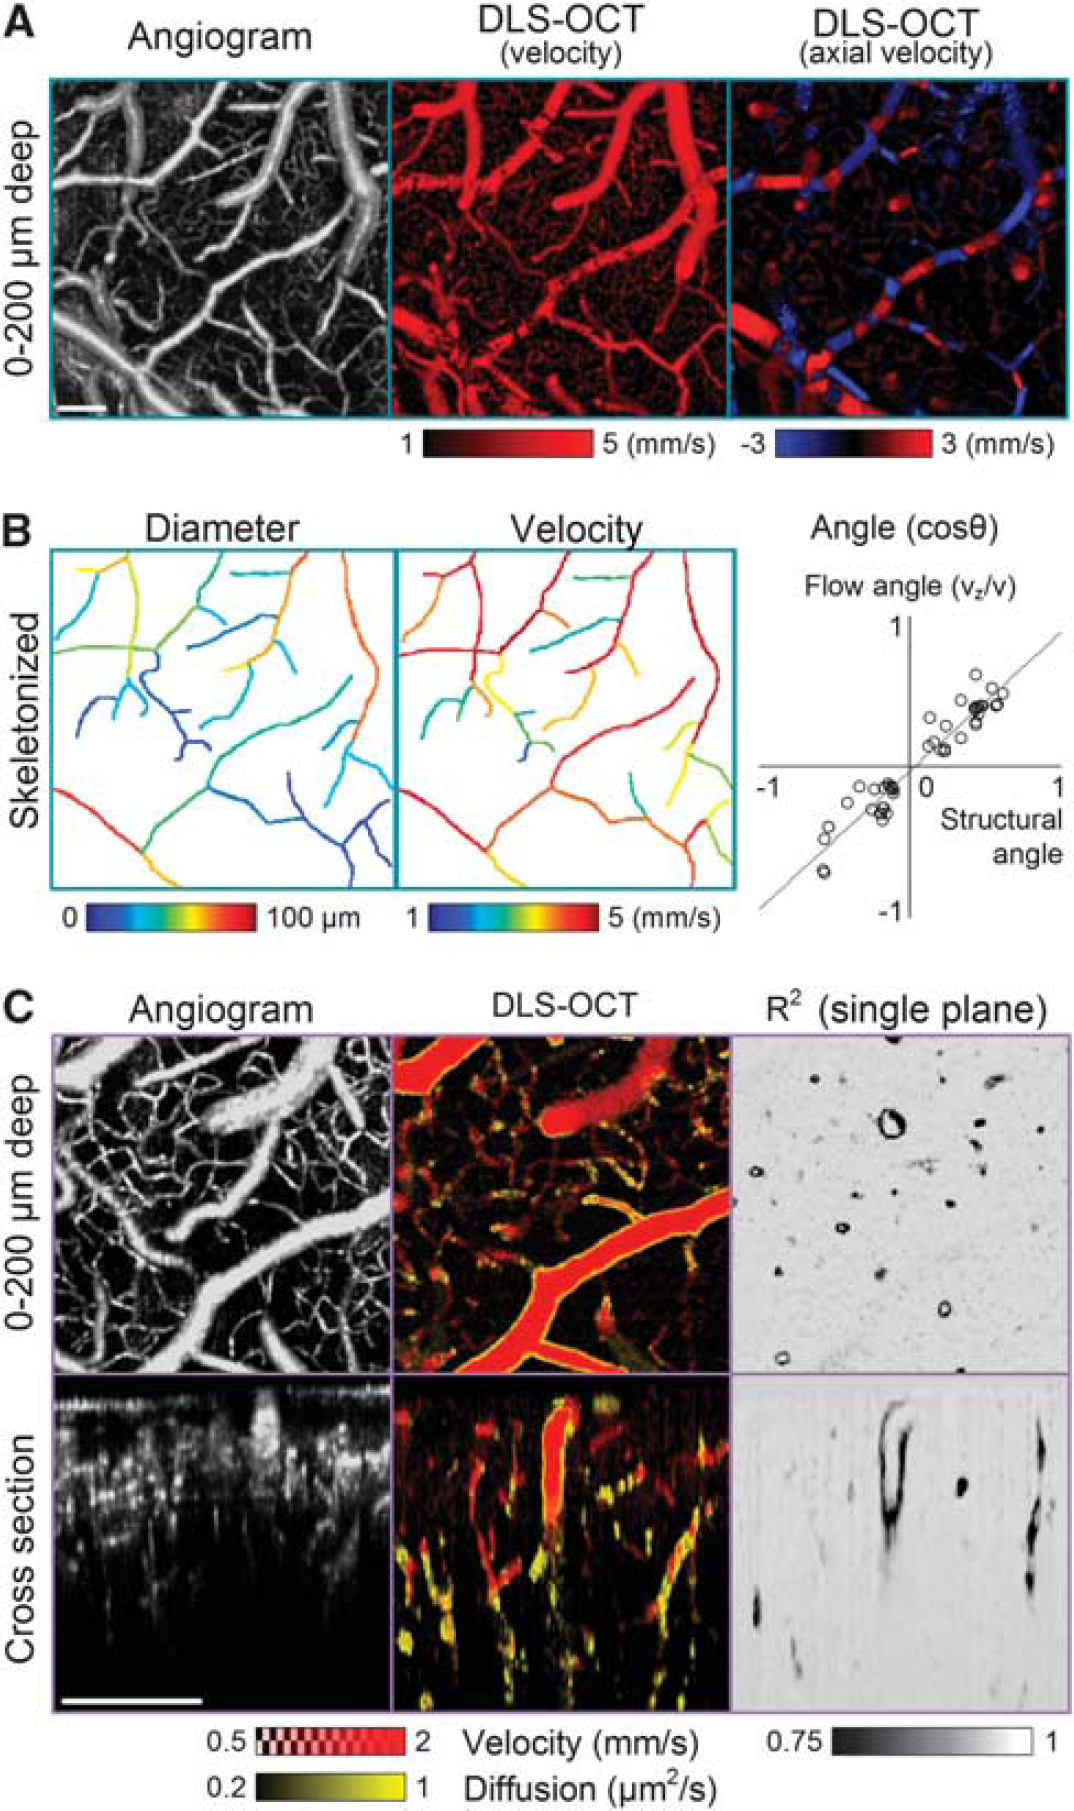
Dynamic light scattering–optical coherence tomography (DLS–OCT) imaging of the cerebral cortex. (
The diffusion map superimposed with the velocity map revealed the motion of vessel walls (Figure 3C). It is interesting that the vessel walls showed significantly lower
As our model depends on the size of the resolution volume (
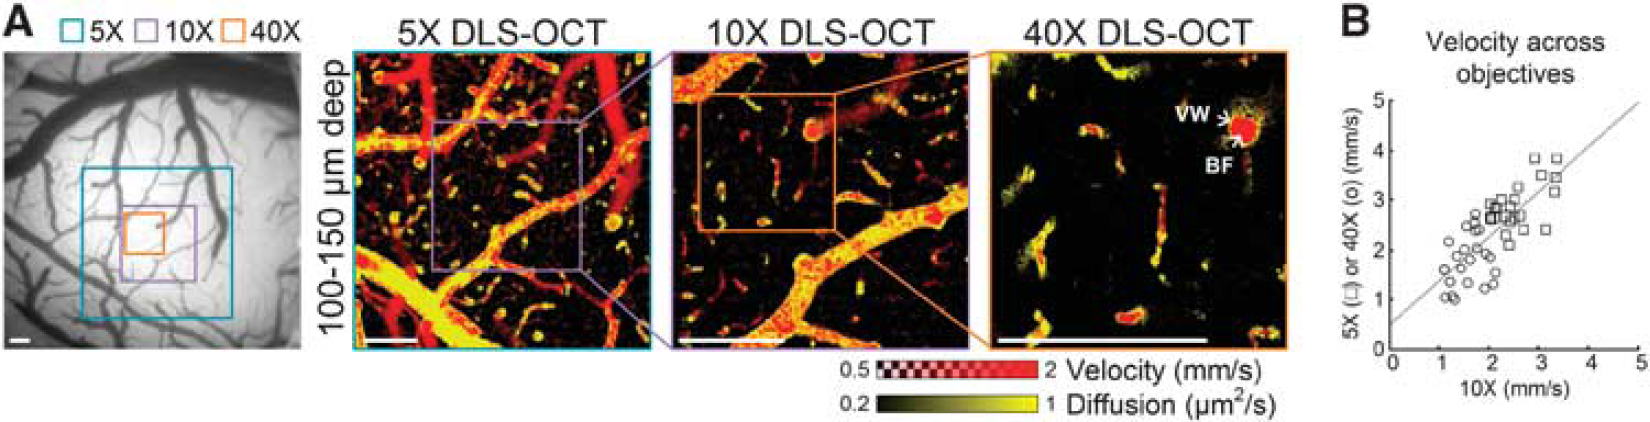
Dynamic light scattering–optical coherence tomography (DLS–OCT) imaging with different transverse resolution. (
Dynamic light scattering–optical coherence tomography imaging of intracellular motility
We performed × 40 DLS–OCT imaging of the cortex at several depths, as the × 40 objective resulted in a thin volume of measurement (<50 μm in depth; Figure 5). As can be seen in the cross-section images, DLS–OCT provided a thicker volume of measurement compared with the intensity map. This advantage is attributed to the fact that the autocorrelation function in principle does not depend on the intensity of the signal, provided a sufficient signal-to-noise ratio. The high transverse resolution of the × 40 objective enabled us to identify neuronal cell bodies in the minimum intensity projection (Figure 5, MinIP). This OCT imaging of neuronal cell bodies, not astrocytes, has been shown in our previous publication with the identical imaging system.
20
The distribution of the nuclei over the depth agreed with the well-known laminar distribution of neurons in the rodent cerebral cortex. Interestingly, the diffusion map revealed high-diffusion spots in the nonvascular area, and their positions were correlated with those of the nuclei. These spots were morphologically confined when viewed in the 3D map, whereas the high diffusion observed at vessel walls extended over a vascular segment. Furthermore, the high-diffusion spots exhibited high
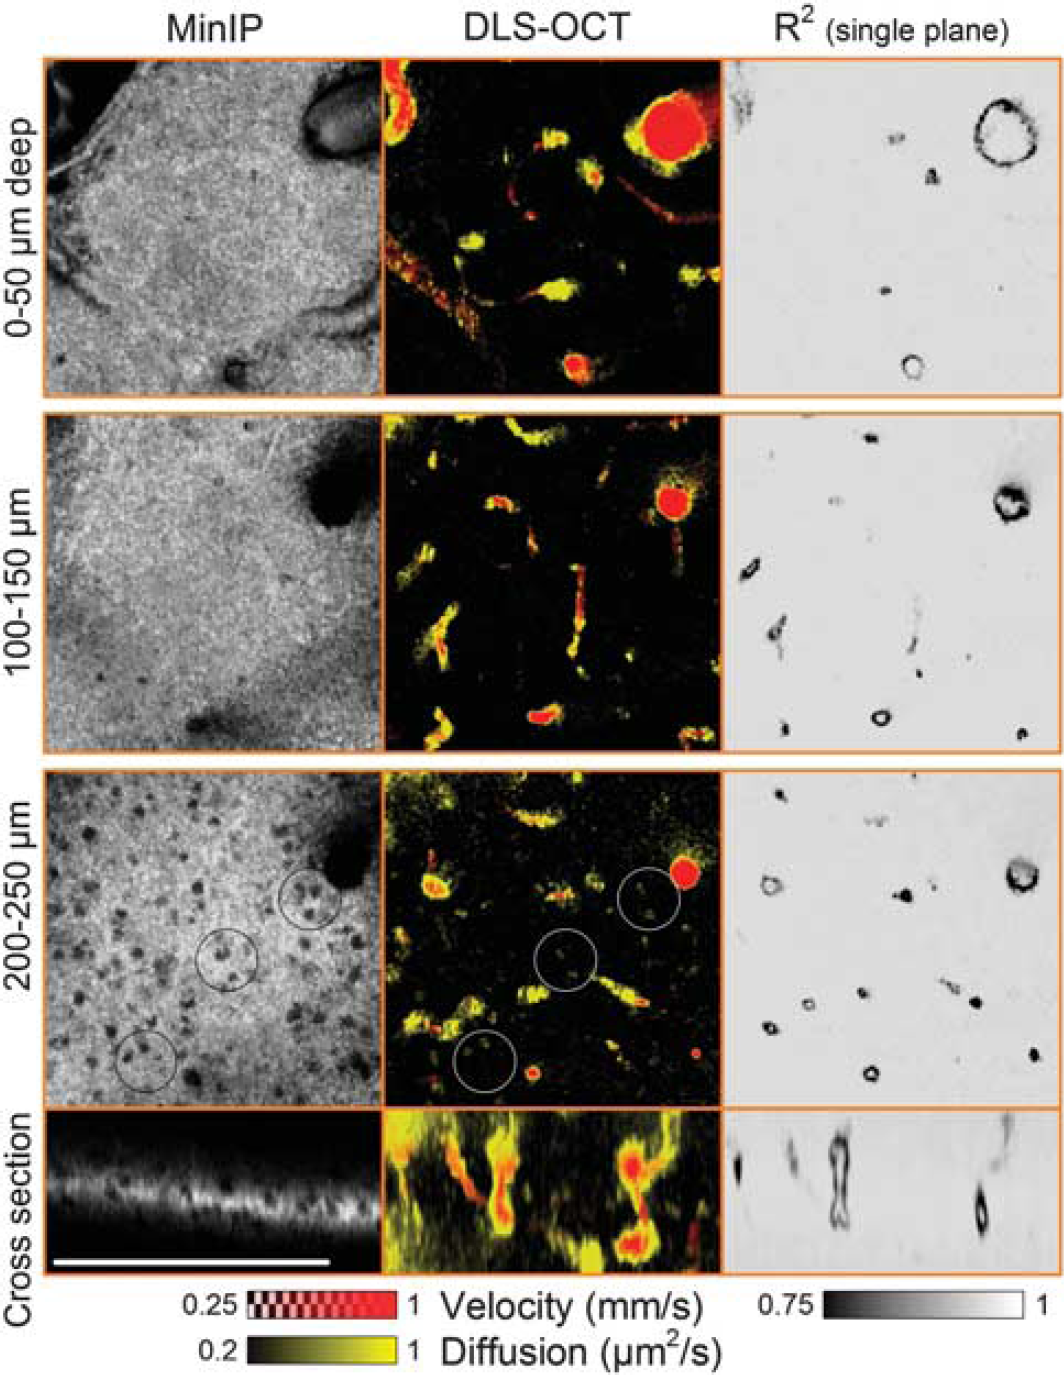
High-magnification dynamic light scattering–optical coherence tomography (DLS–OCT) imaging of the cerebral cortex. Minimum intensity projection (MinIP) maps and DLS–OCT maps (the absolute velocity superimposed with the diffusion coefficient, and the coefficient of determination
We repeatedly observed high-diffusion spots across animals (
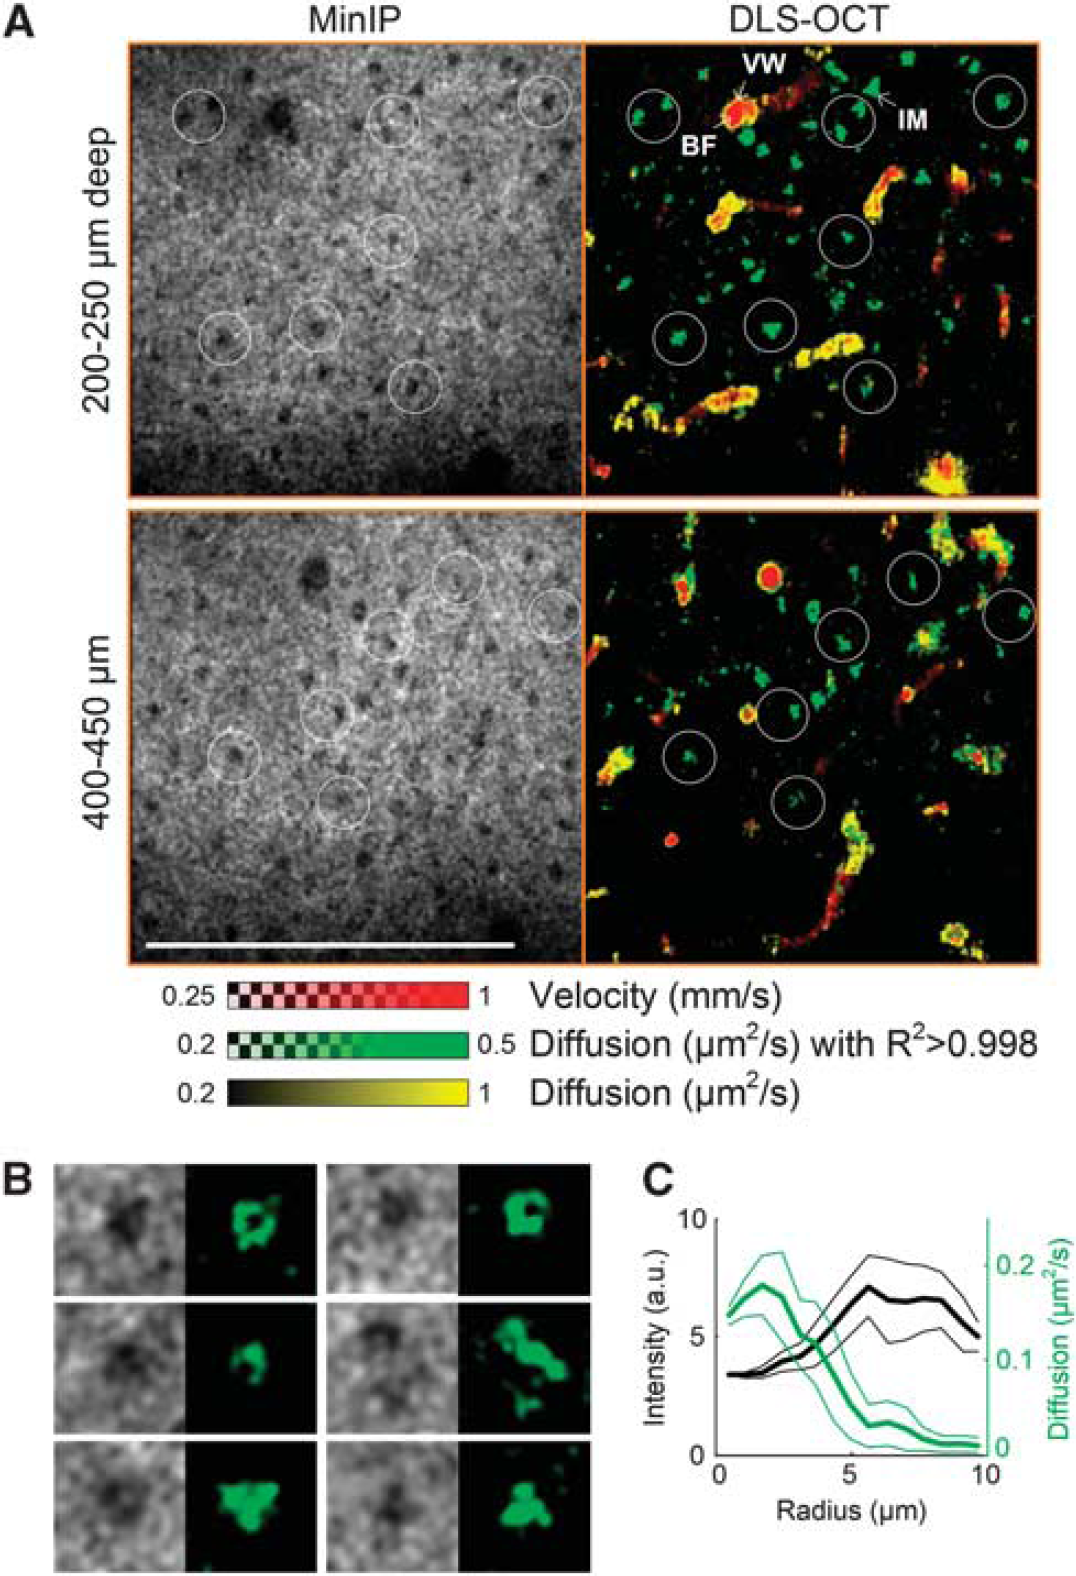
Dynamic light scattering–optical coherence tomography (DLS–OCT) imaging of neuronal intracellular motility. (
Preliminary Application to Ischemic Stroke Study
As an example application of DLS–OCT imaging of the cortex, we used it to investigate how CBF and IM vary before, during, and after ischemic stroke. We performed imaging through the thinned and reinforced skull in a MCAO model, 1 day before surgery, during MCAO, and 1 hour after reperfusion. The absolute velocity maps showed the effect of MCAO on the perfusion (Figure 7A). To quantify changes in CBF and IM caused by ischemia, we counted the number of voxels to obtain the volume fractions of blood flow and IM, for each depth (Figure 7B). Although IM of individual neurons were not seen as we used the × 10 objective for a thicker volume of measurement in this experiment, the depth profile of neuronal IM agreed with the tendency observed in high-magnification imaging.
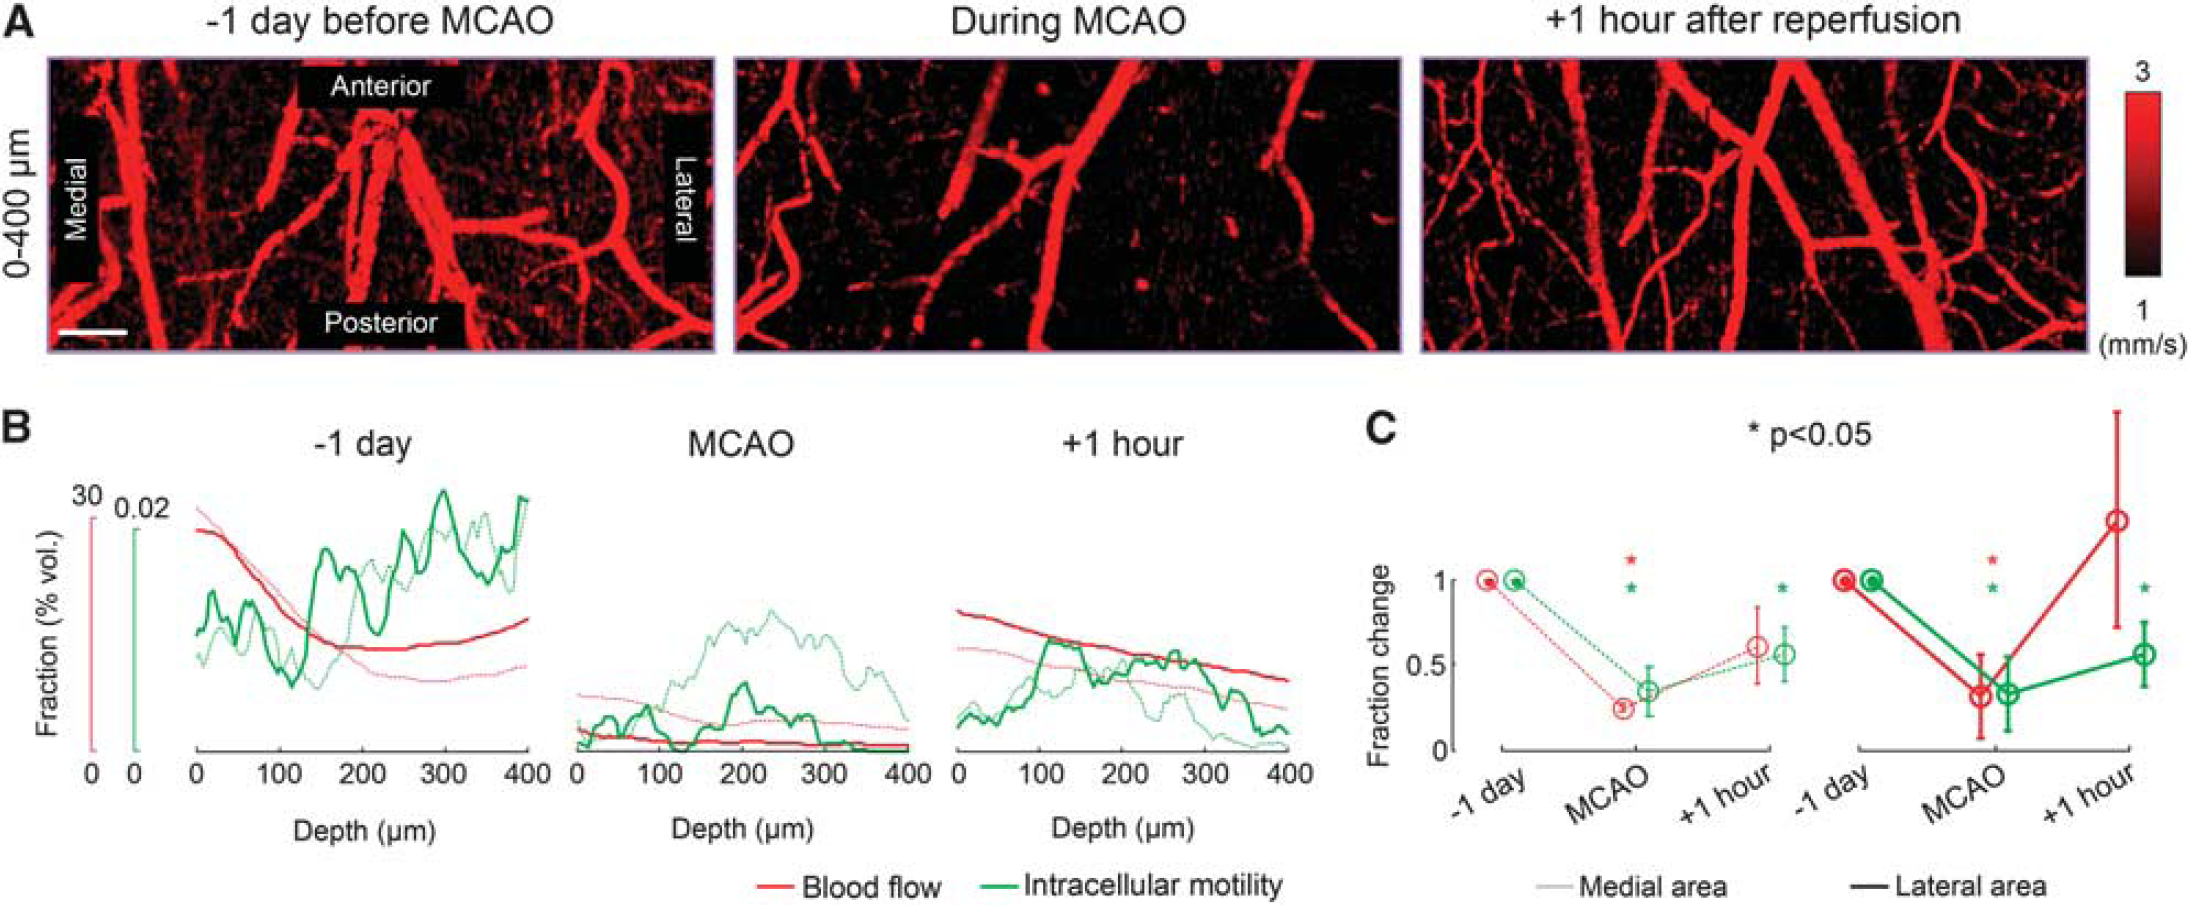
Dynamic light scattering–optical coherence tomography imaging of changes in cerebral blood flow and intracellular motility (IM) during ischemic stroke. (
As a result, the depth profile of each dynamic parameter clearly shows that MCAO caused significant reductions in CBF and, interestingly, in neuronal IM. The reduction was larger in the lateral area that is closer to the occluded middle cerebral artery. After 1 hour of reperfusion, we observed the recovery of CBF and IM (Figure 7B). This tendency was repeatedly observed across three animals. The average across animals revealed that, while CBF recovered to the baseline, neuronal IM was still statistically significantly lower than the pre-stroke baseline despite the 1 hour of reperfusion (Figure 7C).
DISCUSSION AND CONCLUSION
Label-free optical imaging of tissue dynamics generally provides high spatial resolution while being free of several limitations such as phototoxicity and pharmacological side effects; and the present method inherits these general advantages. In addition, DLS–OCT can determine whether the motion is diffusive or translational, enabling simultaneous imaging of CBF and IM. The results also offer the possibility of exploiting
One of the limitations of the present method is the low temporal resolution. Reliable estimation of the dynamic parameters from the autocorrelation function requires a sufficient number of consecutive scans for each position, causing a long imaging time. For example, one volumetric DLS–OCT imaging that consists of 400 × 400 × 100 A-scans (x × y × t) took more than 10 minutes using our system equipped with a 47-kHz spectrometer. This speed may be suitable for some studies like the stroke experiment shown in Figure 7, but may not be sufficient for other studies like functional imaging of CBF responses to somatosensory activation. The volume rate would be enhanced by using a faster OCT system (e.g., VCSEL-based swept-source OCT 24 ), a smaller field of view, and an optimal scanning strategy.
As biological systems generally have heterogeneous scattering centers, our measurement of flow and diffusion might be the ensemble averages of different movements of several types of particles within the resolution volume, as suggested in fluorescence correlation microscopy studies.
25
A large variety of scatterers, in terms of size and shape, can be found in biological systems: from single proteins to RBCs. According to Mie scattering theory (Supplementary Fig. S1), scatterers ranging in size from 0.1 to 10 μm are mainly responsible for the OCT signal in our system (1300-nm center wavelength). This range in the scatterer size encompasses intracellular organelles and RBCs. Thus, RBC flow rather than plasma flow is likely the major source of decorrelation of the OCT signal in vessels, and thereby the sharp low-
In Figure 3B, we skeletonized several vessels to estimate the mean vessel diameter (left) and flow velocity (center) averaged through their center lines. These measurements of the diameter and velocity offer the feasibility of flow quantification, even in horizontally lied vessels where conventional Doppler OCT is difficult to quantify the flow. However, more accurate quantification of flow will require an additional image processing for an area integral of the velocity map over the vessel's cross-section normal to its center line. As this paper focuses on distinctive measurement of velocity and diffusion, the additional image processing will be further developed and discussed in the future.
It is physiologically important to measure the blood flow velocity in the range of 0 to 1 mm/second, as many RBCs flow at this velocity range in capillaries of the brain cortex.26–28 Unfortunately, capillary structures were less clear in the DLS–OCT velocity map when compared with the conventional OCT angiogram (Figure 3C). This limitation is likely because of the short decorrelation time used in this paper (max. timelag = 0.5 ms) and/or the discrete nature of RBC flow in capillaries. Our experience in the OCT angiogram supports that time gaps larger than 3 ms generally result in a sufficiently large decorrelation of the OCT signal for clear capillary structure visualization (4 ms was used in Figure 3). This means that the DLS–OCT decorrelation time (0.5 ms) may not be sufficient for quantifying slow RBC flow in capillaries. Furthermore, RBCs typically flow one by one in capillaries. This discrete nature likely led to further reduction in the measured velocity with spatial convolution. Finally, the dynamic range of velocity measurement depends on the size of the probing volume as well, and thus a smaller probing volume will be more advantageous in quantifying lower flow velocities (note that the lower velocity range was effective to reveal capillary flow in Figure 6, where the × 40 objective was used). These limitations could be overcome by using a longer acquisition/correlation time of DLS–OCT imaging and/or a smaller probing volume, but has yet to be validated. As this paper focuses on distinctive imaging of flow and diffusion in the brain cortex, quantitative DLS–OCT measurement of capillary blood flow velocity will be further investigated in the future.
The map of high-
Some movements of macromolecules (<20 nm in diameter) in the cytoplasm can result in an effective diffusion coefficient on the order of 1 μm2/second.
21
However, such small macromolecules would not significantly contribute to the OCT signal as discussed above (Supplementary Fig. S1). On the other hand, it is known that intracellular organelles larger than 0.1 μm would not exhibit free diffusion as they exceed the mesh size of cytomatrix (e.g., the pores of microtrabecular lattice);
21
and thus they consume cellular energy to support their motion. Further, this motion can be described by an effective diffusion coefficient similar to our result.4,7 Therefore, the active motion of intracellular organelles may dominantly contribute to the measured neuronal IM and its decrease during ischemic stroke. Cellular nuclei also exhibit motions, a part of which can result in an effective diffusion coefficient on the order of 1 μm2/second.
29
This motion of nuclei might also contribute to the measured IM but not solely as discussed in Figure 6C. Meanwhile, anomalous diffusions have been observed in
Using the present method, we found that both CBF and IM reduced during a brief ischemic stroke, and CBF recovered by the 1 hour of reperfusion but IM did not (Figure 7C). This result suggests that neuronal IM did not recover as quickly as CBF during reperfusion, probably because of a slow recovery of metabolism and/or persistent cell damage. It seems obvious that the decrease in CBF corresponds to those observed in laser Doppler flowmetry, positron emission tomography, and perfusion-weighted magnetic resonance imaging studies of stroke.13,32–36 The persistent reduction in neuronal IM might be related with decreases in the cerebral metabolic rate for oxygen and glucose measured by positron emission tomography in stroke patients.33–35 Also, the reduced IM is of immediate relevance in quantifying the nature of changes in cellular dynamics revealed by diffusion-weighted magnetic resonance imaging in human studies of stroke.36–39 For instance, our observation of a decrease in IM of organelles is closely related to the decrease in diffusion of metabolites during and immediately after ischemic stroke, as observed by diffusion-weighted magnetic resonance imaging.40–41 More detailed analysis of neuronal IM variation with ischemic stroke and its relation to tissue infarction using cellular-resolution DLS–OCT imaging will be the subject of subsequent studies.
In conclusion, this paper describes a DLS–OCT-based method that enables label-free
DISCLOSURE/CONFLICT OF INTEREST
The authors declare no conflict of interest.