
Abstract
In neurodegenerative diseases including Alzheimer's disease and frontotemporal dementia, the protein tau is hyperphosphorylated and eventually aggregates to develop neurofibrillary tangles. Here, the consequences of tau hyperphosphorylation on both neuronal and astrocytic metabolism and amino-acid neurotransmitter homeostasis were assessed in transgenic mice expressing the pathogenic mutation P301L in the human tau gene (pR5 mice) compared with nontransgenic littermate controls. Mice were injected with the neuronal and astrocytic substrate [1-13C]glucose and the astrocytic substrate [1,2-13C]acetate. Hippocampus and cerebral cortex extracts were analyzed using 1H and 13C nuclear magnetic resonance spectroscopy, gas chromatography–mass spectrometry and high-performance liquid chromatography. The glutamate level was reduced in the hippocampus of pR5 mice, accompanied by reduced incorporation of 13C label derived from [1-13C]glucose in glutamate. In the cerebral cortex, glucose utilization as well as turnover of glutamate, glutamine, and GABA, were increased. This was accompanied by a relative increase in production of glutamate via the pyruvate carboxylation pathway in cortex. Overall, we revealed that astrocytes as well as glutamatergic and GABAergic neurons in the cortex of pR5 mice were in a hypermetabolic state, whereas in the hippocampus, where expression levels of mutant human tau are the highest, glutamate homeostasis was impaired.
INTRODUCTION
In the normal adult brain, the microtubule-associated protein tau is mainly localized to axons, where it has a role in the assembly and stabilization of microtubules. Tau is also the principal component of the intracellular neurofibrillary pathology that occurs in Alzheimer's disease (AD) and in tauopathies such as frontotemporal dementia (FTD) with Parkinsonism linked to chromosome 17 (FTDP-17).1,2 In these conditions, tau is hyperphosphorylated. This compromises its ability to bind to microtubules 3 which may lead to microtubule destabilization and impairment of vital cellular processes such as axonal transport.4,5 Tau is subsequently translocated to the somatodendritic compartment where it, with time, accumulates into filamentous aggregates and assembles into neurofibrillary tangles (NFTs).4,6 The discovery of a range of mutations in the tau gene (microtubule-associated protein tau; MAPT) in FTDP-17 in humans has firmly established that tau dysfunction can lead to neurodegeneration and dementia,7–10 although mutations in the tau gene have not been identified in AD.
A range of studies indicate that tau pathology is accompanied by metabolic alterations in the brain. In FTD, cerebral glucose metabolism is predominantly decreased in frontal and temporal regions and also in subcortical structures.11–14 In AD, glucose hypometabolism is severe in the parieto-temporal, posterior cingulate and frontal cortices and the medial temporal lobes.
15
High levels of phosphorylated tau in cerebrospinal fluid have been associated with hypometabolism of glucose in patients with mild cognitive impairment (MCI),
16
and alterations in metabolite levels preceding symptoms have been demonstrated with
The current study was conducted to assess the effect of hyperphosphorylated tau on brain energy metabolism and amino-acid neurotransmitter homeostasis, using transgenic mice that express the FTDP-17 mutation P301L in the human tau gene. These pR5 mice accumulate hyperphosphorylated tau and eventually develop NFTs.19,20 To specifically and simultaneously probe neuronal and astrocytic metabolism, transgenic pR5 mice and wild-type littermate controls were injected with a combination of [1- 13 C]glucose and [1,2- 13 C]acetate. Glucose is taken up by both neurons and astrocytes, but most of the acetyl Coenzyme A (acetyl CoA) derived from glucose is metabolized in neurons.21,22 In contrast, acetate is metabolized in astrocytes but not neurons. 23 Thus, by simultaneous administration of 13 C-labeled glucose and acetate, neuronal and astrocytic metabolism can be studied in the same animal. 24 This was followed by 1 H and 13 C nuclear magnetic resonance spectroscopy (NMRS), high-performance liquid chromatography (HPLC) and gas chromatography–mass spectrometry (GC–MS) measurements of tissue extracts of cerebral cortex and hippocampus, allowing detailed mapping of the activity of metabolic pathways by analysis of the concentrations and 13 C labeling of metabolites.
MATERIALS AND METHODS
MATERIALS
[1- 13 C]Glucose and [1,2- 13 C]acetate were purchased from Cambridge Isotope Laboratories (Andover, MA, USA), D2O (99.9%) from CDN Isotopes (Pointe-Claire, Quebec, Canada), ethylene glycol from Merck (Darmstadt, Germany) and 2,2-Dimethyl-2-silapentane-5-sulfonate sodium salt (DSS sodium salt) from Sigma-Aldrich (St Louis, MO, USA). All other chemicals were of the purest grade available from local commercial suppliers.
Transgenic Mice
The P301L model (pR5 line) was used, in which mice express the human FTDP-17-causing P301L mutation in the longest human tau isoform; human tau40 with four microtubule-binding repeats, under control of the neuron-specific murine Thy1.2 promoter. 19 Three months old mice were chosen for the present study since this age is a pretangle stage 20 in which the consequences of tau hyperphosphorylation can be investigated in the absence of NFTs. Experiments were approved by the UNSW Animal Care and Ethics Committee (ACEC) and animals were treated in compliance with the European Convention (ETS 123 of 1986).
Intraperitoneal Injections and Tissue Extraction
Ten P301L expressing mice (pR5 tg/wt, three females and seven males) and nine control wild-type (pR5 wt/wt, two females and seven males) littermates which did not differ significantly in weight (controls 24.4 ± 1.6 g, pR5 25.7 ± 1.6 g,
Samples were homogenized in 1 mL perchloric acid (0.7%) using a Vibra Cell sonicator (Model VCX 750, Sonics & Materials, Newtown, CT, USA), and α-ABA was added as an internal standard for HPLC analysis. Homogenized tissue samples were centrifuged at 3,000
To assess the effect of hyperphosphorylated tau on brain energy metabolism and amino-acid neurotransmitter homeostasis, concentrations of metabolites and incorporation of 13 C label into metabolites in cortical extracts obtained from P301L tau transgenic pR5 mice and wild-type littermate controls were analyzed using 1 H and 13 C NMRS. Due to the small size of the hippocampus in mice, the concentrations of metabolites in hippocampus were quantified using HPLC and the distribution of 13 C-labeled mass isotopomers was assessed using GC–MS.
1 H and 13 C Nuclear Magnetic Resonance Spectroscopy
Lyophilized samples were dissolved in 120 μl D2O containing 0.091 g/L DSS and 0.1% ethylene glycol as internal standards for quantification, and pH was readjusted to 6.5–7.5 with KOH. The supernatants were transferred to SampleJet tubes (3.0 × 103.5 mm2) for insertion into the SampleJet autosampler (Bruker BioSpin GmbH, Rheinstetten, Germany). All samples were analyzed using a QCI CryoProbe 600 MHz ultrashielded Plus magnet (Bruker BioSpin GmbH). 1 H NMR spectra were acquired with the following parameters: pulse angle of 90°, acquisition time of 2.66 seconds and a relaxation delay of 10 seconds. The number of scans was 256. Proton decoupled 13 C NMR spectra were acquired with the following parameters: pulse angle of 30°, acquisition time of 1.65 seconds and a relaxation delay of 0.5 seconds, 30 kHz spectral width with 98 K data points. The number of scans was between 20,000 to 40,000, adjusted to the weight of the sample to achieve an appropriate signal to noise ratio. All spectra were recorded at 20 °C.
Relevant peaks in the spectra were identified and integrated using TopSpin 3.0 software (Bruker BioSpin GmbH). The amounts were quantified from the integrals of the peak areas using DSS and ethylene glycol as internal standards for the 1 H and 13 C spectra, respectively. The amounts obtained from the 1 H spectra were corrected for the number of protons constituting the peak and for 13 C content. 13 C-labeled metabolites were corrected for nuclear Overhauser and relaxation effects, and singlets in the 13 C spectra were corrected for 1.1% natural abundance of 13 C calculated from 1 H spectra. All amounts were corrected for tissue weight.
High-Performance Liquid Chromatography
HPLC (1100 series; Agilent Technologies, Santa Clara, CA, USA) with fluorescence detection was used to quantify amino-acid concentrations in the hippocampus. Amino acids were precolumn derivatized with o-phthaldialdehyde, and components were separated on a Zorbax SBC18 column (4.6 × 150 mm2, 3.5-micron; Agilent Technologies). A gradient of two eluents (one of phosphate buffer (50 mM, pH 5.9) and THF (2.5%), and the other of methanol (98.75%) and THF (1.25%)) was used to achieve optimal separation and faster elution of the nonpolar analytes. Quantification was performed using a-ABA as an internal standard. All concentrations were corrected for tissue weight.
Gas Chromatography–Mass Spectrometry
The percentage
13
C enrichment of metabolites in hippocampus was determined using GC–MS. Aliquots of the samples were dissolved and adjusted to pH <2 using HCl, followed by lyophilization. Amino acids and organic acids were extracted into an organic phase of ethanol and benzene, dried under air and redissolved in
Interpretation of 13 C Labeling Patterns
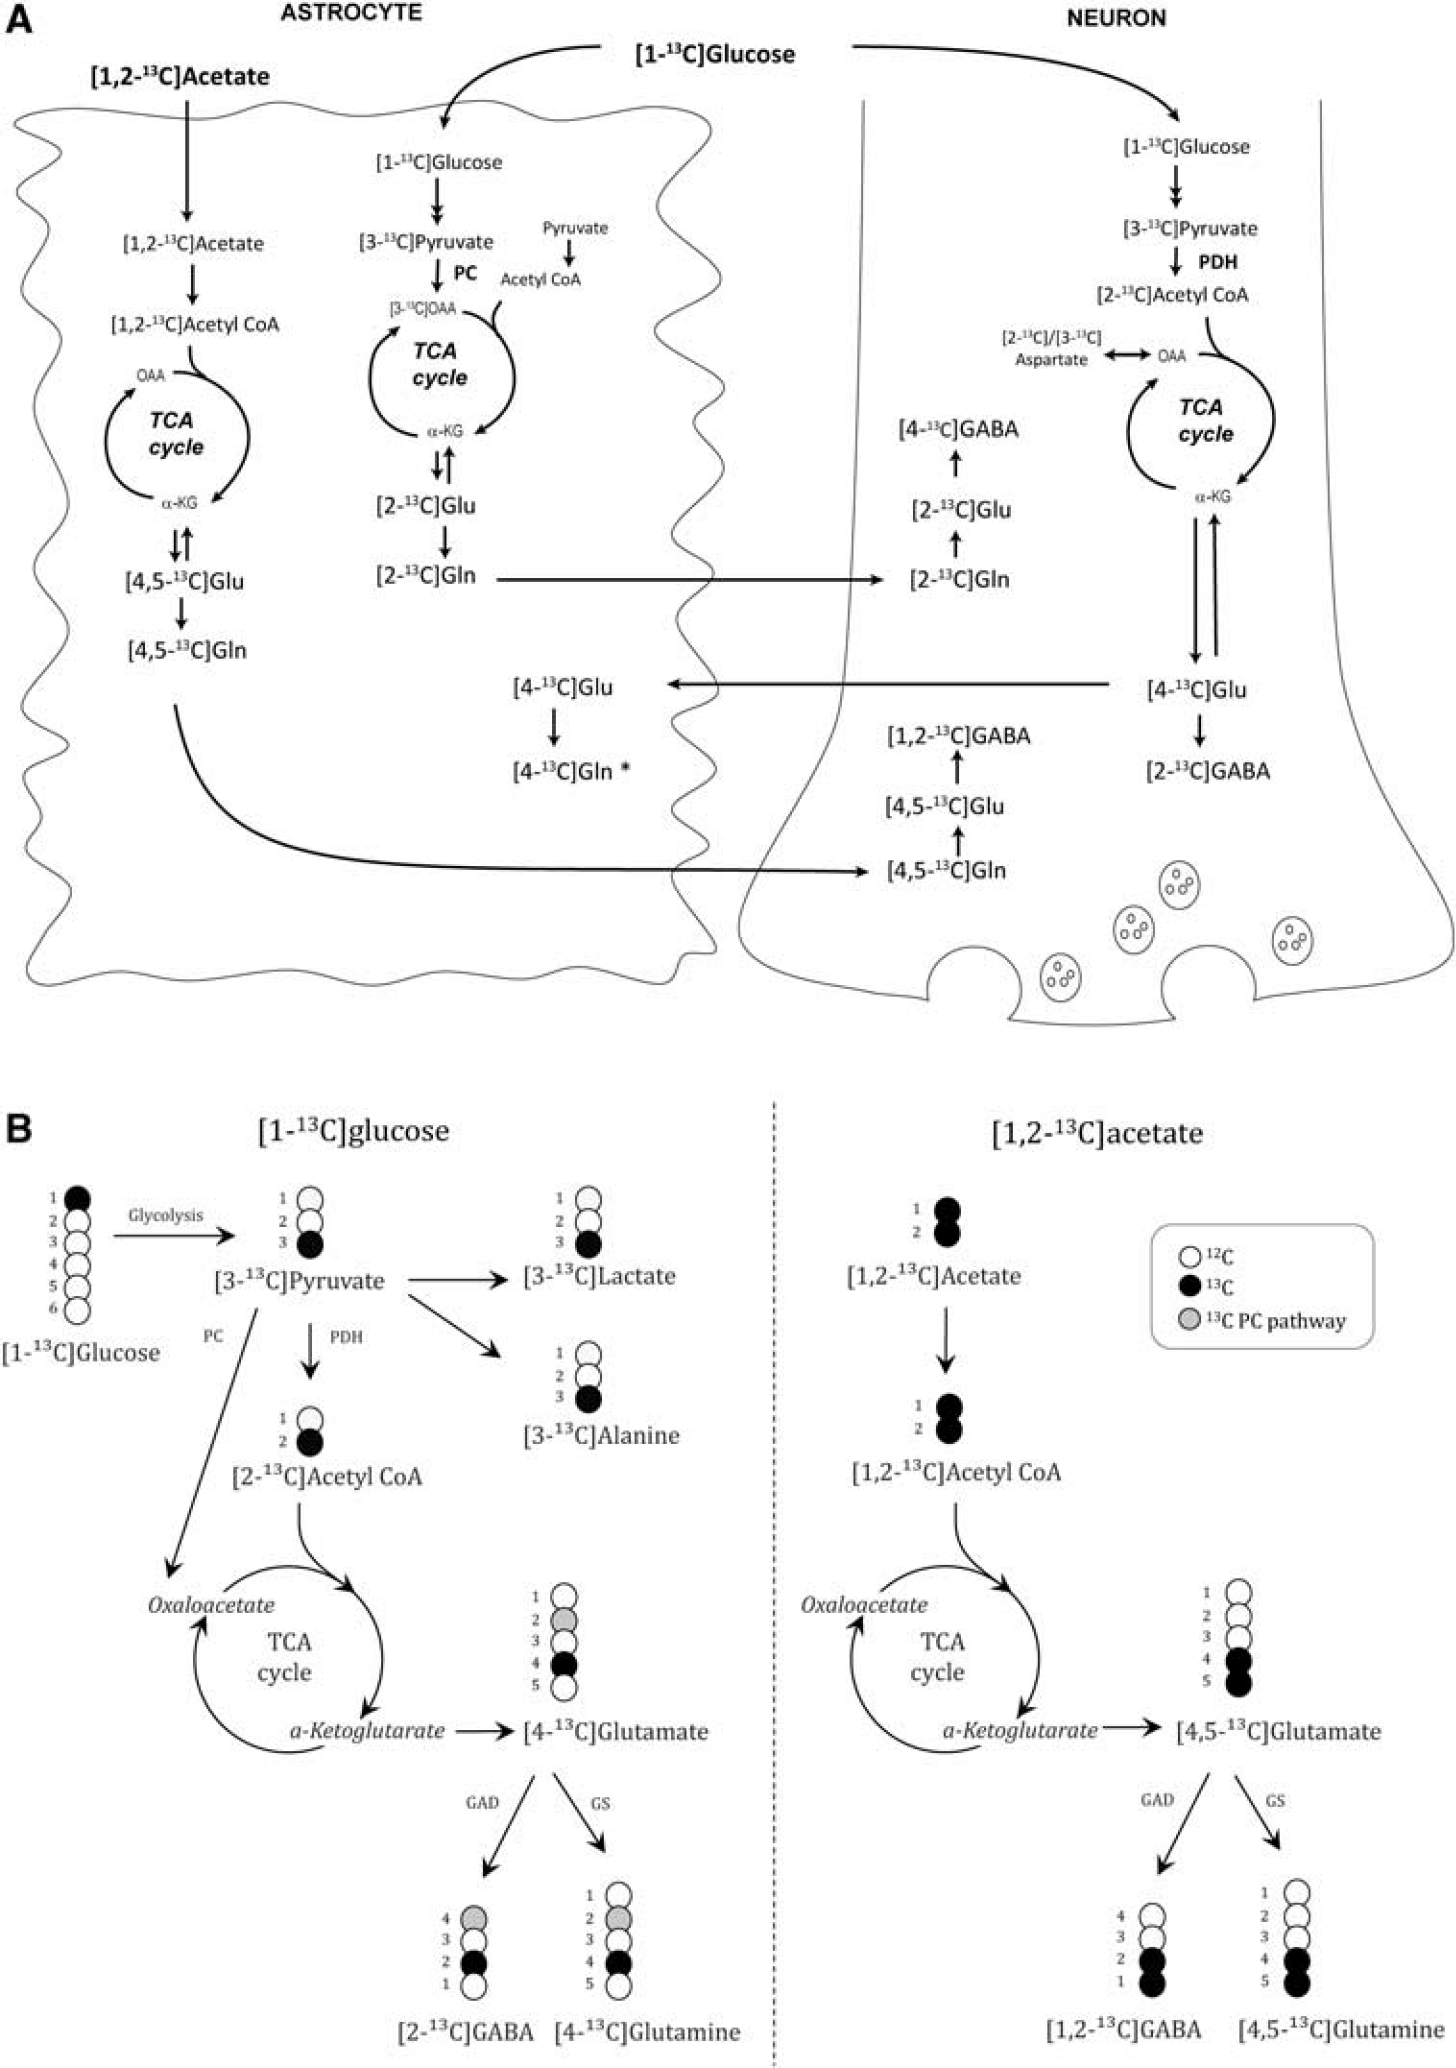
The interpretation of 13 C labeling patterns from 13 C NMRS or GC–MS analyses is based on detailed knowledge of the metabolic fate of the 13 C-labeled compounds in neurons and astrocytes (Figure 1). A simplified view is that label from [1- 13 C]glucose gives rise to single-labeled metabolites, whereas double-labeled metabolites are mostly derived from [1,2- 13 C]acetate and thus astrocytic metabolism. 25
(
[1- 13 C]Glucose is via glycolysis converted to [3- 13 C]pyruvate, which can be reduced to [3- 13 C]lactate, transaminated to [3- 13 C]alanine, carboxylated to oxaloacetate (OAA) in astrocytes, or decarboxylated to [2- 13 C]acetyl CoA and subsequently enter the tricarboxylic acid (TCA) cycle. After several steps, [4- 13 C]α-ketoglutarate (α-KG) is formed and is a precursor for [4- 13 C]glutamate, which can subsequently be converted to [2- 13 C]GABA in GABAergic neurons via the enzyme glutamic acid decarboxylase or to [4- 13 C]glutamine in astrocytes via the astrocyte-specific enzyme glutamine synthetase. When [4- 13 C]glutamate is released from glutamatergic neurons during neurotransmission, astrocytes terminate the signal by removing [4- 13 C]glutamate from the synaptic cleft via transporters, followed by conversion to [4- 13 C]glutamine or to [4- 13 C]α-KG. Via the TCA cycle, [4- 13 C]α-KG also gives rise to [2- 13 C]-/[3- 13 C]OAA, which can be transaminated to [2- 13 C]-/[3- 13 C]aspartate. From the second turn of the TCA cycle, [2- 13 C]-/[3- 13 C]glutamate and glutamine and [4- 13 C]-/[3- 13 C]GABA can be formed after several steps if OAA labeled from the first turn of the cycle condenses with unlabeled acetyl CoA. [2- 13 C]glutamate is also formed as a result of pyruvate carboxylation in astrocytes. It should be noted that if OAA labeled from the first turn of the TCA cycle condenses with labeled acetyl CoA, double-labeled isotopomers of glutamate and GABA can be formed from neuronal metabolism as well.
[1,2- 13 C]Acetate is converted to [1,2- 13 C]acetyl CoA in astrocytes. Following entry into the TCA cycle, [4,5- 13 C]α-KG is formed after several steps, and is the precursor for [4,5- 13 C]glutamate and [4,5- 13 C]glutamine. After transfer of [4,5- 13 C]glutamine to the neuronal compartment it is reconverted to [4,5- 13 C]glutamate in glutamatergic neurons, which can be converted to [1,2- 13 C]GABA in GABAergic neurons. If [4,5- 13 C]α-KG is metabolized in the TCA cycle, it may give rise to formation of [3- 13 C]-/[1,2- 13 C]glutamate and glutamine and [3- 13 C]-/[4- 13 C]GABA from the second turn of the cycle if labeled OAA condenses with unlabeled acetyl CoA.
Using mass spectrometry, the percentage of the metabolite with one (M + 1) or several (M + x) 13 C atoms is detected, but the exact positions of the 13 C atoms in the molecule are not revealed. Thus, GC–MS results represent the sum of all different positional isotopomers of a metabolite with the same number of labeled carbon atoms. The majority of M + 1 glutamate consists of [4- 13 C]glutamate, that of M + 1 glutamine is [4- 13 C]glutamine, that of M + 1 GABA is [2- 13 C]GABA, that of M + 1 aspartate is [2- 13 C]- and [3- 13 C]aspartate, whereas that of M + 1 lactate is [3- 13 C]lactate. The majority of M + 2 glutamate is [4,5- 13 C]glutamate, that of M + 2 glutamine is [4,5- 13 C]glutamine, whereas that of M + 2 GABA is [1,2- 13 C]GABA. M + 2 metabolites thus primarily represent metabolites derived from astrocytic metabolism.
Pyruvate can be converted by pyruvate dehydrogenase (PDH) to acetyl CoA or by pyruvate carboxylase (PC) to OAA, and this will give rise to differently
13
C-labeled glutamate, glutamine and GABA. The contribution of the anaplerotic (PC) versus the oxidative pathway (PDH) to formation of glutamate, glutamine and GABA can thus be calculated from the ratios of these isotopomers.
24
In astrocytes, [3-
13
C]pyruvate formed from [1-
13
C]glucose can give rise to [3-
13
C]OAA via the astrocyte-specific enzyme PC. This may subsequently give rise to formation of [2-
13
C]glutamate and [2-
13
C]glutamine. The latter can be transported to neurons and be reconverted to [2-
13
C]glutamate and subsequently to [4-
13
C]GABA in GABAergic neurons. However, [2-
13
C]glutamate or glutamine can also be formed from the second turn of the TCA cycle in equal amounts as [3-
13
C]glutamate or glutamine due to scrambling of the
13
C label in the symmetrical succinate/fumarate steps. [3-
13
C]Glutamate or glutamine can also be derived from the second turn of the TCA cycle during [1,2-
13
C]acetate metabolism, in equal amounts as [1,2-
13
C]glutamate or glutamine. Therefore, [2-
13
C]glutamate or glutamine in excess of [3-
13
C]glutamate or glutamine corrected for the contribution labeled from acetate arises from PC activity. The ratio for glutamate and glutamine is calculated as follows: ([2-
13
C]–([3-
13
C]–[1,2-
13
C]))/[4-
13
C]. We also calculated the ratios for cycling and acetate/glucose utilization as described by Kondziella
Data and Statistical Analysis
Due to experimental errors, the numbers of samples for each group varied. One cerebral cortex sample from a control mouse was lost during the experiment, and one pR5 mouse was not injected properly and was discarded from all data sets. In addition, it was not possible to obtain adequate 13 C NMRS or GC–MS spectra of one pR5 cerebral cortex sample and one control cerebral cortex and hippocampus sample. These were not included in the 13 C-related data sets. Percentage enrichment of metabolites in cortex was calculated as the 13 C amount divided by the total concentration of the metabolite ( 12 C + 13 C) and expressed as a percentage. Mass isotopomers for cortex were calculated as the sum of all single- or double-labeled isotopomers of a metabolite detected with 13 C NMRS as a percentage of the concentration detected with 1 H NMRS. It should be noted that for both calculations, single-labeled metabolites were corrected for natural abundance of 13 C.
All results are presented as average ± s.e.m. Statistical differences between the control and pR5 group were assessed using the two-tailed Student's
RESULTS
Concentrations of Metabolites
We measured the concentrations of metabolites in cerebral cortex using
1
H NMRS and in hippocampus using HPLC. The use of different methods yielded slightly different sets of metabolites for the two brain areas. For the cerebral cortex these were: NADH, fumarate, myo-inositol, phosphocreatine, creatine, glycine, taurine, glycerophosphocholine, phosphocholine, choline, aspartate, glutamine, glutamate, GABA,
Metabolite concentrations in cerebral cortex and hippocampus
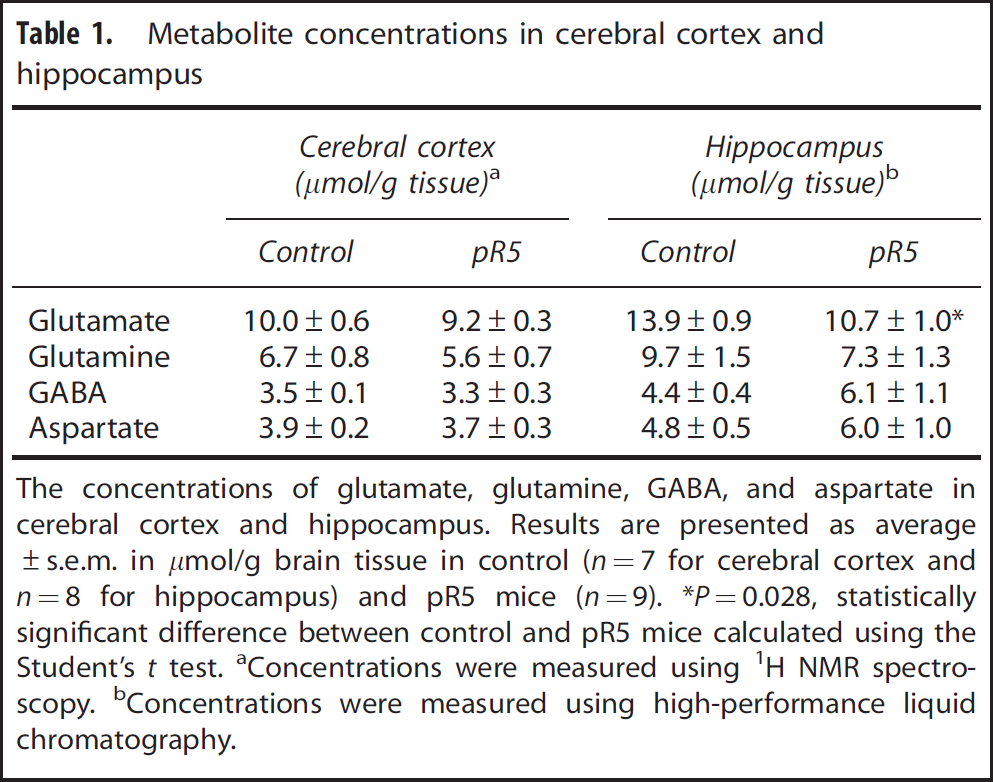
The concentrations of glutamate, glutamine, GABA, and aspartate in cerebral cortex and hippocampus. Results are presented as average±s.e.m. in
Concentrations were measured using 1H NMR spectroscopy.
Concentrations were measured using high-performance liquid chromatography.
[1- 13 C]Glucose and [1,2- 13 C]Acetate Metabolism in Cortex
The concentration of [1-
13
C]glucose was significantly decreased in the cortex of pR5 mice (46.3 ± 5.1 nmol/g in controls and 31.7 ± 4.1 nmol/g in pR5 mice,
The percentage 13C enrichment of metabolites in cerebral cortex
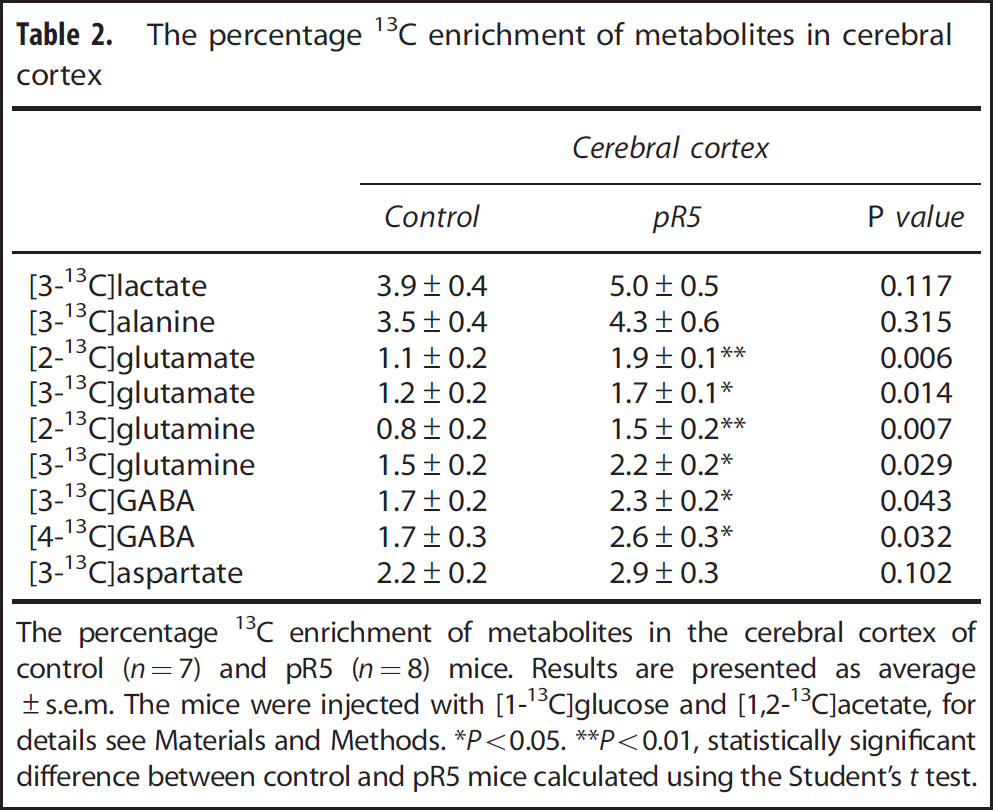
The percentage 13C enrichment of metabolites in the cerebral cortex of control (
The percentage 13C enrichment of metabolites in cerebral cortex and hippocampus
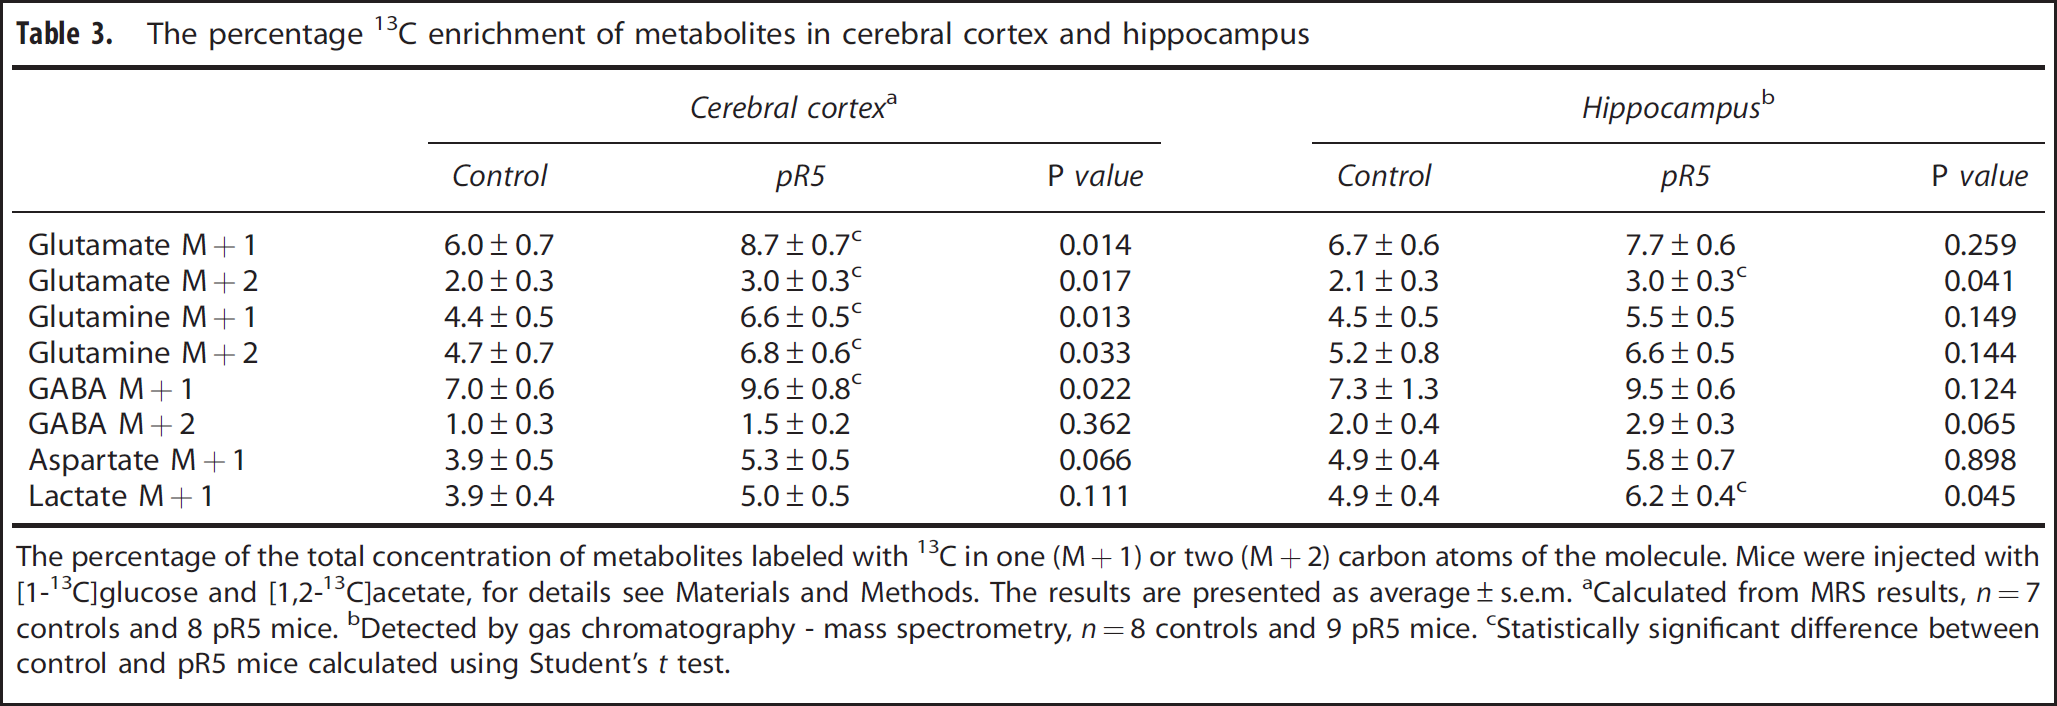
The percentage of the total concentration of metabolites labeled with 13C in one (M+1) or two (M+2) carbon atoms of the molecule.
Mice were injected with [1-13C]glucose and [1,2-13C]acetate, for details see Materials and Methods. The results are presented as average±s.e.m.
Calculated from MRS results,
Detected by gas chromatography - mass spectrometry,
Statistically significant difference between control and pR5 mice calculated using Student's
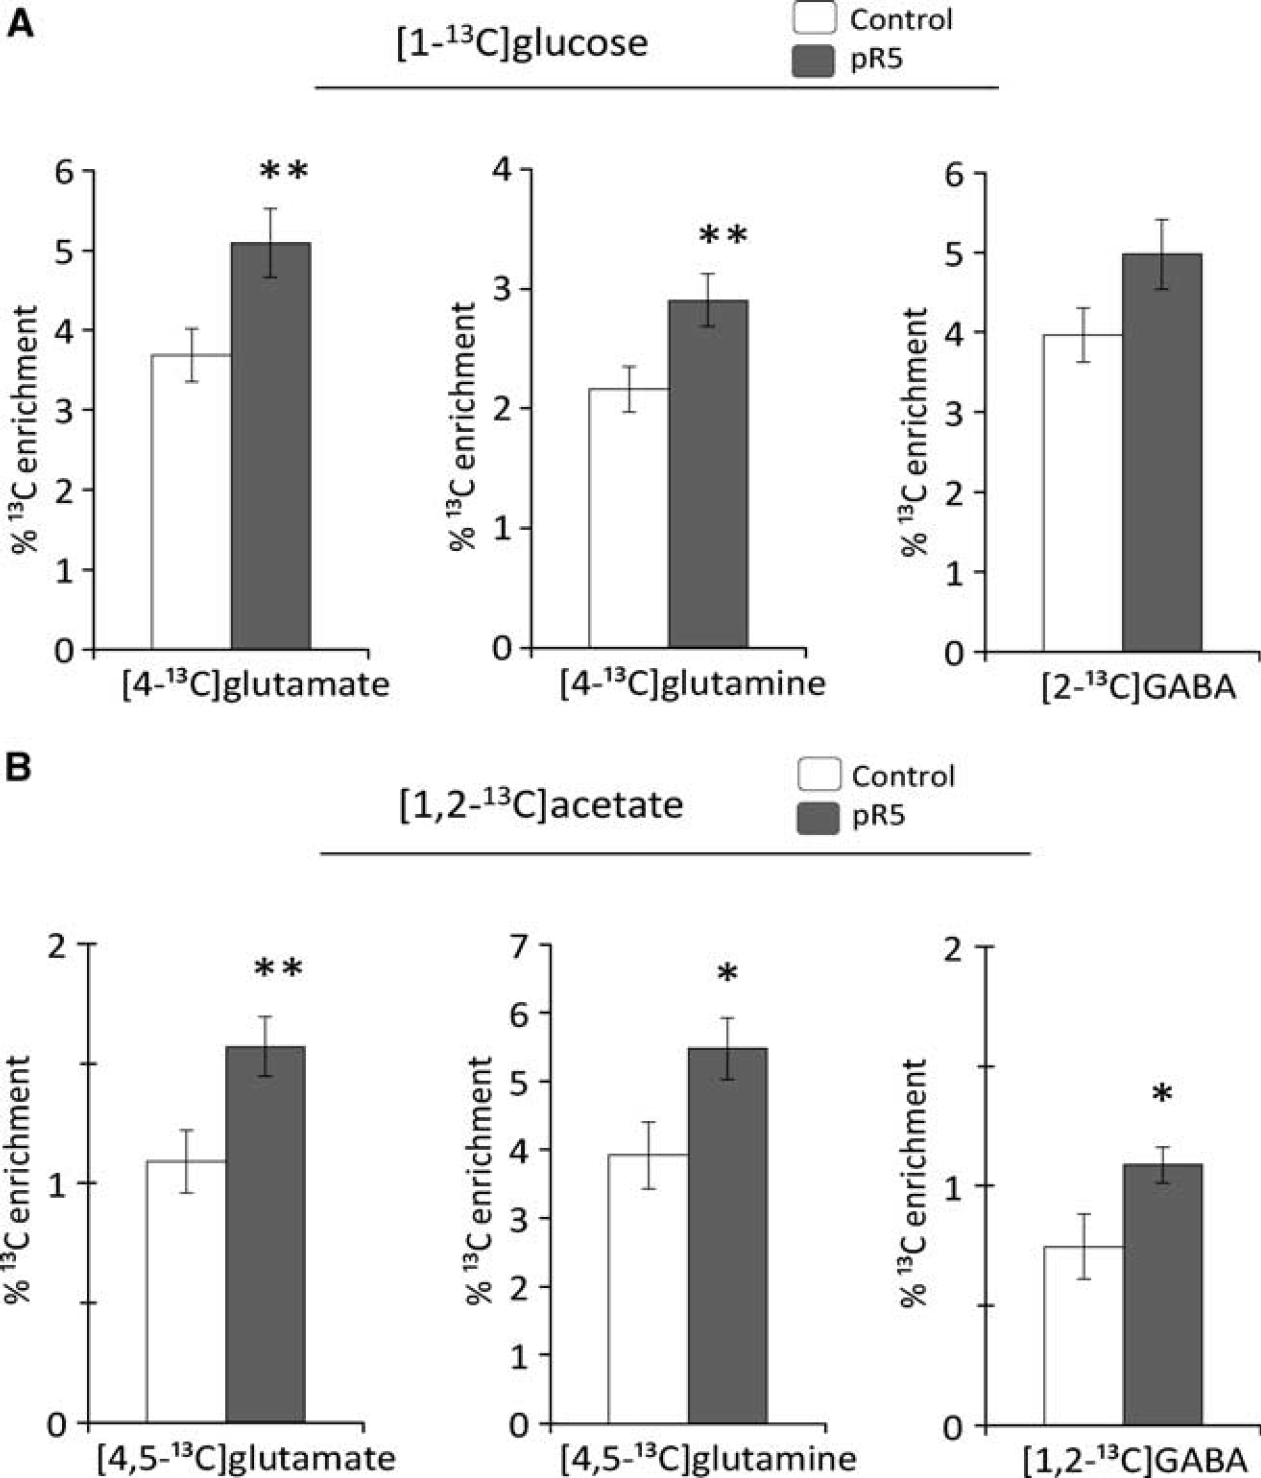
The amount of [4,5-
13
C]glutamate and glutamine, [4-
13
C]glutamate and glutamine, [1,2-
13
C]GABA and [2-
13
C]GABA as percentage of the glutamate, glutamine, and GABA content (percentage
13
C enrichment) in the cerebral cortex. These isotopomers are derived from metabolism of (
Reflecting astrocytic metabolism, the percentage enrichment of [4,5- 13 C]glutamate, [4,5- 13 C]glutamine and [1,2- 13 C]GABA were significantly increased in the cerebral cortex of pR5 mice compared with controls (Figure 2B). Calculation of M + 2 isotopomers from NMRS results demonstrated that the percentage enrichment of M + 2 glutamate and glutamine were increased, whereas that of M + 2 GABA remained unaltered (Table 3).
[1- 13 C]Glucose and [1,2- 13 C]Acetate Metabolism in Hippocampus The percentage enrichment of M + 1 glutamate, glutamine, GABA, and aspartate were unchanged in the hippocampus of pR5 mice compared with controls (Table 3). Unaltered M + 1 glutamate signifies that the amount of single-labeled 13 C glutamate was decreased proportionally to the total concentration of glutamate in the hippocampus.
The percentage enrichment of M + 2 glutamate was significantly increased in pR5 mice, but all other M + 2 metabolites remained unchanged (Table 3). In light of the decreased hippocampal glutamate level in pR5 mice, the increased M + 2 glutamate indicates that the amount of glutamate labeled from [1,2-
13
C]acetate metabolism and thus astrocytic metabolism was either unchanged or increased. To clarify this, we calculated the amount (nmol/g) of double-labeled glutamate in the hippocampus based on the glutamate content from HPLC and the percentage enrichment of M + 2 glutamate from GC–MS for each mouse. This calculation showed that there was no significant difference between the groups in the amount of double-labeled glutamate (controls 305 ± 43 nmol/g, pR5 302 ± 25 nmol/g,
It should be noted that the level of significance was not adjusted for multiple testing, thus all results should be interpreted with care.
DISCUSSION
A range of mutant tau-expressing animal models with NFTs and memory impairment are available. 27 At the age of 3 months, P301L expressing pR5 mice already display high levels of hyperphosphorylated human tau in both axonal and somatodendritic compartments of cortical and hippocampal neurons.19,20 Neuronal and astrocytic metabolism was assessed in the cortex and hippocampus, two areas with prominent tau pathology in pR5 mice, after i.p. injection of 13 C-labeled glucose and acetate. It has been established that although the serum glucose level increased after i.v. bolus injection of glucose, the concentration of glucose in the brain was not affected. 22 Thus, 13 C labeling in metabolites reported here reflects 13 C enrichment in brain and not blood glucose. In the present study, we found a decreased glutamate level in hippocampus whereas in cortex, glucose utilization and turnover of glutamate, glutamine, and GABA were increased.
Decreased Glutamate Level in Hippocampus
The substantial decrease in the glutamate concentration and the proportionally decreased amount of
13
C-labeled glutamate (unchanged percentage enrichment) from [1-
13
C]glucose metabolism demonstrate disrupted glutamate homeostasis in hippocampus of pR5 mice. This may occur as a consequence of reduced glucose metabolism, which indeed is found in the temporal lobe in FTD and in the hippocampus in MCI and AD patients.13,14,28 However, we also observed an increase in percentage enrichment of lactate labeled from [1-
13
C]glucose, indicating that turnover of lactate and thus anaerobic glycolysis was increased. This could fit well with the finding that there was downregulation of cytosolic malate dehydrogenase (cMDH) protein in these mice at the age of 8.5 months.
29
A defect in the transfer of reducing equivalents from the cytosol to mitochondria via the malate-aspartate shuttle, in which cMDH plays a prominent role, may enhance lactate production from pyruvate and lead to decreased incorporation of
13
C-label into the TCA cycle metabolites and those derived from mitochondrial metabolism. Using
Increased Turnover of Metabolites in Cortical Neurons and Astrocytes
In contrast to the decrease in glucose utilization demonstrated in FTD patients, 14 the decreased concentration of [1- 13 C]glucose in cortex suggests that glucose utilization was increased in pR5 mice. 36 In addition, the almost universal increase in the 13 C enrichment of glutamate and GABA isotopomers labeled from [1- 13 C]glucose suggests that turnover of these metabolites is increased in cortical glutamatergic and GABAergic neurons in pR5 mice. This encompasses an increased rate of synthesis since more 13 C label was incorporated, accompanied by a similarly increased rate of degradation of unlabeled metabolites since the overall concentration was maintained at the same level as in controls. Concerning increased turnover of [1- 13 C]glucose metabolism in GABAergic neurons, it is interesting to note that the percentage enrichment of [2- 13 C]GABA was not significantly different between the groups, but there was a clear tendency towards an increase in pR5 mice. However, this lack of a significant difference was most likely caused by the unfortunate large variation in the data obtained. The concomitant increases in glutamine labeled from [1- 13 C]glucose and [1,2- 13 C]acetate strongly indicate enhanced turnover of glutamine in cortical astrocytes in pR5 mice. Whereas [4,5- 13 C]glutamine is only labeled via astrocytic metabolism, 40% of [4- 13 C]glutamine is derived from [4- 13 C]glutamate initially labeled in the neuronal compartment. 37 Thus, the major part of [4- 13 C]glutamine is derived from astrocytic metabolism of [1- 13 C]glucose, but a substantial fraction reflects neuronal metabolism of [1- 13 C]glucose and the transfer of glutamate to astrocytes. The increased percentage enrichment of [4- 13 C]glutamine in the present study is probably a result of both the increased turnover of glutamate in the neuronal compartment and increased turnover of glutamine in astrocytes. Interestingly, the increased PC/PDH ratio for glutamate in pR5 mice suggests an increased relative contribution of the PC pathway in astrocytes to glutamate synthesis. If this is due to increased PC activity, it might present a reason why glutamate is maintained at the normal level in the cortex of pR5 mice, whereas it was decreased in the hippocampus.
The transfer of metabolites between neurons and astrocytes in cortex appeared to remain normal. This was indicated by the increase in percentage enrichment of both [4- 13 C] glutamate and glutamine (which can suggest normal transfer of glutamate from neurons to astrocytes) and in that of [4,5- 13 C]glutamate and glutamine (suggesting normal transfer of glutamine from astrocytes to neurons). Normal transfer of glutamine from astrocytes to GABAergic neurons is suggested by the concurrent increase in percentage enrichment of [1,2- 13 C]GABA and [4,5- 13 C]glutamine. The increased percentage enrichment of [4,5- 13 C]glutamate, [4- 13 C]glutamine and [1,2- 13 C]GABA therefore probably reflected the increased 13 C labeling of their respective precursors.
Different Metabolic States in Hippocampus and Cortex
The fact that two distinct metabolic states were evident as a consequence of tau hyperphosphorylation in hippocampus and cerebral cortex may be related to the fact that human mutated tau is present to a larger extent in hippocampus than in neocortex in pR5 mice at age 3 months. 20 Thus, our results may indicate that the metabolic consequences can differ according to the level of hyperphosphorylated tau and may possibly represent different stages of the metabolic response to tau pathology. Alternatively, this difference may reflect selective vulnerability, 38 which has been shown for the hippocampus in FTD. 39 The reason for the apparent upregulation of cortical metabolism at this age remains unclear and appears contradictory to the reports on hypometabolism in AD and FTD patients12,15 and the severe mitochondrial dysfunction that has been demonstrated in pR5 mice at a later age. 29 It is possible that these early changes in cortex in the present study may reflect compensatory mechanisms, which indeed appear to occur in response to the expression of the P301L mutation in tau. At age 1 to 2 months, before the onset of marked tau hyperphosphorylation, other lines of mice that also express the P301L mutation display paradoxical increases in long-term potentiation of synapses in dentate gyrus and in dendritic spine maturation in addition to improved cognitive performance compared with controls.34,40 The downregulation of several metabolism-related proteins and reduced complex I activity as measured in the whole brain at the ages 8.5 to 12 months suggests that metabolic dysfunction occurs in pR5 mice with increased aggregation of tau. However, mitochondrial respiration, ATP production, and oxidative status as measured in one hemisphere are preserved until advanced age and massive NFT deposition. 29 Studies in patients with mild FTD demonstrate that decreased glucose metabolism is restricted to distinct cortical regions whereas other cortical regions remain unaffected. 14 Local variations in the metabolic pattern obtained in cortex in the present study cannot be excluded, as the use of the whole cortex may have masked regional metabolic differences in more spatially confined regions. In the hippocampus, however, a mutated tau-dependent metabolic deterioration appears to occur already at the age of 3 months in P301L tau-expressing pR5 mice.
Overall, we revealed that astrocytes as well as glutamatergic and GABAergic neurons in the cortex of pR5 mice were in a hypermetabolic state, whereas in the hippocampus, where expression levels of mutant human tau are the highest, glutamate homeostasis was impaired.
DISCLOSURE/CONFLICT OF INTEREST
The authors declare no conflict of interest.
Footnotes
ACKNOWLEDGEMENTS
The technical assistance of Lars G Evje and Mohammed A Kashem is gratefully acknowledged. We thank the Norwegian Health Association (Dementia) and the Department of Neuroscience DMF/NTNU for financial support.