
Abstract
Interferon-β (IFN-β) drugs are considered to derive their beneficial effects on multiple sclerosis (MS) progression via their antiinflammatory properties, but the precise mechanism of action remains unclear. Here, we sought to discover how IFN-β impacts on inflammation-associated aggravation of MS-like lesions in rat. Animals with dormant focal experimental allergic encephalomyelitis (EAE) lesions were challenged intravenously with a replication-deficient adenovirus vector carrying interleukin (IL)-1β cDNA (AdIL-1β). Aggravation of inflammation and demyelination within the focal EAE lesion was observed after AdIL-1β injection with associated changes in tissue structure detected by diffusion and magnetization transfer imaging. Postgadolinium-DTPA T1-weighted images revealed contrast enhancement in the ipsilateral meninges, indicating breakdown of the blood–cerebrospinal fluid barrier, and increased left/right regional cerebral blood volume ratio was also observed after AdIL-1β injection. To determine the role of IFN-β on reactivation of the EAE lesion, rats were treated with therapeutic doses of IFN-β and focal EAE lesions showed significantly reduced reactivation in response to systemic AdIL-1β injection. In conclusion, these findings indicate a central role for peripheral IL-1β expression in the mechanism of MS lesion reactivation and that the therapeutic effects of IFN-β may, at least in part, reflect suppression of the effects of peripheral inflammation on MS lesion pathogenesis.
INTRODUCTION
Multiple sclerosis (MS) is the archetypal inflammatory disease of the central nervous system (CNS) and the most common progressive disorder of young adulthood. 1 The pathology of the disease involves inflammation associated with demyelination, axonal injury, and blood–brain barrier (BBB) breakdown.2 During disease progression, most individuals with MS display a relapsing-remitting type of the disease in which bacterial and viral infections have been suggested to play an important role.3,4 Emerging evidence suggests that MS patients exposed to infections have a significantly greater risk of relapse.3,4 Clinically, it has been shown that a significant number of MS relapses are preceded by a viral infection 5 or bacterial infection.6,7 However, no simple relationship between these processes has emerged. 8 Previously, we demonstrated reactivation of a focal myelin oligodendrocyte glycoprotein-induced experimental allergic encephalomyelitis lesion in the rat brain following systemic bacterial endotoxin injection. 9 Our findings parallel the disease-modifying effects of systemic inflammation on chronic neurodegeneration in models of Prion disease, 10 stroke,11–13 MS, 14 and Parkinson's disease.15,16 These findings together highlight an important generic role for innate immune–brain interactions in acute and chronic neurological dysfunction.
In our previous work, we found that an intraperitoneal injection of lipopolysaccharide (LPS) caused an acute increase in regional cerebral blood volume (rCBV) during the early stages of lesion reactivation. 9 These findings echoed our earlier work demonstrating an increase in rCBV in the acute, preclinical stages of MS-like lesions in rat brain.17,18 It is known that peripheral infections induce production of interleukin-1β (IL-1β) both systemically and within the brain parenchyma, 19 and we have previously shown an increase in rCBV after intracerebral injection of IL-1β in the rat. 20 Recent studies in mice with middle cerebral artery occlusion have shown that peripheral IL-1β challenge exacerbates ischemic injury via a mechanism that is both IL-1β and neutrophil-dependent. 12 Interestingly, in MS patients high levels of IL-1β in the cerebrospinal fluid (CSF) correlate with disease activity and progression. 21 Taken together, these data suggest a role for IL-1β in the reactivation or relapse of MS lesions following systemic infection.
Several studies involving the use of AdIL-1β have specifically revealed the impact of IL-1β in animal models. In one such study, AdIL-1β induced a shift in microglial activation towards a proinflammatory phenotype and exacerbated the degeneration of dopaminergic neurons by both direct and indirect mechanisms. 15 Moreover, we have shown that AdIL-1β can cause a prolonged hepatic chemokine response, resulting in axonal injury and behavioral suppression in rats. 22 It should be noted that almost all of the adenoviral vector is taken up by the liver and none by the brain. 23 The aim of the current study, therefore, was to use the AdIL-1β to determine the effect of extended peripheral IL-1β expression on a focal MOG-induced experimental allergic encephalomyelitis (EAE) lesion in rats using multimodal magnetic resonance imaging (MRI) as the primary readout. The mode of action of the common MS therapy interferon-β (IFN-β) is unclear and remains a contentious issue despite its widespread use. Here, we sought to determine whether one of the actions of IFN-β might be to target the exacerbation of MS by peripheral inflammation using our MRI-detectable biomarkers of lesion reactivation.
MATERIALS AND METHODS
All experimental procedures used in this study were approved by the United Kingdom Home Office and complied with section ‘Human and Other Animal Experiments’ of the guide to authors.
Adenoviral Vectors
The construction of the adenovirus vectors AdIL-1β and AdDL70 (control) has previously been described.22,24,25 Adenovirus preparations were purified by CsCl gradient centrifugation and PD-10 Sephadex chromatography (Amersham Pharmacia, Baie d'Urfe, Canada), plaque-tittered on 293 cells and quantified (AdIL-1β = 4 × 10¹², AdDL70 = 5 × 10¹¹ p.f.u./mL) as previously described.22,24 Stocks had <1 ng/mL of endotoxin, assayed with E-TOXATE reagents. Viral stocks were free of auto-replicative particles as assessed by PCR and transduction of nontranscomplementary cells (HeLa, ATCC, Teddington, UK). 26
Senitization Procedure
Male Lewis rats (Charles River, Margate, UK) (140 g) (n = 52) were anesthetized with 1.5–3% isoflurane in a mixture of nitrous oxide/oxygen (70%/30%) and injected subcutaneously at the base of the tail with 100 μL of rat recombinant MOG (rrMOG) protein emulsified in Incomplete Freund's adjuvant (IFA; Sigma-Aldrich, Gillingham, UK) (1:1).
Intracerebral Stereotactic Injection of Cytokines
To induce targeted, focal rat recombinant MOG-EAE lesions (frrMOG-EAE), rrMOG-immunized rats were stereotaxically and unilaterally injected with cytokines in the corpus callosum 21 days later. The contralateral side was used as a control in providing left/right ratios for quantitation of changes. Animals were anesthetized with 2–3% isoflurane in a mixture of nitrous oxide/oxygen (70%/30%) and placed in a stereotaxic frame. A midline incision was made in the scalp and a burr hole drilled 1-mm anterior and 3-mm lateral to Bregma. Using a finely drawn glass microcapillary (<50 μm tip), 2 μL of a cytokine mixture containing 1.45 μg of recombinant rat tumor necrosis factor-α (TNF-α) (PeproTech, London, UK) and 1 μg of recombinant rat interferon-γ (IFN-γ; PeproTech) dissolved in sterile saline was injected stereotaxically into the corpus callosum over a 10-minute period. After injection, the wound was closed and the animals were allowed to recover from anesthesia; they displayed no overt clinical signs. Previously, we have shown that in the absence of an intracerebral cytokine challenge, no EAE lesions were detectable by MRI or by immunohistochemistry.9,17
Experimental Protocol
Adenovirus injection. Four weeks after the intracerebral cytokine injection, at a point when immunohistochemical and MRI-detectable changes have largely returned to baseline, frrMOG-EAE animals were injected intravenously (i.v.) with either AdIL-1β diluted to a dose of 4 × 10¹⁰ plaque forming units (p.f.u.)/rat (n = 20) or AdDL70 at 4 × 10¹⁰ p.f.u./rat (n = 4) (see Figure 1). The AdIL-1β animals were randomly assigned to two groups, one of which was treated with a therapeutic dose of IFN-β (kind gift from Dr Jane Relton, Biogen Idec, Boston, MA, USA) 0, 36, and 72 hours after adenovirus injection (5 × 10⁶ U/kg, intraperitonally (i.p.); n = 6). Animal selection process was completed in accordance with their intracerebral injection order. By random selection, animals with an even number identification received IFN-β treatment, while animals with an odd number were not treated. In addition, a group of frrMOG-EAE with no systemic challenge were included in the study (n = 8). All animals underwent MRI at days 1, 3, and 5 after adenovirus challenge or equivalent time point in unchallenged animals. A small number of animals from the AdIL-1β and nonchallenged groups (n = 3 and 2, respectively) were killed for histological analysis at day 1 and all other animals at day 5. It should be noted that no mortality was observed after adenovirus injection over the 5-day period. The concentration of AdIL-1β was chosen as that required to produce a robust systemic inflammatory response. 25
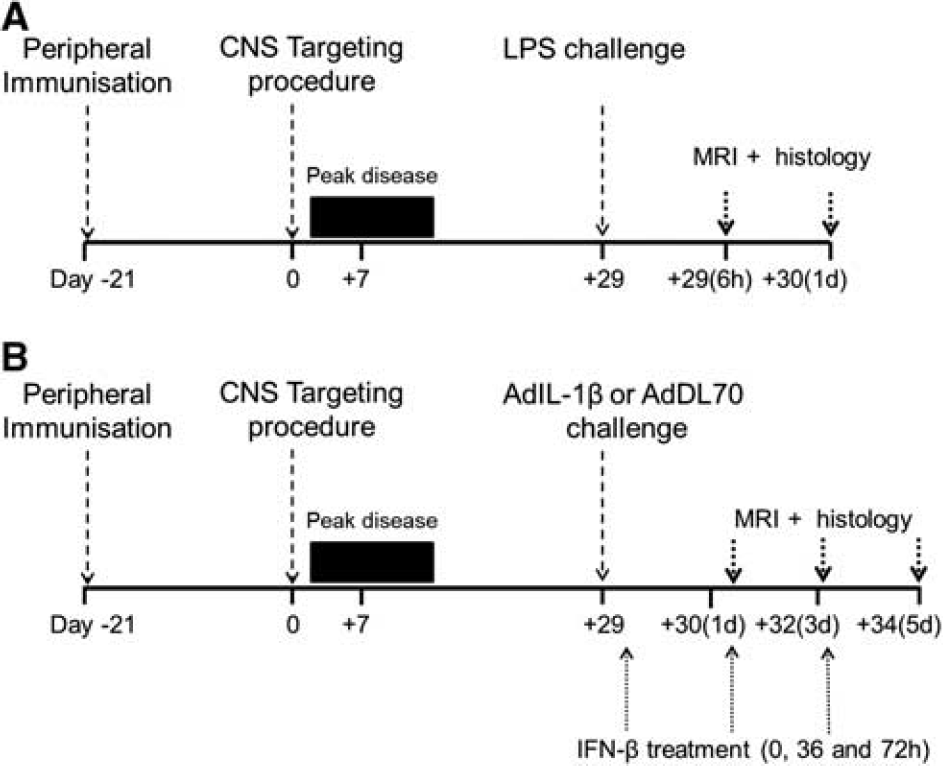
Experimental timeline. Animals were inoculated at day −21 with rat recombinant MOG (rrMOG) protein. At day 0, animals were injected intracerebrally with cytokines and peak disease occurred until day 14 then the frrMOG-EAE lesion remitted by day 28, as observed by magnetic resonance imaging (MRI). Animals were challenged with lipopolysaccharide (LPS) (
Lipopolysaccharide injection. For comparison with our previous work, we also studied a small cohort of animals challenged systemically with bacterial endotoxin. Four weeks after the intracerebral cytokine injection, at a point when immunohistochemical and MRI-detectable changes have largely returned to baseline, 17 frrMOG-EAE animals (n = 5) were injected intraperitoneally with 500 μg/kg Escherichia coli LPS endotoxin (strain CO111:B4; Sigma-Aldrich) in sterile pyrogen-free saline. An additional group of frrMOG-EAE animals were not challenged with LPS (n = 4). Both groups underwent MRI at 6 and 24 hours after LPS challenge, followed by histological assessment.
Magnetic Resonance Imaging
In all cases, a cannula was inserted into the tail vein before MRI for contrast agent injection. Animals were positioned in a quadrature birdcage coil (i.d. 5 cm) and anesthetized with 1–2% isoflurane in 70%N2O/30%O2. ECG was monitored throughout and body temperature was maintained at ~37°C. Images were acquired using a 7-T horizontal-bore magnet with a Varian Inova spectrometer (Varian, Palo Alto, CA, USA).
Scout images were acquired to determine the location of the lesion, and a single 1-mm coronal slice centered on the lesion was selected for the full imaging protocol. T2-weighted images were acquired using a fast spin-echo sequence with a repetition time (TR) of 3.0 seconds and an echo time (TE) of 40 milliseconds. Diffusion-weighted images were acquired using a navigated pulsed-gradient spin-echo sequence (TR = 2.0 seconds; TE = 36.5 milliseconds), with diffusion-weighting b values of 125, 500, and 1,000 s/mm2, a diffusion time (Δ) of 17.5 milliseconds and a diffusion gradient duration (δ) of 12.5 milliseconds. Diffusion gradients were applied separately along three orthogonal axes and apparent diffusion coefficient (ADC) ‘trace’ maps were calculated. Navigator echoes were used for motion correction. For magnetization transfer imaging (MTR), spin-echo images were acquired (Gaussian MT pulse length 32 milliseconds, number of MT pulses 12, TR = 1.5 seconds, TE = 20 milliseconds, offset frequency 1,500 Hz, and maximum B1 value 1.5 T) with and without the MT saturation pulse. Regional cerebral blood volume maps were generated from time series images acquired during bolus injection of contrast agent and tracer kinetic analysis. A series of 40 FLASH images were acquired (TR = 20 milliseconds; TE = 10 milliseconds; flip angle 20°) at a rate of one image every 1.275 seconds, during which 100 μL of a gadolinium-based contrast agent (Gd) (Omniscan, GE Healthcare, Little Chalfont, UK) was injected via the tail vein cannula, over a 4-second period from image 8. Spin-echo T1-weighted images (TR = 500 milliseconds; TE = 13 milliseconds) were acquired both before and 10 minutes after Gd injection to identify any image enhancement due to BBB permeability. The matrix size and field of view were 128 × 128 and 3.5 × 3.5 cm2, respectively, for all images, except for the rCBV data, which were acquired with a 128 × 64 matrix and a 3 cm × 4 cm field of view to increase the temporal resolution.
Magnetic Resonance Imaging Data Analysis
Regional cerebral blood volume maps were created using standard tracer kinetic analysis of the dynamic susceptibility tracking data, as described previously. 18 The CBV maps were thresholded at a level that was equal to the mean signal intensity plus two standard deviations of the signal intensity of the noninjected hemisphere. This approach allowed areas of increased CBV to be more easily visualized and quantitative analysis was performed on the thresholded CBV maps. Regions of interest (ROIs) were drawn around the hemispheric areas on the thresholded images. The results are expressed as pixel area ratios of left/right (i.e., injected/noninjected) CBV to assess hemispheric differences. The same procedure was used to identify gadolinium enhancement in the injected hemisphere and ROIs of gadolinium enhancement in the ipsilateral meninges were drawn using an image resulting from the subtraction of post- minus pre-contrast T1-weighted images. Regions of interest encompassing regions of both increased and decreased signal intensity were quantified on ADC trace maps. Magnetization transfer imaging maps were created on a pixel-by-pixel basis, by subtracting the presaturation scan from the reference scan and then dividing by the presaturation scan. In MTR maps, T2 and postcontrast T1-weighted images ROIs encompassing the left and right corpus callosum were defined for quantitation of changes in signal intensity. The results are expressed as ratios of left/right (i.e., injected/noninjected).
All the investigators were blind to group identity when ROI were drawn for MRI analysis.
Immunohistochemistry
Animals were deeply anesthetized with sodium pentobarbitone, and transcardially perfused with 0.9% heparinized saline followed by 200 mL periodate lysine paraformaldehyde. After dissection, the brains were postfixed for 4–6 hours in the periodate lysine paraformaldehyde fixative and then immersed in 30% sucrose buffer to cryoprotect. The tissue was then embedded in Tissue Tek (Sakura Finetek Europe, Zoeterwoude, The Netherlands) and frozen in isopentane at −40°C. Immunohistochemistry was used to confirm the presence and distribution of specific cell populations. Frozen, 10-μm thick, serial sections were cut from the fixed tissue and mounted on gelatin-coated glass slides. Antigens were detected using a three-step indirect method. Immunohistochemistry was carried out with antibodies against markers of recruited monocytes and activated resident macrophages (ED1, Serotec, Oxford, UK), T cells (CD3, e-bioscience, Hatfield, UK), amyloid-β precursor protein (APP, Abcam, Cambridge, UK), and the adhesion molecules P-selectin (M-20) and L-selectin (5K271; both Santa Cruz Biotechnology, Dallas, TX, USA). Detection was performed with the appropriate biotinylated secondary reagents with standard ABC amplification, according to the manufacturers' instructions (Vector Laboratories, Peterborough, UK). Immunoreactivity was revealed with diaminobenzidine to produce a brown insoluble precipitate.
For luxol fast blue (LFB) staining, slides were incubated in LFB overnight, washed in 95% ethanol and then in distilled water. Differentiation was performed using 0.05% lithium carbonate solution, then in 70% ethyl alcohol, followed by a distilled water rinse. Finally, cresyl violet counter-staining was used.
In each group of animals, inflammatory cell infiltration was quantified by an individual blind to the identity of the tissue. Counting of the number of ED1-positive cells from four regions immediately adjacent to the injection site was performed in four 10-μm-thick sections. Four nonoverlapping areas containing the highest density of recruited cells within the parenchyma were chosen and the numbers of macrophages were calculated as an average number per mm2.
The extent of demyelination was ranked by an individual blind to the identity of the tissue; 0 (no sign of demyelination in the corpus callosum), 1 (mild sign of demyelination in a circumscribed area), 2 (frank demyelination in a circumscribed area), and 3 (majority of corpus callosum demyelinated).
Statistics
Data were displayed as mean ± s.d. Statistical analysis was performed using SPSS (SPSS, Chicago, IL, USA). One-way analysis of variance followed by pairwise Bonferroni t-tests were used to identify specific differences between the groups. One-way repeated-measures analysis of variance was used to analyze data over time. Unpaired t-tests were used to identify differences between the groups in MTR experiments.
RESULTS
To study the effect of cytokine-induced reactivation on a dormant frrMOG-EAE lesion, we injected LPS, AdIL-1β, or AdDL70 systemically in frrMOG-EAE animals following apparent recovery of the CNS lesion, as detected by MRI. One cohort of AdIL-1β-injected animals was also treated with a therapeutic dose of IFN-β (see Figure 1 for study design). In all cases, no overt abnormalities were observed.
Characterization of the Lesion Induced with rrMOG Protein
Following microinjection of TNF-α and IFN-γ into the corpus callosum in rrMOG-immunized animals, images exhibited the same patterns of changes (Figure 2) that we previously observed in a focal MOG-EAE model induced with MOG (35–55) peptide. 17 At day 7, T2-weighted images revealed a hyperintense region associated with loss of corpus callosum structure, postcontrast T1-weighted images revealed gadolinium enhancement in the lesion confirming BBB breakdown, ADC trace maps showed the development of an area of decreased ADC surrounded by an area of increased ADC, and MTR maps showed a loss of corpus callosum structure (Figures 2A–2D). In thresholded rCBV map, an increase in rCBV was observed in the injected hemisphere (Figure 2E). In all images, we noted a spatial coincidence between the decrease in ADC, increase in rCBV, gadolinium enhancement, and T2 hyperintensity. At day 7, areas of T2 hyperintensity, contrast enhancement, and both increased and decreased ADC were 113 ± 62 pixels; 94 ± 37 pixels; 133 ± 42; and 63 ± 24 pixels, respectively, n = 30). The spatial extent of these changes was similar in all cases with those of obtained previously with MOG peptide. 17 Magnetization transfer imaging and rCBV L/R ratios at day 7 were 0.89 ± 0.06 and 2.9 ± 0.8, respectively. Interestingly, the L/R rCBV ratio was much higher in the rrMOG-immunized than MOG peptide-immunized animals 2.92 ± 0.84 versus 1.75 ± 0.56, respectively. 17
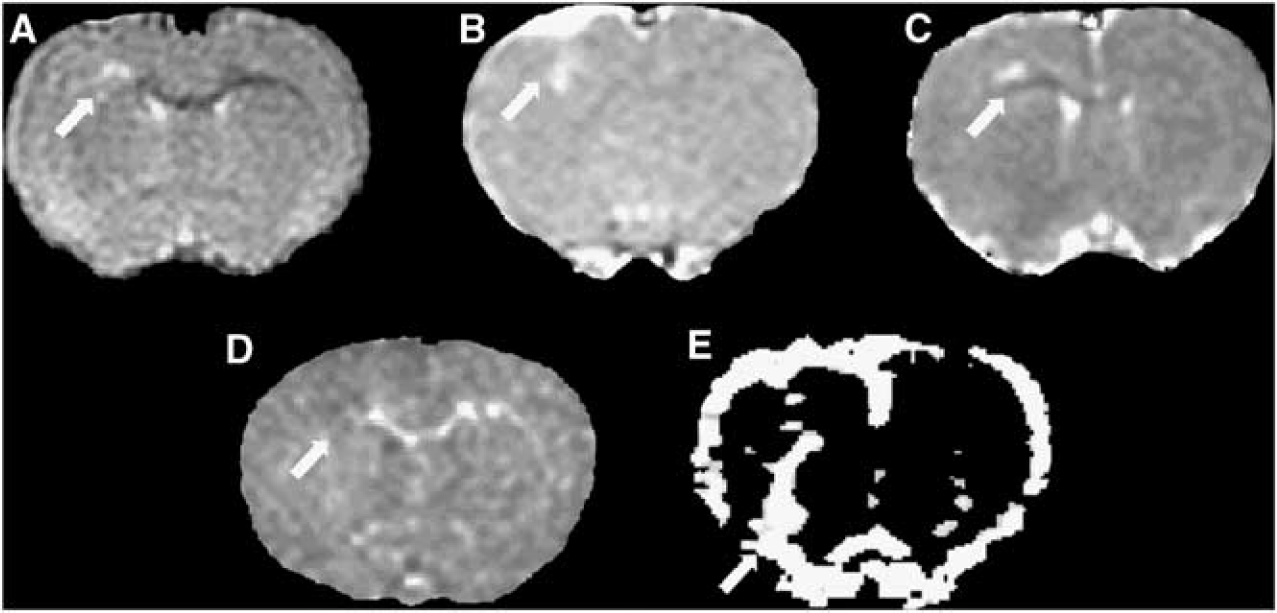
Magnetic resonance imaging (MRI) images acquired at day 7 after intracerebral injection of cytokines in frrMOG-EAE rat. (
Analysis of frrMOG-EAE histopathology at day 28 revealed a similar number of ED1-positive cells representing activated macrophages as seen in the focal MOG-EAE model induced with peptide (972 ± 345 versus 880 ± 414 cells/mm2 in rrMOG and MOG peptide groups, respectively). 9
To ascertain whether the response of the frrMOG-EAE lesion to systemic LPS challenge was of the same magnitude as in our previous study, we injected 500 μg/kg LPS intraperitoneally into a cohort of animals with quiescent frrMOG-EAE lesions. A similar increase in rCBV to that previously reported 9 was observed after LPS injection (Figures 3A and 3B). L/R rCBV ratios were significantly greater at 6 hours (2.91 ± 0.99; P < 0.05) and 24 hours (2.17 ± 0.49; P < 0.01) compared with pre-LPS values at day 28. The L/R ratio for the area of increased rCBV was also significantly higher in the LPS-treated frrMOG-EAE group than in the control (unchallenged) frrMOG-EAE group at 6 and 24 hours (unpaired t-test; P < 0.05; Figure 3B).
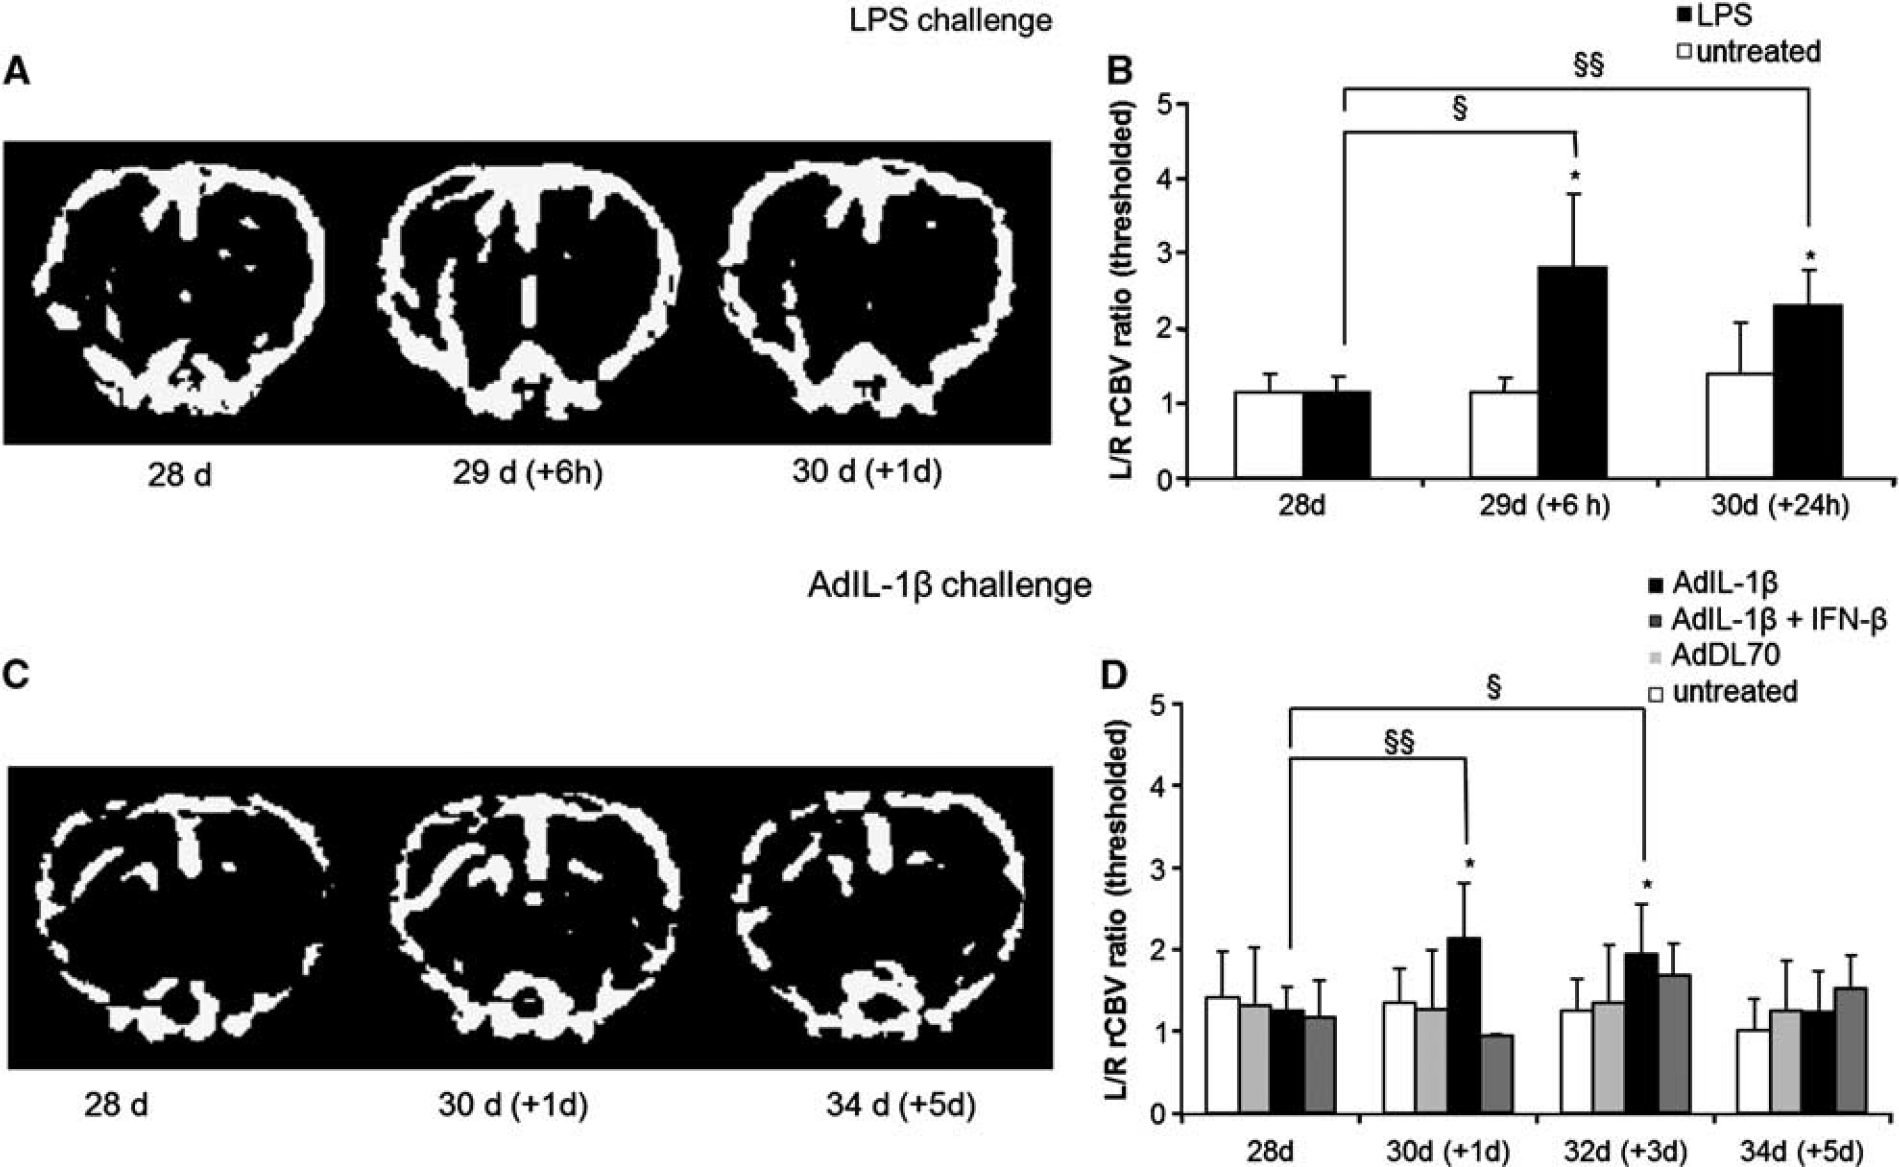
Regional cerebral blood volume (rCBV) maps acquired after systemic challenges. (
Peripheral Expression of Interleukin-1β Increases rCBV at site of frrMOG-Experimental Allergic Encephalomyelitis Lesion
To establish whether the upregulation of peripheral IL-1β expression could reactivate MS-like lesions in the rat brain, we injected intravenously AdIL-1β as used in previous studies.15,24 We had already shown that almost all adenoviral vectors are taken up by the liver and none by the brain 23 and that systemic expression of IL-1β was high and stable over a 5-day period after injection of AdIL-1β. 25
To ascertain whether a therapeutic dose of IFN-β could combat the effect of upregulation of peripheral IL-1β, we injected AdIL-1 β-treated rats at 0, 36, and 72 hours after adenovirus injection with similar doses of IFN-β as previously used. 27
A significant increase in the L/R rCBV ratio (60–80%) was found between 1 and 3 days after systemic AdIL-1β injection (P < 0.01 and P < 0.05, respectively) compared with prechallenge values. Then L/R rCBV ratio had returned to baseline by day 5 (Figures 3C and 3D). This effect has previously been associated with new macrophage recruitment and increased myelin loss following systemic endotoxin challenge. 9 No increase was reported in nonchallenged animals or animals injected with the null adenovirus AdDL70. AdIL-1β-treated animals that were also treated with therapeutic doses of IFN-β showed a strong amelioration of the increased rCBV ratio at day 1 (Figure 3D). A slight increase in rCBV ratio (30–40%) at days 3 and 5 was also observed in IFN-β-treated animals, but this was not significant. The area of increased rCBV was significantly higher in AdIL-1 β-treated animals than in those injected with AdDL70 or not challenged groups at days 1 and 3 (P < 0.05), after which it was slightly attenuated at day 5.
AdIL-1β Challenge Reactivates Quiescent frrMOG-Experimental Allergic Encephalomyelitis Lesions
Systemic injection of AdIL-1β caused an increase in the number of ED1-positive cells in the frrMOG-EAE lesions and a decrease in the extent of LFB staining, indicating an activation of microglia and/or macrophage recruitment associated with increased demyelination (Figure 4). The quantitation of ED1-positive cells revealed a significantly higher number of macrophages from day 1 (1,368 ± 205) until day 5 (1,803 ± 183) after AdIL-1β injection compared with nonchallenged animals (at day 5; P < 0.05) (Figure 4G). The extent of demyelination was also significantly higher in treated animals (at day 5; P < 0.05) Figure 4H). Animals treated with AdIL-1β + IFN-β showed a significant reduction in both the number of macrophage recruited and the extent of demyelination (at day 5; P < 0.05) (Figures 4G and 4H).
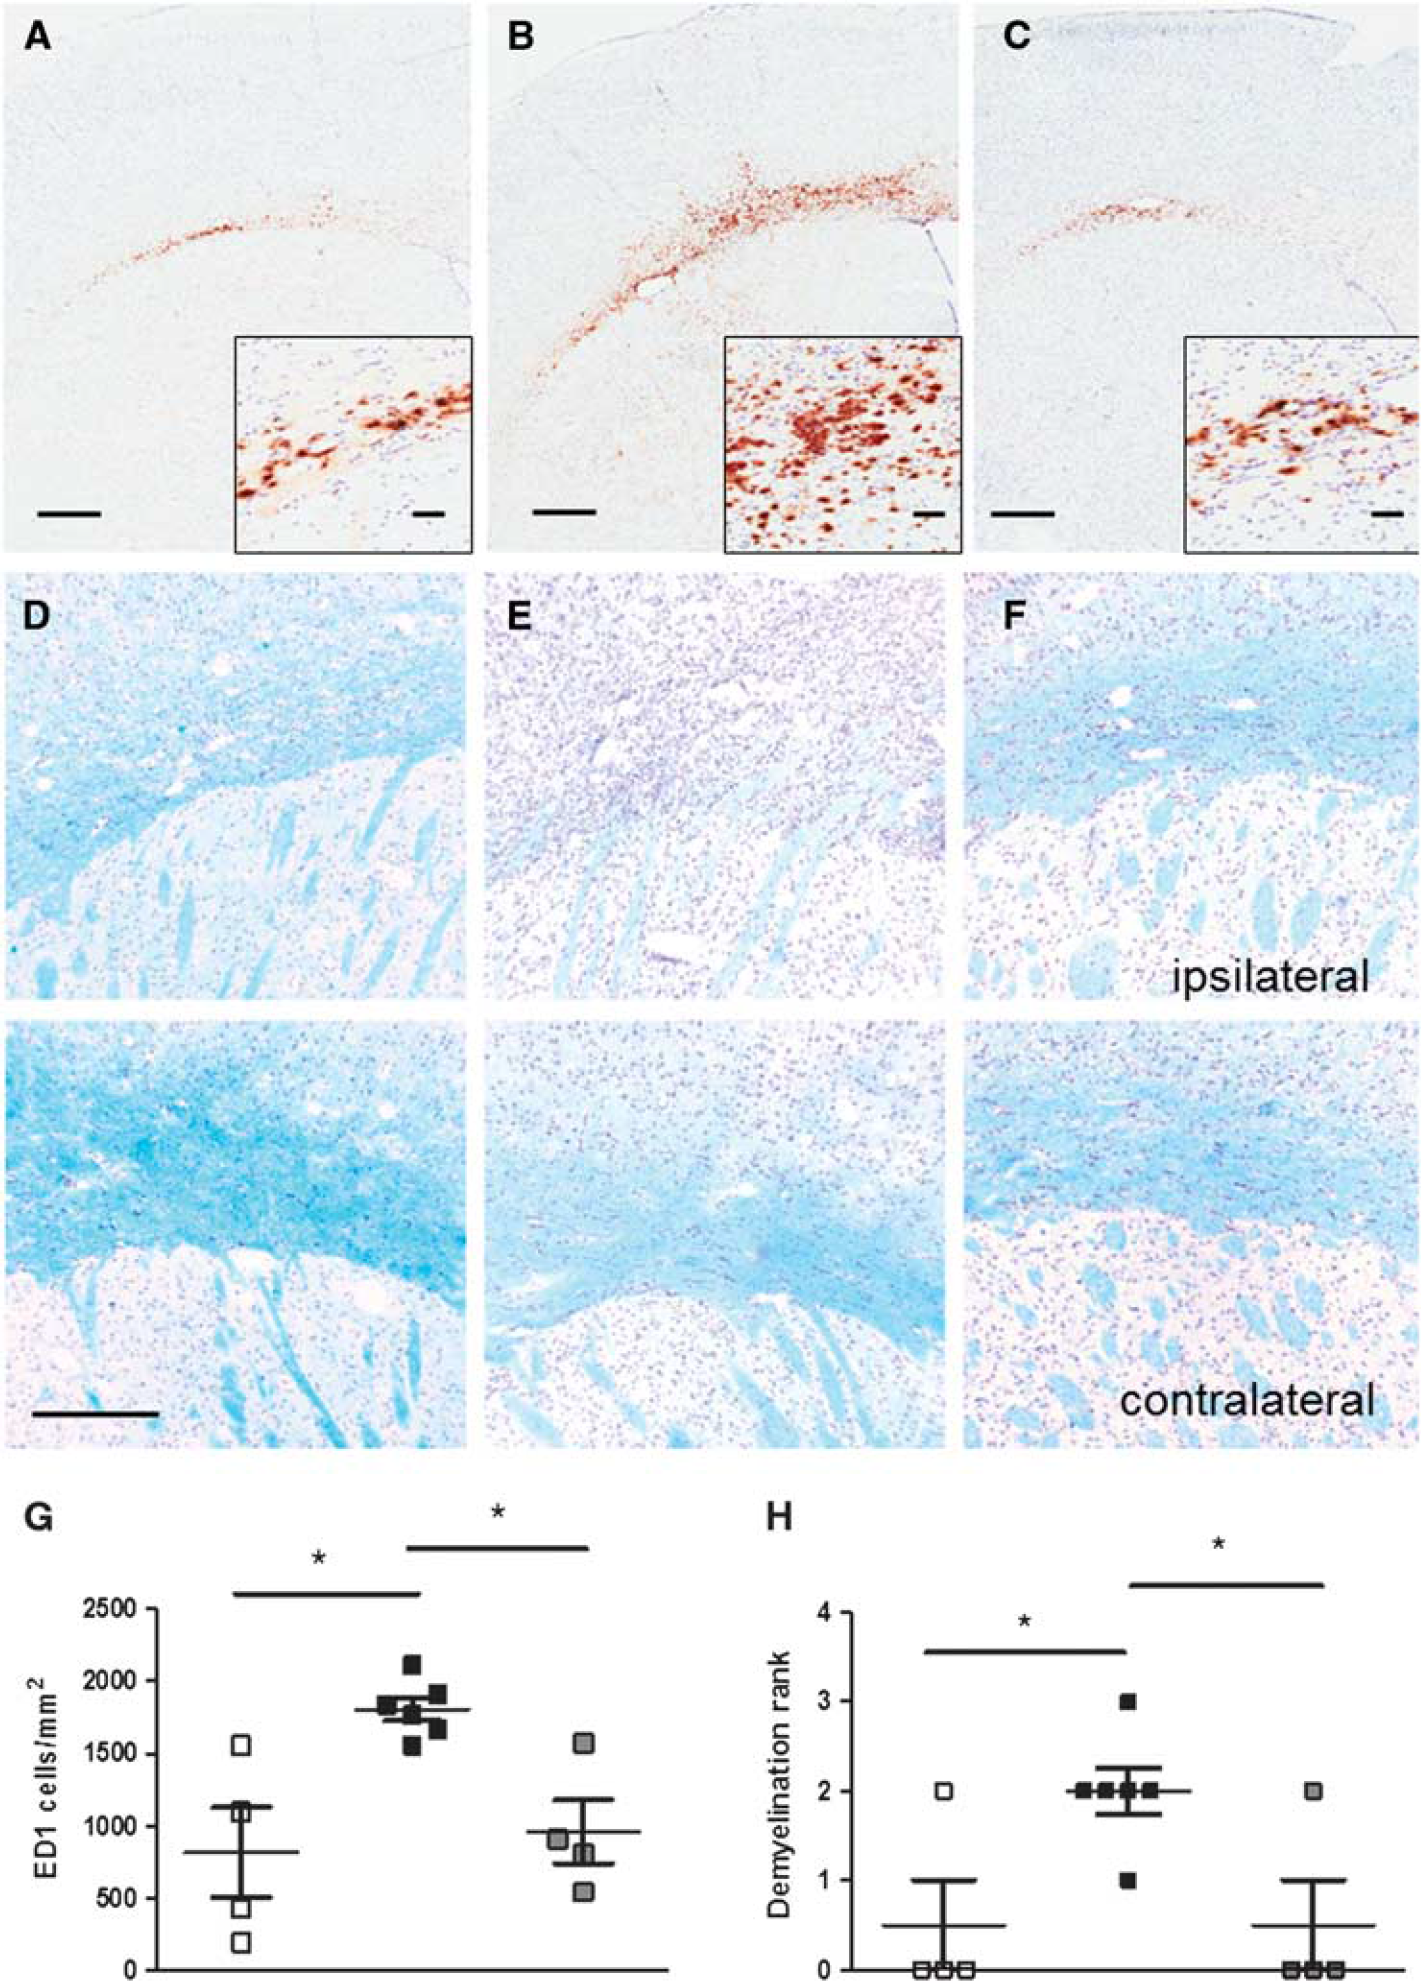
ED1-positive cells and myelin staining. Photomicrographs illustrating ED1-positive cells (brown diaminobenzidine (DAB) stain), in untreated (
To establish whether the reactivation process caused by AdIL-1β challenge was associated with new leukocyte recruitment, rather than activation of resident inflammatory cells alone, immunohistochemical detection of specific cell adhesion molecules involved in leukocyte recruitment (P and L-selectin) and T cells was undertaken (Figures 5A–5E). Expression of both P and L-selectin was found more intense around the blood vessels and in the parenchyma of the lesioned hemisphere (ipsilateral) compared with the control hemisphere (contralateral; Figures 5A–5D). Concomitantly recruitment of T cells was observed at the lesion side (Figure 5E). Further, APP staining revealed that axonal damage was extensive in animals treated with AdIL-1β and was associated with new inflammatory and demyelinating processes (Figure 5F).
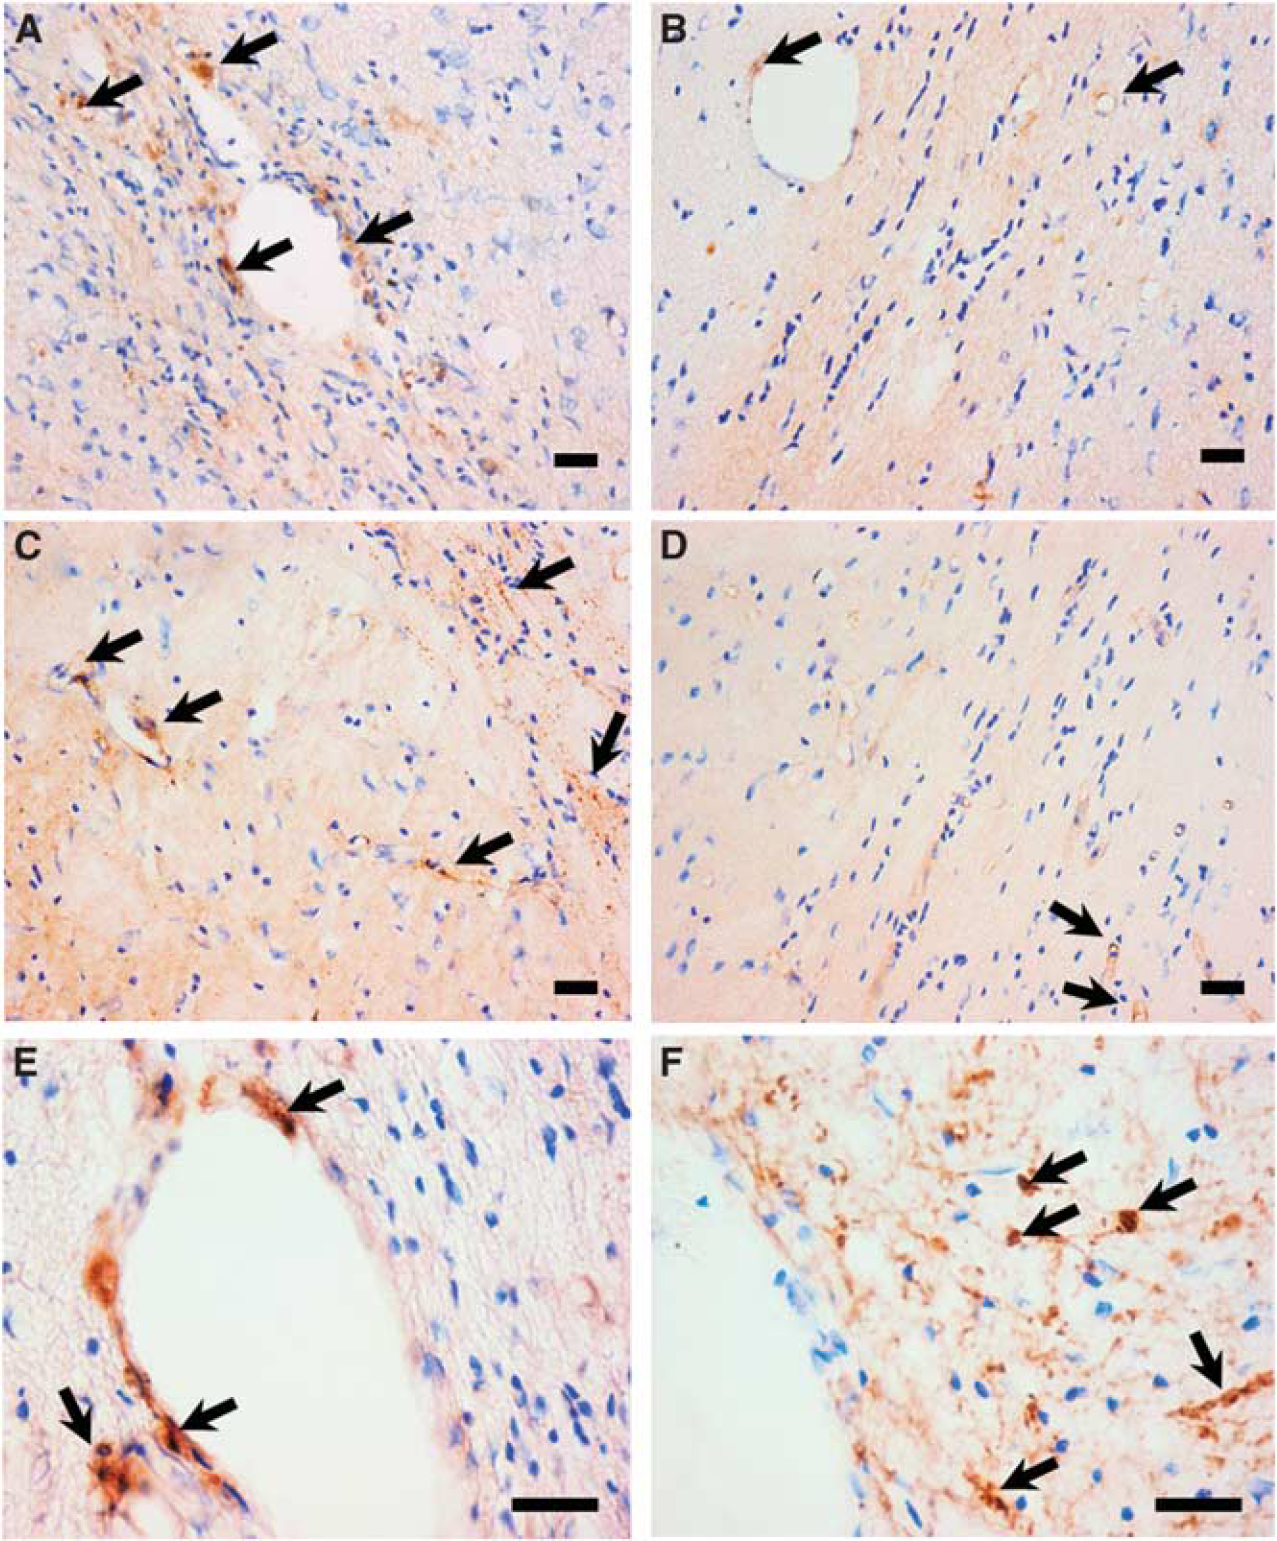
P and L-selectins, T cells, and APP staining. Photomicrographs illustrating P-selectin staining in ipsilateral (
A progressive increase in the area of ADC hyperintensity was observed in AdIL-1 β-treated animals, which was significant at both days 3 and 5 after injection (P < 0.001 and P < 0.01, respectively; Figure 6A). The areas of ADC hyperintensity in AdIL-1β-treated frrMOG-EAE animals were greater than in all other groups over the 5-day period following AdIL-1β injection. Animals treated with AdIL-1β + IFN-β showed a marked reduction in the areas of ADC hyperintensity compared with the AdIL-1β-treated group at days 1, 3, and 5 (P < 0.05; Figure 6A).
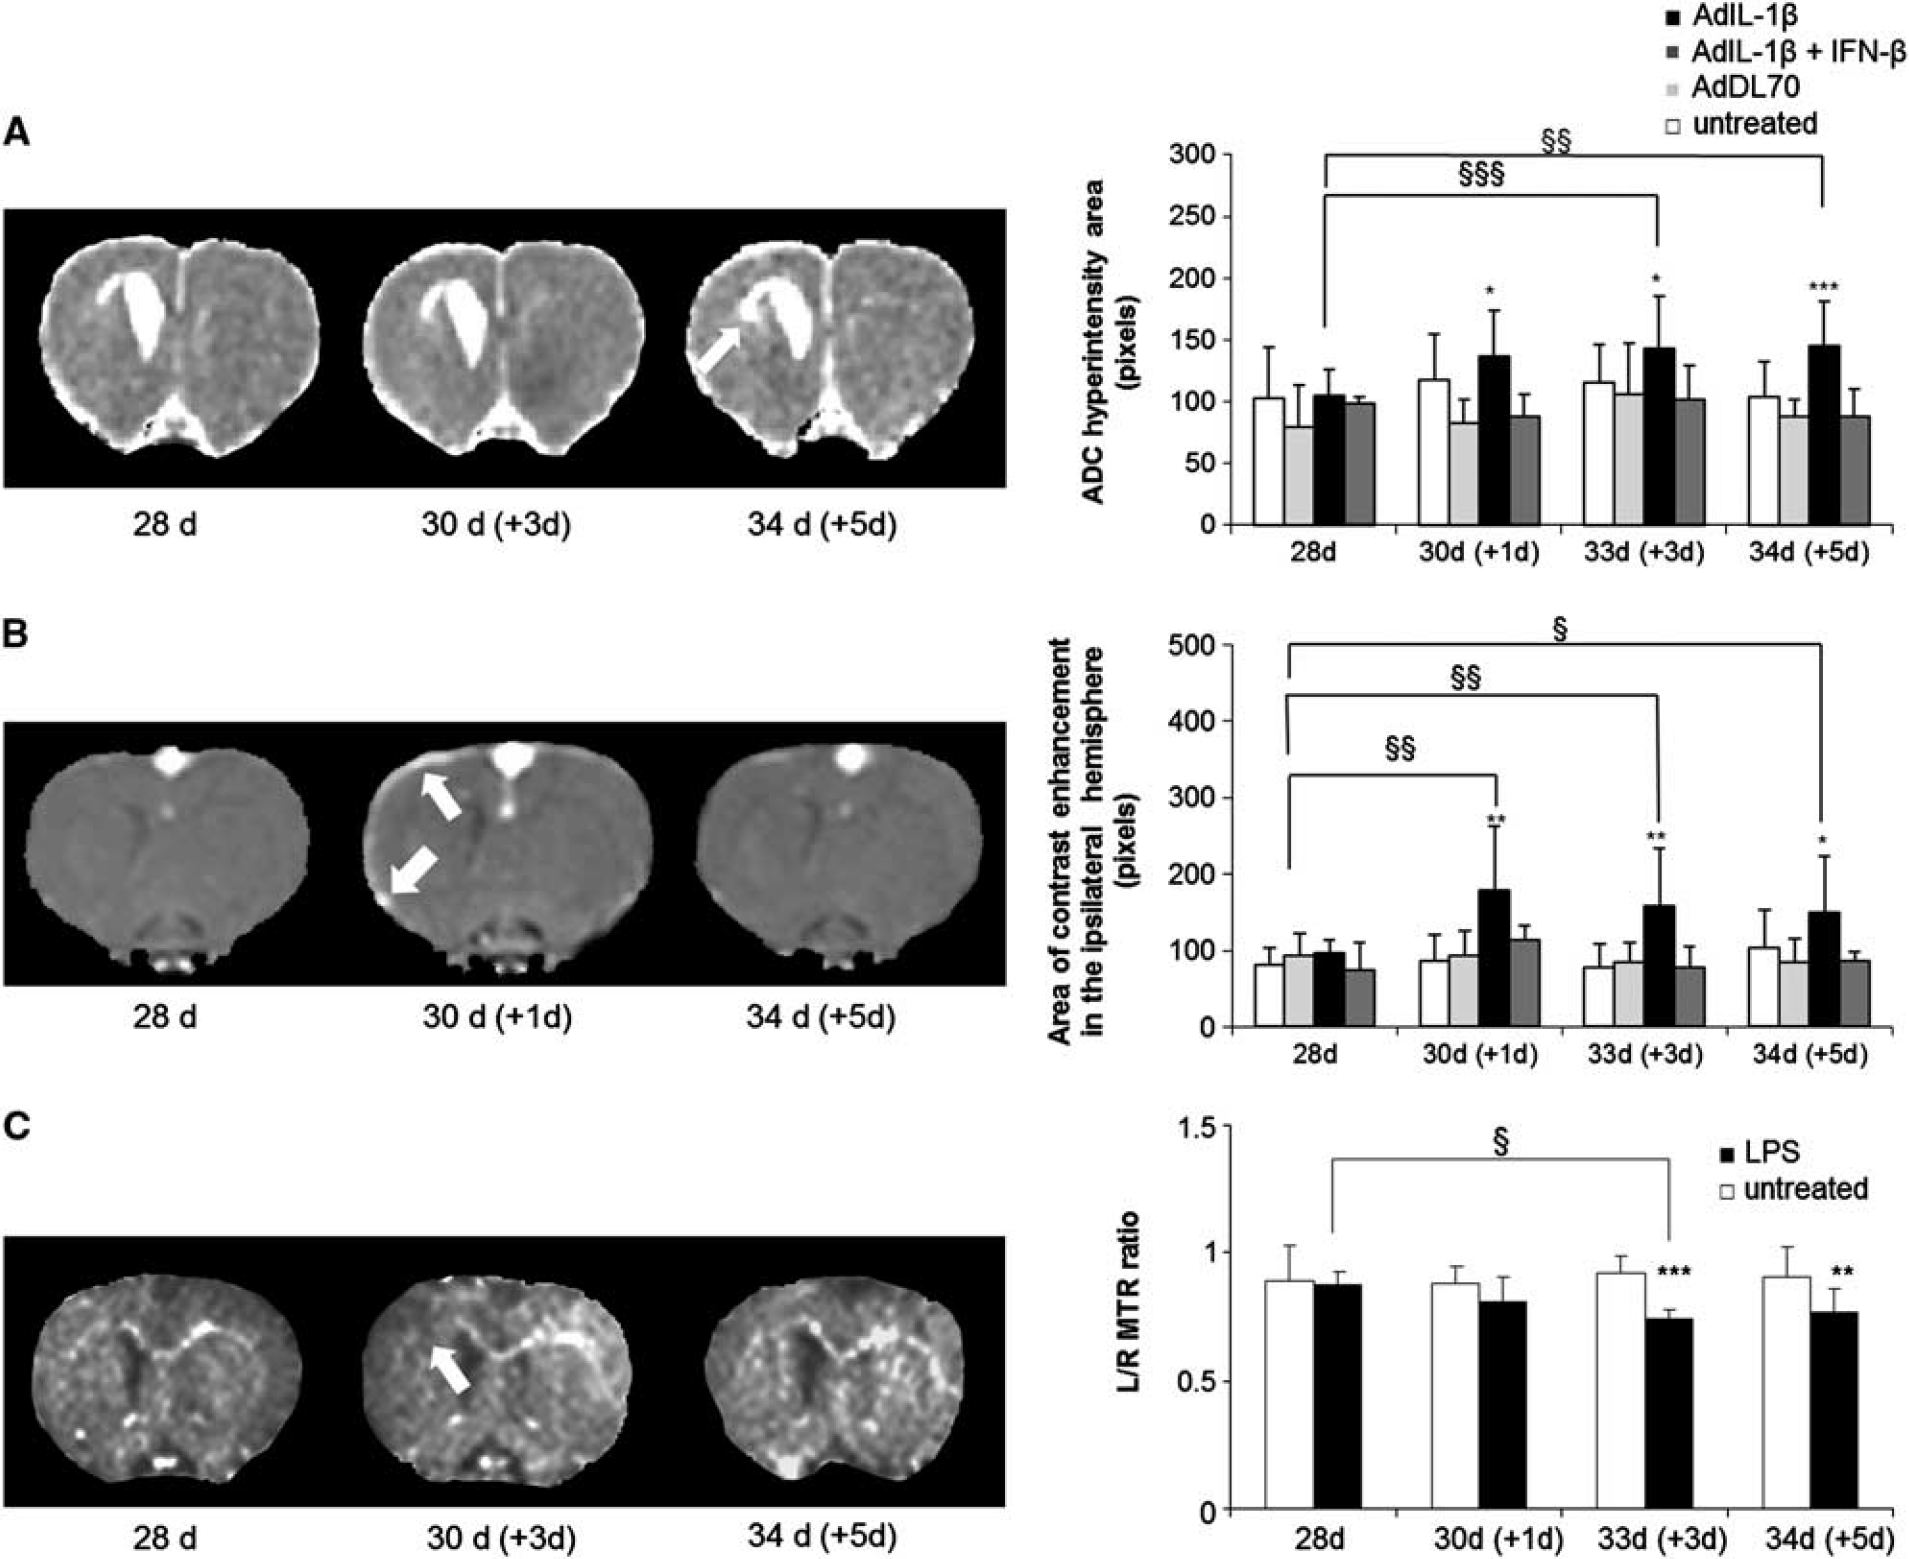
Magnetization transfer imaging (MTR), diffusion, and postcontrast T1-weighted imaging acquired after systemic challenges. (
Postgadolinium-DTPA T1-weighted images (Figure 6B) revealed contrast enhancement in the ipsilateral meninges, indicating a breakdown of the blood–CSF barrier between 1 and 5 days after AdIL-1β challenge, but not in the region associated with loss of signal from the corpus callosum (Supplementary Figure 1). The areas of contrast enhancement increased significantly over the 5 days after AdIL-1β challenge, with P < 0.01 at day 1; P < 0.01 at day 3, and P < 0.05 at day 5, respectively. The area of contrast enhancement in the meninges in AdIL-1β-treated animals was significant when compared with AdDL70 or not challenged. When rats were treated with therapeutic doses of IFN-β, reduced gadolinium enhancement was evident in the ipsilateral meninges and significant at days 1, 3, and 5 (P < 0.05).
A progressive decrease in L/R MTR ratios in the frrMOG-EAE lesions was observed over the 5-day period following AdIL-1β injection (Figure 6C), which was not apparent in either control group. This decrease in the L/R MTR ratio became significant at day 3 after AdIL-1β injection compared with preinjection values (P < 0.05). There was also a significant difference between AdIL-1β and nonchallenged groups at days 3 and 5 (P < 0.001 and P < 0.01, respectively). No MTR imaging could be carried out on the animals treated with either AdDL70 or IFN-β due to technical issues with the MRI.
Quantitative data of signal intensity on T2-weighted images revealed that there was no increase of T2 intensity in the region associated with loss of corpus callosum structure (Supplementary Figure 1).
For all of the MRI parameters studied, no significant changes were observed in frrMOG-EAE rats that were either injected with AdDL70 or not challenged.
DISCUSSION
Although a role for systemic infection in MS relapse has long been postulated, the mediators and mechanisms remain unknown. 12 We have previously shown that systemic challenge with a bacterial endotoxin exacerbates MS-like lesions in the CNS, 9 and it has been shown that either bacterial or viral infections have similar detrimental effects on the rate of relapse in patients with chronic relapse-remitting MS, suggesting a common signaling pathway. 3 However, not all systemic immune responses are likely to reactivate MS lesions. 28 Parasitic infections provoking Th2-type immune response are known to modulate Th1 immune responses. 28 It remains unclear how this interaction works at a cellular level and where in the body this takes place. It seems likely that T-cell differentiation in lymphatic tissue is the most likely site of action and this may also be true of mechanisms that lead to exacerbation. Other immunological mechanisms within, such as the host response to the presence of neurodegeneration in the brain, may also impact on the reactivation of CNS lesions. 29 It also remains unclear precisely which proinflammatory signaling molecules are involved in the immune response leading to the reactivation of CNS lesions. Several studies have emphasized the importance of peripheral expression of cytokine in CNS diseases and brain injury.11,30 To identify the role of specific circulating cytokines in the systemic reactivation process, we used an adenovirus to induce peripheral overexpression of IL-1β in a rat model of MS. Using this paradigm, we have shown that injection of AdIL-1β causes reactivation of apparently quiescent MS-like lesions in the brain, probably through downstream cytokine-mediated processes.
Comparison of frrMOG-Experimental Allergic Encephalomyelitis (Protein) and Focal MOG-Experimental Allergic Encephalomyelitis (Peptide) Models In this study, full-length rrMOG protein was used to induce EAE in Lewis rats, as compared with the MOG peptide (35–55) used previously.9,17 Both rrMOG protein and MOG peptide have been shown to be efficacious in inducing EAE lesions in the Lewis rat, although a longer time frame for induction is required with the MOG peptide.31–33 To validate using rrMOG protein rather than MOG peptide in the current study, we identified the MRI signature of the frrMOG-EAE model and compared this with our previous findings.9,17 Similar MRI signal changes were seen in animals immunized with rrMOG protein to those observed in MOG peptide-immunized animals previously.9,17 Furthermore, systemic challenge with LPS following resolution of the MRI-detectable signal changes, in the frrMOG-EAE model, resulted in similar increases in rCBV as observed previously.9,17 Thus, in the Lewis rat the MRI and histological changes induced by rrMOG or MOG peptide are comparable, which is not true of the EAE induced in C57BL6 mice. 34
Effect of AdIL-1β on Lesion Pathology
Peripheral administration of IL-1RA, the IL-1β receptor antagonist, has been shown to reduce peripheral inflammation in patients after stroke and also to protect against the effects of IL-1β in brain injury in rats. 35 In MS patients, the high levels of IL-1β in the CSF correlate with disease activity and progression. 21 These findings suggest a detrimental role for systemic IL-1β in neurological disease, and a negative impact of IL-1β in MS in particular. Histologically, systemic injection of AdIL-1β increased both the inflammatory activity and extent of demyelination of the frrMOG-EAE lesion, as evidenced by an increase in the number of macrophages and T cells within the lesions, together with demyelination in the corpus callosum and increased axonal injury. These findings are in accord with our previous studies showing that systemic injection of the bacterial endotoxin LPS increases the number of newly recruited lymphocytes (T and B cells) and macrophages/activated microglia to an fMOG-EAE lesion, together with increased demyelination. 9 Similarly, LPS systemic challenge leads to axon injury in EAE rats, as shown here following AdIL-1β challenge, and emphasizing the potential role of systemic inflammation in the deterioration of chronic MS lesions, which are responsible for the permanent disability in MS patients.14,36 Similar effects of AdIL-1β have been shown in a model of Parkinson's disease where central and systemic IL-1β expression exacerbates neurodegeneration in 6-OHDA-injected rats. 15
The data presented here suggest a role specifically for systemic IL-1β in lesion reactivation. Following systemic injection of AdIL-1β, increased systemic IL-1β may result in induction of a hepatic acute phase response and CXC-chemokine upregulation and these events, in turn, may increase numbers of circulating leukocytes.12,37 We have previously demonstrated that the adhesion molecules E- and P-selectin remain upregulated on the luminal surface of the endothelium within dormant EAE lesions. 9 In this study, significant expressions of these cell adhesion molecules were found around the blood vessels and in the parenchyma in the lesion side (e.g., P and L-selectin). Then, such on-going adhesion molecule expression may facilitate the extravasation of this increased pool of circulating leukocytes following induction of a systemic inflammatory response. Interestingly, recent studies have shown that experimental stroke in mice induces a systemic inflammatory response that precedes an inflammatory response in the brain, with a strong contributory role for the chemokine CXCL-1. 38 Other recent studies have shown that peripheral IL-1β challenge exacerbates injury via a mechanism that is neutrophil-dependent after experimental stroke in mice 11 and that microglia/macrophages, associated with EAE lesions in rat, respond to circulating cytokines, and produced in response to an inflammatory event lead to tissue damage and axon injury. 14
Effect of AdIL-1β on Magnetic Resonance Imaging Signal Changes To use clinically applicable measures of lesion reactivation rCBV, MTR and tissue water diffusion were measured by MRI over a 5-day period after injection of AdIL-1β, during which time systemic expression of IL-1β is maximal. 25 An acute increase in rCBV that resolved over the 5-day period was evident. This finding is in accord with the early increase in CBV observed following systemic LPS injection both in this study and our previous work in the fMOG-EAE model. 9 In the latter study, we demonstrated a close coupling between increased rCBV and new macrophage recruitment following systemic LPS injection. As previously suggested, this increase in rCBV may reflect a combination of processes such as reactivation of metabolically active leukocytes, local production of the vasodilator nitric oxide, and increased expression of local cytokines, which are known to induce blood vessel dilation by changing the expression of endothelial integrins. 39
At the same early time point as for the increase in CBV, an increase in ADC within the corpus callosum of frrMOG-EAE animals was apparent, but in this case it persisted throughout the time period studied. This increase in ADC was not associated with either an increase in T2 or BBB breakdown, suggesting that this reflects disruption of callosal integrity giving rise to less restricted diffusion, rather than frank vasogenic edema. In contrast to the CBV and ADC changes, a gradual decrease in MTR of the corpus callosum in frrMOG-EAE animals was apparent after AdIL-1β injection. Loss of MTR has often been linked to a reduction in the integrity of the macromolecular matrix, reflecting damage to myelin, or dilution of the macromolecules by inflammatory edema.40,41 However, in our previous studies we have demonstrated that changes in MTR precede the onset of demyelination observed in focal MOG-EAE animals and may report on the inflammatory processes leading to demyelination, rather than demyelination per se.9,17 As the changes in MTR observed here are progressive, it is possible that they reflect both inflammatory processes and demyelination. These early changes in ADC and MTR, in the absence of either T2 signal changes or breakdown of the BBB, suggest a greater sensitivity to CNS pathology than those two more commonly used approaches and spatially appeared to correlate with axonal injury observed after AdIL-1β reactivation. These findings suggest that ADC and/or MTR may provide an acute biomarker for axonal injury and warrants further investigation.
As mentioned above, BBB integrity remained intact throughout the 5-day period of MRI evaluation. This finding is in accord with our previous study in which LPS challenge induced lesion reactivation without any visible BBB breakdown. 9 Similarly, some clinical reports have suggested that peripheral infection does not alter the number of contrast-enhancing lesions in MS patients, 3 although the question of timing relative to onset of infection is likely to be critical in such assessment. However, gadolinium enhancement in the ipsilateral meninges, indicating breakdown of the blood–CSF barrier, was evident in the frrMOG-EAE animals. The B–CSF barrier (BCSFB) has a different composition and role to the BBB 42 and selective expression of cell adhesion molecules on the BCSFB has been reported during brain inflammation. 43 Although leukocytes can cross an intact BBB and BCSFB, breakdown of the BCSFB may facilitate presentation of chemokines and enhance recruitment to the meninges. It has been shown that systemic inflammation can alter BBB permeability through disruption of the tight junction protein, claudin-5, and the cerebrovascular basal lamina protein, collagen-IV, following stroke. 13 Thus, similar processes may underlie the current findings.
Effect of Interferon-β on AdIL-1β-Induced Reactivation of an Experimental Allergic Encephalomyelitis Lesion
The majority of MS patients display a relapsing-remitting form of disease that can be treated with one of four major medication regimes: Glatiramer acetate, Natalizumab, Mitoxantrone, and Interferons (interferon-β1α and β). However, response to treatment is highly variable, most likely because the efficacy of treatment is highly dependent on disease stage. 44 Nevertheless, patients treated with interferons display an 18–38% reduction in the rate of MS relapses, and the progression of disability in MS patients is delayed.45,46 Here, we have used therapeutic doses of IFN-β to determine whether this therapy can combat the effect of systemic AdIL-1β-induced inflammation on quiescent CNS lesions. Multiple beneficial effects of IFN-β were observed including the amelioration of AdIL-1β induced increases in macrophage recruitment, the extent of demyelination, in rCBV and ADC, and maintenance of BCSFB integrity. These findings suggest that IFN-β may be highly effective in reducing the likelihood of relapse as a consequence of systemic infection in MS patients. Moreover, these data indicate the sensitivity of the less conventional MRI indices, CBV and ADC, to the outcome of therapeutic intervention.
In conclusion, we have shown that quiescent frrMOG-EAE lesions can be reactivated by systemic administration of either bacterial or viral agents. Although induction of systemic IL-1β will induce a plethora of other proinflammatory molecules, our findings indicate that upregulation of IL-1β is sufficient to induce a systemic response that will cause relapse in MS-like lesions. Our data indicate the potential for intervening therapeutically in this reactivation process with an approved MS therapy, and the sensitivity of CBV and ADC MRI mapping for detecting both reactivation and therapeutic efficacy.
DISCLOSURE/CONFLICT OF INTEREST
The authors declare that they have no conflict of interest.
Footnotes
ACKNOWLEDGEMENTS
The authors thank Dr Yanyan Jiang, Dr Sandra Campbell, and Dr Alexandre Khrapitchev for technical assistance and Dr Jane Relton (Biogen Idec, Boston) for kindly supplying the IFN-β.
References
Supplementary Material
Please find the following supplemental material available below.
For Open Access articles published under a Creative Commons License, all supplemental material carries the same license as the article it is associated with.
For non-Open Access articles published, all supplemental material carries a non-exclusive license, and permission requests for re-use of supplemental material or any part of supplemental material shall be sent directly to the copyright owner as specified in the copyright notice associated with the article.