Vascular transit time is an important indicator of microcirculatory health. We present a second-order-plus-dead-time (SOPDT) model for robust estimation of kinetic parameters characterizing microvascular bolus passage using two-photon fluorescence microscopy (2PFM) in anesthetized rats receiving somatosensory stimulation. This methodology enables quantification of transit time, time-to-peak, overshoot, and rate of bolus passage through the microvascular network. The overall transit time during stimulation, of 2.2±0.1 seconds, was shorter (P∼0.0008) than that at rest (2.7±0.2 seconds). When compared with conventional γ-variate modeling, the SOPDT modeling yielded better quality of fit both at rest (P<0.0001) and on activation (P<0.001).
Although bolus tracking two-photon fluorescence microscopy (2PFM) is not widely used, bolus passage kinetic parameter estimation from 2PFM data has been reported using γ-variate modeling (Hutchinson et al, 2006; Lindvere et al, 2010; Stefanovic et al, 2008). Unlike forementioned modalities, 2PFM bolus tracking affords mapping of transit times on the level of individual cerebral microvessels. Depending on the cortical depth imaged, a single 2PFM bolus tracking time series (with field-of-view of ∼500 by 500 μm2 yields data on 10 to 20 cortical vessels at a time). The total number of such time series that may be acquired in a single experimental session is limited by the intravascular half-life of the fluorescent contrast agent(s) used and the total volume that can be administered to the animal. The 2PFM bolus tracking data may be used as the first step toward micron scale mapping of perfusion, a parameter of great importance for characterizing tissue state. The current work introduces the second-order-plus-dead-time (SOPDT) modeling approach for robust estimation of bolus passage kinetic parameters using intravital 2PFM in anesthetized rats at rest and during electrical forepaw stimulation. Relative to conventional γ-variate fitting, SOPDT analysis resulted in improved fitting accuracy, ability to fit greater number of vessels, and tighter confidence intervals on parameter estimates. Detailed characterization of bolus passage kinetics is thus achieved in addition to improved quality of fits when compared with γ-variate modeling.
Materials and methods
Animal Preparation
All experimental procedures in this study were approved by the Animal Care Committee of the Sunnybrook Health Sciences Centre, which adheres to the Policies and Guidelines of the Canadian Council on Animal Care and meets all the requirements of the Provincial statute of Ontario, Animals for Research Act as well those of the Federal Health of Animals Act. A series of bolus tracking experiments, as described below, were conducted in male Sprague Dawley rats (N=5, body weight=140±45 g). The surgical procedures have been described in detail previously (Lindvere et al, 2010). Briefly, the rats were anesthetized with isoflurane (5% induction and 3% maintenance) during surgical preparation and intravenous α-chloralose (80 mg/kg initial bolus, followed by constant infusion of 27 mg/kg per hour) during imaging, orally intubated, and mechanically ventilated. The right femoral artery, femoral vein, and tail vein were cannulated for blood gas analysis, and administration of anesthesia and fluorescent agents, respectively. Stereotaxic surgery was performed to prepare a small (4 mm × 3 mm), closed (1% agarose and coverslip) cranial window over the forelimb representation in the primary somatosensory cortex. Stimulation electrodes were inserted between the second and third forepaw digits contralateral to craniotomy to allow delivery of somatosensory stimuli. Physiological monitoring was conducted throughout these experiments as described earlier (Lindvere et al, 2010) and included monitoring and recording of rectal temperature, heart rate, oxygen saturation, end tidal respiratory pressure, as well as arterial blood pressure (via the femoral artery catheter). Blood gas analysis was performed periodically and adjustment made as needed to ensure physiological stability throughout the experiments. Across all animals, the mean (± standard deviation) blood gas values were 7.37±0.02 (pH), 38.4±2.0 mm Hg (pCO2), and 102.0±3.4 mm Hg (pO2).
Data Acquisition
Two-photon fluorescence microscopy was performed on a twin FV 1000 Multi Photon Excitation Microscope (Olympus Corp., Tokyo, Japan) using a water immersion objective (25 ×, 1.05NA, 2 mm working distance). Texas Red dextran (70 kDa, Life Technologies Inc, Burlington, ON, Canada) was administered manually through the tail vein catheter (four 50-μL bolus injections, 5 mg/kg body weight each; for a total delivered volume of ∼2.4% of animal's total blood volume): its intravascular half-life has been estimated at ∼25 minutes. The excitation wavelength was 810 nm; the emission filter bandwidth spanned 570 to 620 nm; and the detector high voltage and offset were set at 600 to 700 V and 8 to 9 V. To measure the vascular transit time, the bolus passage was imaged by acquiring a time series of a single ∼300 × 300 μm2 slice, ∼50 μm below the cortical surface, at 0.31±0.07 seconds per frame, with a nominal in-plane resolution of 1.59 μm/pixel. The bolus tracking acquisition plane was restricted to shallow cortical depths to maximize the length and number of paths interconnecting the supplier and drainer vessels of the imaged field-of-view and thus maximize the size of the vascular territories irrigated by these vessels. This acquisition was performed at rest and during presentation of a block of 30 electrical pulses, 2 mA in amplitude, 0.3 ms in duration, delivered to the contralateral forepaw at 3 Hz, with no significant difference in the contrast-to-noise ratio of the first and second bolus tracking acquisition (P∼0.13). The forepaw stimulation was triggered to start 20 seconds after the commencement of the imaging and the bolus was injected 3 seconds after the start of the stimulation. Neither bolus administration nor forepaw stimulation had any effect on arterial blood pressure in any subject, in agreement with prior work.
Data Analysis
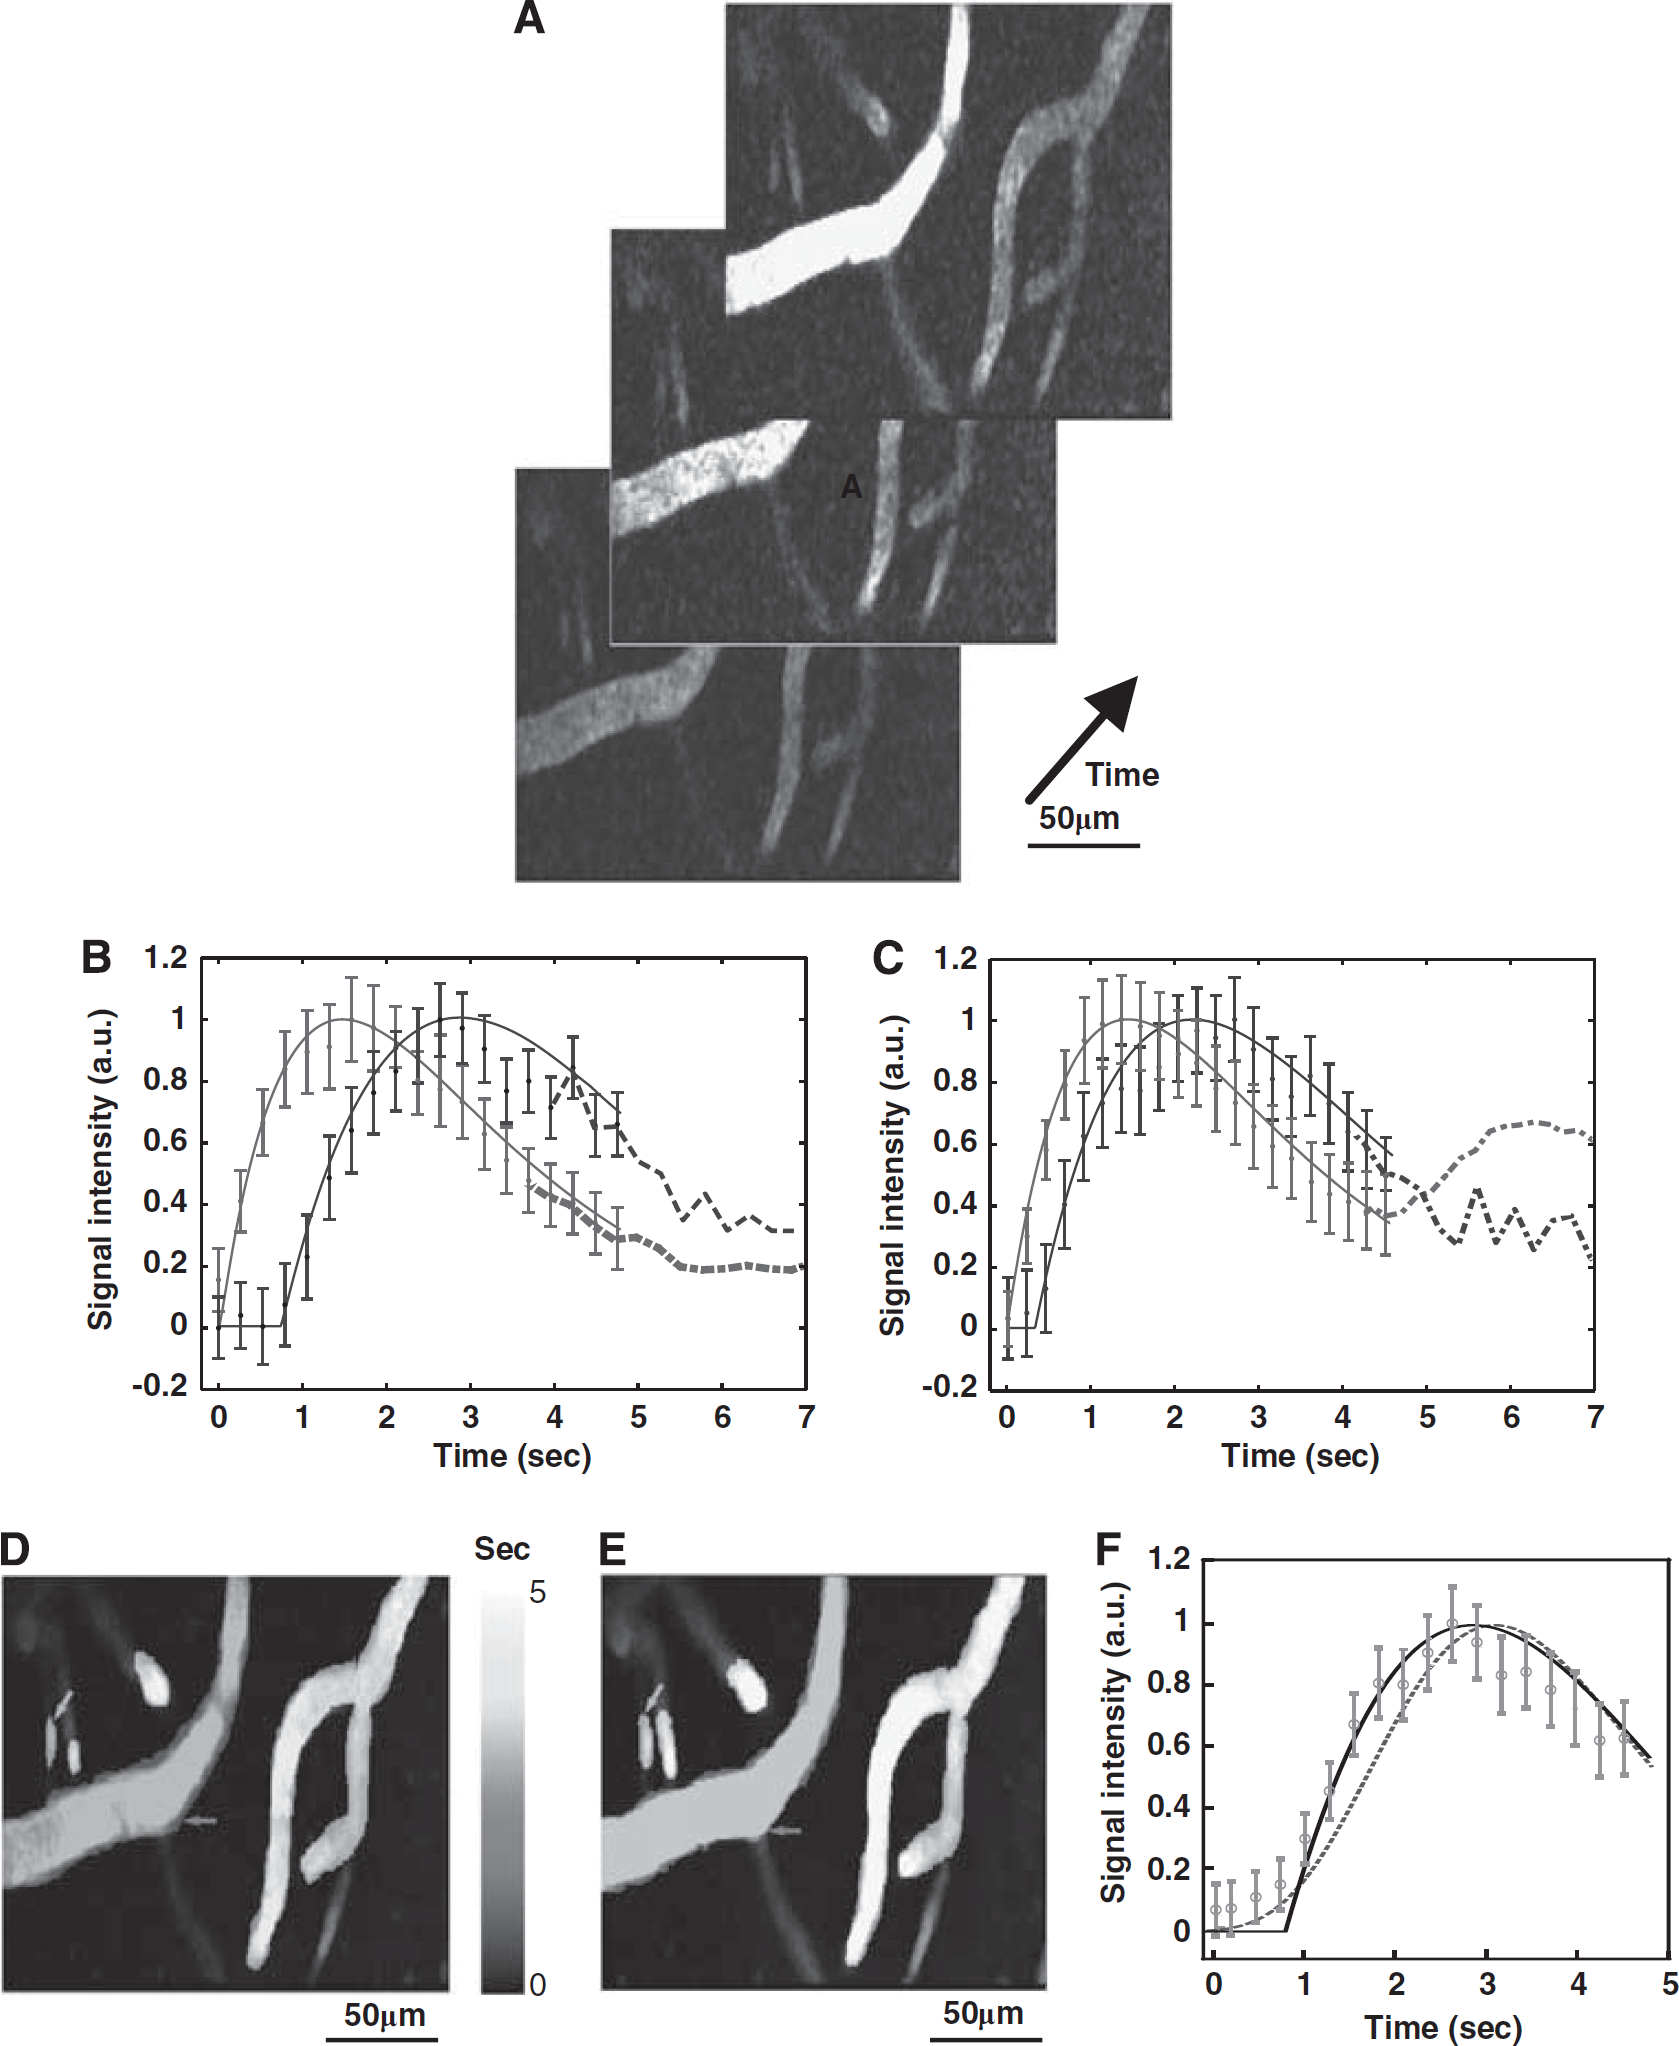
Each bolus time series (see Figure 1A for a sample subject) was 2D median filtered (3 × 3 pixel kernel in x and y). Maximum intensity projection along time was next performed and the resulting 2D image used for semiautomatic segmentation of vessels (Montreal Neurological Institute-Display). For every vessel thus identified (N=28 in total), the corresponding average vessel signal intensity time series was computed, normalized to the peak signal intensity, and integrated over time. The temporal window for modeling has been restricted to the first passage of the bolus, thus avoiding the modeling the recirculation effects: the length of the temporal window used for modeling hence ranged from 5 to 10 seconds.
(A) Sample frames from a bolus passage time series acquired ∼50 μm below the cortical surface in the forelimb representation of the primary somatosensory cortex of an α-chloralose anesthetized rat using two-photon fluorescence microscopy (2PFM). Representative signal intensity time series (mean±95% confidence interval based on signal variation within a vessel) along with second-order-plus-dead-time (SOPDT) model fits for two vessels at rest (B) and during activation (C). The stimulation was triggered to start 20 seconds after the commencement of the imaging and the bolus was injected 3 seconds after the start of the stimulation; however, the first ∼25 seconds of the raw data acquisition are not shown. The stimulation was thus presented throughout the interval shown in (C) and the bolus was administered ∼2 seconds before time 0 second in (C). Time ‘0’ corresponds to the time of the minimum onset time in the imaged slice. The vessels of the bolus tracking plane colored by transit time at rest (D) and during activation (E). The arrows are colored to indicate the vessels corresponding to the data shown in (B) and (C): red arrow points to an artery and blue, to a vein. The transit time for each vessel is estimated from equation (3) and is relative to the first observation of contrast agent in the imaged slice. (F) Representative time intensity curve (mean±95% confidence interval) along with the SOPDT fit (solid black line) and γ-variate fit (purple dashed line). Error bars represent 95% confidence intervals based on the signal variation within a vessel. The color reproduction of this figure is available on the Journal of Cerebral Blood Flow and Metabolism journal online.
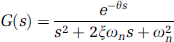
The SOPDT linear dynamic model (Rangiah and Krishaswamy, 1994) was used to evaluate the transient characteristics of the bolus passage through a vessel. The SOPDT model is characterized by dead time (θ), damping ratio (ξ), and natural frequency (ωn). The Laplace domain transfer function of the model is given as
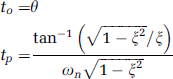
The system response, G(s), is dictated by the roots (eigenvalues) of the denominator of equation (1). A higher damping ratio (ξ) is associated with better performance, or less oscillation. The natural frequency (ωn) reflects the responsiveness of the underlying microvasculature, with a higher natural frequency indicative of faster response. The dead time (θ) determines the latency of the response. To assess the goodness of fit, we computed the percentage of the output variation explained by the model (compare, Matlab, Mathworks) and calculated Akaike′s Final Prediction Error and Akaike′s Information Criterion (fpe, aic, Matlab, Mathworks). While we attempted fitting of data from each vessel in the bolus tracking plane, only those vessels that yielded robust fit quality and bolus passage kinetics parameter estimates have been included in the report. The time-to-peak tp and onset time to were next estimated from:
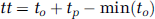
Finally, the sum of onset and peak time was used to normalize the apparent bolus time arrival in the imaged slice so as to produce estimates of vascular transit times (tt):
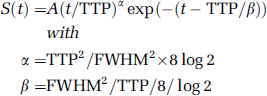
To enable comparison with the conventional bolus tracking data analysis, we also performed modeling of the measured vessel signal intensity time series using a γ-variate function:
where A is a scaling constant; TTP is time-to-peak; FWHM is full width at half maximum; and t is time (Stefanovic et al, 2008).
Statistical Analysis
Linear mixed effect modeling (lme and ANOVA, R) was used to investigate the effects of stimulation on transit time, TTP, natural frequency, and damping ratio (fixed effects), while treating subjects and vessels within subjects as random effects. This modeling produces sensible restricted maximum likelihood estimates from the unbalanced allocation of subjects and vessels by factor (Pinheiro and Bates, 2000). Two-sample F test (vartest2, Matlab) was used to probe for equality of variances.
Results
Second-Order-Plus-Dead-Time Modeling
The time series data along with the fitted signal intensity curves of two vessels in a representative subject are shown in Figures 1B (rest) and 1C (activation). Figures 1D and 1E show these vessel segments colored by their transit time estimates at rest and during activation, respectively. Compared with arteries, the veins were characterized by longer transit time, onset time, and TTP, as well as higher natural frequency and lower damping ratio. Across all subjects, the mean quality of fit score for the SOPDT modeling was 98±0% both at rest and during activation, with no significant difference in the quality of fits between the two states (P∼0.50).
Stimulation-induced changes in transit time and time-to-peak
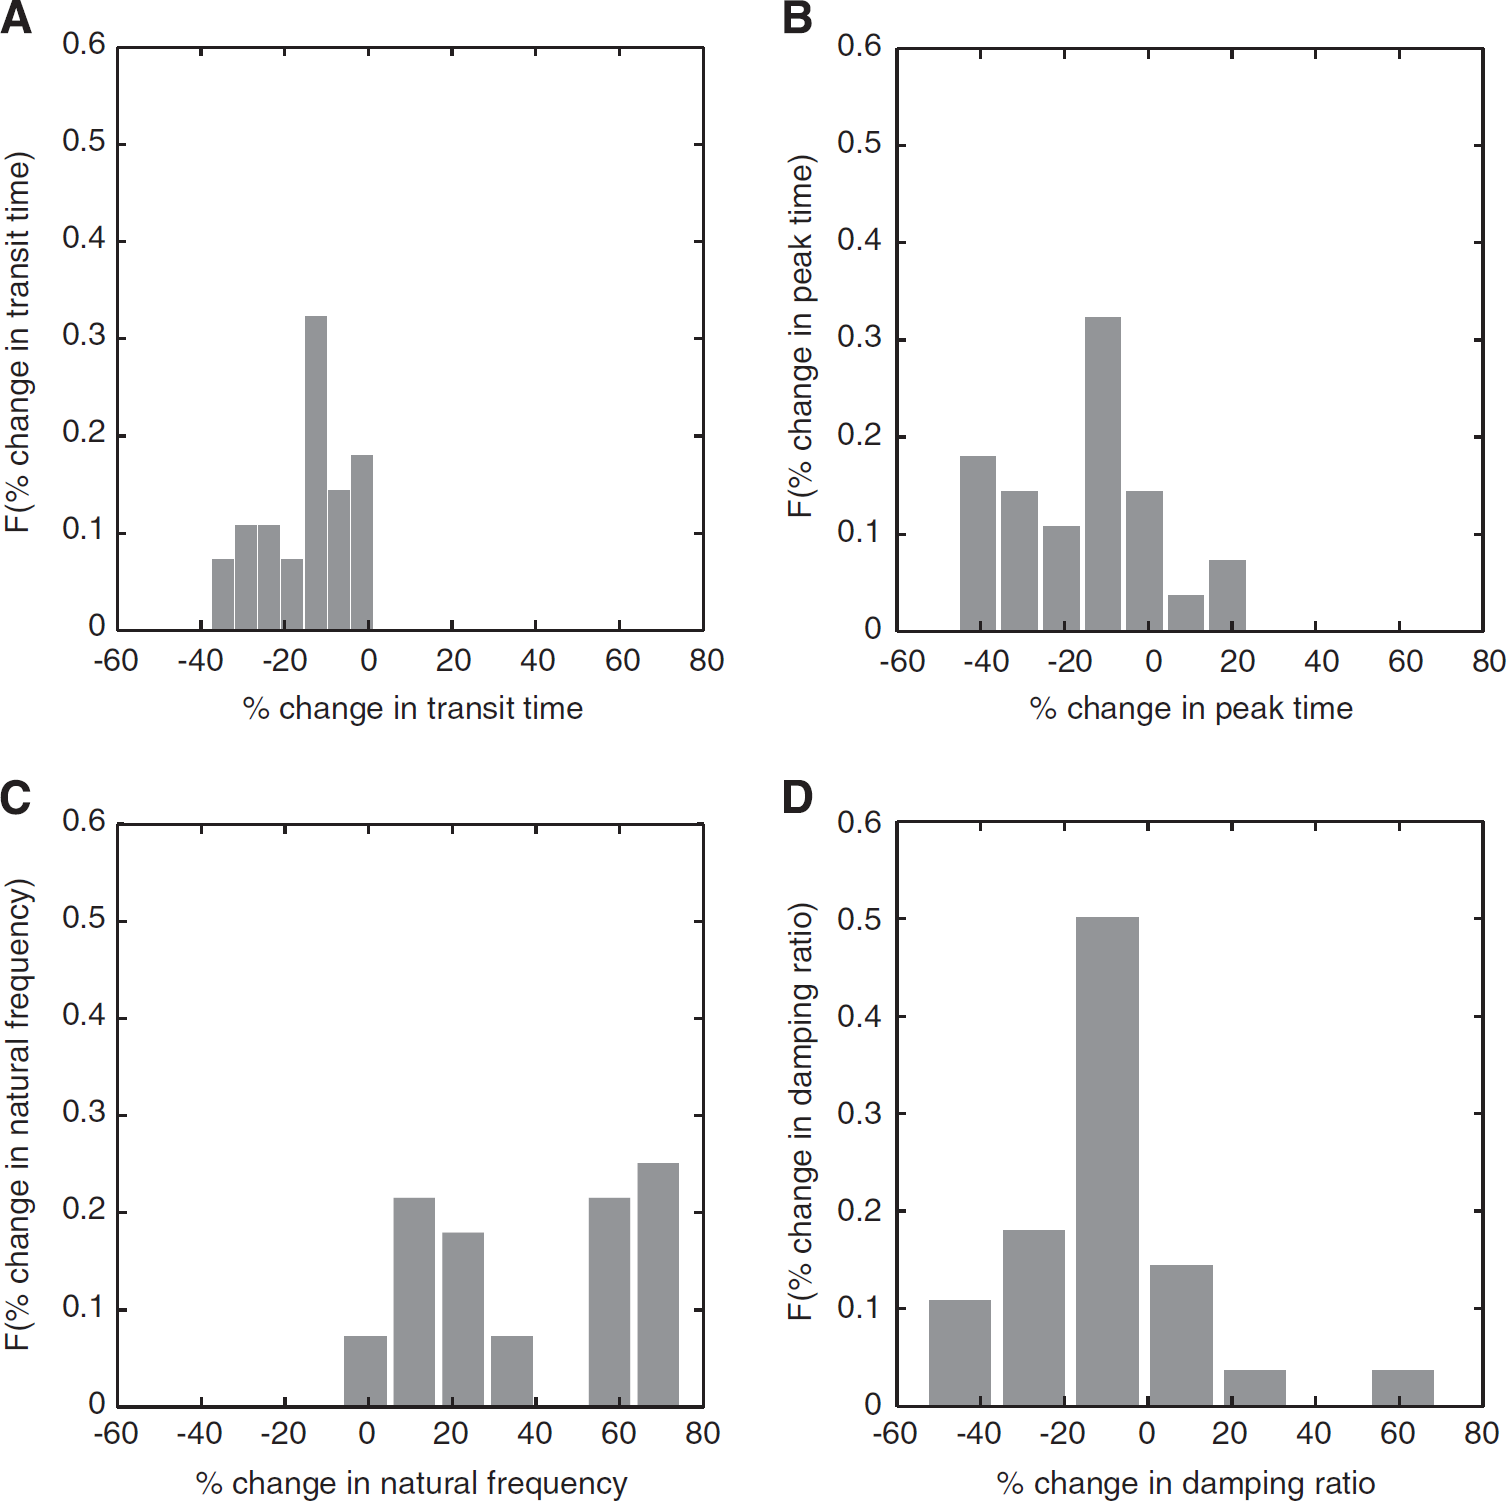
The transit time was significantly shorter during activation (P∼0.0008), with the mean transit time of 2.7±0.2 seconds at rest and 2.2±0.1 seconds during activation. The TTP was also significantly shorter during activation (P∼0.006), with the mean TTP of 1.8±0.1 seconds at rest and 1.5±0.6 seconds during activation. To probe for vessel type-specific stimulation-induced changes in the transit time and TTP, we classified, whenever possible, the imaged vessels as arterioles (N=11) or venules (N=13), based on their morphological features and the delayed bolus passage arrival in venules relative to arterioles. We found no significant difference between the two vessel types in terms of their respective stimulation-induced changes in transit time (P∼0.17) and TTP (P∼0.22). Figures 2A and 2B thus show the distribution, across all vessels, of stimulation-induced changes in the transit time and TTP, respectively. Distribution-wise, for ∼92% of the vessels, the transit time decreased on activation with a mean stimulation-induced decrease in transit time of 16±2%; the balance 8% of the vessels showed a mean increase in transit time of 0.8±0.5%. Stimulation-induced decrease of TTP was observed in 82% of the vessels (mean 32±4%), while 18% of the vessels exhibited an increase in TTP (mean 24±9%). Furthermore, there was a significant decrease in the variance of the TTP (P∼0.0026) during activation relative to baseline. The TTP variance was σR=0.2 seconds2 at rest and σA=0.1 seconds2 during activation.
(A) Stimulation-induced change in transit time in the imaged vessels. In 92% of the vessels, the mean decrease in transit time relative to resting state was 16±2%; in the remaining 8% of the vessels the mean increase in transit time was 0.8±0.5%. (B) Stimulation-induced change in time-to-peak. In 82% of the vessels, the time-to-peak decreased (32±4%) relative to resting state; in the remaining 18% of the vessels, the time-to-peak increased (24±9%). (C) Stimulation-induced change in natural frequency (rate of bolus passage) in the imaged vessels. In 92% of the vessels, the mean increase in natural frequency relative to resting state was 106±14% and for the 8% of the vessels the mean decrease in natural frequency was 10±2%. (D) Stimulation-induced change in damping ratio (signal overshoot) in the associated vessels. Approximately 78% of the vessels showed decrease in damping ratio with mean decrease of 18±3%; the mean increase in damping ratio in the remaining vessels was 20±10%.
Stimulation-induced changes in natural frequency and damping ratio
For 92% of the vessels, the natural frequency increased on activation (Figure 2C), with a mean increase of 106±14%; the remaining 8% of the vessels showed decrease in the natural frequency, with a mean of 10±2%. The stimulation induced a decrease in damping ratio in 78% of the vessels (with a mean of 18±3%), while the balance 22% of the vessels exhibited stimulation-elicited increase in the damping ratio (mean 20±10%), with the distribution of changes shown in Figure 2D. The mean damping ratio was significantly smaller (P∼0.016) during activation (0.59±0.03) relative to rest (0.68±0.03). The mean natural frequency was significantly higher (P∼0.0001) at activation (0.0114±0.0004 rad/s) relative to rest (0.0085±0.0004 rad/s). We observed no stimulation-induced change in the variance in either the natural frequency (P∼0.14) or the damping ratio (P∼0.53). As before, there was no difference in stimulation-induced changes in either the natural frequency (P∼0.60) or damping ratio (P∼0.52) in arterioles versus those in venules.
Gamma-Variate Modeling
Figure 1F shows sample time series data along with the SOPDT (solid black) and γ-variate (dashed purple) fitted signal intensity curves. Gamma-variate modeling did not show significant stimulation-induced decrease in the transit times (P∼0.082), with the transit time of 2.8±0.2 seconds at rest and 2.7±0.2 seconds during activation. Compared with respective parameters obtained from SOPDT modeling, the transit time estimates obtained via γ-variate fitting were significantly higher both at rest (P∼0.0001) and during activation (P∼0.0001). The quality of the γ-variate fit, however, was significantly lower (P∼0.0001) both at rest and during activation (P∼0.001) when compared with the SOPDT modeling, with the mean quality of the fit score of 80±2% both at rest and during stimulation and no significant difference in the quality of fits between the two states (P∼0.94).
Discussion
The present work applied linear dynamical systems methodology to provide robust estimation of hemodynamic parameters using bolus tracking data obtained from 2PFM. The SOPDT modeling enabled quantification of the vascular transit times and their changes on functional activation. Consistent with visual inspection of the respective fits, the root mean square error of SOPDT model fits was significantly lower than that of the conventional γ-variate model fits both at rest and during activation. Thus, SOPDT modeling provided improved quality of fit irrespective of the state. Moreover, SOPDT modeling also afforded additional characterization of the bolus passage, in terms of signal overshoot (reflected in the damping ratio), and the rate of bolus passage (assessed via the natural frequency) through the microvessels in each state.
Using SOPDT modeling, the transit time shortening induced by the 10-second electrical forepaw stimulation was estimated at 0.4±0.2 seconds (mean±95% confidence interval). This estimate agrees well with ∼0.5 seconds transit time shortening previously reported in the same animal model using 60-second long electrical forepaw stimulation (Stefanovic et al, 2008). Moreover, the presently observed ∼25% decrease in transit time dispersion on contralateral forepaw stimulation is comparable to the previous report of whisker barrel deflection eliciting a decrease of up to 17% (relative to the ipsilateral cortex) in the heterogeneity of capillary plasma perfusion in the contralateral whisker barrel cortex (Vogel and Kuschinsky, 1996). Although not typically reported, the shortening of the TTP and an increase in the rate of bolus passage, as observed presently, are also consistent with the expected increase in local perfusion pressure and blood flow during activation. Although physiological interpretation of signal overshoot is challenging (Trillenberg et al, 2008), there is evidence in the literature of an overshoot in the cerebral blood flow on sustained stimulation (Hoge et al, 1999) in broad agreement with the present observation of stimulation-induced increase in signal overshoot with activation.
In addition, present transit time estimates at rest are also consistent with the plasma transit times in α-chloralose anesthetized Sprague Dawley rats as reported by Masamoto et al, of 1.8±1.3 seconds and in chloral hydrate anesthetized adult Wistars as measured by Shockley and LaManna (1988). They are also in good agreement with Schiszler et al's estimate of 2.11±0.67 seconds in pentobarbital anesthetized Sprague Dawleys (Schiszler et al, 2000), particularly in light of the different anesthesia protocols, which are known to affect both microvascular caliber and flow (Masamoto et al, 2010). While the present technique affords quantification of the plasma transit times only, given the small caliber and limited variation of calibers (and thus hematocrits) of the microvessels comprising the vascular paths interconnecting the imaged vessels, limited difference (∼25%) in transit times of serum and red blood cells across these vascular paths is expected (Lipowsky and Zweifach, 1978).
Of note, while the field-of-view imaged in these studies has been defined by stereotaxic placement of the cranial window, there is considerable intersubject variability in the microvascular topology and stereotaxic coordinates of the center of mass of the cortical region activated by the forepaw stimulation. Therefore, the variation in transit time changes induced by forepaw stimulation in the imaged vasculature is affected by variations in imaged vessel caliber and type, and the variability in the length, number, and caliber of vessels comprising the vascular paths interconnecting the imaged vessels, as supported by the dispersion of microvascular flow velocity reported earlier (Tomita et al, 2011). It is also affected by the distances—not only Euclidian (as suggested by the progressive decrease in mean red blood cell flux in capillaries located at greater distances away from the bicuculline infusion site; Hirase et al, 2004) and along vascular tree—of these vascular paths from the foci of activation. The latter variability is suggested by observations of blood flow velocity variations along the hierarchical microvascular network in the parietal cortex of urethane anesthetized Sprague Dawley rats (Nguyen et al, 2011).
This work introduces a useful method for quantifying hemodynamic parameters using bolus tracking data obtained with intravital 2PFM. It also affords a means of examining stimulation-induced changes from a dynamical system point of view on the network level and at the level of individual microvessels, of interest in studies of the cellular mechanisms underlying compromises in cerebral microcirculation and, broadly, the micrometer-scale relationship between vascular structure and function in health and disease.
Footnotes
Acknowledgements
The authors are grateful to Adrienne Dorr for assistance in collecting the data.
Disclosure/conflict of interest
The authors declare no conflict of interest.
References
1.
BennerTHeilandSErbGForstingMSartorK (1997) Accuracy of gamma-variate fits to concentration-time curves from dynamic susceptibility-contrast enhanced MRI: influence of time resolution, maximal signal drop and signal-to-noise. Magn Reson Imaging15:307–17.
2.
CalamanteFGadianDConnellyA (2002) Quantification of perfusion using bolus tracking magnetic resonance imaging in stroke: assumptions, limitations, and potential implications for clinical use. Stroke33:1146–51.
3.
EvansRL (1959) Two comments on the estimation of blood flow and central volume from dye-dilution curves. J Appl Physiol14:457.
4.
GrunerRTaxtT (2006) Iterative blind deconvolution in magnetic resonance brain perfusion imaging. Magn Reson Med55:805–15.
5.
HiraseHCresoJBuzsákiG (2004) Capillary level imaging of local cerebral blood flow in bicuculline-induced epileptic foci. Neuroscience128:209–16.
6.
HogeRAtkinsonJGillBCrelierGMarrettSPikeG (1999) Stimulus-dependent BOLD and perfusion dynamics in human V1. Neuroimage9:573–85.
7.
HutchinsonEBStefanovicBKoretskyAPSilvaAC (2006) Spatial flow-volume dissociation of the cerebral microcirculatory response to mild hypercapnia. Neuroimage32:520–30.
8.
KershawLChengH (2011) A general dual-bolus approach for quantitative DCE-MRI. Magn Reson Imaging29: 160–166.
LindvereLDorrAStefanovicB (2010) Two-photon fluorescence microscopy of cerebral hemodynamics. Cold Spring Harb Protoc; advance online publication, 1 September 2010; pdb.prot5494; doi: 10.1101/pdb.prot5494.
11.
LipowskyHZweifachB (1978) Application of the “two-slit” photometric technique to the measurement of microvascular volumetric flow rates. Microvasc Res15: 93–101.
12.
MasamotoKObataTKannoI (2010) Intracortical microcirculatory change induced by anesthesia in rat somatosensory cortex. Adv Exp Med Biol662:57–61.
13.
NguyenJNishimuraNFetchoRIadecolaCSchafferC (2011) Occlusion of cortical ascending venules causes blood flow decreases, reversals in flow direction, and vessel dilation in upstream capillaries. J Cereb Blood Flow Metab31:2243–54.
14.
PinheiroJCBatesDM (2000) Mixed-Effects Models in S and S-PLUS. Springer Verlag: New York, NY.
15.
RangiahGKrishaswamyP (1994) Estimating second-order plus dead time model parameters. Ind Eng Chem Res33:1867–71.
16.
ReichenbachJRötherJJonetz-MentzelLHerzauMFialaAWeillerCKaiserW (1999) Acute stroke evaluated by time-to-peak mapping during initial and early follow-up perfusion CT studies. AJNR Am J Neuroradiol20: 1842–1850.
SchiszlerITomitaMFukuuchiYTanahashiNInoueK (2000) New optical method for analyzing cortical blood flow heterogeneity in small animals: validation of the method. Am J Physiol Heart Circ Physiol279:H1291–8.
19.
ShockleyRLaMannaJ (1988) Determination of rat cerebral cortical blood volume changes by capillary mean transit time analysis during hypoxia, hypercapnia and hyperventilation. Brain Res454:170–8.
TomitaYPinardETran-DinhASchiszlerIKubisNTomitaMSuzukiNSeylazJ (2011) Long-term, repeated measurements of mouse cortical microflow at the same region of interest with high spatial resolution. Brain Res1372:59–69.
22.
TrillenbergPEggersJSteffenJSeidelG (2008) Reliability of modeling evoked flow responses. Ultraschall Med29:611–7.
23.
VogelJKuschinskyW (1996) Decreased heterogeneity of capillary plasma flow in the rat Whisker-barrel cortex during functional hyperemia. J Cereb Blood Flow Metab16:1300–6.