
Abstract
Cerebral hemodynamics fluctuates spontaneously over broad frequency ranges. However, its spatiotemporal coherence of flow oscillations in cerebral microcirculation remains incompletely understood. The objective of this study was to characterize the spatiotemporal fluctuations of red blood cells (RBCs) and plasma flow in the rat cerebral microcirculation by simultaneously imaging their dynamic behaviors. Comparisons of changes in cross-section diameters between RBC and plasma flow showed dissociations in penetrating arterioles. The results indicate that vasomotion has the least effect on the lateral movement of circulating RBCs, resulting in variable changes in plasma layer thickness. Parenchymal capillaries exhibited slow fluctuations in RBC velocity (0.1 to 0.3 Hz), regardless of capillary diameter fluctuations (<0.1 Hz). Temporal fluctuations and the velocity of RBCs decreased significantly at divergent capillary bifurcations. The results indicate that a transit of RBCs generates flow resistance in the capillaries and that slow velocity fluctuations of the RBCs are subject to a number of bifurcations. In conclusion, the high-frequency oscillation of the blood flow is filtered at the bifurcation through the capillary networks. Therefore, a number of bifurcations in the cerebral microcirculation may contribute to the power of low-frequency oscillations.
Keywords
Introduction
Cerebral hemodynamics fluctuates spontaneously over broad ranges of frequency spectra. 1 Factors contributing to hemodynamic fluctuations include systemic cardiac and respiratory rhythms 2 and other low-frequency spontaneous oscillations (such as Mayer waves and B-waves 3 and/or cerebral vasomotion 4 ). The latter low-frequency oscillations have been widely used for functional connectivity analysis of whole brains using resting-state functional magnetic resonance imaging (rs-fMRI) 5 and near-infrared spectroscopy (NIRS). 6 Previous studies with simultaneous measurements of neuronal activity and cerebral hemodynamics consistently have shown close resting neurovascular coupling at low-frequency oscillations.7–13 However, care should be exercised when interpreting hemodynamic signals because systemic and cerebrovascular components, other than neural origins, can be implicated in the cause of spontaneous low-frequency hemodynamic oscillations. 14
Vasomotion is governed by sympathetic nerve activity with spatially coincident intracellular calcium signaling in vascular smooth muscle cells. 15 The envelope of the high-frequency gamma band of neural activity also superimposed arterial vasomotion and hemodynamic oscillations in the mouse cortex. 16 The low-frequency oscillation of cortical hemodynamics was decreased in patients with cerebral microangiopathy, possibly due to increased vessel rigidity. 17 Normal vasomotion is essential for maintaining brain health, particularly by drainage of clearance, which is impaired in cerebral amyloid angiopathy. 18 Although these previous studies have supported the view that low-frequency hemodynamic oscillation is primarily induced by arterial vasomotion, little is known about the spatial and temporal coherence of downstream changes in capillary flow.
Capillaries (e.g., vessel less than 8 μm in diameter) constitute more than 50% of the parenchymal microvasculature and thus significant compartments determining cerebral blood flow (CBF) in the parenchyma.19,20 Capillary flow spontaneously varies at low frequency (∼0.1 Hz) and responds to the neuronal activity evoked.21,22 Recent studies have shown that capillaries are involved in functional hyperemia in neurovascular coupling (for reviews23–25). Importantly, capillary flow depends on a number of factors, including plasma viscosity, viscoelastic properties of blood cells, and the biochemical and mechanical interactions of blood cells with the endothelial surface.26,27 It is therefore needed to better understand the interactions at the cellular level between blood cells and vascular cells, as well as reliable measurements of capillary dimensions, to elucidate the mechanisms of regulation of cerebral microcirculation.
The aim of the present study was to characterize the spatiotemporal fluctuations in blood plasma and blood cell flow in the cerebral microcirculation. To separately analyze blood plasma and cell flow dynamics, transgenic rats were used that expressed fluorescent proteins in the membranes of red blood cells (RBCs). 28 Sulforhodamine 101-labeled blood plasma and fluorescent RBCs were simultaneously imaged using two-photon microscopy. First, the temporal variation of vessel diameters was compared for penetrating arterioles and ascending venules by measuring the width of the RBC and plasma flow. Next, temporal fluctuations of capillary diameters and RBC velocity was investigated at the bifurcation of parenchymal capillaries (<8 µm in diameter) to determine the spatiotemporal coherence of RBC velocity and diameter fluctuations.
Material and methods
Animal preparations
Animal use and experimental protocols were approved by the institutional Animal Ethics Committee of National Institute of Radiological Sciences and the University of Electro-Communications, and all of the experimental procedures were in accordance with guidelines set by the Institutes for the Humane Care and Use of Laboratory Animals in compliance with the ARRIVE guidelines (i.e., ARRIVE guidelines 2.0). 29 A total of 13 adult (9 to 21 months old) male/female kikGR-RBC transgenic rats (248 ± 73 g) in which the membrane of RBCs expressed fluorescence protein 28 were used for the experiments (Figure 1(a)).
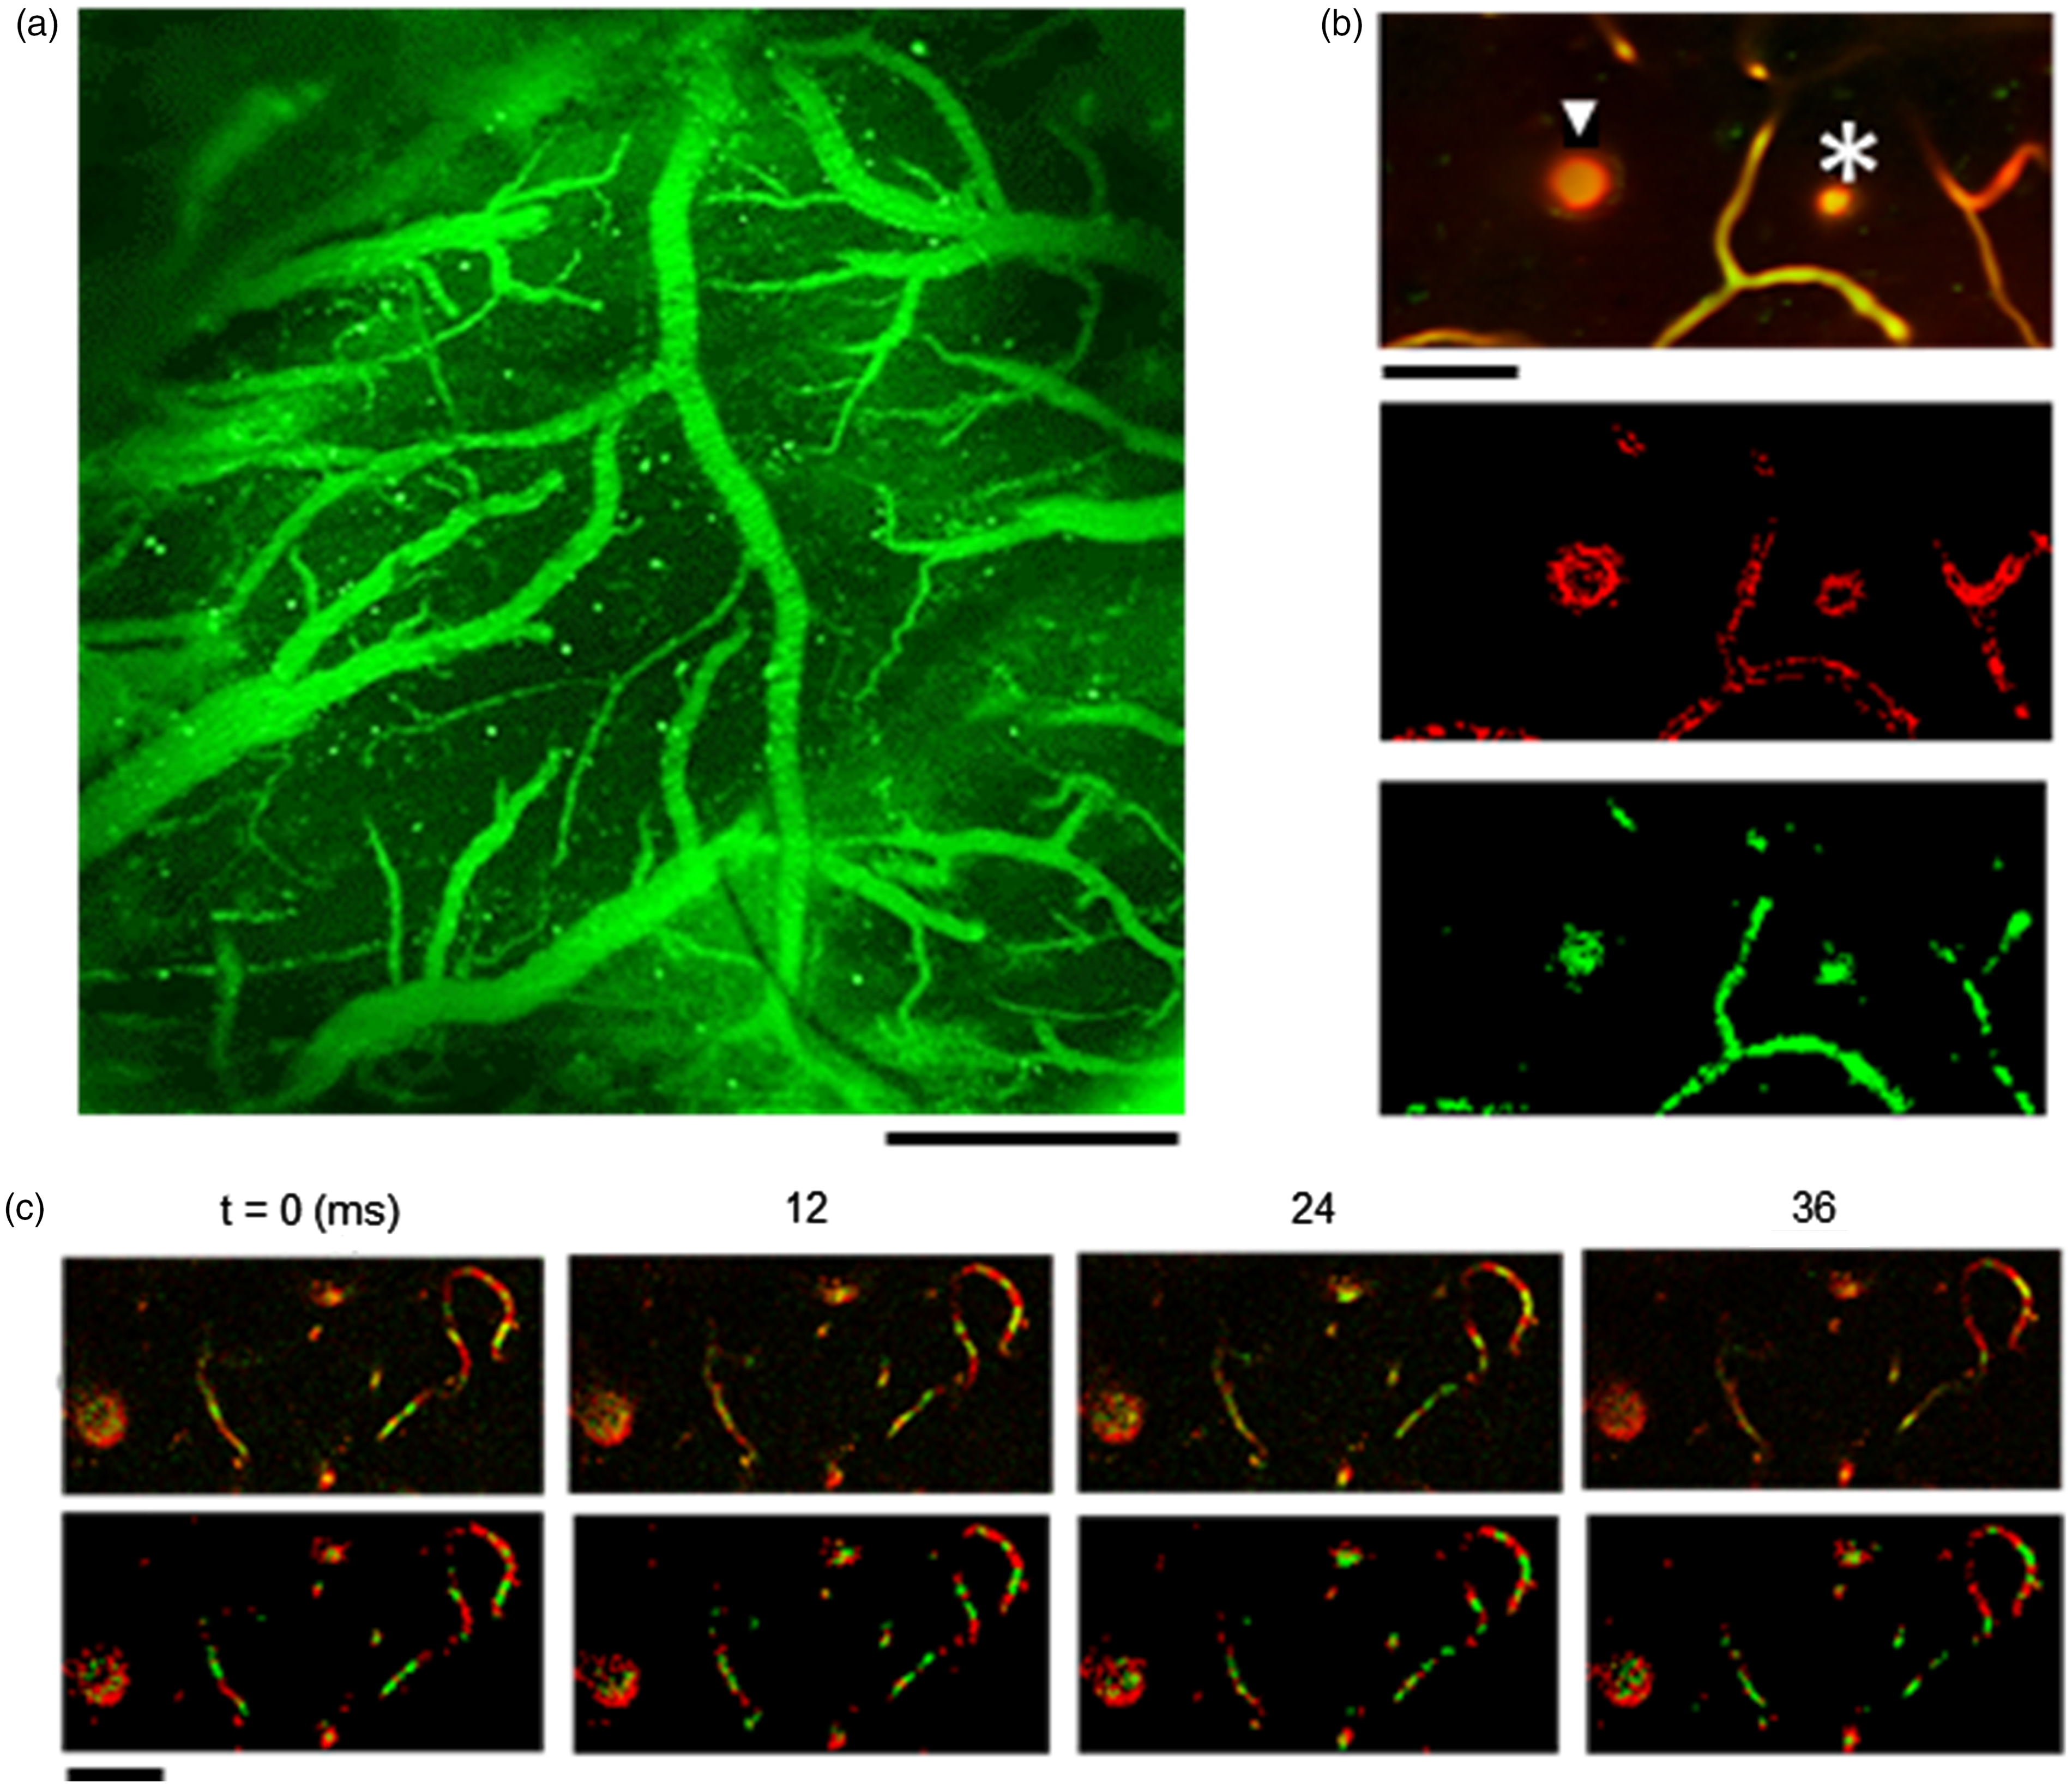
Simultaneous imaging of fluorescent RBCs and blood plasma in the anesthetized rat cortex. (a) Cortical surface image of fluorescent RBCs (green) through a coverglass over the exposed cortex using confocal laser scanning fluorescence microscopy (488-nm excitation). Scale bar: 0.5 mm. (b) Representative images of intraparenchymal arterioles (arrowhead) and venules (asterisk) captured in two-photon mode (920-nm excitation) at a depth of 70 μm from the cortical surface. Single slice images of the overlay (top), blood plasma (red, center), and fluorescent RBCs (green, bottom). Scale bar: 50 μm. (c) Representative time-lapse images (upper) to capture the blood cell flow along the single capillaries. The number shows the time from the start of acquisition (time = 0 ms). Using machine learning methods (see text), segmentation of blood plasma (red), red blood cells (green) and others (background; black) was performed frame by frame (bottom). Scale bar: 50 μm.
The animals were anesthetized with isoflurane (3% to 5% for induction, 2% to 3% for surgery, and 1.4% to 1.7% during experiments) mixed in air via a face mask, and the body temperature was maintained at 37 °C throughout the surgery and experiments. The animal head was fixed with a head holder (SG-3N, Narishige Co., Ltd., Tokyo, Japan). A portion of the skull (4 to 5 mm in diameter) above the somatosensory cortex on the left side was removed using a dental drill, and the dura mater was maintained. The exposed space above dura was filled with saline and closed with a cover glass (4 to 5 mm in diameter). The circumference of the cover glass was sealed with dental cement on the skull. Following the surgery, the condition of the animal was stabilized for 1 to 2 hours with reduced isoflurane anesthesia. The imaging experiments were completed within 3 hours of the surgery, and after the experiments, the animal was recovered from the anesthesia. Preliminary experiments ensured that animal conditions (i.e., systemic arterial blood pressure and blood gases) were stable and kept within the physiological limits in our experimental conditions with isoflurane anesthesia (Supplementary Figure S1). Before and after the imaging experiments, the physiological conditions (i.e., 56 ± 12 beat per min, 93 ± 3% and 360 ± 40 beat per min for respiration rate, oxygen saturation level and heart rate, respectively) of the animals were measured using a pulse oximeter (MouseOx® Plus, Starr Life Sciences Corp. Oakmont, PA, USA).
Two-photon imaging
To set a depth of 0 µm (i.e., a location of the cortical surface) in the imaging field, reflection images (a bandpass of 488/10 nm) were first captured on the cortical surface with a confocal microscope (Leica SP5MP or SP8MP, Leica Microsystems GmbH, Wetzlar, Germany) with 488-nm excitation. A depth of 0 µm was the location where the axons of neurons first appeared beneath the dura in the center of the field of view. Sulforhodamine 101 (SR101; 10 mM in saline, a total of 0.2 to 2.5 mL) was injected intraperitoneally for fluorescent staining of blood plasma. 30 The dye remained inside the vessels but also stained the astrocytes several hours after the injection. 30 To prevent potential overlap in blood plasma imaging, imaging experiments were completed within 60 minutes after the injection. Concurrent imaging of RBCs (a bandpass of 525/50 nm) and blood plasma (a bandpass of 610/75 nm) was conducted with a two-photon microscope (Leica SP5MP or SP8MP, Leica Microsystems) excited at 880 to 920 nm through a 20× water immersion lens (Figure 1(b)). Anatomical XYZ images were acquired at 1024 × 1024 pixels (a pixel resolution of 0.25 to 0.45 µm/pixel) over depths up to 400 µm of the cortical surface (a step size of 2.5 to 5.0 µm/slice). Spontaneous fluctuations of the RBC and plasma flow were concurrently imaged (i.e., in XYt mode) at a fixed depth with 128 × 256 pixels (a resolution of 1.0 µm/pixel) for 60 sec at a rate of 11.9 ms/frame.
Image analysis
Vessel diameters and flow velocity were measured using a custom code written with MATLAB software (R2019b; Mathworks, Inc., Natick, MA, USA). For penetrating arterioles and ascending venules, cross-sectional diameters were measured in each frame. To determine the thickness of the plasma layer (discrepancy between RBC and plasma flow), the diameters of RBC and plasma flow were measured using the green channel (RBC) and red channel (plasma) images, respectively. The average image over time was used for this analysis to improve the signal-to-noise ratio. For parenchymal capillaries, the diameter and the velocity of RBC were measured. In addition, an apparent residence time (ART) of individual RBCs was introduced to visualize two-dimensional flow and diameter maps along the centerline of the capillaries.
Segmentation
Image segmentation for the background, RBC and plasma was performed in each frame using a machine learning method (see Figure 1(c)). To generate teaching data for automatic segmentation, three representative images were randomly selected out of 5106 images (i.e., 60-second recording). The background, RBC, and plasma pixels were manually selected (30 pixels per image). According to the distribution of pixel intensities in the green and red channels, a set of pixels was automatically classified into these three components in each image.
Motion correction
To correct for image displacement, the phase correlation technique was used. 31 The reference image was obtained by averaging the images (i.e., merged green and red channels) over time, and the most correlated position with the reference image was determined for each frame. The areas of RBC and plasma pixels were then calculated in each frame. If the areas showed the outlier (i.e., more or less than 2 standard deviations), this image was excluded from further analysis.
Measurement of vessel diameters
The diameters of penetrating arterioles and ascending venules were measured (N = 8 animals) as the diameter of the cross-section (i.e., a minor axis of the approximate ellipse) 32 after applying a closing processing with a disk-shaped structure (radius of 3 pixels). The width of the RBC and plasma flow was also measured as cross-sectional diameter. 32 The thickness of the plasma layer was the difference in width between the plasma and the RBCs. The power spectral density (PSD) was then calculated by applying a fast Fourier transform (FFT) to the vessel diameter time data.
The parenchymal capillary diameter (a total of n = 45 capillaries from 5 animals) was measured as the minimum distance from the capillary centerline to the vessel wall. 20 The capillary centerline was determined by a process of thinning the vessel structure image. The median values in each capillary were used to represent the diameter of each capillary.
Measurement of RBC velocity
The RBC velocity was measured for parenchymal capillaries (N = 5 animals). In this analysis, kymography images of the green channel (RBC) were generated along the capillary axis from a junction to the other junction or end points (X-axis). The intensity variations along the vessel centerline over time are illustrated for all measured images (Y-axis). A distance between the pixels was represented with an Euclidian distance, and an intensity profile along the centerline of the vessel was resampled at a spatial resolution of 0.5 μm (see also supplementary Figure S2). A time delay in each pixel location relative to the start of the line acquisition was corrected by interpolating the acquisition time divided by a number of pixels along the acquisition direction, and changes in intensity over time were resampled at 0.0119 sec per image.
A small region of interest (ROI; 100 × 100 pixels) was extracted from the kymograph image, and an FFT was applied to find rough angles of the slope of the stripe pattern generated on the kymograph image. The time axis (Y-axis) or the space axis (X-axis) where the number of pixels was smaller than the other axis was interpolated to create a regular matrix for FFT. Next, a bandpass filter (a cutoff at frequency ranges less than 50% of peak intensity; an empirical value, see also supplementary Figure S3) was applied to reduce random noise. The kymographic image was reconstructed with the inverse FFT. For the spatial direction of the kymograph image, another bandpass filter with a spatial frequency range corresponding to the length of the RBCs (i.e., 3 to 10 μm) was applied to enhance the shape of RBCs. Radon transform was applied to determine the maximum intensity deviations and the RBC velocity was calculated. 33 Each 100 images were used to calculate the flow velocity at each time point.
The slope with the greatest variation in pixel intensity was identified using the Radon transform images as the peak of the Gaussian fit applied to the pixel intensity variations measured at an angle of 0 to 180 degrees. For each time point, if the coefficient of determination of the fitting was less than 0.90, the data point was excluded (see also supplementary Figure S3). Additionally, a full width at a half-maximum angle was used to cut off the data points due to large slope variations within the ROI (supplementary Figure S4).
The area density for RBC relative to the vessel area was also calculated using the binary image of the kymograph image. The binary image was made with the Otsu’s binary threshold, and the number of RBCs was measured by counting the number of stripe lines in the kymograph image.
Measurements of apparent residence time for RBC
To analyze the spatiotemporal dynamics of RBC velocity on a single pixel basis, an apparent residence time (ART) of RBC was introduced. First, 100 consecutive frames were extracted, and the number of pixels occupied by the RBCs in relation to the plasma was defined as an ART of RBC in each pixel along the capillary centerline. Because not all pixels were assigned to RBCs or plasma due to occasional transits of unlabeled leukocytes or segmentation errors, pixel locations containing more than 10 images of either plasma or RBCs out of 100 images were used for this analysis. For each time point, the median ART value on a single capillary was used to examine temporal variations in ART. The ART around the capillary junctions was defined as the average ART for 6 pixels from the junction point. The mean of the ART on six pixels of the center of the capillary length was also calculated to represent the ART in the center of the capillary.
Statistics
Data are presented as the means ± standard deviations for the animals measured (if not specified). The normality of the data was evaluated using the Lilliefors test (lillietest in the MATLAB code), and the null hypothesis was discarded at the 5% significance level. Statistical significance (p < 0.05) was determined using the Student’s paired t-test for comparisons between widths of RBC and plasma flow measured in the same vessels and between ART at the capillary junction and center. Holm’s multiple comparison test was used to compare RBC velocity and diameters among the branched capillaries. Pearson’s correlation (R) was calculated for correlations between the vessel diameter and the thickness of the plasma layer and between the ART and either RBC velocity or diameter.
Results
The diameters of the penetrating arterioles and ascending venules fluctuated spontaneously at variable frequencies, such as 5–7 Hz and ∼1 Hz corresponding to the heart rate and respiratory rate, respectively (Figure 2(a) and (b)). Slow vasomotion (<0.1 Hz) was evident in the arterioles but less evident in the venules. Comparisons of widths between RBCs and plasma showed significantly (p < 0.05) smaller diameters in RBCs (20 ± 4 μm and 18 ± 6 μm in the arteriole and venule, respectively) than in plasma flow (25 ± 5 μm and 22 ± 6 μm, respectively). A linear correlation was observed between plasma layer thickness and vessel diameter (R = 0.69 and 0.38 for arterioles and venules, respectively; Figure 2(c)).
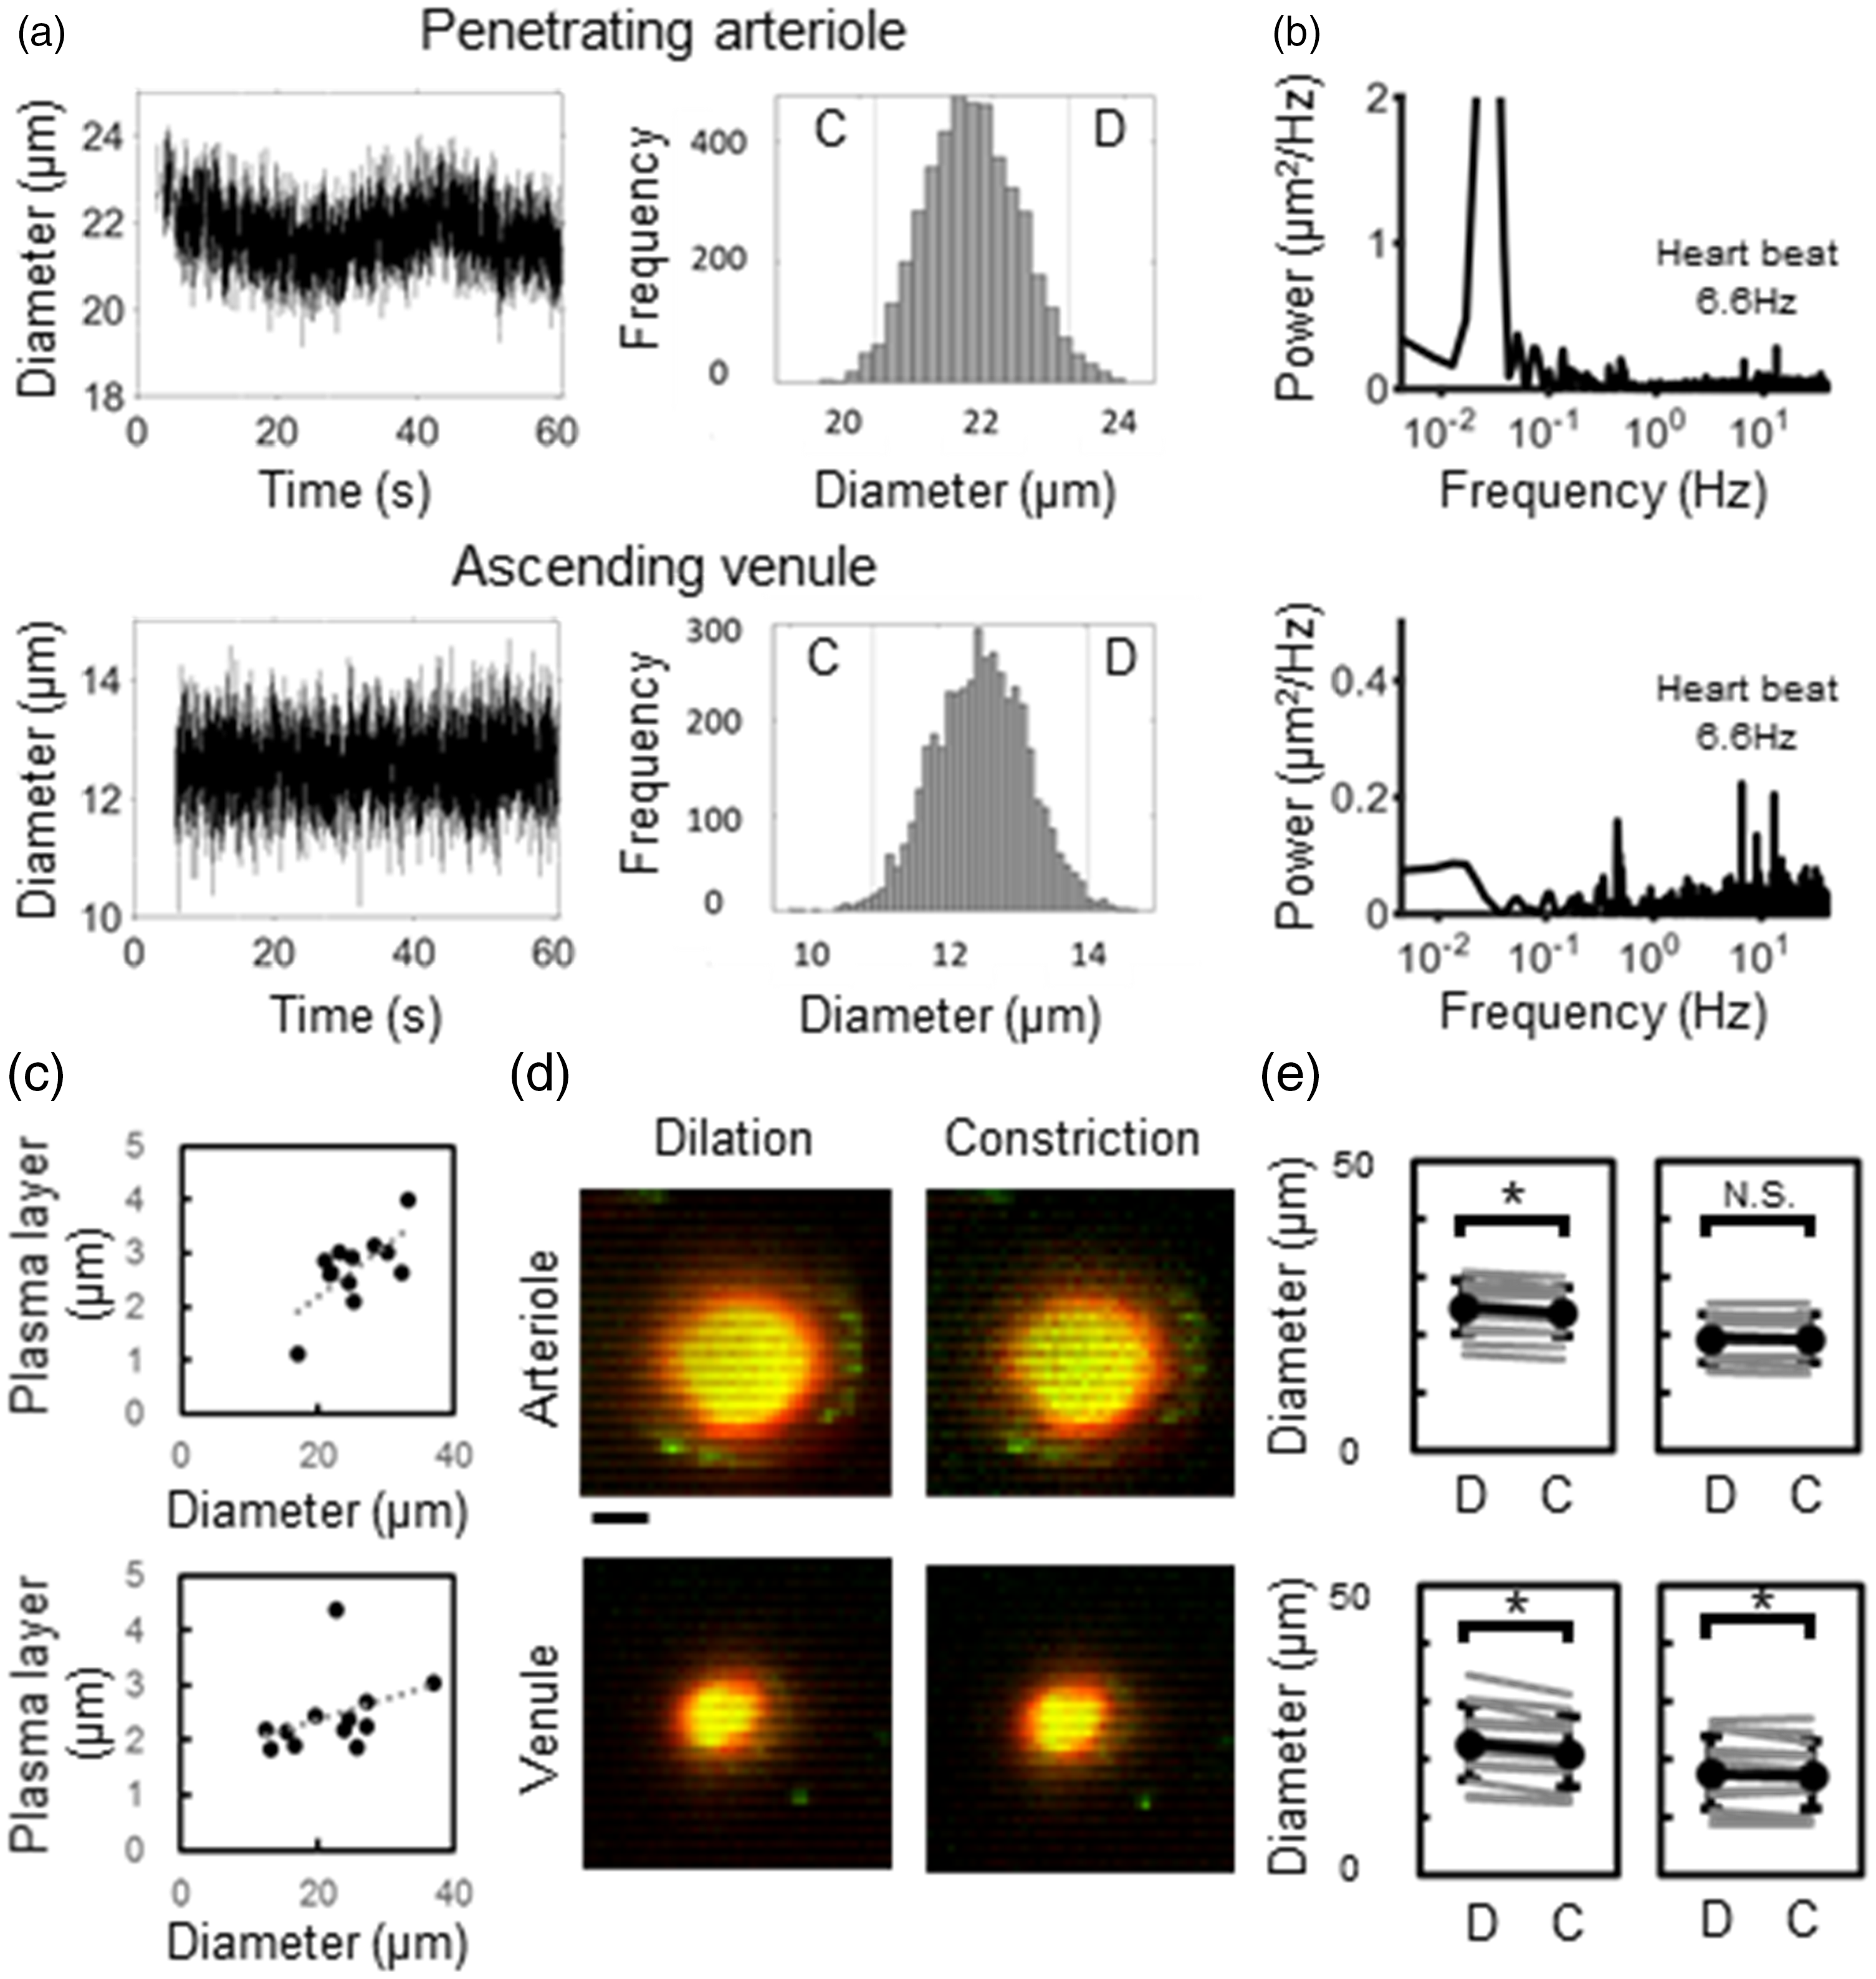
Spontaneous fluctuations in vessel diameters in penetrating arterioles and ascending venules. (a) Temporal data representative of the simultaneously measured diameters for arterioles (upper) and venules (lower) shown in Figure 1(b). Based on the symmetrical distributions of the measured diameters, image data were separated into constriction (C) and dilation (D) frames (cutoff at the mean minus SD and the mean plus SD, respectively). (b) Frequency analysis. Temporal fluctuations in the measured diameters showed visible peaks corresponding to heart rate (6.6 Hz) and its harmonics for the arteriole (upper) and venule (lower), whereas slow fluctuations (0.03 Hz) were detectable only for the arteriole. (c) Correlations between plasma layer thickness and diameters of arterioles (upper, n = 12) and venules (lower, n = 12). (d) Mean intensity projection image for images grouped into dilation (left) and constriction (right) frames. The diameters of RBC flow (yellow) were relatively constant in arterioles (upper) but changed in venules (lower). Red: plasma layer. Scale: 10 μm. (e) Comparison of width between RBC and plasma flow. Significant differences (*p < 0.05, paired t test, n = 12) in the plasma flow diameters (left) between dilation (D) and constriction (C) for arterioles (upper) and venules (lower). However, only the venules, but not the arterioles (p = 0.14, n = 12), showed significant differences in the diameters of the RBC flow (right). N.S.; not significant.
Next, a thickness of the plasma layer was compared between two extreme conditions of vessel dilation (diameters greater than mean plus 2SD) and constriction (diameters less than mean minus 2SD) (Figure 2(a)). The representative images showed visible differences in the diameters between two conditions, whereas the widths of the RBC flow remained relatively constant (Figure 2(d)). Population data showed statistically significant differences in RBC widths between dilation and constriction in venules (p < 0.05, n = 12; Figure 2(e)), but not in arterioles (p = 0.14, n = 12; Figure 2(e)). The results showed the variable thickness of the plasma layer in arterioles compared to venules (Figure 2(e)).
In parenchymal capillaries, RBCs and plasma flowed interchangeably (Figure 1(c)). Thus, the velocity of RBCs labeled with fluorescent proteins was representatively evaluated. The velocity of RBCs fluctuated over time with a relatively slow dynamics compared to fluctuations in the diameter of the arterioles and venules. At the convergence bifurcation where two capillaries merged (Figure 3(a) and Supplementary Movie 1), the fluctuation in RBC velocity was more synchronized in one branch (i.e., sub1) than in another branch (i.e., sub2) with the merged capillary (i.e., mainstream). This fluctuation in RBC velocity occurred independently of fluctuations in capillary diameters (Figure 3(b)). At the junction point, the RBC flow smoothly merged and accelerated from the subbranches to the main branch (Figure 3(c)), indicating that the junction does not generate resistance to the RBC flow at convergence bifurcations. Frequency analysis showed slower diameter fluctuations (0.02 to 0.04 Hz) than RBC velocity (0.04 to 0.05 Hz and ∼0.1 to 0.3 Hz; Figure 3(d)). Population data showed that the RBC velocity in the main capillary (0.76 ± 0.27 mm/s, n = 7) was significantly higher than that in the two upstream branches (0.54 ± 0.30 mm/s and 0.30 ± 0.20 mm/s; Figure 3(e)). Conversely, the diameter of the capillary showed no detectable differences between the downstream main capillary (4.3 ± 0.8 μm) and the two upstream branches (4.0 ± 0.5 μm and 4.0 ± 0.8 μm; Figure 3(e)).
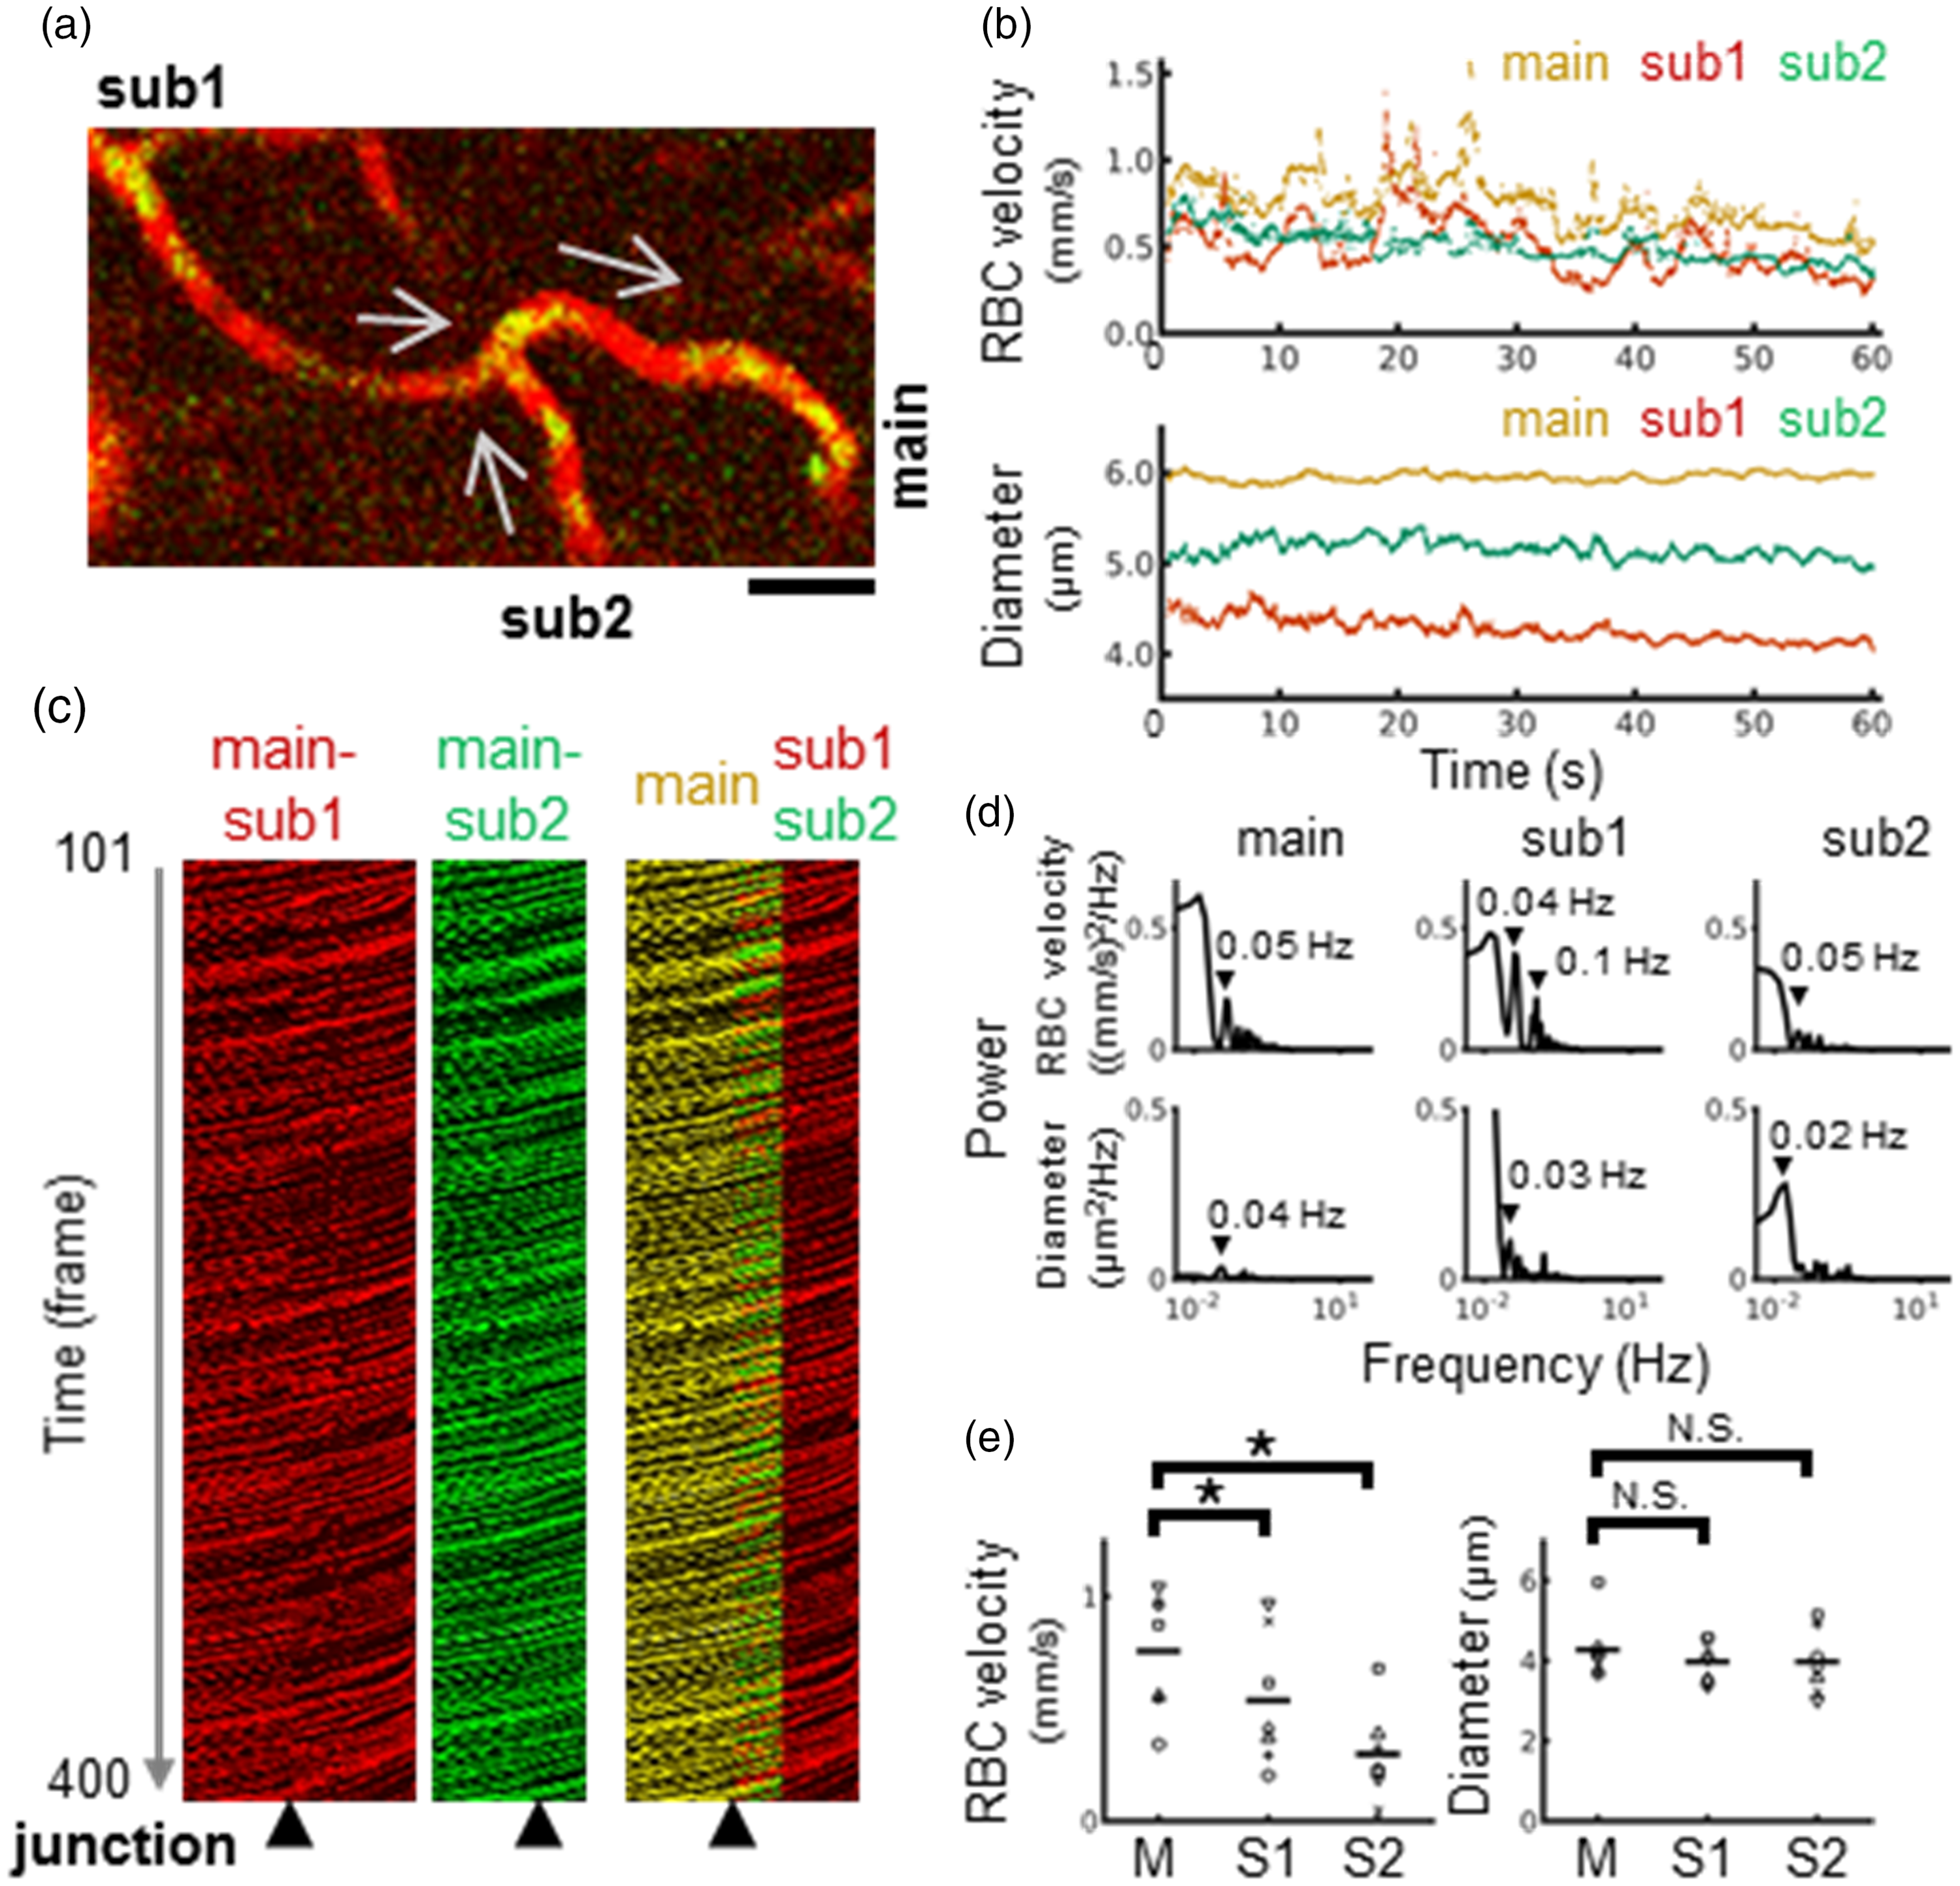
Comparisons of RBC velocity and diameters at the converging bifurcation where two capillaries merged. (a) Representative image (the first frame) of the converging capillary junctions. Two capillaries (sub1 and sub2) merged into one main capillary (main). The arrows indicate the direction of the flow. Fluorescent images of RBCs (green) and blood plasma (red) were obtained simultaneously at a depth of 80 μm from the cortical surface for a total of 5106 frames. Scale: 20 μm. (b) Time course for RBC velocity (upper) and diameters (lower) for three capillaries (main: orange, sub1: red, sub2: green). (c) Representative main-sub1 (red), main-sub2 (green), and overlay (yellow) images extracted for 300 consecutive images for kymography. The arrowheads indicate the junction point where the centerlines of the three capillaries merged. (d) Frequency spectrum analysis for temporal fluctuations of RBC velocity (upper) and diameter (lower). Note that higher frequency components were detected for temporal fluctuations in RBC velocity compared to diameter fluctuations. (e) Comparison of RBC velocity (left) and diameter (right). Statistically significant differences in RBC velocity (*p < 0.05, Holm’s multiple comparison test) in the main capillary (M) were detected in relation to two subcapillaries (S1; sub1 and S2; sub2). No significant differences (N.S.) were detected in the diameters. Each symbol represents the same capillary bifurcations (n = 7).
At the divergence bifurcation in which one capillary divided into two capillaries (Figure 4(a) and Supplementary Movie 2), the fluctuations in RBC velocity were also independent of the diameter fluctuations (Figure 4(b)). In contrast to the convergence bifurcation, the divergence bifurcation showed sharp changes in velocity at the junction point (Figure 4(c)). As a result, RBC velocity fluctuations and RBC velocity decreased in the subbranches. The representative images show an alternative flow of RBCs in two subbranches (e.g., 25 RBCs vs. 23 RBCs over measurement periods of 1.2 sec in sub1 vs. sub2, respectively; Figure 4(c)), where the velocity of RBCs was equivalent in both branches (approximately 0.5 mm/sec). Frequency analysis consistently showed higher frequency fluctuations in RBC velocity (0.04 to 0.05 Hz and 0.1 to 0.3 Hz) relative to capillary diameter fluctuations (∼ 0.02 Hz, Figure 4(d)). Population data revealed a significant slowing (p < 0.05) of RBC velocity in two downstream branches (0.34 ± 0.37 mm/s and 0.28 ± 0.16 mm/s, n = 8; Figure 3(e)) compared with the upstream main capillary (0.54 ± 0.37 mm/s). In addition, the capillary diameters of the subbranches (4.0 ± 0.8 μm and 3.7 ± 0.6 μm; Figure 4(e)) were significantly smaller than those of the upstream main capillary (4.5 ± 0.7 μm).
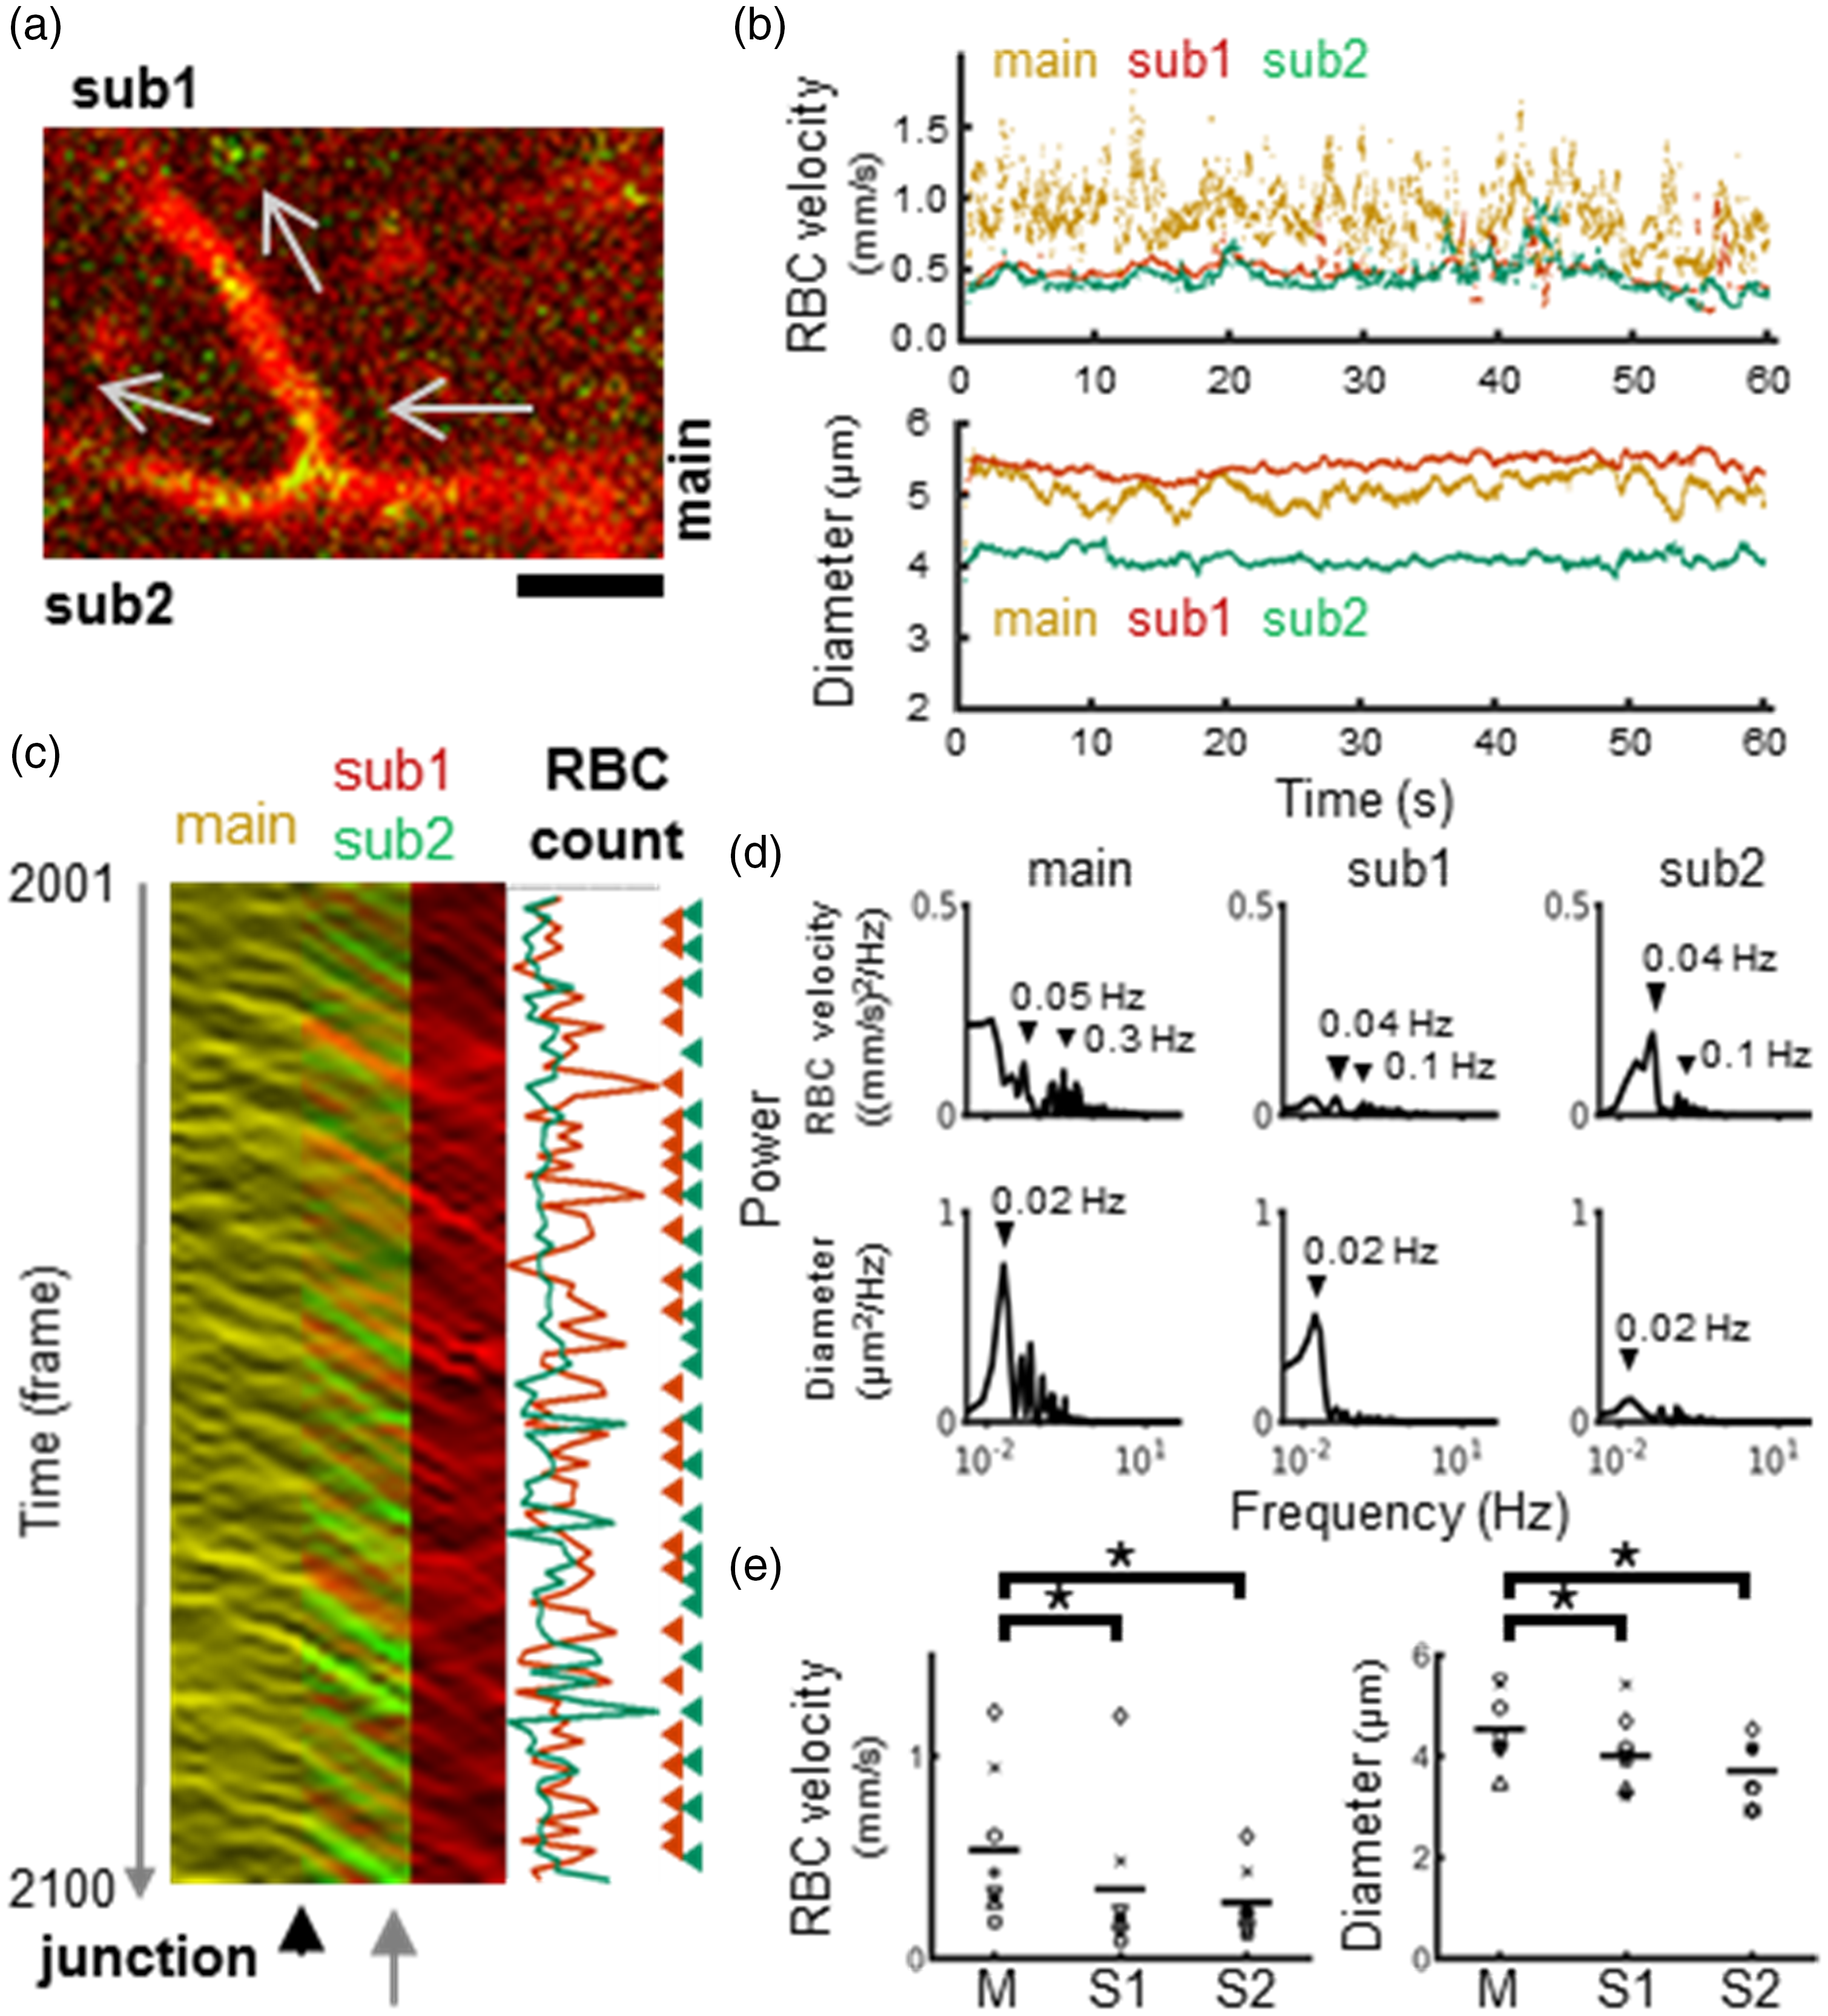
Comparisons of RBC velocity and diameters at the diverging bifurcation, where a capillary divides into two capillary branches. (a) Representative image (the first frame) of the capillary junctions of divergence. A mainstream capillary (main) divides into two subbranched capillaries (sub1 and sub2). The arrows indicate the direction of the flow. Fluorescent images of RBCs (green) and blood plasma (red) were obtained simultaneously at a depth of 50 μm from the cortical surface for a total of 5106 frames. Scale: 20 μm. (b) Time course for RBC velocity (upper) and diameters (lower) for three capillaries (main: orange, sub1: red, sub2: green). (c) Representative kymograph image of overlay (yellow) of main-sub1 (red) and main-sub2 (green) images for 100 frames. The arrowhead indicates a junction point, and the arrow indicates a point where the number of RBCs was counted (25 vs. 23 for sub1 vs. sub2, respectively) according to the intensity profiles along the line (right). (d) Frequency spectrum analysis for temporal fluctuations of RBC velocity (upper) and diameters (lower). Note that higher frequency components were detected for temporal fluctuations in RBC velocity compared to diameter fluctuations. (e) Comparison of RBC velocity (left) and diameters (right). Statistically significantly (*p < 0.05, Holm multiple comparison test) faster velocity and larger diameters in the main capillary (M) were detected compared to two subcapillaries (S1; sub1 and S2; sub2). Each symbol represents the same capillary bifurcations (n = 8).
Correlations of RBC velocity fluctuations between subbranches were higher for convergence (R = 0.4 ± 0.3, n = 7) than for divergence bifurcations (R = 0.2 ± 0.2, n = 8). The results also showed that the RBC velocity differences between subbranches were relatively constant, regardless of the RBC velocity variations in the mainstream (Figure 5). In particular, the changes in RBC velocity of the subbranches followed the main vessel at the junction. Comparisons of RBC velocity differences between subbranches showed a larger difference in convergence (Figure 5(a)) compared to divergence bifurcations (Figure 5(b)).
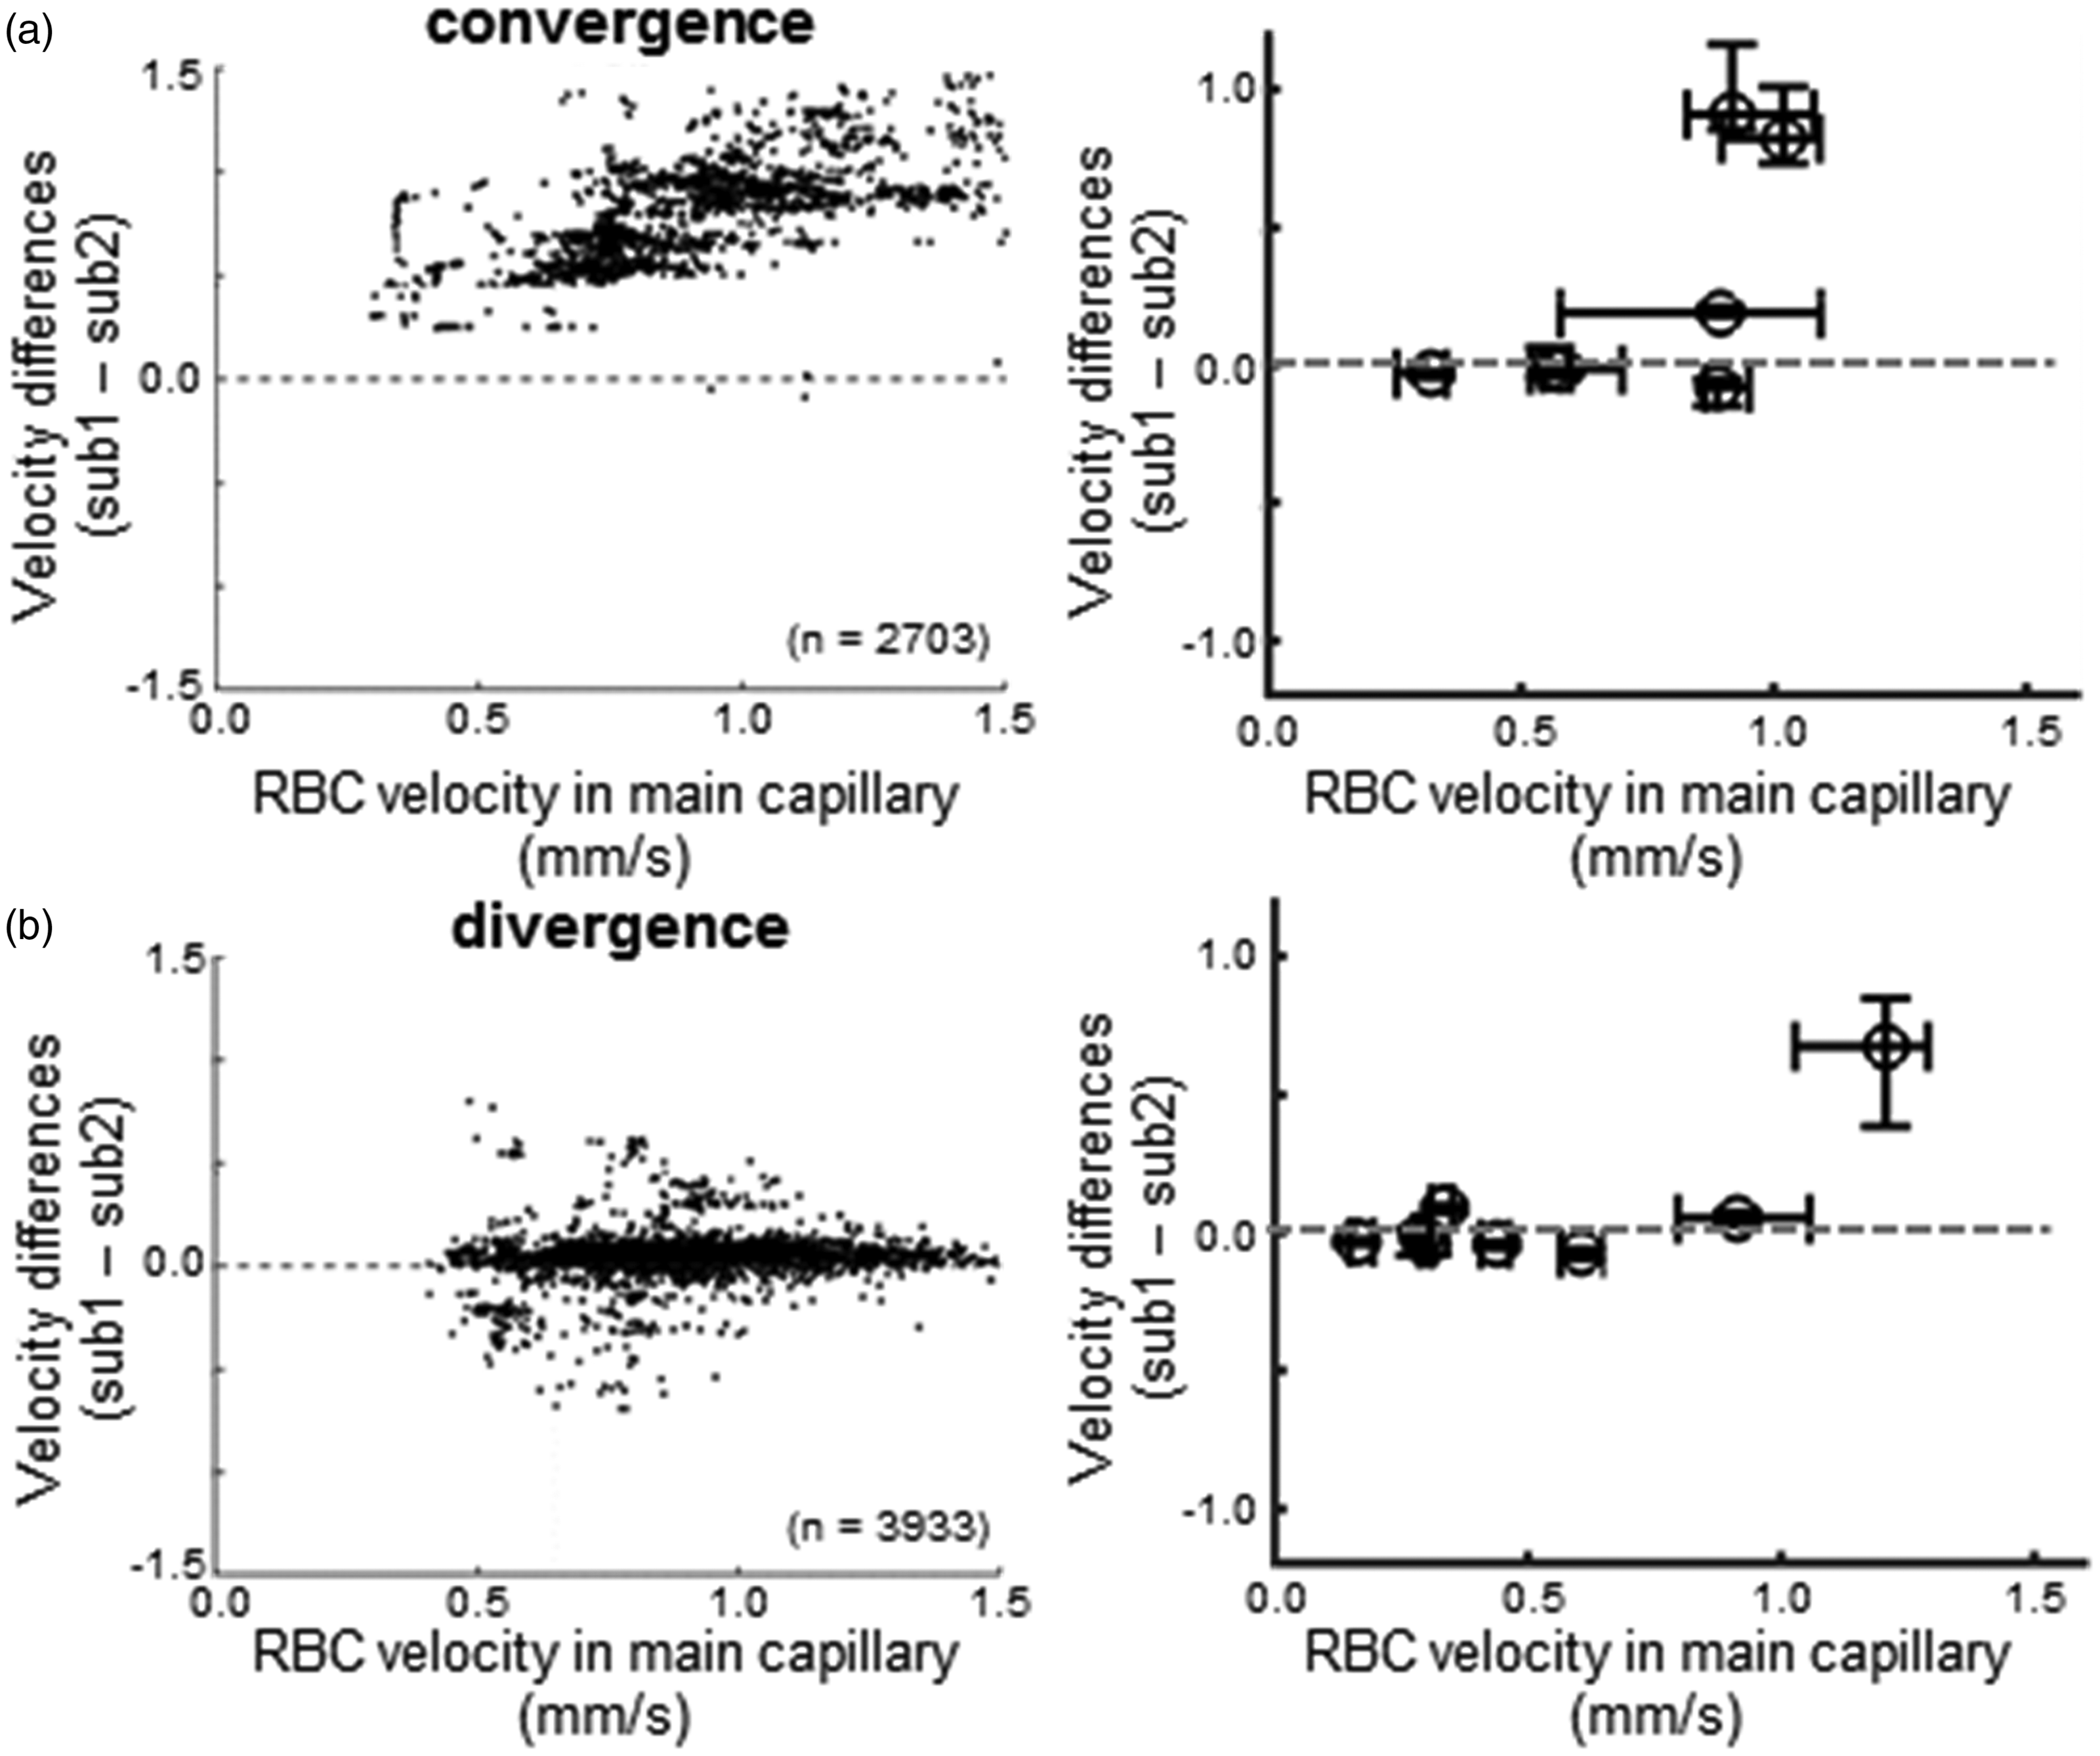
Comparisons of RBC velocity differences between the capillaries of the subbranches. (a) Convergence junctions. A representative convergence bifurcation (left) showed variable changes in velocity differences between the upstream capillaries of the sub1 and sub2 branches, independent of RBC velocity variations in the merged capillary. The median values of RBC velocity differences vs. RBC velocity in the main capillary were plotted (right; n = 7). Error bar: the first and third quartiles. (b) Diverging junctions. A representative diverging bifurcation (left) showed a balanced flow velocity between the subcapillaries, regardless of the RBC velocity variations in the upstream main capillary. The median values of the RBC velocity differences vs. RBC velocity in the main capillary were plotted (right; n = 8). Error bar: the first and third quartiles.
To check whether RBC velocity changes occurred at specific locations, the spatiotemporal dynamics of the RBC flow (i.e., apparent residence time; ART) were visualized (Figure 6(a)). The ART was inversely correlated with RBC velocity among the capillaries (Figure 6(b)) but not the capillary diameters (Figure 6(c)). In convergence bifurcations, the ART tended to be shortened at the junction (i.e., an increase in velocity). A significantly (p < 0.05) shorter ART was observed in the junction areas for one of the subbranches merging with the main capillary in comparison with the median areas of the capillary (Figure 6(d)). In contrast, divergence bifurcations showed a longer ART at the junction (i.e., a decrease in velocity), indicating that the divergence junction generates resistance to the RBC flow. A significantly (p < 0.05) longer ART was observed at the junction relative to the median areas of the capillary for the main capillary and one of the subbranches (Figure 6(e)).
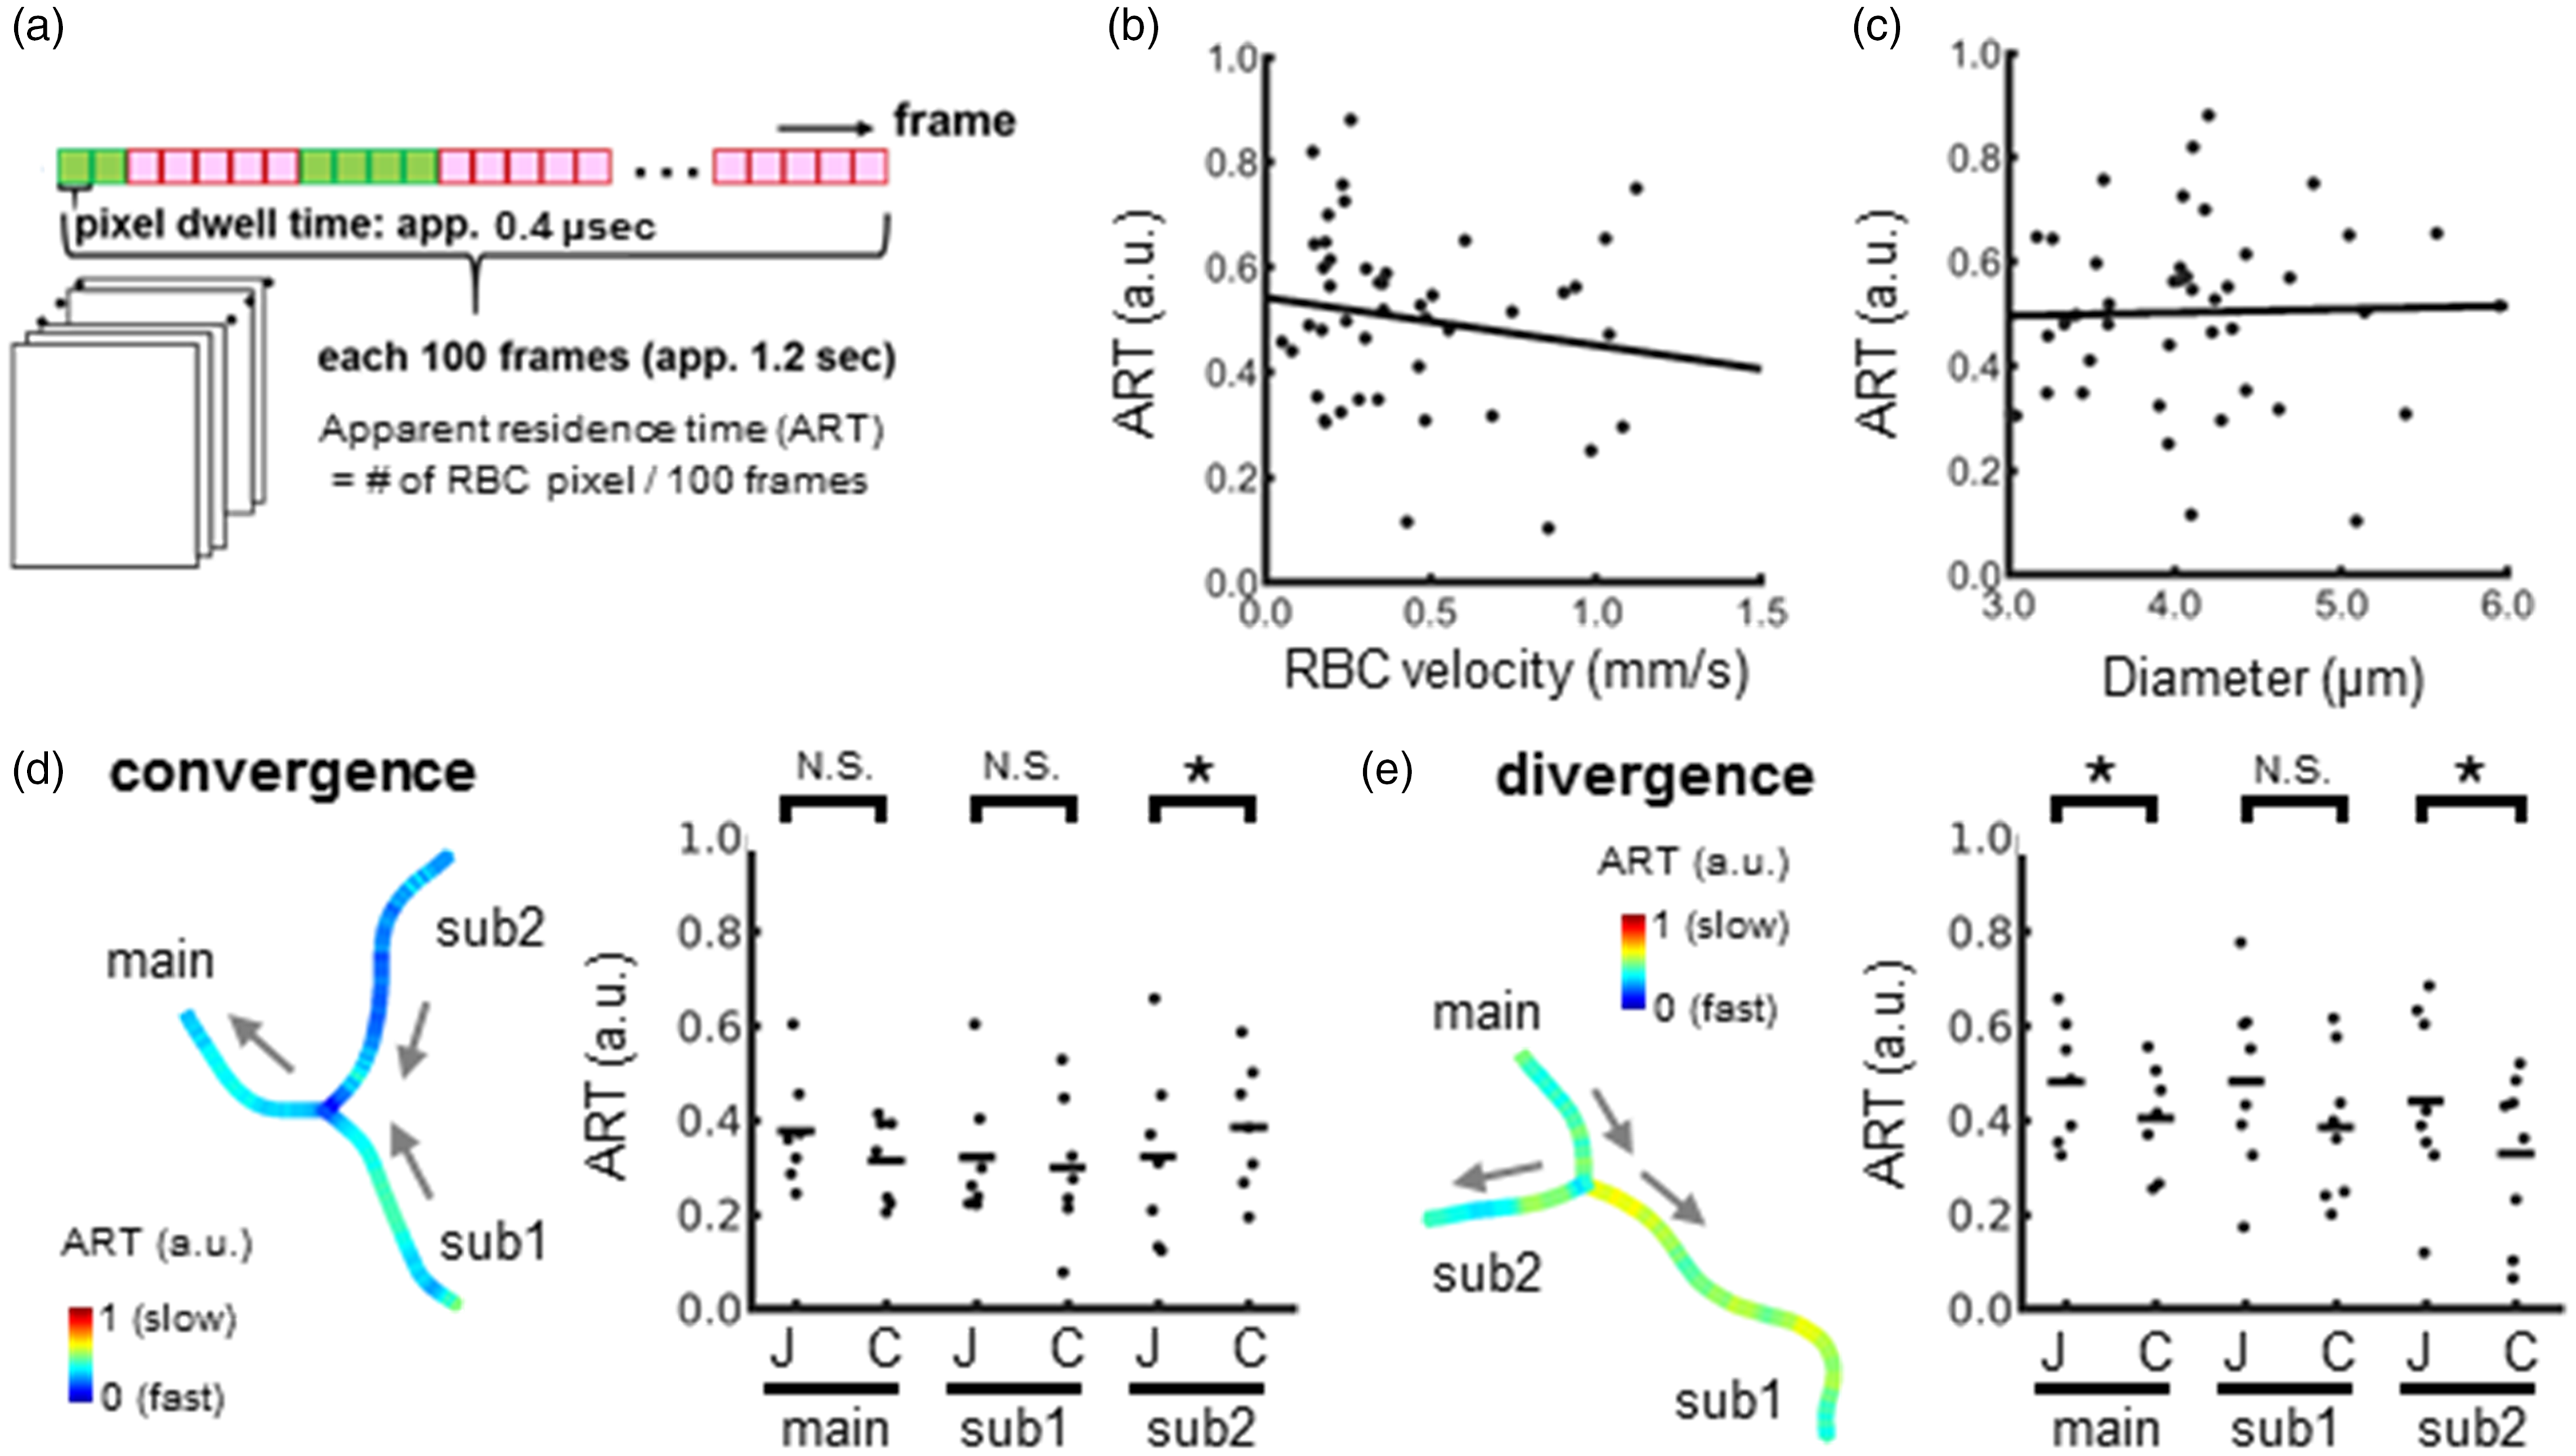
Comparisons of RBC flow dynamics between junctions and a center of the capillary. (a) Schematic view of the measurement of ART for RBCs. The number of pixels assigned to fluorescent RBCs (green) or blood plasma (red) was counted on each 100 images. The pixel dwell time was approximately 0.4 μsec, and the frame acquisition rate was approximately 12 ms. The ART was the rate of RBC pixels per 100 measured images. This calculation was repeated at each time point for all of the acquired images minus 99 images (i.e., every 100 frames were used for the measurements). (b) Comparison of RBC velocity (X-axis) to ART (Y-axis). The regression line (Y = −0.09 X + 0.54) shows inversely linear correlations (R = −0.16, n = 45 capillaries). (c) Comparison of capillary diameter (X-axis) to ART (Y-axis). No correlation (R = 0.03, n = 45 capillaries) was observed (Y = 0.007 X + 0.48). (d) Comparison of the ART for the convergence bifurcations. The representative image (left) shows a map of ART (the median values on all images). The arrows indicate the direction of the flow. Two capillaries (sub1 and sub2) fused in the main capillary (main). The blue pixels around the junction indicate a shorter ART (i.e., faster velocity). A significantly shorter residence time (p < 0.05, n = 7 capillaries in each group) was observed at the junction zones (J) relative to the central point of the capillaries (C) in the sub2 capillary (right). (e) Comparison of the ART for the divergent bifurcations. The representative image (left) shows a map of the ART (median values across all images). The arrows indicate the direction of the flow. A main capillary (main) divided into two subcapillaries (sub1 and sub2). The yellow pixels around the junction with sub2 indicate a longer ART (i.e., slower velocity). A significantly longer residence time (*p < 0.05, n = 8 capillaries in each group) was observed at the junction zones (J) relative to the central point of the capillaries (C) for the main and sub2 capillaries (right). ART: Apparent residence time.
These spatial differences in RBC velocity were maintained over time. The heatmap of the spatiotemporal variations in the ART showed larger variations along the individual capillaries than their fluctuations over time (Figure 7). It should also be noted that these spatial variations in ART are not related to differences in diameters between the capillaries (Figure 7(b) and (c) and Supplementary Movie 3).
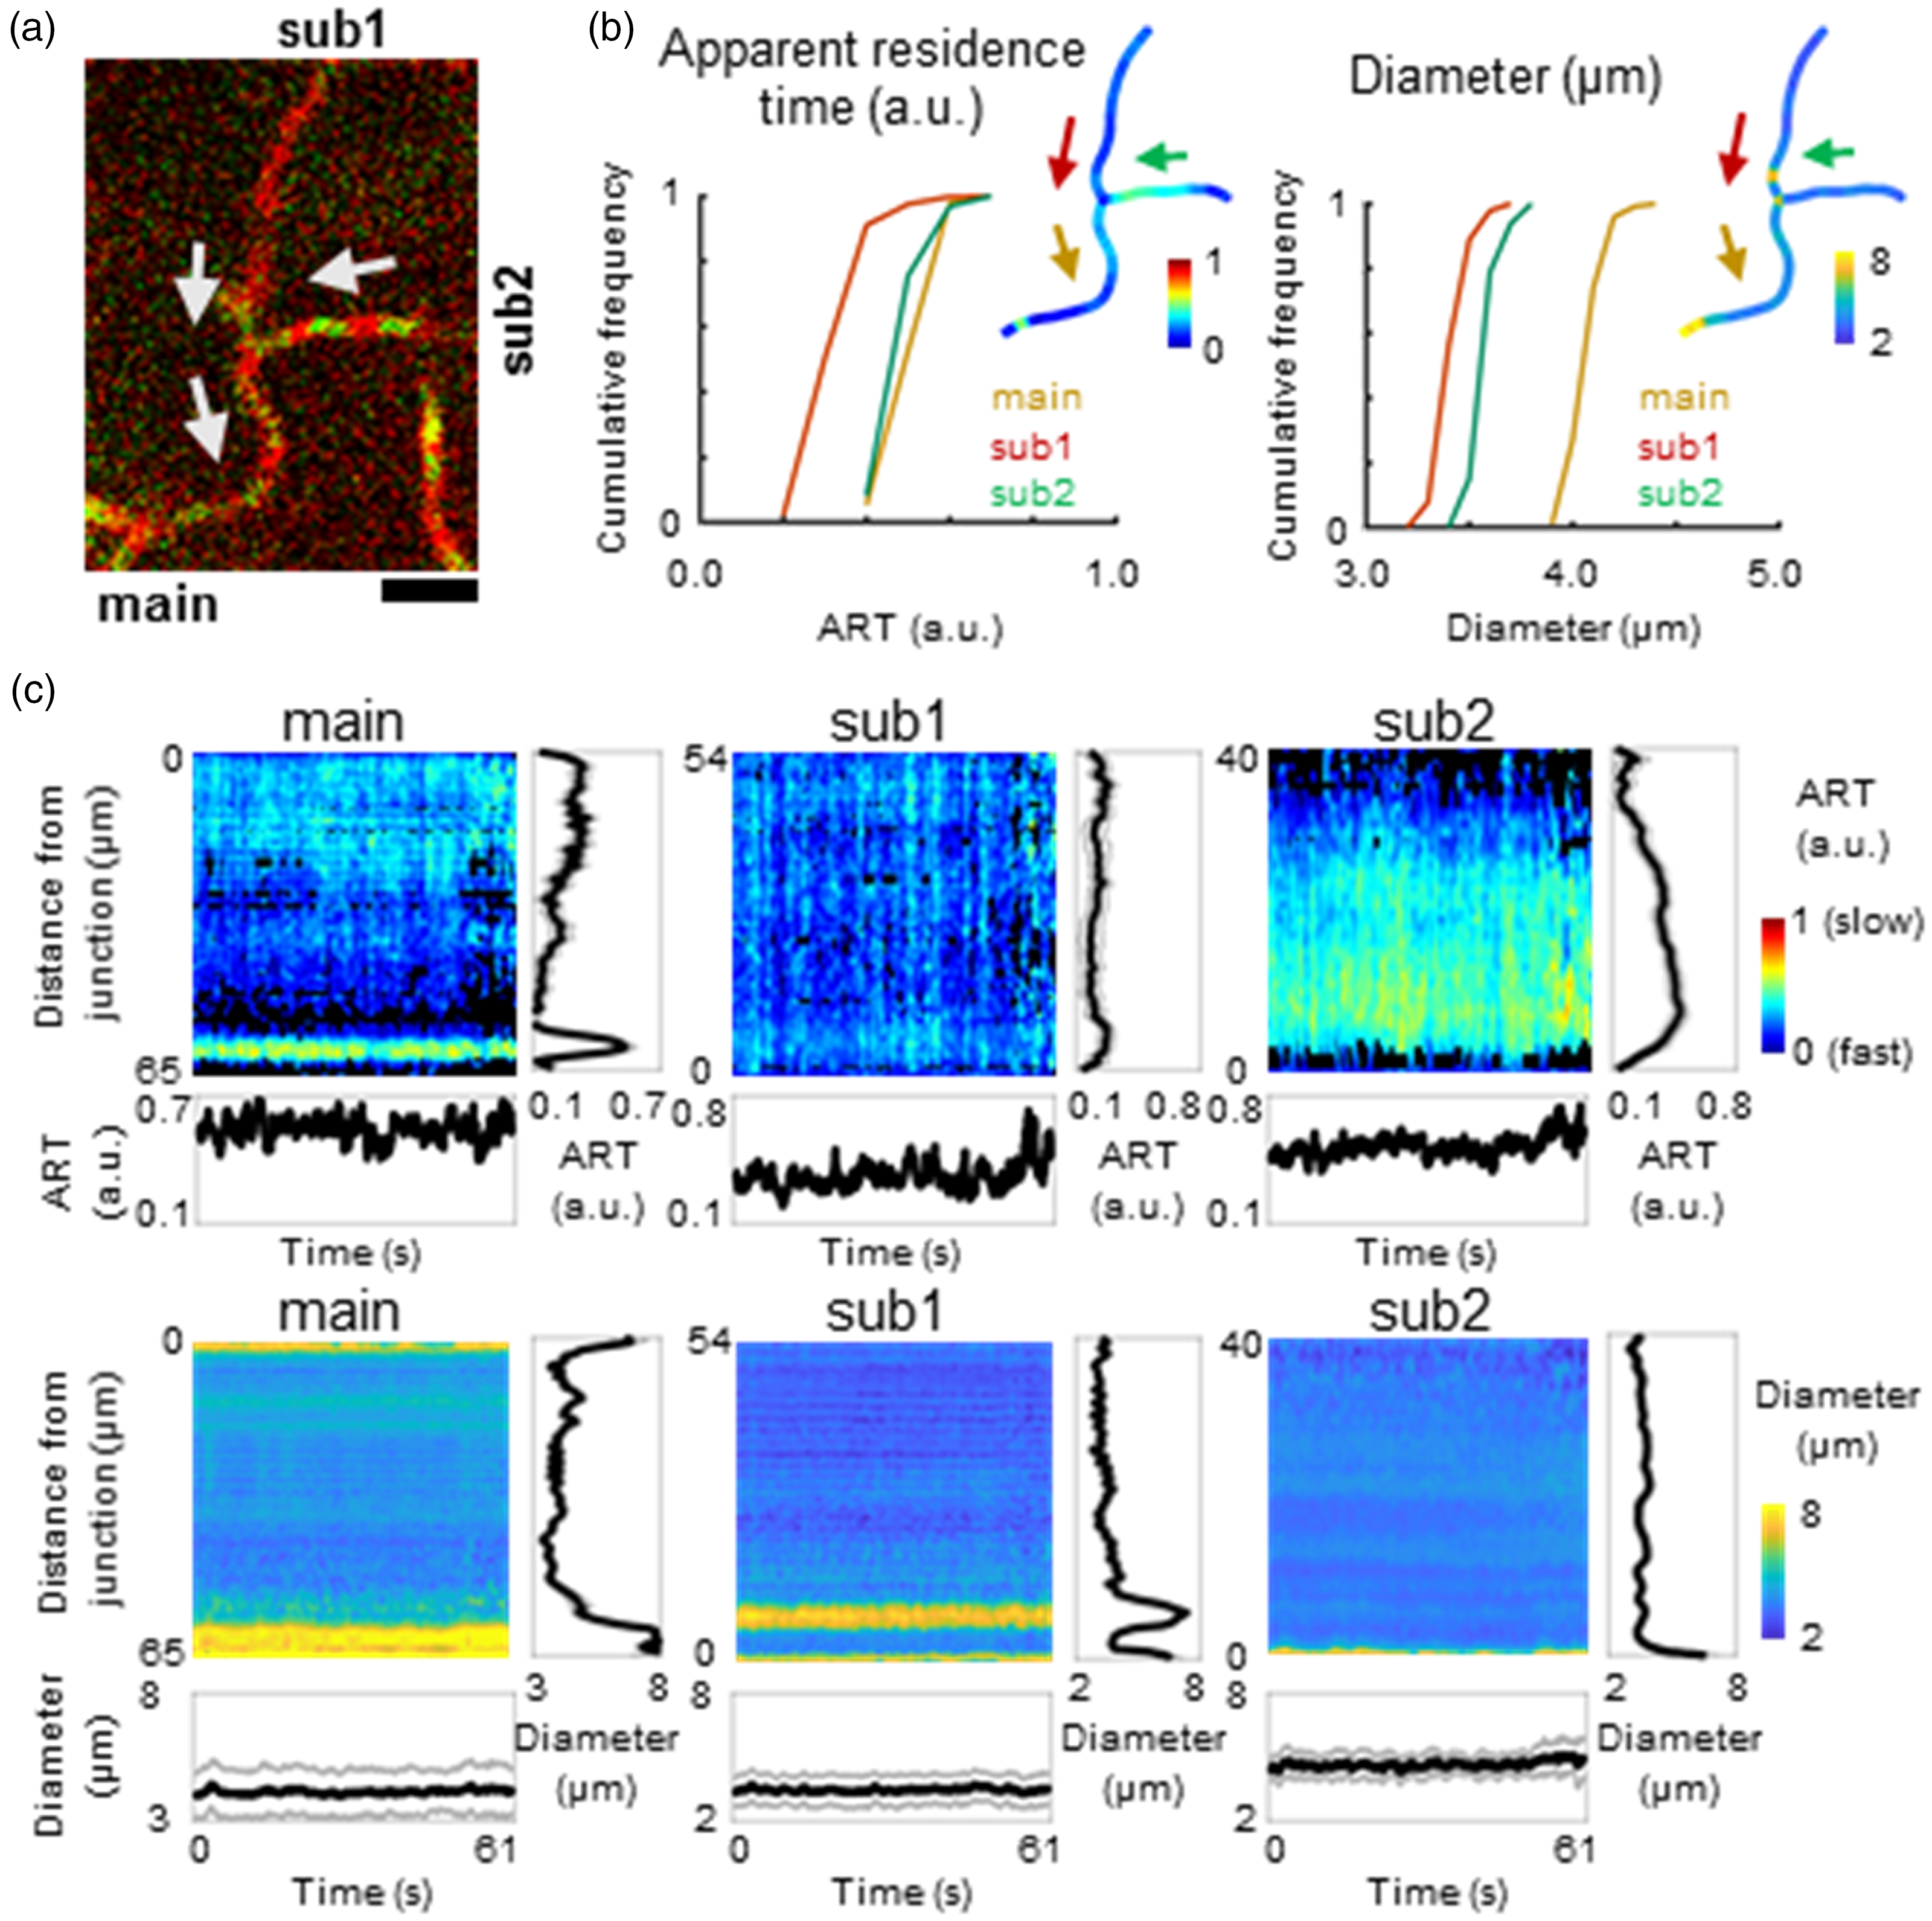
Simultaneous spatiotemporal analysis of RBC flow dynamics and capillary diameters at the convergence bifurcation. (a) Representative image of the capillary junctions of convergence. Two capillaries (sub1 and sub2) merged into the main capillary (main). The arrows indicate the direction of the flow. The fluorescent RBC (green) and blood plasma (red) images were obtained simultaneously at a depth of 40 μm from the cortical surface for a total of 5106 frames. Scale: 20 μm. (b) Cumulative histogram for ART (left) and diameters (right). Median values along the capillary centerline in each of three capillaries (main: orange, sub1: red, sub2: green) were compared for the 5007 images acquired. For representation, the median values of all of the frames were mapped (upper right). The arrows indicate the direction of the flow. Blue pixels denote a shorter apparent residence time (i.e., faster velocity) and smaller diameters. (c) Heatmap (4998 × 41–66 pixels) for the ART (upper) and diameters (lower) of all frames (X-axis) along the capillary centerline (Y-axis) for the capillaries of main (left), sub1 (middle) and sub2 (right). Location 0 (μm) indicates the junction where the centerlines of the three capillaries (main, sub1, and sub2) merged, and numbers in Y-axis represent the distance from the junction point along the centerline of the vessel. Median values (black) with the first and third quartiles (gray) across the pixels along the capillary centerline (for Y-axis) or across all of the measured frames (for X-axis) were plotted to compare the temporal fluctuations (bottom) or the spatial variations (right side) of each panel, respectively. ART: apparent residence time.
Discussion
The present study showed spontaneous physiological oscillations in the diameters of the penetrating arterioles and ascending venules (Figure 2), resulting from heart rate (5 to 7 Hz) and respiration (∼1 Hz). A separate analysis of blood plasma and RBC flow showed that the thickness of the plasma layer varied on the arterial side according to vasomotion (< 0.1 Hz). The results indicate a dissociation of the flow velocity between the particles and the liquid phase in the mixed flow of RBCs and blood plasma, while arterioles dilate or contract. In parenchyma capillaries, these blood volume fluctuations induced by vasomotion result in slow (<0.1 Hz) fluctuations in RBC velocity and capillary diameters (Figures 3 and 4). However, slow fluctuations (0.1 to 0.3 Hz) in the capillary RBC velocity occurred, independent of capillary diameter fluctuations. These results indicate little contribution of capillary diameter regulations to fluctuations in capillary RBC velocity. At diverging bifurcations, the RBC velocity and fluctuations decreased considerably, demonstrating that the junction of diverging bifurcations contributes to the resistance of the flow (Figure 6). This finding can be explained by the significantly smaller capillary diameters in the subbranches than the capillary upstream and the filling of the RBCs in these capillaries.
A new finding of the present study is that the high-frequency oscillation of blood flow that is primarily associated with a systemic physiological pulsation 2 was shown to be filtered at the capillary bifurcation where the RBC is divided into two capillaries (Figure 4). As the vasomotion and the fluctuation of the capillary diameter showed oscillations at very low frequencies (< 0.1 Hz), low-frequency (e.g., 0.1-1 Hz) oscillations of capillary flow may involve frequency components caused by frequency modulation through bifurcations. The results therefore indicate that a number of bifurcations in capillary networks (i.e., capillary density) contribute to the generation of low-frequency hemodynamic oscillations. Theoretical studies have shown that red or white blood cells moving into capillaries increase the resistance of the capillary, leading to intrinsic fluctuations in RBC flow distribution in capillary networks.34,35 The current results of the alternative distribution of RBCs at diverging bifurcations are consistent with this prediction. Specifically, the former RBC flow affects the direction of the subsequent RBC flow because of the increased resistance of a branch that RBCs are filling. Thus, the slow fluctuations of the RBC velocity observed at 0.1 to 0.3 Hz might depend on variable filling by blood cells through capillary networks with rigid structures. This observation has important implications for dynamic measurements of CBF. Namely, our results indicate that the power of low-frequency oscillations in microvascular flow reflects the density of microvessels (a number of bifurcations through capillary networks). Preserved RBC velocity fluctuations through the capillary junction were observed under disturbance of the microcirculation where one capillary flow was occasionally stopped (Supplementary Figure S5). Consistent with this notion, age-dependent decreases in microvascular density and spontaneous low-frequency oscillations of cerebral hemodynamic signals have been reported.36,37
Other studies have shown that leukocytes block cerebral capillary flow.38–40 Approximately 0.12% of cortical capillaries are estimated to be blocked daily with white blood cells. 37 In this study, red and white blood cells were distinguishable because of the lack of white blood cell labeling. Nevertheless, capillary flow obstruction by white blood cells was rarely observed because of the very low concentration of unlabeled white blood cells (approximately 0.1% relative to RBCs) under healthy conditions (see also supplementary movies). Under certain pathological conditions (such as hypertension, hyperlipidemia, and hypoperfusion), resistance to capillary flow may change due to the removal of endothelial glycocalyx 41,42 and changes in erythrocyte deformability,43,44 which may result in stopping or modulating low-frequency oscillations in the blood flow of the capillary networks. Future work is needed to determine the impacts of altered microvascular resistances on capillary flow fluctuations under disease conditions.
Spatial variations in the apparent residence time of RBCs in a single capillary indicate a variable flow velocity depending on the location measured (Figure 7). The results indicate a balanced pressure field across the capillary networks, resulting in smaller effects of temporal fluctuations but greater spatial variations in single capillaries. Since the current experiments were carried out under anesthesia, active controls of capillary diameters might have been suppressed. Active changes in capillary diameters, such as pericyte activation, affect the flow velocity of RBCs,45,46 although changes in single capillary diameters could be limited to local changes in flow.35,47 How these fluctuations in capillary flow are related to local neural activities remain to be determined. Thus, future work with combined fluorescent imaging of neurons and/or glial cell activities around capillaries should explore the spatial-temporal causality of flow fluctuations in capillary networks. Alternation of the rheological properties of blood plasma and/or blood cells (e.g., density and deformability) as well as changes in capillary density would also provide important experimental conditions for a better understanding of the mechanisms and impacts on low-frequency oscillations of capillary flow in normal and pathological states.
Limitations
The separation of RBCs and blood plasma flow was based on two different fluorophores, which require particular attention to the segmentation of objects in a standardized manner. In the preliminary experiments, the injection volume with SR-101 was calibrated, so the fluorescence of RBCs and blood plasma produced an equivalent intensity on images with two-photon excitation under our experimental conditions. The image segmentation performed with a machine learning method was also adjusted in each image through manual input of the teaching dataset. Therefore, no detectable differences in the widths of RBCs and blood plasma in capillaries were confirmed. However, because of the different optical properties of green and red emission through the depth of brain tissue and blood, penetration was higher for the red-colored blood plasma marker. This asymmetric effect of fluorescence was minimized in the imaging study of surface layers (up to 0.15-mm depth of the cortical surface).
Furthermore, the plasma marker SR-101 can be absorbed by vascular cells, 48 obscuring the boundary between blood plasma and blood vessels. To avoid potential overlap, imaging experiments were conducted only at an early phase, during which SR-101 fluorescence was dominant in blood plasma after intraperitoneal injection. 30 No detectable leakage of fluorescent signals from blood vessel was apparent on the segmented image. The continuum of RBC contours to plasma signals may suggest limited resolution to distinguish glycocalyx layers from the luminal surface of endothelial cells. Due to the limited penetration of two-photon imaging into the adult rat cortex, the parenchymal capillaries were partially imaged at the location where the capillaries were running parallel to the focal plane. Consequently, the lack of complete network structures between the penetrating arterioles and ascending venules was a limitation of the present work. To determine RBC velocity and diameter distributions in three-dimensional microcirculation networks, including deep layers, further innovations in imaging techniques are expected. Due to technical limitations, our capillary bifurcation comparisons were biased over the specific vascular compartment in the cortical surfaces. Specifically, the divergence and convergence bifurcations are closer to the arterial and venous sides, respectively. The junction of capillaries with arterioles or venules can show different features of RBC flow (such as RBC aggregation effects 49 ).
Finally, based on the probability of RBC signals, the apparent residence time was estimated for each pixel. This method relies on the segmentation methods of fluorescent RBCs and thus on the distortion of the shape of the RBCs due to their movement and line scanning.50,51 Distortion of RBC objects certainly affects the measurements and thus does not allow for measurements on an absolute scale. The present study compared the residence time over a single capillary and the relative changes over time. In addition, a shape of the single capillary is rather more straight than curved on the focal plane; therefore, there are minimal effects of inconsistent scanning directions along the capillary. To overcome this limitation, RBC segmentation could be undertaken strictly to extract the representative center of gravity instead of extracting the areas of RBCs. This improvement will allow for absolute measurements and mapping of RBC velocity in capillary networks. Macroscopic validation of impacts of capillary bifurcations and microvascular resistance on blood flow oscillations will also be required, such as the use of the mathematical approach with realistic vascular structure and non-steady suspension flow. 52
Conclusions
Simultaneous imaging of fluorescent RBCs and blood plasma revealed dissociated dynamics of RBCs and plasma flow in penetrating arterioles but not in ascending venules. Divergence bifurcations in parenchymal capillaries caused flow resistance and thus decreased RBC velocity and temporal fluctuations. The movement of RBCs into smaller capillaries can generate slow fluctuations in RBC velocity intrinsically in capillary networks. The current methods can also be applied for fluorescence imaging of cellular neurovascular coupling in capillaries and cellular environment around the capillaries (such as pO2, pCO2, and temperature) under two-photon microscopy.
Supplemental Material
sj-pdf-1-jcb-10.1177_0271678X221125743 - Supplemental material for Spatiotemporal analysis of blood plasma and blood cell flow fluctuations of cerebral microcirculation in anesthetized rats
Supplemental material, sj-pdf-1-jcb-10.1177_0271678X221125743 for Spatiotemporal analysis of blood plasma and blood cell flow fluctuations of cerebral microcirculation in anesthetized rats by Tomoya Niizawa, Ruka Sakuraba, Tomoya Kusaka, Yuika Kurihara, Takuma Sugashi, Hiroshi Kawaguchi, Iwao Kanno and Kazuto Masamoto in Journal of Cerebral Blood Flow & Metabolism
Footnotes
Funding
The author(s) disclosed receipt of the following financial support for the research, authorship, and/or publication of this article: Grant Support: JSPS KAKENHI (19K07795, 22K07317) and JST Moonshot R&D (JPMJMS2023) to KM.
Acknowledgements
The authors acknowledge Dr. Franca Schmid for this valuable discussion.
Declaration of conflicting interests
The author(s) declared no potential conflicts of interest with respect to the research, authorship, and/or publication of this article.
Authors’ contributions
R.S., Y.K., and K.M. designed and performed the experiments; T.N., R.S., T.K., T.S., and K.M. analyzed the data; H.K. provided resources; T.N., R.S., I.K., and K.M. discussed and interpreted the data; and T.N., R.S., and K.M. wrote the manuscript.
Supplemental material
Supplemental material for this article is available online.
References
Supplementary Material
Please find the following supplemental material available below.
For Open Access articles published under a Creative Commons License, all supplemental material carries the same license as the article it is associated with.
For non-Open Access articles published, all supplemental material carries a non-exclusive license, and permission requests for re-use of supplemental material or any part of supplemental material shall be sent directly to the copyright owner as specified in the copyright notice associated with the article.