
Abstract
In this study, dynamic susceptibility contrast-magnetic resonance imaging (DSC-MRI) was used to quantify the cerebral blood flow (CBF), the cerebral blood volume (CBV), and the mean transit time (MTT) and to analyze the changes in cerebral perfusion associated with the cortical lesions in 44 patients with relapsing-remitting multiple sclerosis. The cortical lesions showed a statistically significant reduction in CBF and CBV compared with the normal-appearing gray matter, whereas there were no significant changes in the MTT. The reduced perfusion suggests a reduction of metabolism because of the loss of cortical neurons. A small population of outliers showing an increased CBF and/or CBV has also been detected. The presence of hyperperfused outliers may imply that perfusion could evolve during inflammation. These findings show that perfusion is altered in cortical lesions and that DSC-MRI can be a useful tool to investigate more deeply the evolution of cortical lesions in multiple sclerosis.
INTRODUCTION
Perivascular migration of lymphocytes and increased blood–brain barrier (BBB) permeability are thought to be the first steps of inflammatory lesion formation in multiple sclerosis (MS) central nervous system, and magnetic resonance imaging (MRI) evidence of BBB and microvascular dysfunction have been observed in MS brain.1,2 These findings suggest that the circulatory system may play an important role in the formation of MS lesions.
Brain perfusion can be quantified by applying different imaging techniques, such as positron emission tomography (PET), arterial spin labeling (ASL), dynamic contrast enhanced-MRI (DCE-MRI), and dynamic susceptibility contrast-MRI (DSC-MRI). Positron emission tomography techniques with 15 O-tracers still represent the best available method for perfusion study in the brain, 3 but they require a radioactive tracer and invasive arterial sampling. Arterial spin labeling is a MRI technique that uses blood as endogenous tracer, thus being completely noninvasive.4,5 However, a tradeoff among brain coverage, spatial resolution, and acquisition time has to be found when using ASL techniques, making it currently impossible to obtain a full-brain coverage with good spatial resolution in a clinically reasonable acquisition time. The DSC-MRI and DCE-MRI represent a good compromise between these requirements. They use an exogenous tracer (gadolinium Gd-DTPA) and acquire a set of high-resolution images to study the transient caused by the passage of the tracer in the brain. 6 In particular, DSC-MRI allows to analyze the reduction of the tissue relaxation time (T2*) because of the passage of the tracer in the brain and to quantify several perfusion parameters, namely the cerebral blood flow (CBF), the cerebral blood volume (CBV), and the mean transit time (MTT).7,8 One of the main differences between DSC-MRI and DCE-MRI is that DSC-MRI is based on the assumption that the tracer is nondiffusible (i.e., it does not diffuse from the vessels to the extracellular space), 7 whereas DCE-MRI is usually applied when the tracer is diffusible. 6 Because it is low invasive, more standardized, has a good spatial resolution, and the tracer remains intravascular in MS, DSC-MRI has become the most used perfusion technique in MS studies.
Dynamic susceptibility contrast-MRI has already been applied in MS to study the perfusion in the white matter (WM). Compared with normal controls, patients with relapsing-remitting MS (RR-MS) were found to have a reduced CBF, normal or reduced CBV, and increased or unchanged MTT in the normal-appearing white matter (NAWM).1,9 When WM lesions were classified on the basis of their post-contrast T1 image intensities, acute plaques had significantly higher blood volumes than NAWM, whereas chronic plaques had lower CBV, indicating that active MS lesions were accompanied by vasodilatation whereas inactive lesions were accompanied by a decreased perfusion. 10 Early changes in the regional perfusion preceding evidence of BBB breakdown and inflammation were also described in NAWM.11,12 Moreover, in apparently inactive WM lesions, the CBV was found either increased or reduced and the MTT was prolonged compared with the NAWM of controls. 12
Differently from the WM, DSC-MRI has never been used to study the perfusion of cortical gray matter (GM) in MS. However, cortical lesions are frequently detected in vivo in MS and might play a relevant role in determining physical and cognitive impairment in this disease.13,14 These focal areas of inflammation show significant histologic differences compared with the WM lesions, 15 suggesting regional/tissue-specific pattern of inflammation in MS. Only a few data are currently available on GM perfusion in MS. A significant reduction of CBV and CBF was found in the deep GM (thalamus, putamen, and caudate) in Primary Progressive-MS and RR-MS compared with controls. 16 Up to date, no data on cortical GM perfusion in MS are available.
Here, we describe the results obtained by applying DSC-MRI to study the perfusion of cortical lesions in RR-MS patients.
MATERIALS AND METHODS
PATIENTS
A total of 44 RR-MS patients (31 women, 13 men; F/M: 2.4; median age 37 years, range 20 to 60 years; median expanded disability status scale (EDSS): 2.0, range 1.0 to 4.5; median disease duration 11 years, range 1 to 37 years) were enrolled in this study. The diagnosis was achieved in agreement with the International Criteria.17,18 At study entry, all RR-MS patients were under immunomodulatory therapy: 19 patients received subcutaneous interferon β-1a, 44 μg three times weekly; 12 RR-MS received intramuscular interferon β-1a, 30 μg once weekly; and 13 received subcutaneous Glatiramer Acetate, 20 μg once daily. Steroid therapy in the month before MRI acquisition was an exclusion criterion. Informed consent was obtained from all patients and the study was approved by the Ethics Committee of the University Hospital of Padova on the basis of the ‘Declaration of Helsinki’ and subsequent revisions and of the ‘Convention for the Protection of Human Rights and Dignity of the Human Being with regard to the Application of Biology and Medicine: Convention on Human Rights and Biomedicine.’
Image Acquisition
Magnetic resonance imaging was performed on a 1.5-T Philips Achieva scanner (Philips Medical Systems, Best, The Netherlands). No major hardware upgrades were performed on the scanner during the study, and weekly quality assurance sessions took place to guarantee measurement stability.
The data set includes:
T1-weighted image, 3-dimensional fast field echo with 120 contiguous axial sections with the off-center positioned on zero (TR = 25 ms; TE = 4.6 ms; flip angle = 30°; section thickness = 1.2 mm; FOV = 250 × 250 mm2; matrix = 256 × 256). This image was used to perform the segmentation.
Double inversion recovery (DIR): 2-dimensional multisection sequences with 50 contiguous axial sections (TR = 15,631 ms; TI1 = 325 ms; TI2 = 3,400 ms; section thickness = 3 mm; FOV = 250 × 250 mm2; matrix = 256 × 256). This image, together with FLAIR, was used to highlight and select the cortical lesions (CLs).
Fluid-attenuated inversion recovery (FLAIR): 2-dimensional sequence with 50 contiguous axial sections (TR = 10,000 ms; TE = 120 ms; TI = 2,500 ms; section thickness = 3.0 mm; FOV = 250 × 250 mm2; matrix = 256 × 256). This image, together with DIR, was used to highlight and select the CLs.
Dynamic susceptibility contrast-MRI: 120 T2*-weighted volumes were acquired before and after the injection of bolus of gadolinium Gd-DTPA (bolus dose = 0.1 mg/kg; sequence settings: TR = 1,375 ms; TE = 40 ms; FA = 90°; section thickness = 6.0 mm; FOV = 230 × 230 mm2; matrix size = 256 × 256; gap between slices = 1 mm; 120 total volumes). This image was used to quantify the perfusion parameters.
Postcontrast T1-weighted image: a 2-dimensional sequence with 20 axial sections (TR = 600 ms; TE = 10 ms; slice thickness = 5.5 mm; FOV = 250 × 250 mm2; matrix size 256 × 256; gap between slices 1 mm). This image was used to highlight active CLs.
Postcontrast T1-weighted image: 2-dimensional sequence with 20 coronal sections (TR = 400 ms; TE = 12 ms; slice thickness = 4.5 mm; FOV = 250 × 250 mm2; matrix size 256 × 256; gap between slices 0.5 mm). This image was used to highlight active CLs.
Image Processing
Image data were analyzed on a windows-based workstation. Homemade MatLab (Matlab ver. 7.10.0.499–R2010a, The MathWorks, Natick, MA, USA) code was used to quantify the perfusion parameters. SPM (Statistical Parametric Mapping, SPM8, FMRIB, Oxford, UK) and FSL (FMRIB Software Library, v4.1, FMRIB, Oxford, UK) 19 tools were used for segmentation and co-registration tasks, respectively. Figure 1 shows the analysis pipeline.
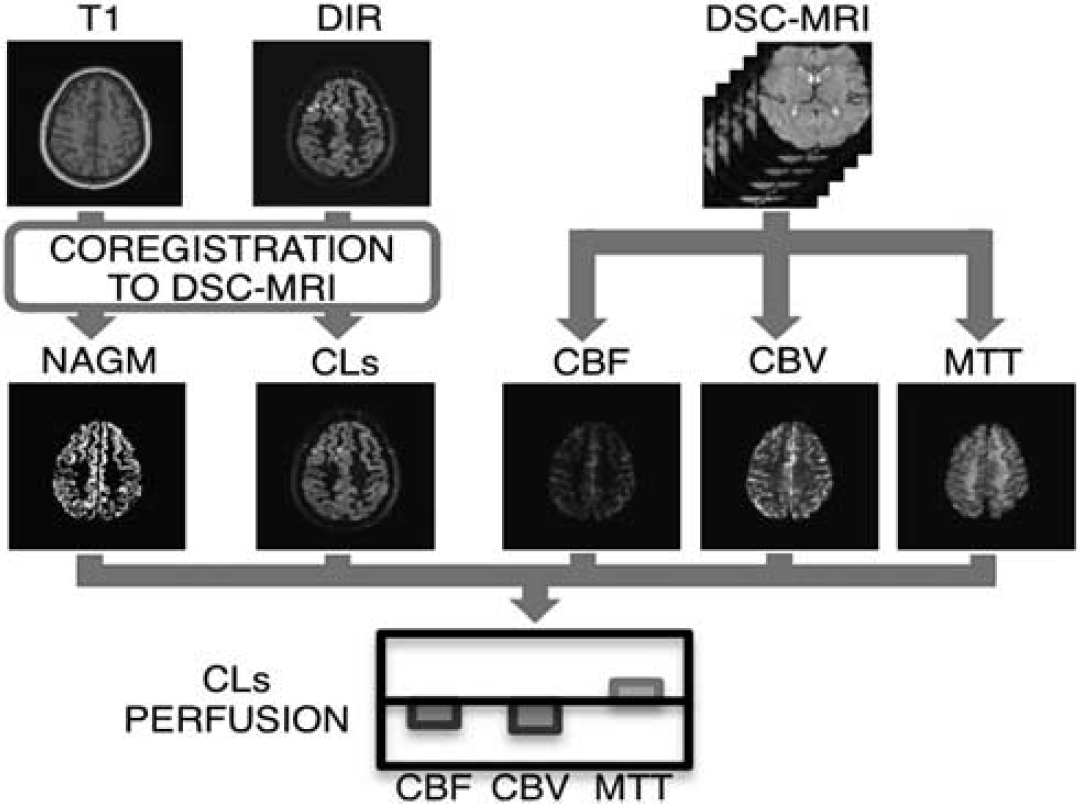
Subject analysis pipeline. Double inversion recovery (DIR) and T1 data are registered to dynamic susceptibility contrast-magnetic resonance imaging (DSC-MRI). The T1 images are segmented to obtain a binary gray matter (GM) mask. Cortical lesions (CLs) are selected on DIR images and excluded from GM mask to obtain the normal-appearing gray matter (NAGM) mask. Cerebral blood flow (CBF), cerebral blood volume (CBV), and mean transit time (MTT) maps are obtained from DSC-MRI data. The NAGM and CLs masks are superimposed to perfusion maps to compute the perfusion impairment in CLs.
Dynamic Susceptibility Contrast-Magnetic Resonance Imaging: Perfusion Quantification
Perfusion parameters were calculated on the basis of the principles of tracer kinetics for nondiffusible tracers, which assumes that the BBB is intact and the tracer does not diffuse in the extravascular space.
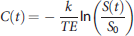
Tracer concentration was obtained from the MR signal S(t) following the relation:
Then, the arterial input function (AIF) was detected on the middle cerebral artery (MCA) for each subject by applying a semiautomatic method for the AIF selection. 21
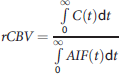
Given the AIF(t) and the C(t), the CBV is defined by the ratio between the voxel and the arterial area under the curve. The relative CBV (rCBV (arbitrary units)) was computed as follows:
22
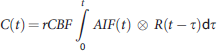
Finally, the MTT was computed as the ratio between rCBV and rCBF:
7

Double Inversion Recovery: Cortical Lesion Detection
All images were assessed by consensus by two experienced observers masked to patients' identity. Lesions were identified on DIR and FLAIR images following the recent recommendations for CL scoring in patients with MS with an interobserver count and classification variability of 2%. 24 Lesions were recognized for their high signal intensity and a region of interest (ROI) was manually drawn for each lesion. Lesions including the underlying subcortical WM or at the junction between GM and WM were excluded to consider only lesions completely included in the GM. The linear transformation required to co-register DIR and FLAIR to DSC images was computed by using FMRIB's Linear Image Registration Tool (FLIRT) with default settings and applied to the CLs. Trilinear interpolation was used when moving the CLs to DSC images, obtaining a value for each voxel in the DSC space (from here called ‘CL value’) that represents the ratio of CL volume contained in the voxel. Several criteria were applied to reduce the partial volume (PV) effect and the vascular component of the image:
Voxels with a ‘CL value’ in DSC space <0.8 (i.e., <80% of the voxel volume is a lesion) were discarded. Ideally, voxels containing only lesion tissue should be selected (i.e., with a ‘CL value’ equal to 1), but this choice would significantly reduce the amount of CLs evaluated in the study. Therefore, we decided to include in the study also voxels containing a small amount of nonlesion tissue, thus increasing the statistical power of the study. Because this is a critical choice in the study, we also studied the impact of the ‘CL value’ threshold on the perfusion parameters (see Results);
Voxels with a CBV five times greater than the mean CBV in the GM were discarded to avoid voxels with a high vascular component;
After the previous two points, lesions smaller than three connected voxels (i.e., <14.5 mm3) in the DSC space were excluded.
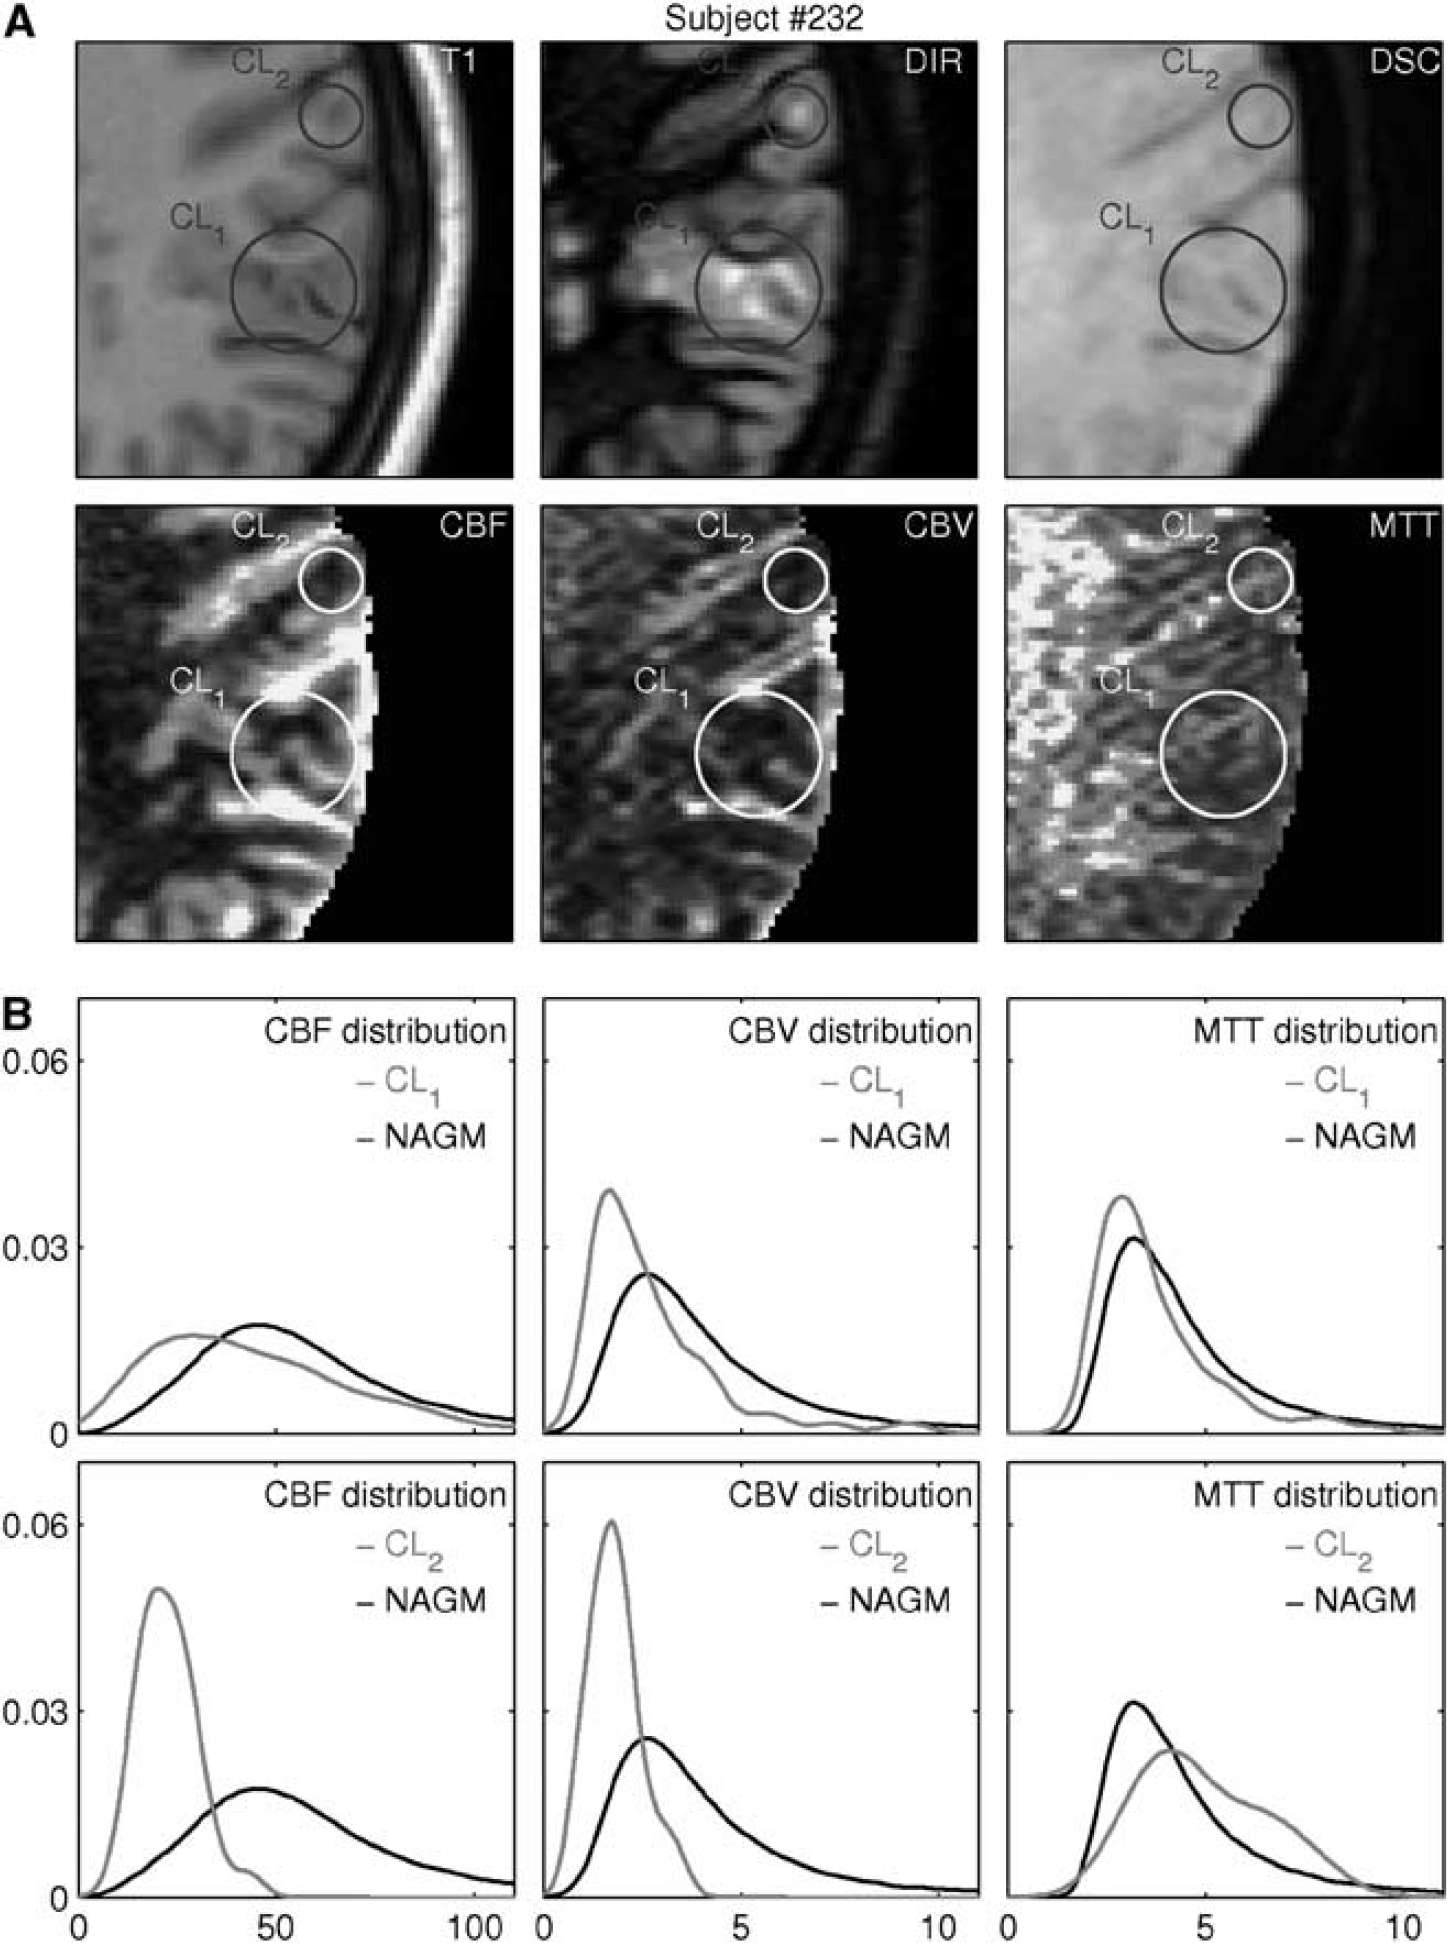
Figure 2 (upper panel) shows an example of the analysis results; CLs are highlighted with circles in both anatomic (T1, DIR, and DSC) and parametric (CBF, CBV, and MTT) images.
Example of the data obtained for each subject. (
Normal-Appearing Gray Matter
The tissue probability map for the GM was computed for each subject on T1 data by using SPM8 segmentation tool with default settings. Then, T1 images and GM probability maps were co-registered first to the DIR images by using FLIRT with default settings and then to DSC images by applying the same transformation previously obtained for the DIR co-registration. Transformations were computed with default settings with the exception of the interpolation method; nearest neighbor was used for the GM probability maps to preserve probability properties. Then, a binary GM mask was obtained by applying a 80% threshold on the GM probability maps. Different thresholds (60%, 70%, 80%, and 90%) have been evaluated to study their impact on the analysis. Finally, voxels in DSC space with a ‘CL value’ different from 0 and voxels with a CBV greater than 5 times the mean CBV in the GM were discarded from the GM binary mask to achieve the normal-appearing gray matter (NAGM) binary mask.
Statistical Analysis
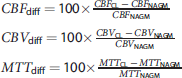
The percentage difference between the CLs and the NAGM was computed for each perfusion parameter in each subject. Percentage differences are defined as follows:
RESULTS
A total of 162 CLs, satisfying the inclusion criteria defined above, were identified in the 44 RR-MS patients. Four CLs from two patients showed evidence of disrupted BBB (gadolinium enhancement) and were excluded from the following analysis. These patients (1 male and 1 female) had a clinical relapse while MRI was performed.
Figure 2 shows the analysis of CL perfusion values in a subject. The first row of the figure shows the T1 and DIR images moved to the DSC space and the corresponding DSC image. The CLs are highlighted by circles to help their detection and the comparison of the different images. Visual inspection of co-registration procedure showed that brain edge, funds, and gyri have been correctly coregistered among the different images. The second row in Figure 2 reports the CBF, CBV, and MTT maps obtained from the DSC data. The CLs circles are drawn in the same position to help in detection and visual analysis. A reduction in CBF and CBV between CLs and the surrounding cortical tissue can be seen in CL2, whereas the visual analysis of CL1 is difficult because of the tortuosity of the funds in the region. Rows 3 and 4 of Figure 2 report the analysis of the CBF, CBV, and MTT distributions in the CLs and in the NAGM. Even if the ranges of the perfusion values in the NAGM and in the CLs overlap for all indices, CBF and a CBV distribution peak in the CLs is moved toward smaller perfusion values compared with the NAGM, whereas no significant differences are present for MTT.
Direct comparison of perfusion values between CLs and NAGM is possible only within a subject, but not among different subjects because only relative CBF and CBV values have been computed. To overcome this problem, we computed the percentage differences between the two tissues in each subject, deriving an index that can be compared among subjects. Table 1 and Figure 3 report the results of this analysis. The statistical analysis showed a significant, strong reduction in CBF and CBV and a nonsignificant, mild increase in MTT. Indeed, ~90% of the lesions show a negative CBFdiff and/or a negative CBVdiff (i.e., a reduction of CBF and/or CBV in CLs compared with the NAGM). Outliers for each perfusion value have been identified using the interquartile range method, and a threshold was set so that normal values correspond to 99.3% coverage for a Gaussian distribution. Cerebral blood flow, CBV and MTT outliers have been labeled CBFdiff_outliers, CBVdiff_outliers, and MTTdiff_outliers, respectively. CBFdiff_outliers, CBVdiff_outliers, and MTTdiff_outliers present only positive values, meaning that outliers present greater perfusion values compared with the NAGM; however, MTTdiff distribution is almost centered around zero and there are no significant differences in MTT between CLs and the NAGM.
Perfusion differences between CLs and NAGM
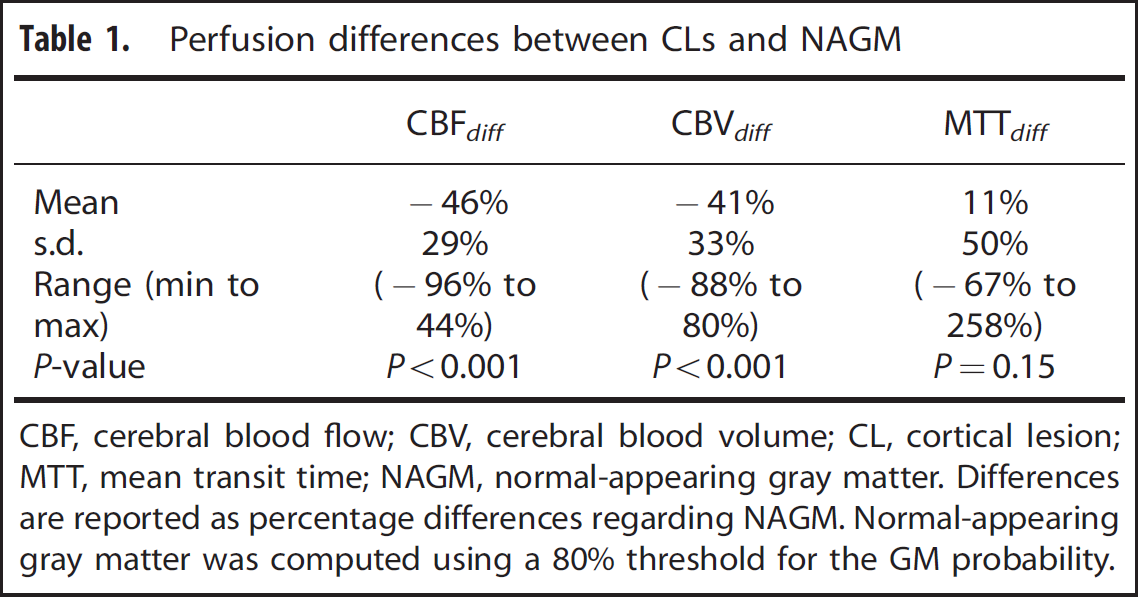
CBF, cerebral blood flow; CBV, cerebral blood volume; CL, cortical lesion; MTT, mean transit time; NAGM, normal-appearing gray matter.
Differences are reported as percentage differences regarding NAGM. Normal-appearing gray matter was computed using a 80% threshold for the GM probability.
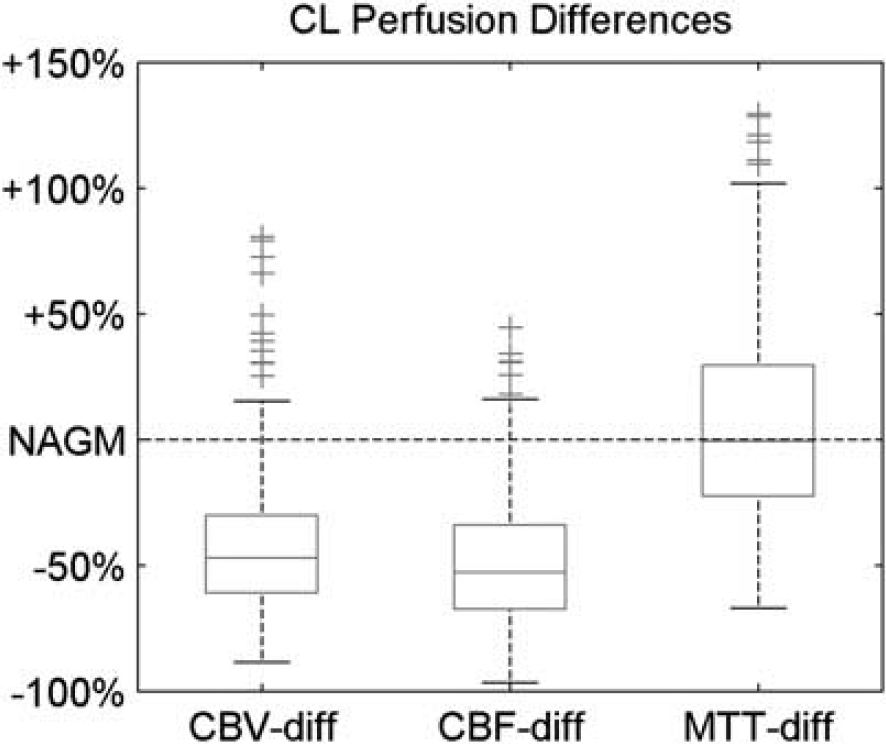
Boxplots of cerebral blood flow (CBF), cerebral blood volume (CBV), and mean transit time (MTT) differences between each cortical lesion (CL). On each box, the central mark is the median, the edges of the box are the 25th and 75th percentiles, the whiskers extend to the most extreme data points not considered outliers, whereas outliers are plotted individually.
The values of CBFdiff versus CBVdiff have been plotted in Figure 4; three groups have been highlighted in the image, standard CLs (i.e., lesions that are neither CBFdiff_outliers nor CBVdiff_outliers), CBFdiff_outliers, and CBVdiff_outliers. Each group has also been evaluated separated from the others. As expected, standard CLs present similar CBFdiff, CBVdiff, and MTTdiff to the whole CL analysis (Table 2), whereas CBFdiff_outliers and CBVdiff_outliers show an increase in CBF and CBV and a trend of reduced MTT compared with the NAGM (Table 2). Noticeably, some lesions belong to both CBFdiff_outliers and CBVdiff_outliers.
Outlier CL analysis
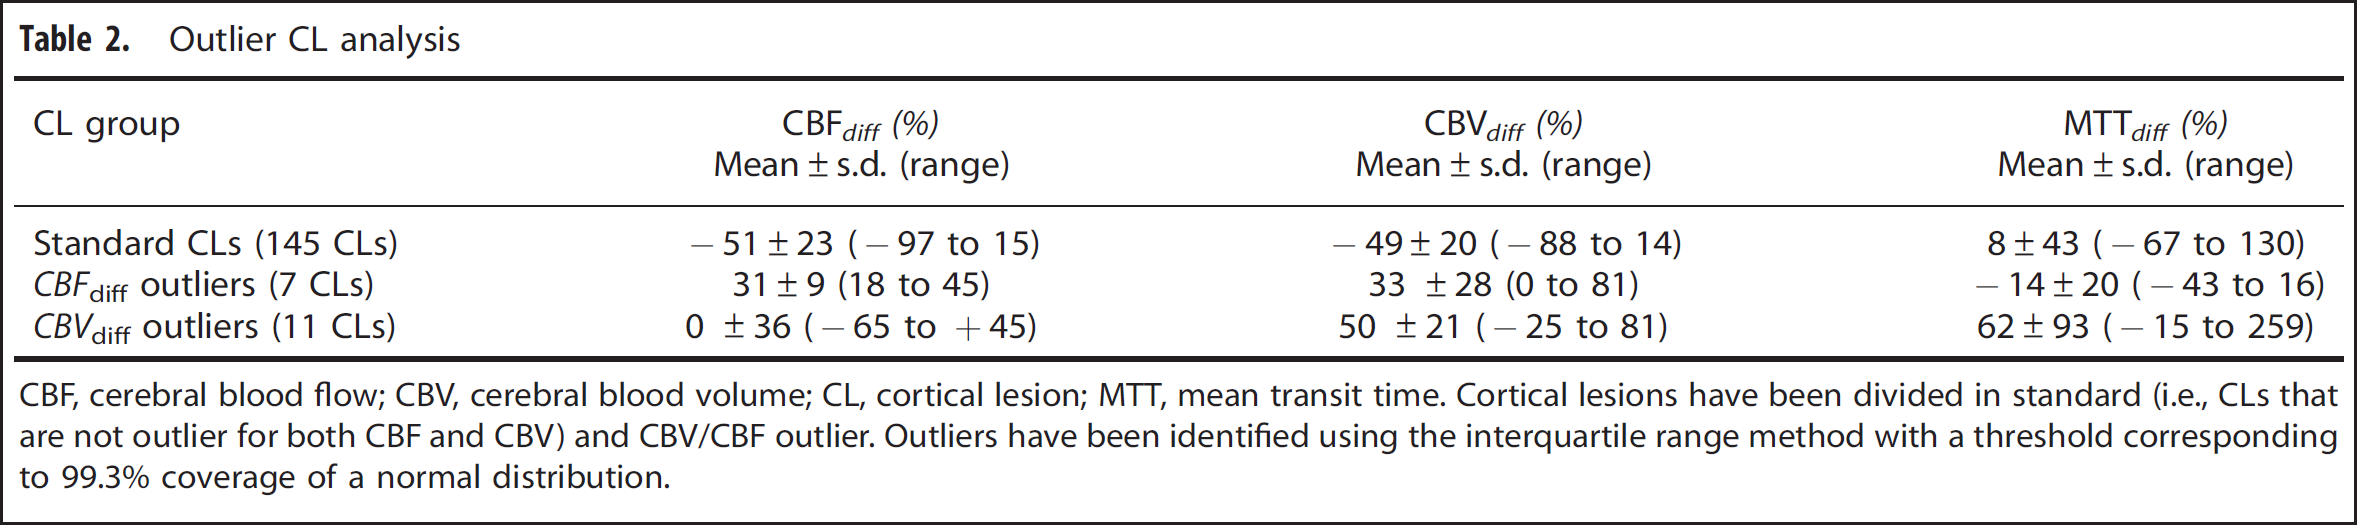
CBF, cerebral blood flow; CBV, cerebral blood volume; CL, cortical lesion; MTT, mean transit time.
Cortical lesions have been divided in standard (i.e., CLs that are not outlier for both CBF and CBV) and CBV/CBF outlier. Outliers have been identified using the interquartile range method with a threshold corresponding to 99.3% coverage of a normal distribution.
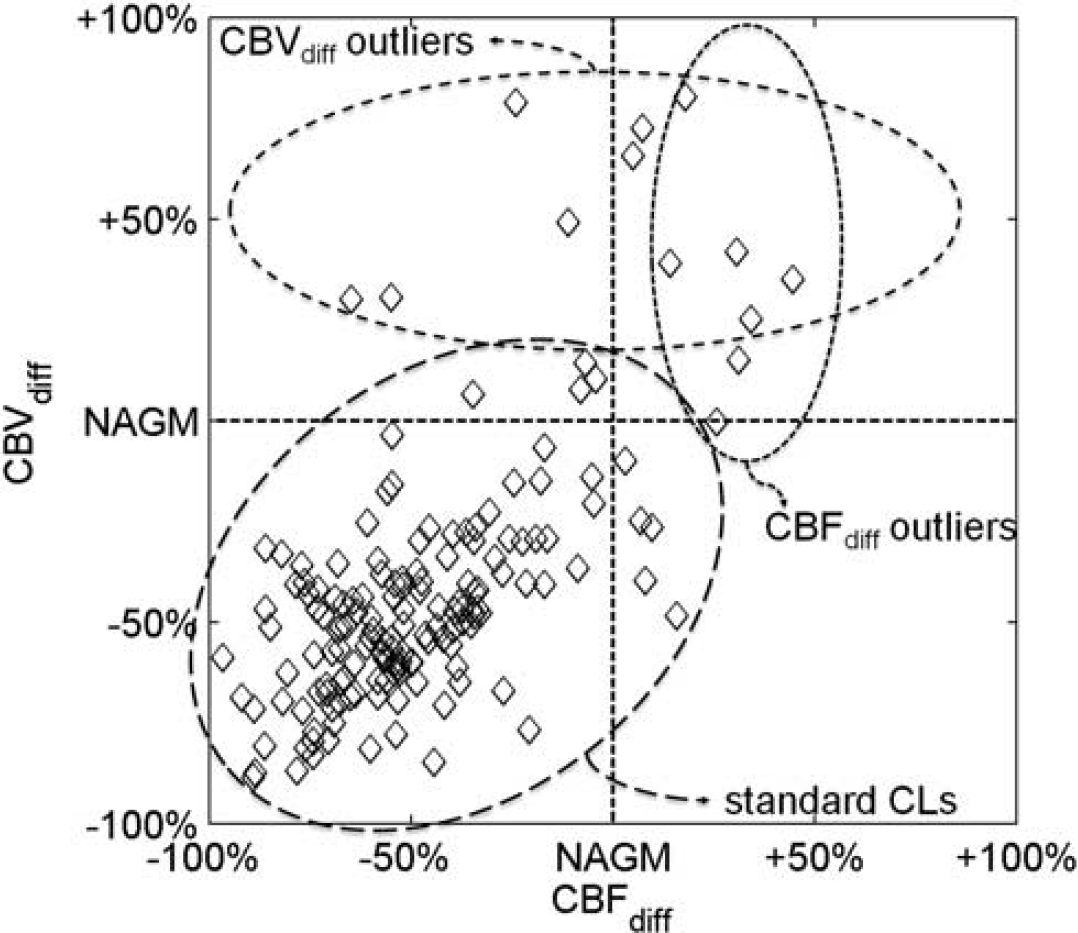
Distribution of the perfusion percentage differences between each cortical lesion (CL) and the normal-appearing gray matter (NAGM). Each lesion is represented with a diamond in the graph. Cerebral blood flow (CBF) and cerebral blood volume (CBV) percentage differences are reported on the x-axis and y-axis, respectively. Cortical lesions (CLs) have been divided in three populations on the basis of the CBFdiff and CBVdiff outliers identified using the interquartile range method with a threshold corresponding to the 99.3% coverage of a normal distribution.
The thresholds used to compute the NAGM and to identify the CL voxels in the DSC images have been studied as possible sources of error. The impact of the NAGM threshold was evaluated using different threshold values for the GM probability map, ranging from 60% to 90%, and computing the consequent perfusion differences between the CLs and the NAGM. Results are reported in Figure 5 and show that CBFdiff distribution does not change significantly with the NAGM threshold, showing almost the same median values, percentile edges, and outliers. The same analysis performed for CBVdiff and MTTdiff provides similar results (not shown).
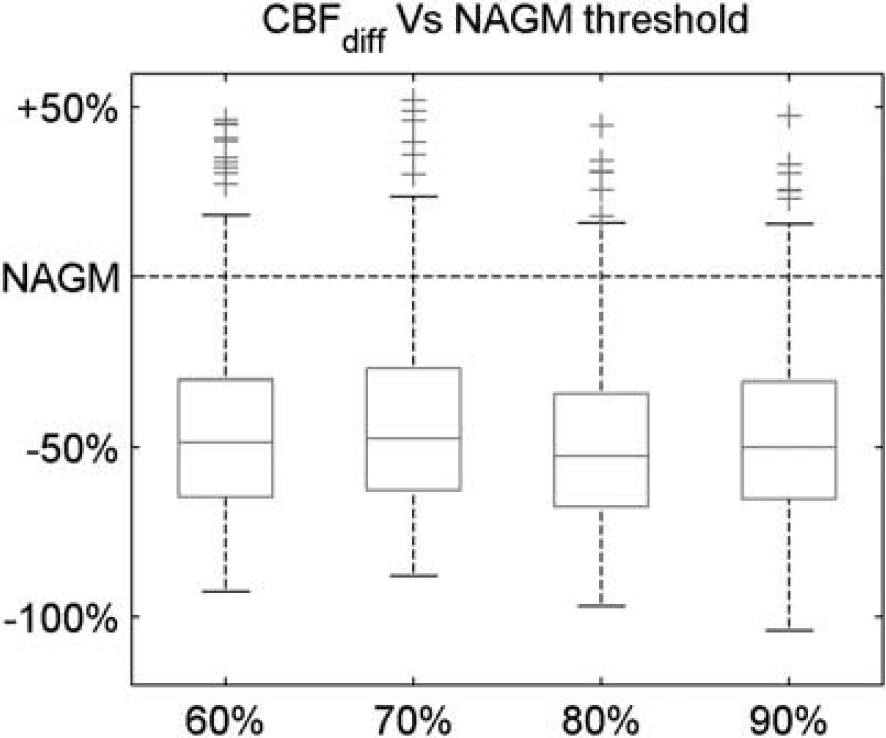
Boxplot of the cerebral blood flow (CBF) percentage differences between each cortical lesion (CL) and the normal-appearing gray matter (NAGM) using different thresholds to compute the NAGM. On each box, the central mark is the median, the edges of the box are the 25th and 75th percentiles, the whiskers extend to the most extreme data points not considered outliers, whereas the outliers are plotted individually.
We used the ‘CL value’ to select the DSC voxels included in the lesions. The ‘CL value’ can be interpreted as the amount of lesion in the DSC voxel. For example, a DSC voxel with a ‘CL value’ equal to 1 is completely contained in the CL. Conversely, a ‘CL value’ equal to 0.5 means that the DSC voxel is only half contained in the CL, and thus the remaining part contains normal tissue (either WM or GM) and its PV is equal to 50%. In this study we set a ‘CL value’ threshold to 0.8; therefore, up to 20% of each voxel can contain nonlesion tissue (i.e., PV ≤20%). We studied the impact of this choice analyzing the CBFdiff distribution with different PV allowed (Figure 6). As the allowed PV increases, the amount of normal tissue included in the CLs increases and the differences between the CLs and the NAGM perfusion decrease. Nevertheless, such reduction only partially affect the CBFdiff distribution, which remains stable over a wide range of PV values. This suggest that the effect of the reduced perfusion in the CLs remains the main component in the CBFdiff index, even with a small amount of PV allowed. In a similar way, the PV impact on CBVdiff and MTTdiff has also been evaluated, providing results similar to CBFdiff ones (not shown) and confirming that the introduction of a small amount of PV does not affect the estimates of the perfusion difference indices while allowing to increase the number of CL voxels and increasing the statistical power of the analysis.
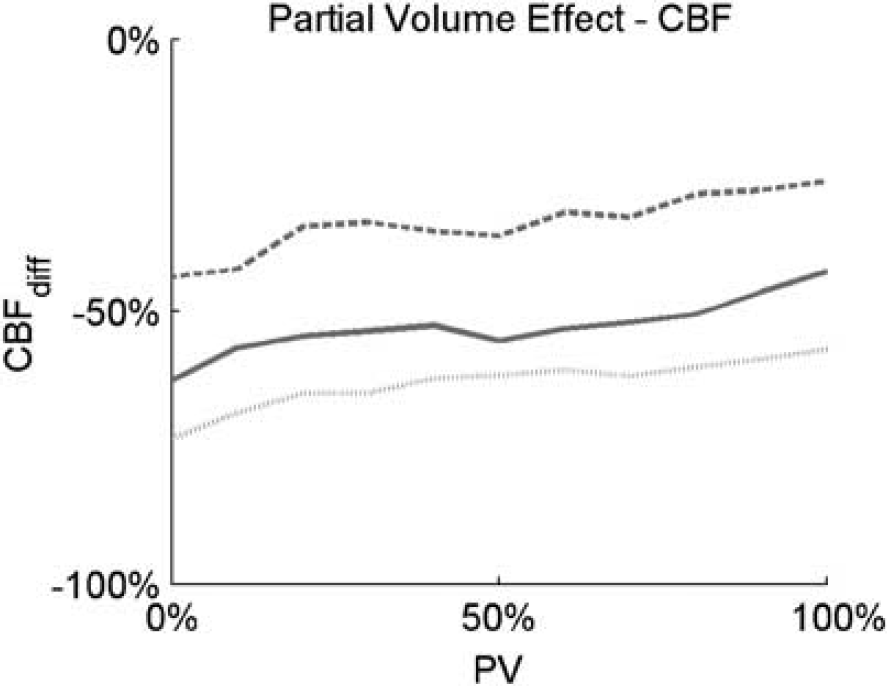
Study of the partial volume impact on the CBFdiff. Partial volume is defined as the maximum amount of non-CL volume allowed in a voxel. Dotted, straight, and dashed lines are the CBFdiff 25th, 50th, and 75th percentiles, respectively. CBF, cerebral blood flow; CL, cortical lesion.
DISCUSSION
To our knowledge, this is the first study that explores the perfusion of the inflammatory lesions in the cortex of MS patients.
The main finding of the study is that the majority of CLs are characterized by reduced CBV and CBF compared with the NAGM, i.e., they are hypoperfused. A reduced perfusion suggests a reduced metabolic activity or a tissue degeneration. This is in line both with the concept that CLs are usually ‘less inflammatory’ than WM lesions and with the relevant neurodegeneration/neuronal apoptosis observed in their context.15,25
Another important aspect of the study is the analysis of the outlier CLs. Outlier CLs present only increased CBFdiff and/or CBVdiff, suggesting that they are characterized by an increased metabolic activity. One can speculate that outlier analysis complies with the hypothesis that CLs, like WM lesions, 12 may undergo different perfusion phases, i.e., stages characterized by reduced or increased perfusion parameters. This is in agreement with the evolution of MS-related pathology. The first inflammatory phase is characterized by increased BBB permeability, extravasations of lymphocytes, and activation/proliferation of cells of the macrophage lineage. 26 It is reasonable to assume that this stage could be associated with an increased metabolism, and thus with an increased local perfusion, as showed by outlier CLs. With the tissue damage and cell loss progression (demyelination, neuronal apoptosis), a decrement of the local metabolism is expected, and therefore the perfusion decreases. Although CLs are considered ‘less inflammatory’ compared with WM lesions, 15 the identification of lesions characterized by gadolinium enhancement 27 and others characterized by increased CBF and/or CBV clearly indicates that they have an inflammatory origin. However, a longitudinal study is required to strengthen this hypothesis.
This study was performed comparing CLs with the NAGM. It can be argued that a direct comparison of absolute perfusion parameters between CLs and the other tissues of the brain should be the most appropriate way to study CL perfusion. We reported the direct comparison between CLs and NAGM in a single subject, obtaining the same findings of the difference indices. However, this analysis cannot be performed among different subjects as absolute quantification in DSC-MRI is still an open issue because the proportionality constants in the model equations are unknown28,29 and for intrinsic limitations of the applied model.5,20 To overcome these problems, we compared the perfusion values in the CLs with a reference region as already performed by Haselhorst et al. 10 The choice of the reference region is critical for the study. White matter is the common reference region in DSC-MRI studies; however, WM perfusion has been shown to be seriously impaired in MS patients,10,12 even in NAWM.1,9 Therefore, we decided to use the NAGM as reference. Moreover, because CLs come from GM degeneration, NAGM is closer to CLs than other brain tissues. We also studied the impact of the NAGM as reference using different GM thresholds (Table 1 and Figure 3) and using a small ROI close to the CL in place of the whole GM (not shown). The results from this analyses confirmed that even if the exact figures change slightly with the reference, the significant differences are independent from it, improving our confidence in the presented results.
Another important step in the DSC-MRI data analysis is the AIF selection procedure, because errors in the AIF introduce a bias in the perfusion parameter estimates.7,30 Different approaches have been proposed in literature to compute the AIF to minimize the errors in the AIF selection,21,31,32 but a standard procedure has not been achieved yet. In this study, we applied an automatic method that has already been used for clinical purposes 33 and that was proved to minimize errors in the AIF quantification. 21
Another main limitation of the study is the presence of PV effect because of the low spatial resolution of DSC-MRI technique, both in absolute terms and compared with DIR images. To reduce its impact, our analysis focused on large CLs (i.e., >3 voxels in the DSC space) completely included in the GM (i.e., CLs close to the junction between GM and WM are discarded), and we discarded voxels containing large vessels (i.e., characterized by a high CBV) and considered only voxels with at least 80% of the volume identified as CL. Furthermore, we directly tested the impact of the PV on the CBFdiff parameter, showing that the difference between NAGM and CLs remains well marked even at high PV levels. Finally, PV cannot be completely avoided even when using different perfusion techniques, and the final voxel size in DSC-MRI is comparable or better than that of PET and ASL (1.5T).34–37
Noise, PV effects, and image nonuniformity because of magnetic field inhomogeneities are well-known confounding factors for the characterization of tissue types based on DSC-MRI perfusion maps and constitute a major limitation to the accuracy of DSC-MRI estimates. In particular, noise in the data should be taken into account by its explicit recognition in the quantitative method used for perfusion estimation. However, noise presence deteriorates precision and accuracy of the estimates even in this case. Partial volume presence could be limited enhancing DSC-MRI image resolution and/or minimizing its effect by integration of the DSC-MRI data with structural information, as we did in our study. Thus, an accurate co-registration step is necessary to correctly integrate anatomic and perfusion information to separate different tissues, such as WM, GM, CSF, and CLs. The goodness of the co-registration step is crucial in particular in this study, where relatively small structures are investigated. For these reasons, in our study we carefully checked all co-registrations and corrected or discarded inadequate elaborations. However, even when the co-registration phase is performed as better as possible, PV and registration errors on the results can only be limited and not completely overcome.
In conclusion, not only did this study show that CL perfusion parameters can be used to characterize the current state of MS, but also that they should be considered as potential neuromarkers to assess the evolution of the disease. The impact of these parameters on diagnostic and prognostic settings will be assessed in a future longitudinal study evaluating a large number of patients, CLs, and potential neuromarkers, such as the number and volume of CLs together with their perfusion values. A feature selection analysis will point out what marker candidates are the most important to predict the progression of MS in patients.
DISCLOSURE/CONFLICT OF INTEREST
The authors declare no conflict of interest.