
Abstract
We have examined sensitivity and specificity of pseudocontinuous arterial spin labeling (PCASL) to detect global and regional changes in cerebral blood flow (CBF) in response to two different psychoactive drugs. We tested alcohol and morphine in a placebo-controlled, double-blind randomized study in 12 healthy young men. Drugs were administered intravenously. Validated pharmacokinetic protocols achieved minimal intersubject and intrasubject variance in plasma drug concentration. Permutation-based statistical testing of a mixed effect repeated measures model revealed a widespread increase in absolute CBF because of both morphine and alcohol. Conjunction analysis revealed overlapping effects of morphine and alcohol on absolute CBF in the left anterior cingulate, right hippocampus, right insula, and left primary sensorimotor areas. Effects of morphine and alcohol on relative CBF (obtained from z-normalization of absolute CBF maps) were significantly different in the left putamen, left frontoparietal network, cerebellum, and the brainstem. Corroborating previous PET results, our findings suggest that PCASL is a promising tool for central nervous system drug research.
Introduction
One of the main objectives in central nervous system (CNS) drug development is to identify global and regional effects of drugs on the brain, and to establish a link between these factors and the clinical outcomes. Global change in cerebral blood flow (CBF) is an important marker of cerebral autoregulation (Heiss and Podreka, 1978), whereas the regional distribution of CBF might reflect drug effects on functional brain activity. Initially, 15O-PET was used to detect drug effects on cerebral circulation (Ito et al, 1999; Volkow et al, 1988). However, replication and repetition of positron emission tomography (PET) studies is costly and not widely available. Besides cost and availability, drawbacks include radiation hazards that prohibit repeated measurements within the same subject over short periods of time. Yet, the ability to perform repeated measurements provides opportunity for better characterization of concentration-dependent drug effects and placebo by time interaction effects. Therefore, research in magnetic resonance imaging techniques for perfusion imaging, such as arterial spin labeling (ASL), aims to offer an advantageous alternative to PET for clinical pharmacology (Detre et al, 2009).
Perfusion imaging allows a quantitative measurement of the CBF based on the movement of magnetically labeled endogenous water molecules of the arterial blood. In the last few years, the introduction of clinical medium field magnetic resonance imaging scanners (3 T), background suppression, and improved labeling schemes based on a pulsed version of continuous ASL (pulsed- or pseudocontinuous ASL, PCASL) has led to maturation of ASL. Current implementations enable whole-brain perfusion imaging including the cerebellum at a resolution higher than 3 × 3 × 7 mm3 within 5 minutes (Dai et al, 2008; van Osch et al, 2009). Recent studies have characterized the physiological basis of perfusion functional magnetic resonance imaging (fMRI) signal and have established its concordance with CBF measurement using oxygen-15 positron emission tomography (15O-PET) (Bokkers et al, 2009; Detre et al, 2009).
In this study, we have examined the applicability of PCASL in pharmacological research by performing repeated PCASL measurements of the ‘resting-state’ perfusion in a randomized, placebo-controlled study of the effects of alcohol and morphine on CBF. The reason for choosing two substances is to examine PCASL's sensitivity beyond nonspecific changes in circulation that result from physiological effects of these drugs. For PCASL to be applicable for pharmacological research, it has to be sensitive to minute and regional changes in brain areas where the drugs act, above the general physiological effects.
As the first step in exploring the usefulness of PCASL for pharmacological CNS research, we chose alcohol and morphine. Alcohol and morphine are two well-characterized substances in psychoactive drug studies with both overlapping and distinct effects. Both alcohol (Blaha et al, 2003; Luksch et al, 2009; Sano et al, 1993) and morphine or similar opiate drugs are vasodilators, and increase global cerebral perfusion (Kofke et al, 2007; MacIntosh et al, 2008). Both alcohol and morphine induce euphoric and sedative effects. Several studies have shown that both alcohol and morphine alter brain activity in regions such as cingulate cortex, insula, somatosensory, and motor cortices, as well as hippocampus, basal ganglia, cerebellum, and brainstem, which are associated with behavioral and physiological effects of these drugs. (See Supplementary Table for reference to previous studies.) However, whereas morphine effects are primarily coupled to regional binding potential for μ-opioid receptors (Baumgartner et al, 2006; Zubieta et al, 2001), alcohol (ethanol) primarily targets a subunit of GABAA receptors (Hanchar et al, 2006), causes a global suppression of glucose metabolism (de Wit et al, 1990; Volkow et al, 2008), and affects widespread neuroendocrine and neurotransmitter systems throughout the brain, including dopaminergic, serotonergic, and even opiate neurotransmitter systems (Koob et al, 1998). This raises the question whether PCASL is able to identify overlapping and distinct drug effects that corroborate existing PET findings.
Another reason for starting with these substances is because we have developed and validated infusion protocols based on pharmacokinetic models for each of these drugs (Sarton et al, 2000; Zoethout et al, 2008), which enable us to achieve pseudo-steady plasma concentration levels of each drug for prolonged periods, thereby minimizing the intersubject and intrasubject pharmacokinetic variations and allowing for equilibration of drug concentrations in the brain. Thus, examining the effect of these drugs on regional cerebral perfusion in the same subject, without any task or perceptual condition, helps answer an important question about the substance specificity of the effects measured by PCASL. We examine drug effects on the global average CBF, and provide statistical maps of regional distribution of CBF across the brain (absolute CBF), and regional changes in relative CBF (rCBF; z-normalized to the global average). Although related, these various metrics provide complementary information about effects of drugs on systemic physiological effects (from global mean perfusion and absolute CBF distribution), and about interaction between different regions about global effects (from rCBF), which might be linked to adaptive brain function. These effects will be further examined in
Materials and Methods
Subjects
A total of 12 healthy male participants (age 18 to 40 years) volunteered for a randomized double-dummy, double-blind, placebo-controlled study involving three visits (each 1 week apart). Exclusion criteria included any kind of implants, pacemakers, or prothesis; any history of medical disorders that pose risk to subjects (e.g. opioid allergy, positive hepatitis B, C or HIV, cardiac or vascular disorder; asthma or pulmonary disease, major gastrointestinal abnormalities, peptic ulceration, hepatic, neurological, psychiatric, hematological, endocrine, renal, or major genitourinary disease) or jeopardize the aim of the study by introducing confounds (e.g. prevalence of illicit drug usage, daily consumption of more than four alcoholic beverages, cigarette smoking, heavy caffeine dependency, and irregular diurnal rhythm).
Drug Infusion
All drug and placebo sessions were randomized. During each visit, subjects experienced identical experimental procedures but in each session, different drug compounds were administered. Placebo occasions consisted of a sham procedure using a glucose 5% solution, including computer-driven adaptations of infusion rates and breath alcohol measurements.
We used a breath alcohol clamping method paradigm that provides accurate stable levels of alcohol (O'Connor et al, 1998), as previously shown (Zoethout et al, 2008). We aimed for maintaining alcohol levels at 0.6 g/L for 90 minutes. Alcohol concentrations were controlled based on an intravenous ethanol clamping paradigm using ethanol 10% in glucose 5% (Zoethout et al, 2008). To minimize infusion pain, alcohol placebo occasions consisted of a sham procedure using a glucose 5% solution, including computer-driven adaptations of infusion rates and breath alcohol measurements. Infusion rates required to maintain stable alcohol levels were computed by a nonblind staff member without any other involvement in the study, based on measurements of breath alcohol at 5 minute intervals between 0 and 30 minutes, at 10 minute intervals between minutes 30 and 60, and 30 minute intervals between minutes 60 and 300 after the start of the placebo or drug administration.
Morphine infusion was conducted according to pharmacokinetic models established earlier (Sarton et al, 2000). To reach stable serum levels of morphine (80 nmol/L), an initial bolus of 100 μg/kg/h was infused during 1 minute, followed by a continuous infusion of 30 μg/kg/h for 2.5 hours. Total volume of morphine infusion was ~ 14.5 mg—a safe dose within the therapeutic range of intravenous morphine for acute pain. To determine the plasma concentration of morphine, venous blood was collected in 5 mL plain tubes (Becton and Dickinson and company, Franklin Lakes, NJ, USA). Blood samples were taken at 0, 15, 30, 50, 60, 90, 120, 150, 180, 210 and 270 minutes after the start of the placebo or drug administration. All samples were centrifuged for 10 minutes at 2000 G between 30 and 45 minutes after collection. Next, plasma samples were stored at −21°C. Plasma concentrations of morphine were determined using liquid chromatography with tandem mass spectrometry (Sarton et al, 2000).
Pharmacodynamic Assessments
Computerized visual analog scales (VASs) were used to determine whether drugs induced measurable subjective CNS effects. All VASs were performed once at baseline and were repeated at 30, 60, 90, and 120 minutes after the start of infusion. The VAS Bond and Lader (Bond and Lader, 1974) was used for the subjective assessment of the state of mind at that moment. Three factors corresponding to ‘alertness’, ‘mood’, and ‘calmness’ can be derived from the VAS Bond and Lader. The VAS Bond and Lader scores are expressed in millimeter (mm), in which 50 mm indicates a normal feeling. We also used VAS nausea and VAS feeling drunk, each consisting of a single scale in which the extreme left side (0 mm) corresponds to, for instance, ‘not nauseous at all’ and the extreme right side (100 mm) to ‘maximum nauseous’. Subjects were asked to indicate a single point on the scale, reflecting their amount of nausea.
Physiological data were measured during scanning using the standard scanner equipment. We averaged the heart rate over the period of each scan (~4 minutes). The respiratory signal over the scanning period was Fourier –transformed, and the highest harmonic was used as representative of the average respiration rate during the scan.
Image Acquisition and Processing
A 3T Achieva scanner (Philips Medical System, Best, the Netherlands) was used for image acquisition. The PCASL acquisitions were part of a larger resting-state fMRI study that will be reported elsewhere (Khalili-Mahani et al, 2011).
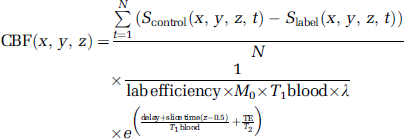
The CBF was measured using PCASL (Dai et al, 2008; van Osch et al, 2009) immediately before and 120 minutes after drug injection began. A total of 30 pairs of perfusion-weighted and control scans (single shot echo planar imaging (EPI), 17 slices of 7 mm with an in-plane resolution of 3 × 3 mm2, sensitivity-encoded (SENSE) factor 2.5, time of echo (TE) = 13.9 ms at a delay of 1525 ms, slice time 35 ms) were obtained (total scan time of 4 minutes 10 seconds). Data for each subject was inspected visually to rule out deleterious intraacquisition motion artifacts. For each subject, we obtained six PCASL data sets (Placebopre, Placebopost, Morphinepre, Morphinepost, Alcoholpre, and Alcoholpost). For each set, voxelwise CBF was computed using
Having computed CBF in native space for each subject, we spatially standardized them to the MNI152 template (Montreal Neurological Institute, Montreal, QC, Canada) to be able to do group-level statistical inference testing. Spatial standardization involved generating an unbiased CBF template for every subject by first, a rigid body registration using FMRIB's Linear Image Registration Tool (FLIRT, with 6 degrees of freedom, based on reducing the least square cost function, and resampling with trilinear interpolation) of each image to the other 5 images in the series; and next, generating the template by averaging the 30 resulting images. This subject template was then registered to the MNI152 template (Montreal Neurological Institute) using FLIRT, with six degrees of freedom, based on reducing the least square cost function, and under sampled to 2 mm isotropic resolution with trilinear interpolation. The resulting transformation matrix was used to align all individual CBF maps to the MNI152 space. A 5 mm blurring kernel was used to smooth the resulting CBF maps. The resulting absolute CBF maps were masked with an eroded standard MNI152 brain mask.
After spatial standardization, we defined three metrics: global mean CBF (averaged over the spatially registered brain volume), absolute CBF (which is the spatially normalized CBF maps obtained above), and rCBF maps (obtained by voxelwise z-transformation of each one of the 72 absolute CBF maps with respect to its own global mean and its own standard deviation (s.d.). This produced normalized CBF maps whose global mean and s.d. (computed across the whole-brain volume) were 0 and 1, respectively. The areas of high
Statistical Analysis
Repeatedly measured pharmacodynamic data (3 treatments × 5 times × 12 subjects) were compared with a mixed model analysis of variance with fixed factors treatment, time, and treatment by time and random factor subject, subject by treatment, and subject by time and the average prevalue (average over all measurements at or before time = 0) as covariate (SAS for windows V9.1.2; SAS Institute, Cary, NC, USA). Related graphs of these data were drawn with Prism 4.0 (Graphpad Software, La Jolla, CA, USA).
To avoid assumptions about normal distribution of the data, analysis of variance for repeated measures of global mean CBF (3 treatments × 2 times × 12 subjects) was conducted nonparametrically using Friedman's test with Dunn's correction for multiple comparisons.
Regional changes in CBF were determined nonparametrically. Permutation-based statistical inference (Nichols and Holmes, 2002; 5000 permutation tests) was used in a triple
In the Supplementary Materials, we also provide a description of the effects associated with post versus pre (importantly placebo) at uncorrected
Region of Interest Quantification of CBF Changes
To quantify CBF changes under each treatment within statistically significant clusters, we computed the difference of the ratio of absolute CBF within the region of interest (ROI) about global mean at each time point: ΔCBFROI = absolute CBFROI (post)—absolute CBFROI (pre) and ΔrCBFROI = (absolute CBFROI (post)/global CBFpost)—(absolute CBFROI (pre)/global CBFpre). These computations provide a numerical estimate of the CBF effect sizes that satisfied the criteria for statistical significance of the tested model, and help understanding and interpretation of the regional effects.
Effects of Physiological Factors on CBF Maps
It has been shown that altered respiration because of opiate treatment leads to a hypercapnic-related increase in CBF (MacIntosh et al, 2008; Pattinson et al, 2007). Also, heart rate increase because of alcohol might be associated with vasoreactive changes that alter the arterial blood flow velocity (Blaha et al, 2003). Because respiration (after morphine administration) and heart rate (after alcohol and placebo) were significantly affected by treatment, their effect on global mean and regional absolute CBF was examined.
First, regression analysis was performed to determine how much of variation in the global mean CBF was explained by heart and respiration rates. Second, effects of respiration and heart rate variations on the topography of the absolute CBF changes were tested by including a demeaned vector of both respiration and heart rate in the statistical models tested above.
Results
Pharmacokinetic Profiles
Figure 1 illustrates the individual pharmacokinetic profiles. At the time of posttreatment scan, average morphine levels were at 68.04 ± 8.8 nmol/L and average alcohol levels were at 0.63 ± 0.038 (g/L).
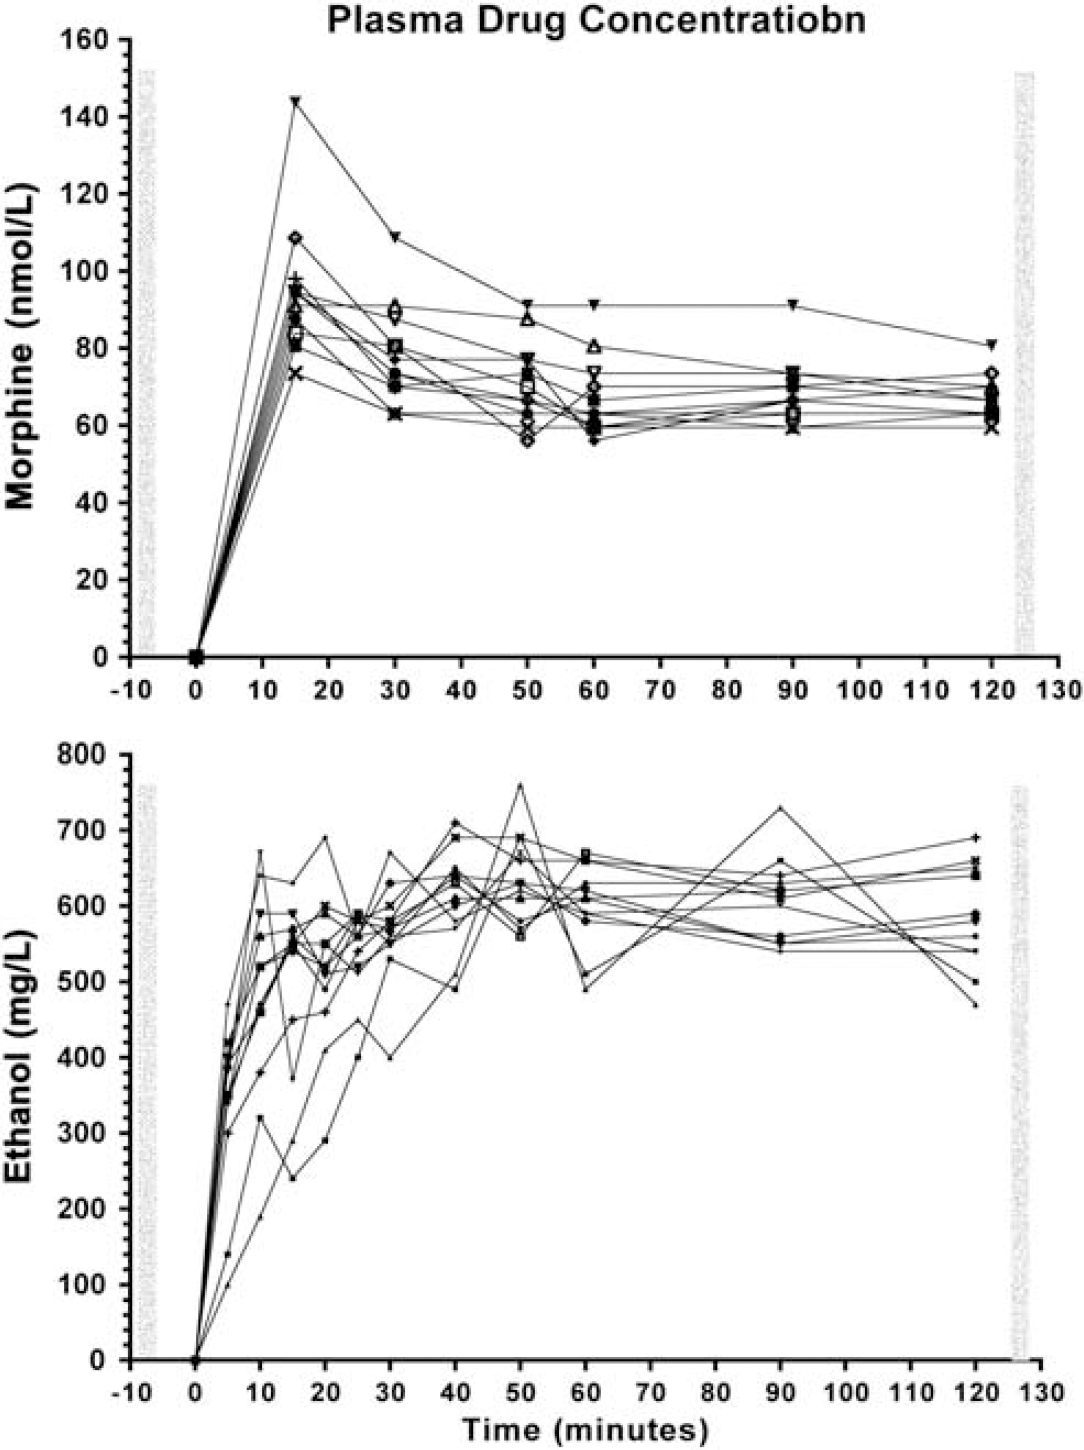
Pharmacokinetic profiles in the 12 individuals. Plasma concentration of morphine (top) and alcohol (bottom). The vertical bars correspond to when the pseudocontinuous arterial spin labeling images were acquired.
Pharmacodynamic Effects
Table 1 summarizes the results of the mixed model analysis of variance of the pharmacodynamic effects. Compared with placebo, morphine treatment increased calmness and feeling of nausea, and reduced respiration rate and heart rate. There was a trend for reduced alertness after morphine administration compared with placebo. Compared with placebo, alcohol treatment increased the drunkenness feeling and heart rate. Compared with baseline, heart rate significantly decreased after placebo treatment.
Pharmacodynamic effects
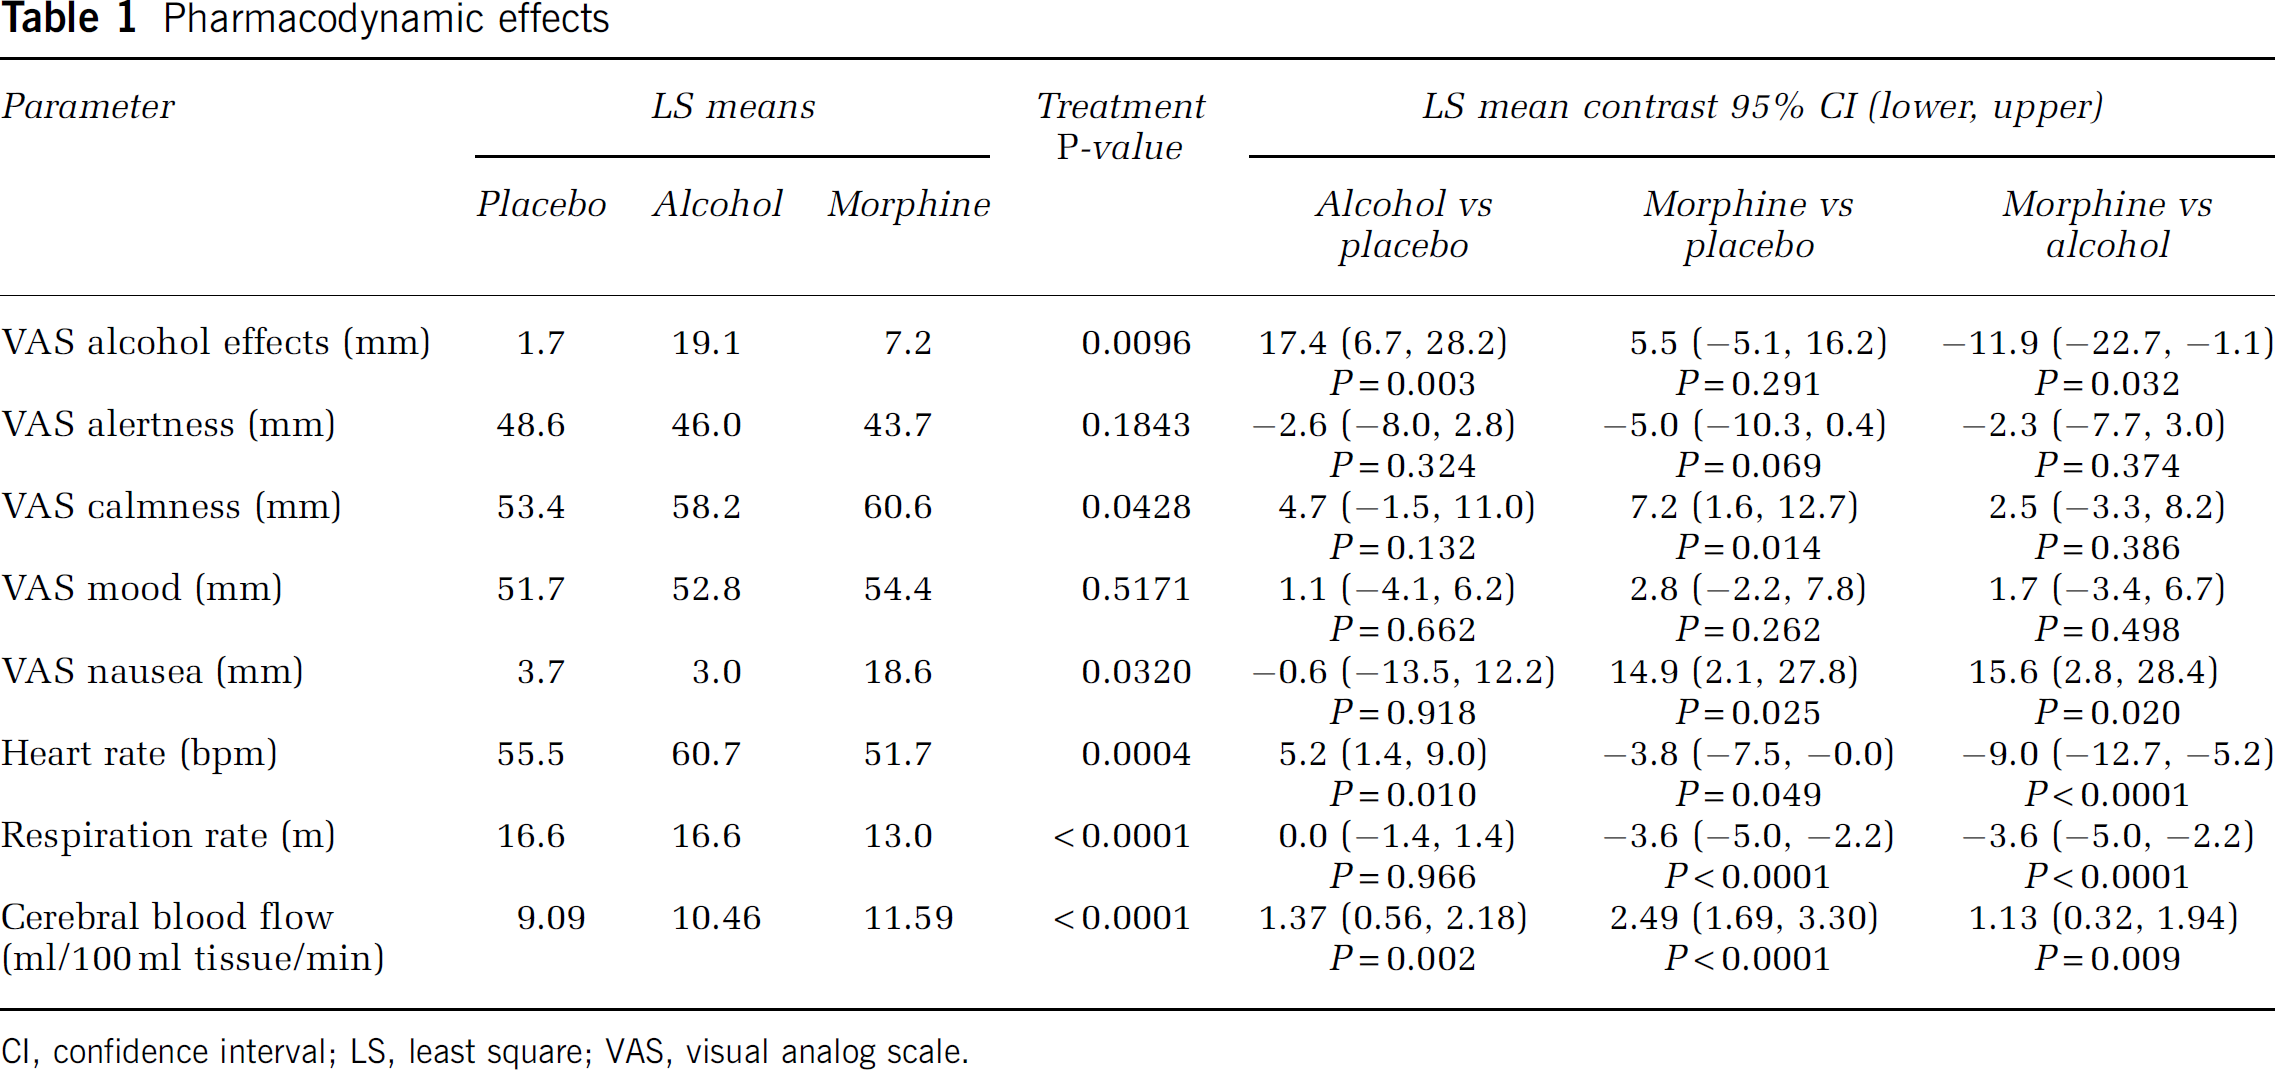
CI, confidence interval; LS, least square; VAS, visual analog scale.
Effects of Drug on Global and Regional CBF
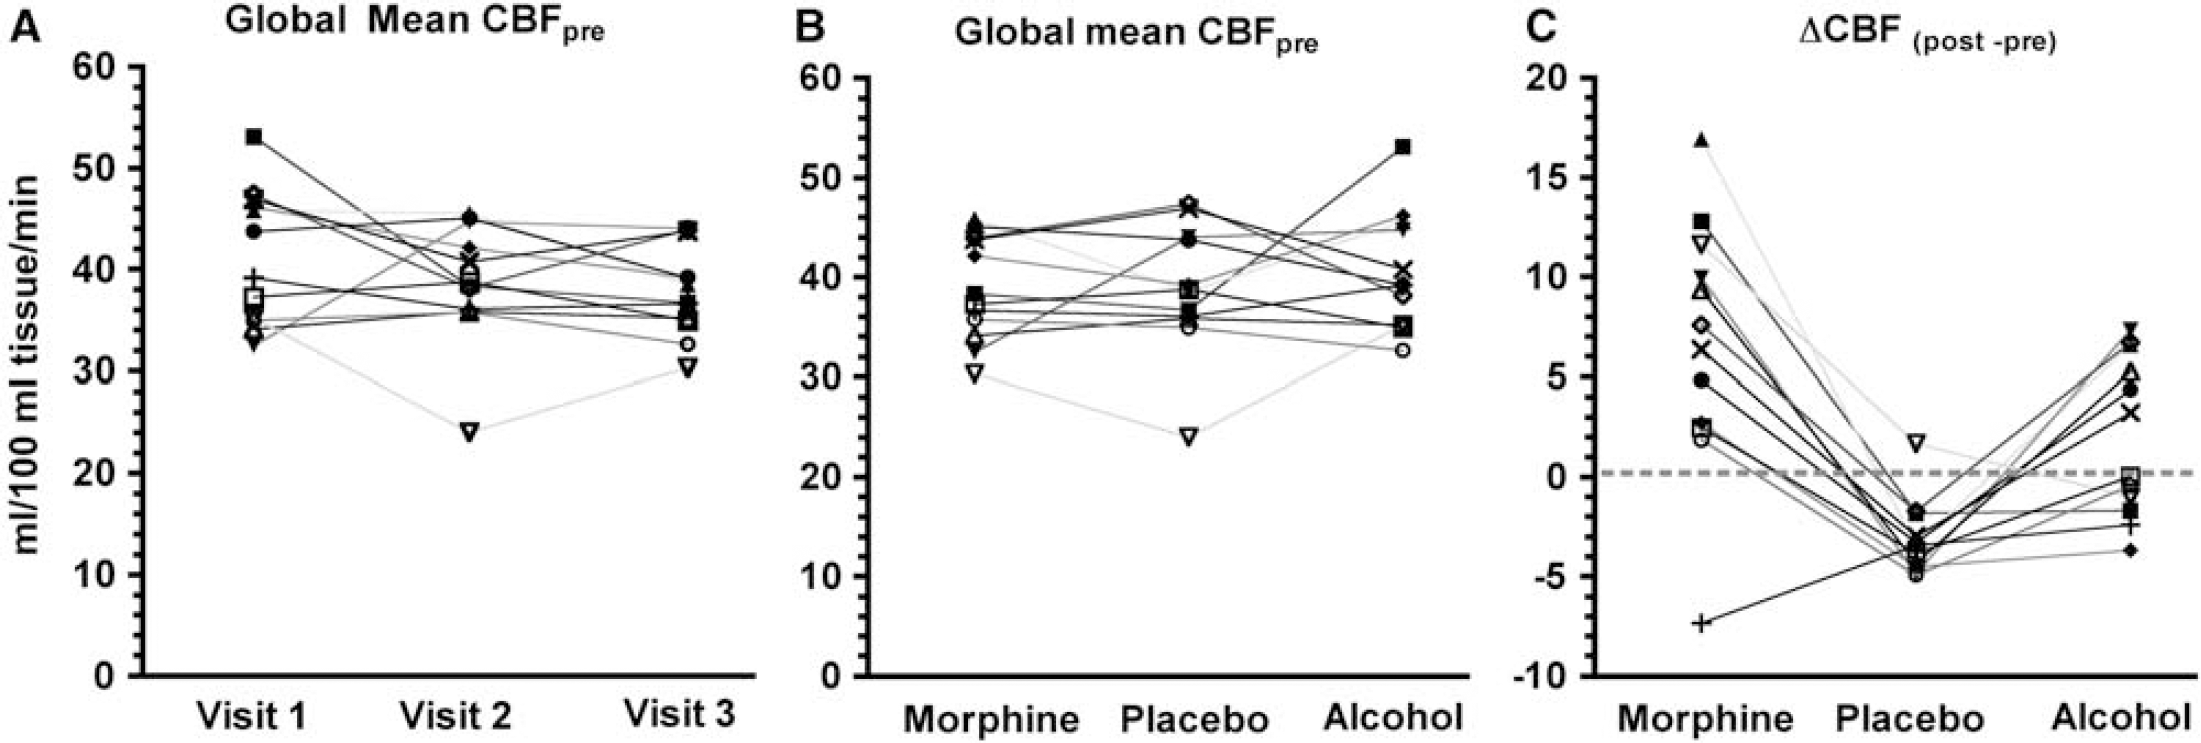
Interindividual variations in pretreatment and posttreatment global mean cerebral blood flow (CBF). (
Figure 2C illustrates intersubject variations in ΔCBF = global mean CBFpost—global mean CBFpre. Friedman's test revealed a significant drug by time interaction effect on ΔCBF (S(12,3) = 16.7,
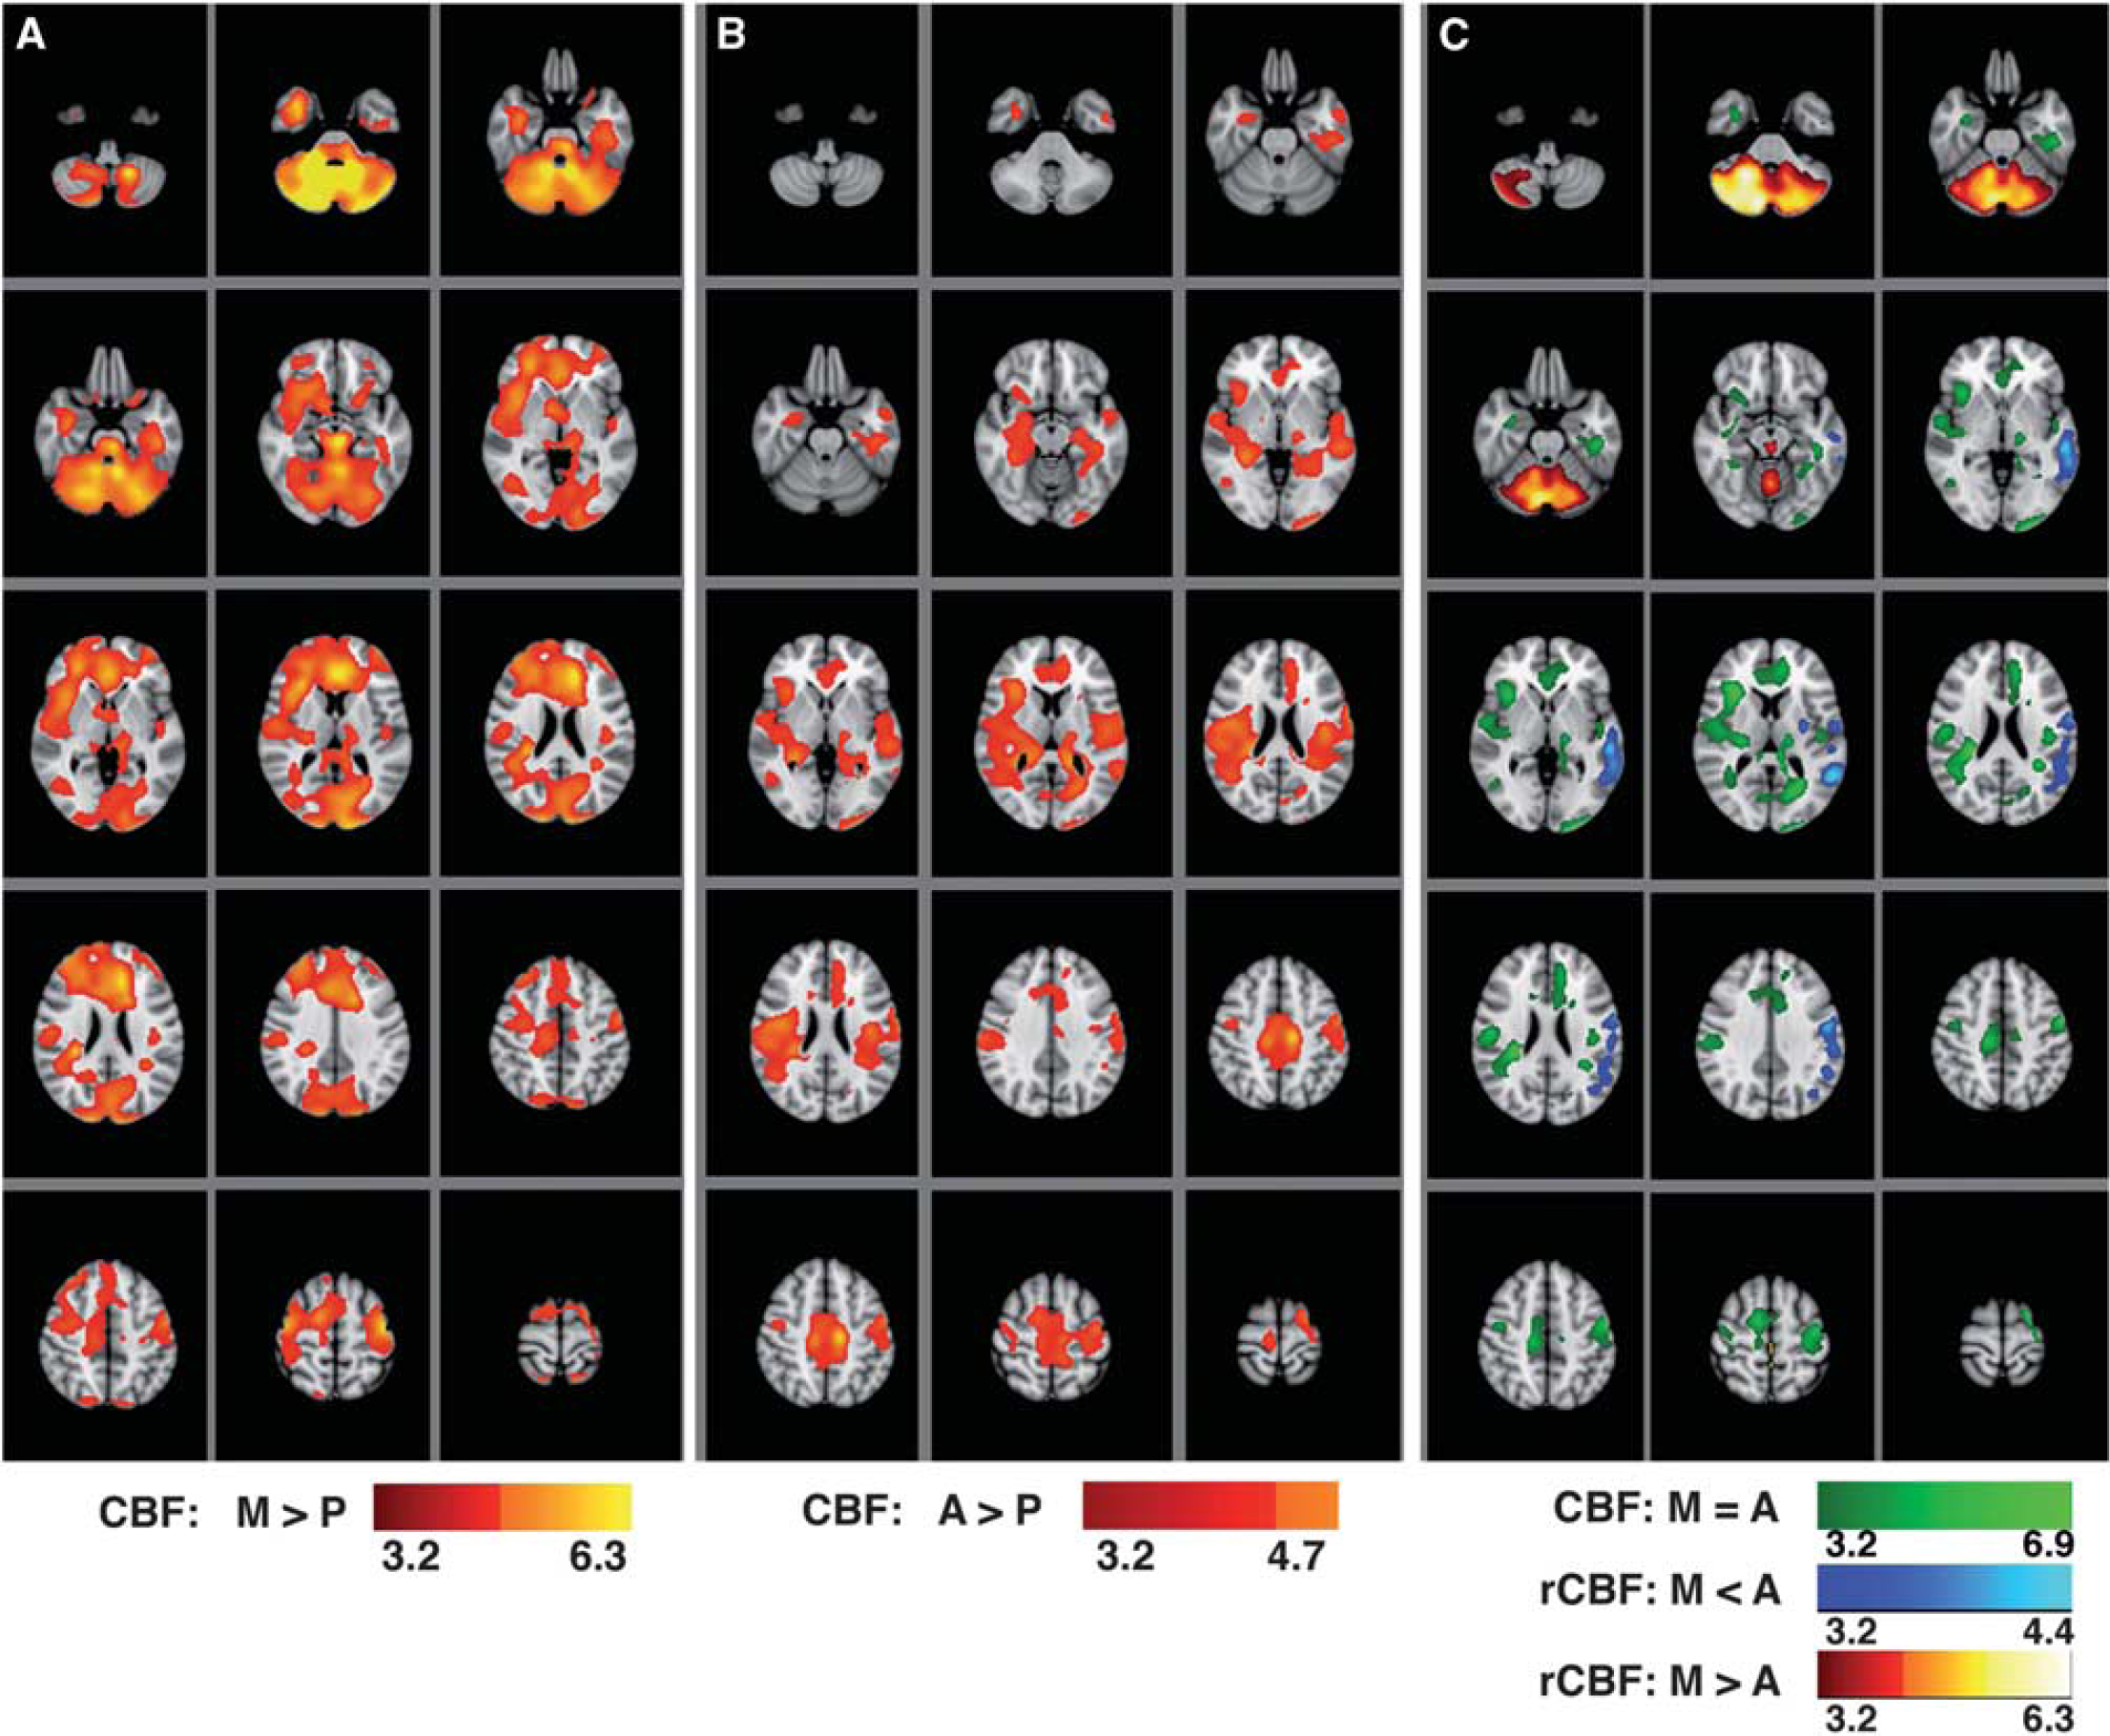
Statistical maps of regional cerebral blood flow (CBF) variations: (
The most significant effects (voxelwise-corrected
The most significant effects (voxelwise-corrected
To examine where effects of morphine and alcohol overlap, a conjunction analysis was performed on maps for Figures 3A and 3B to identify areas that satisfied the criterion of
Summary of the effect size, cluster size, and MNI coordinates of brain locations where the highest (voxelwise-corrected
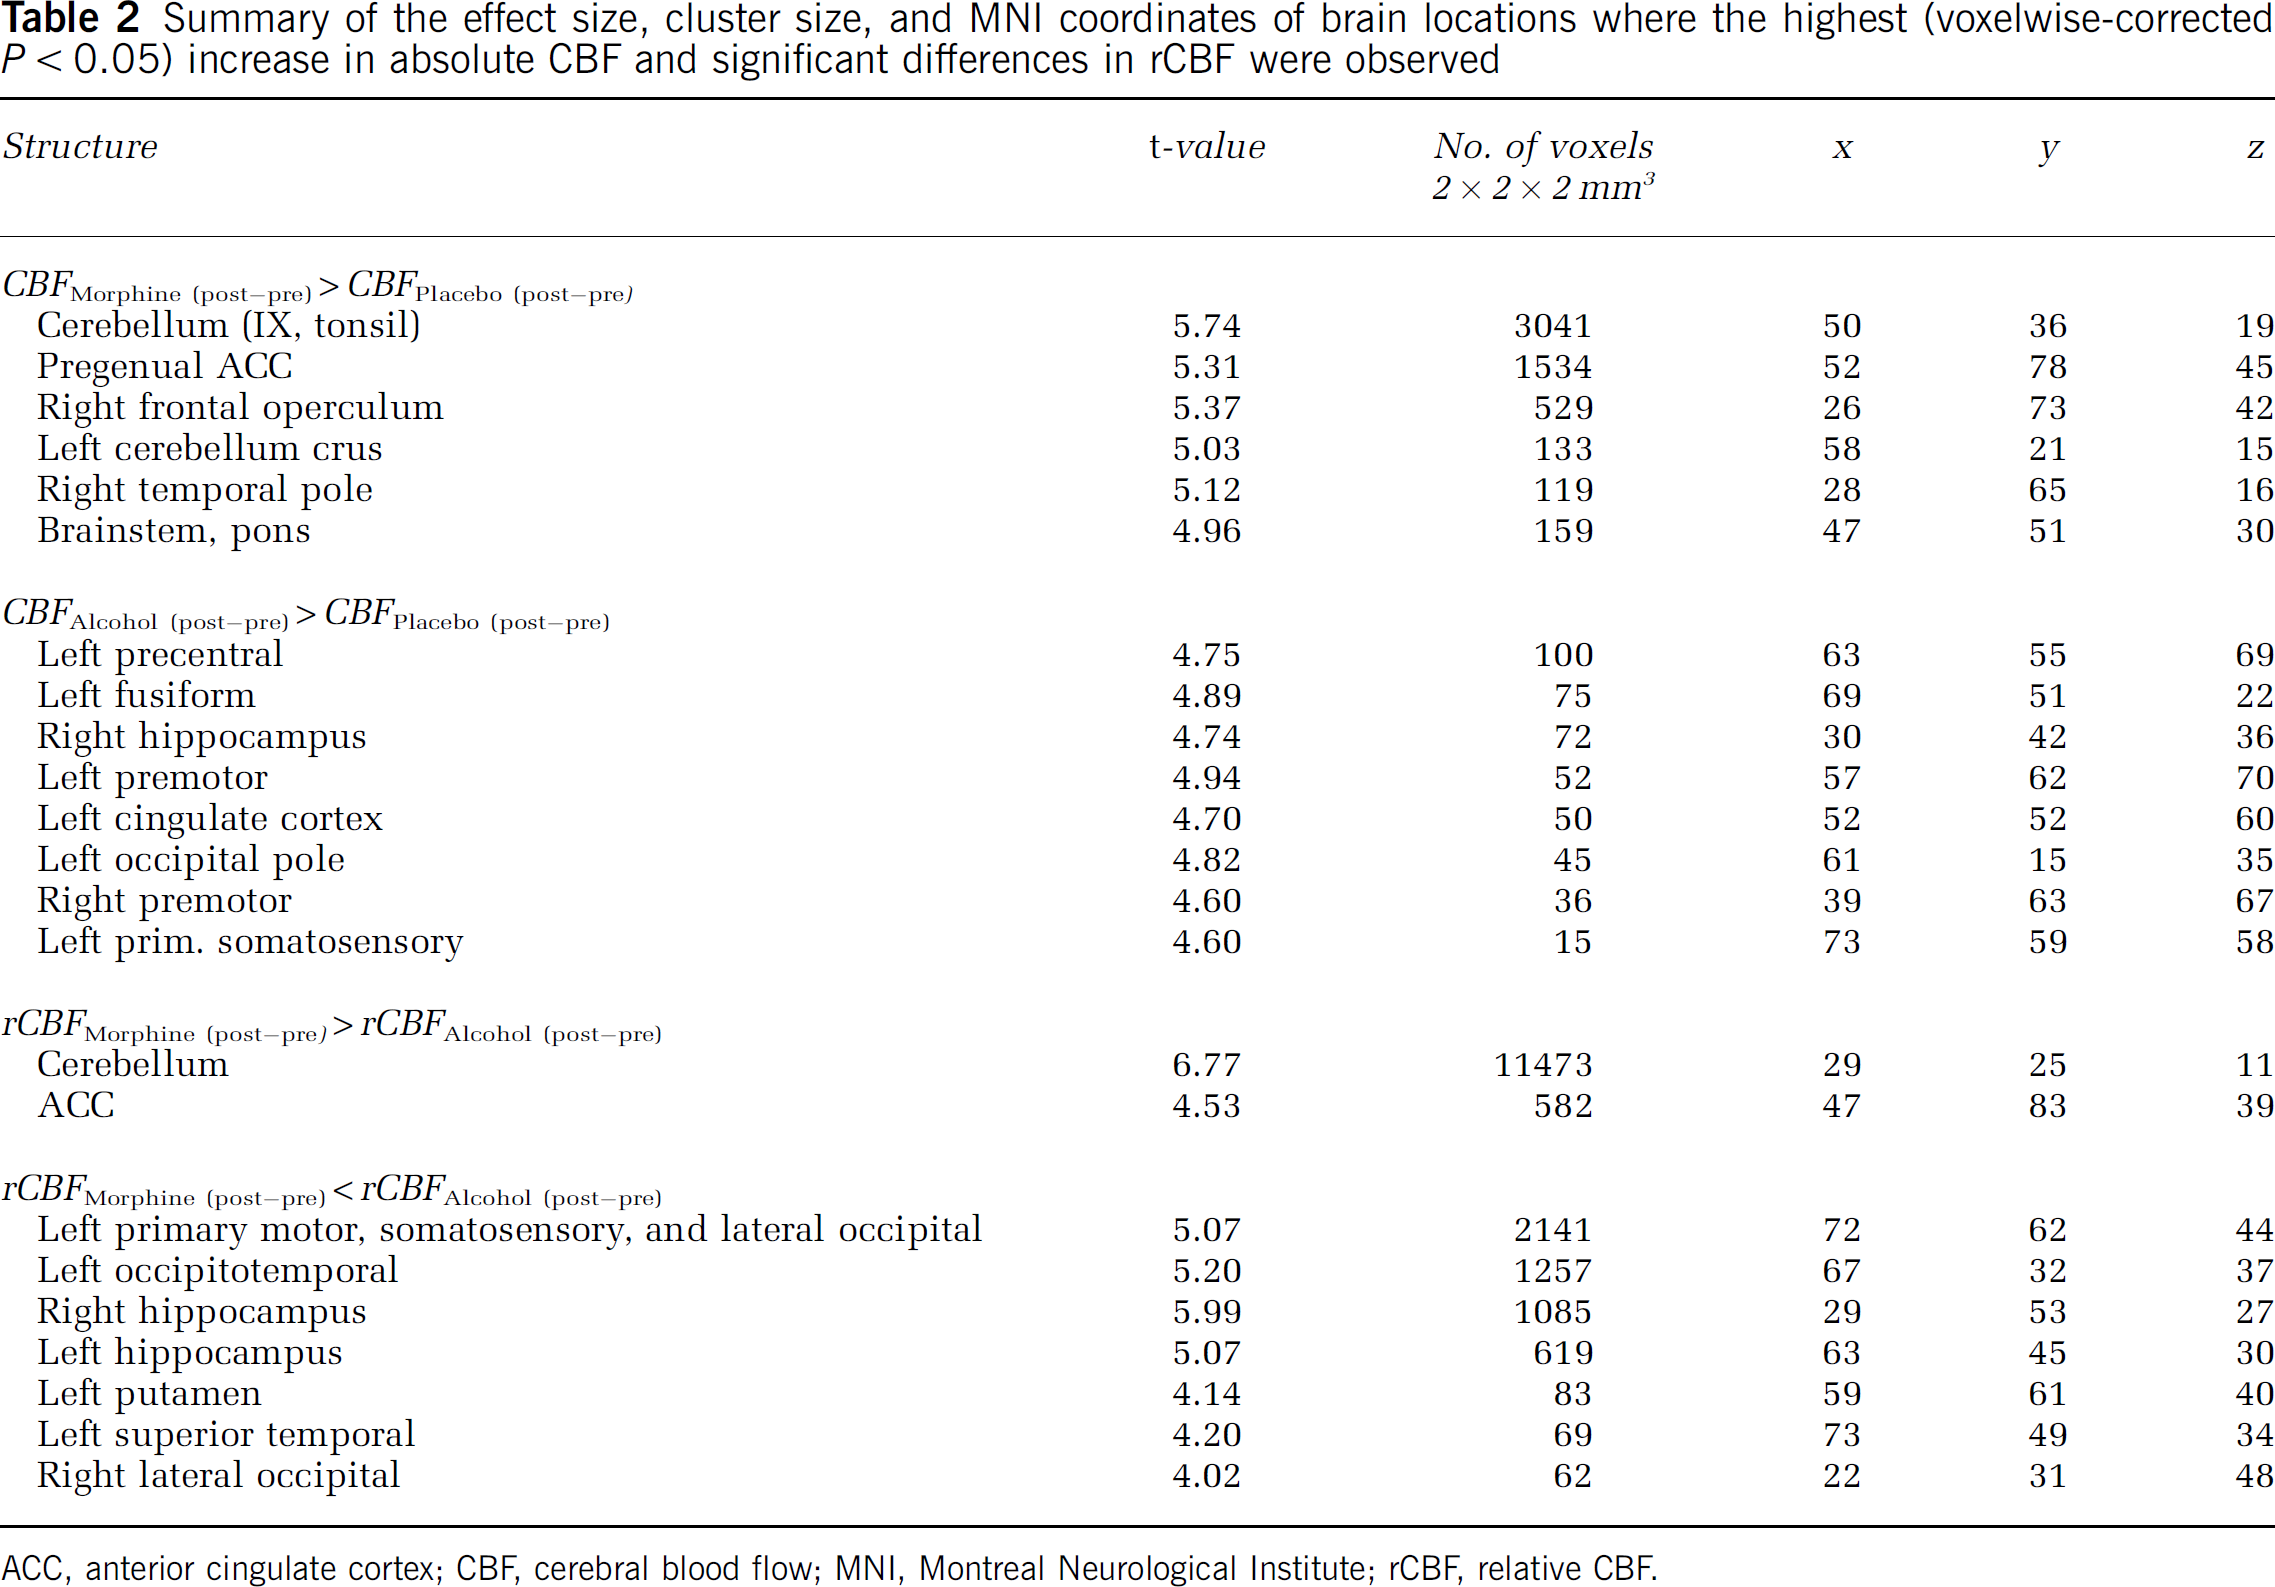
ACC, anterior cingulate cortex; CBF, cerebral blood flow; MNI, Montreal Neurological Institute; rCBF, relative CBF.
Differences in rCBF changes of Morphinepost—pre versus Alcoholpost—pre were tested in a paired
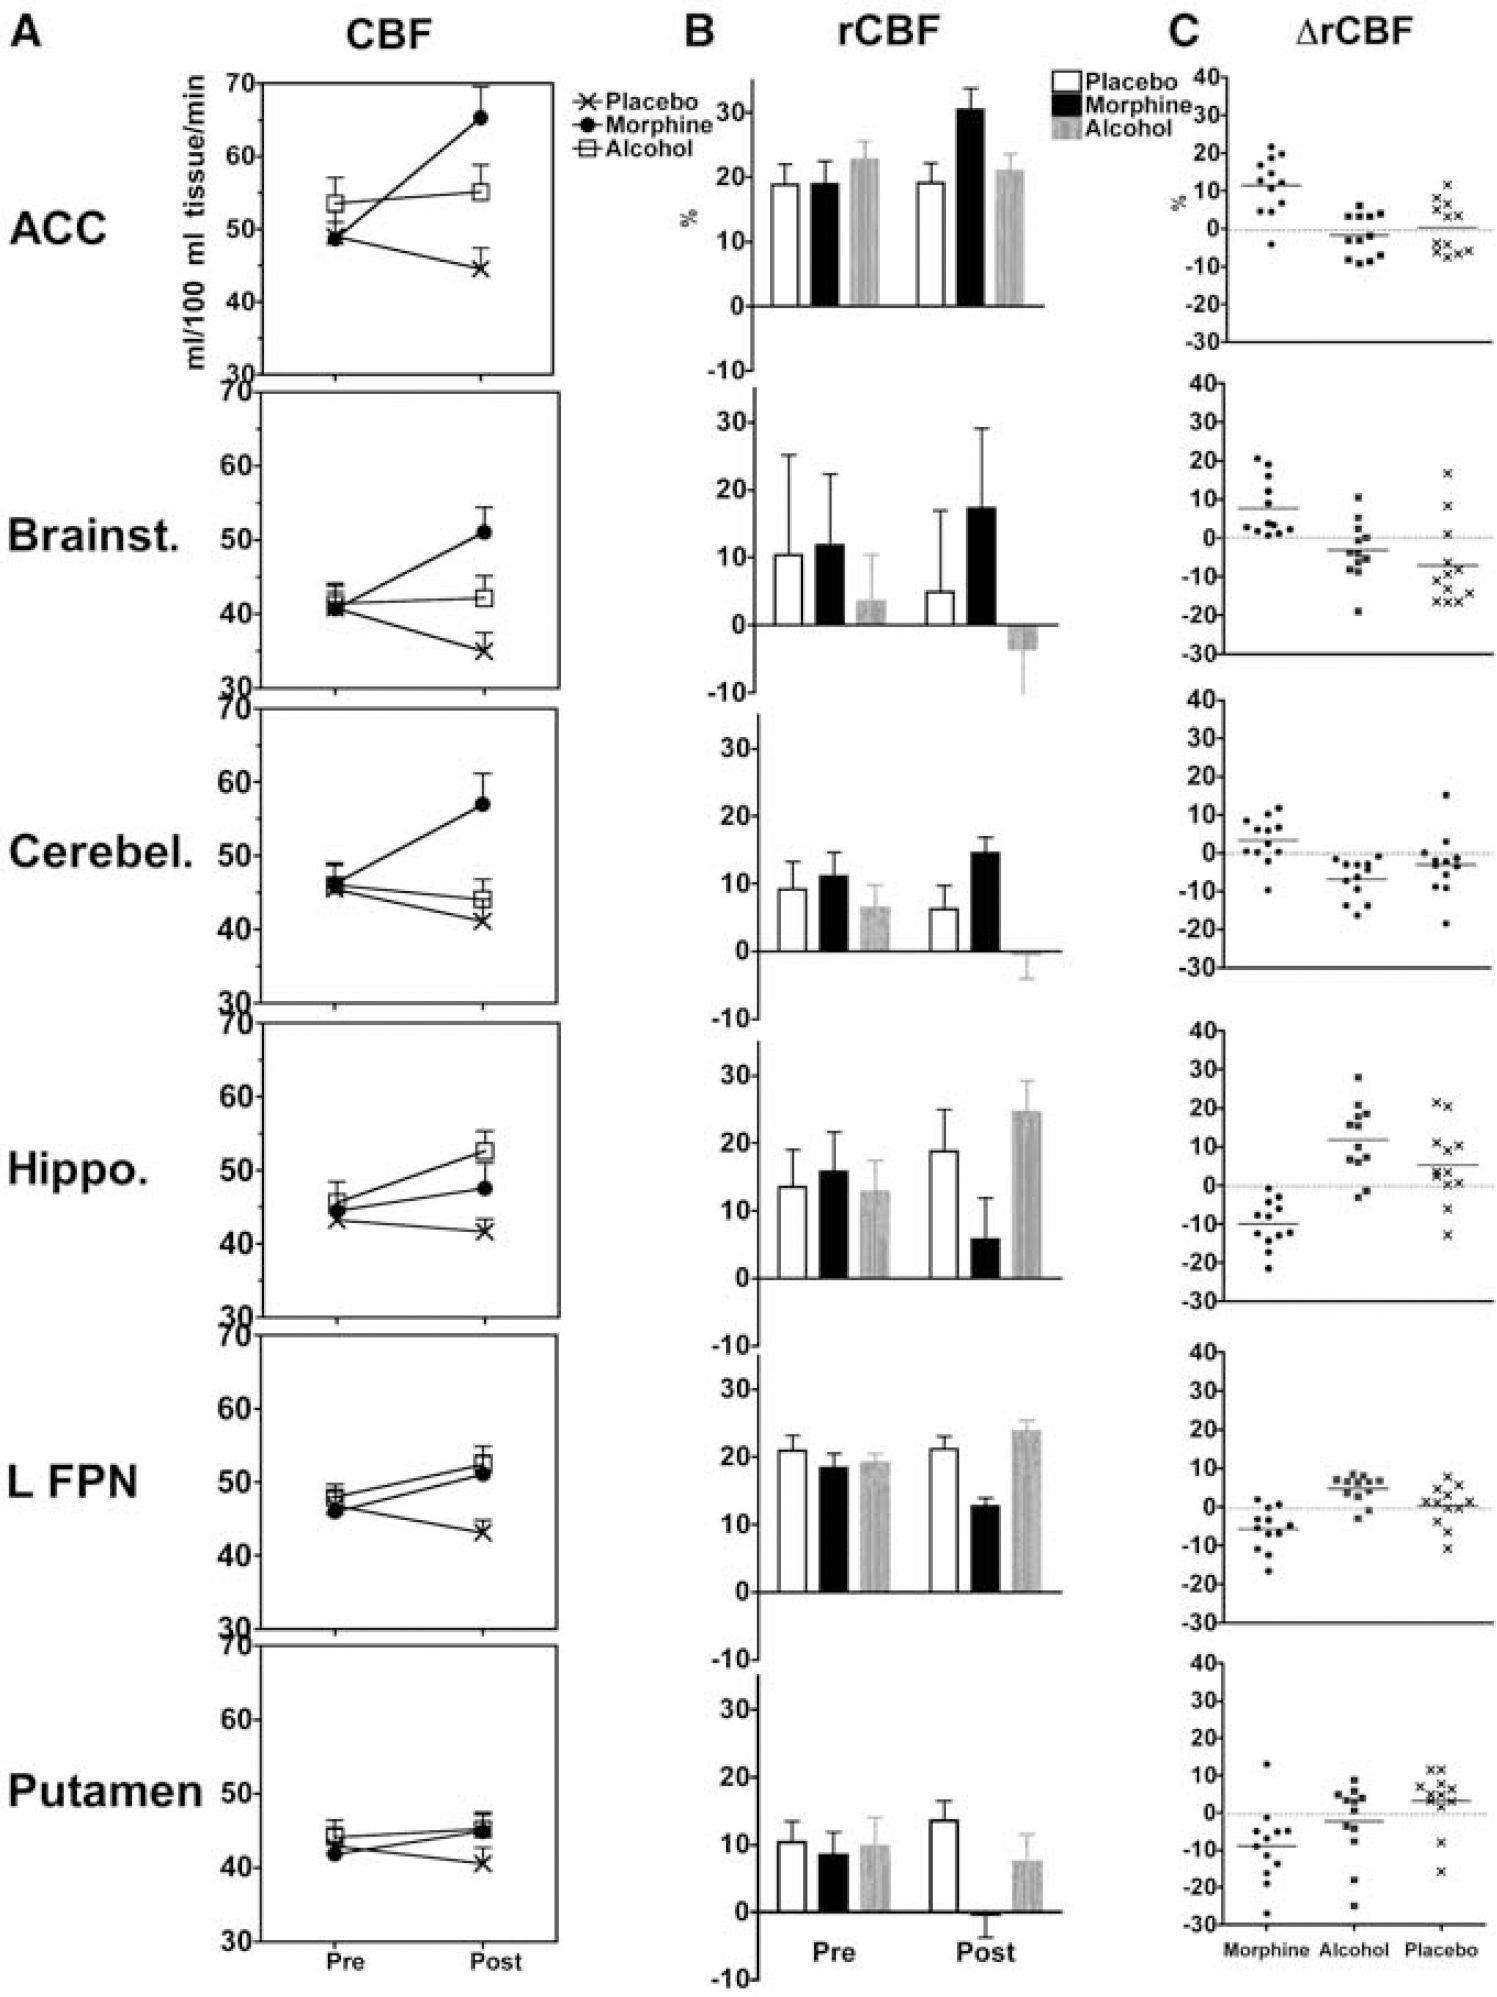
Quantitative illustration of the statistically significant effects detected in ROIs: (
These results illustrate the spatial heterogeneity, and underline the sensitivity of the statistical modeling.
The lowest variance because of treatment in ΔCBF (2.3%) was in the left putamen, although the main effects of treatment (morphine versus placebo, alcohol versus placebo, or morphine versus alcohol) were not significant. The main effect in the left putamen was because of morphine-induced reduction of ΔrCBF from 2.5% to 15% of the global mean CBF (95% CI).
The highest variance because of treatment in ΔCBF (11.4%) was in the anterior cingulate cortex, where ΔCBF was increased between 13 and 29/100 ml tissue/min after morphine; and between 2 and 19/100 ml tissue/min after alcohol.
The highest variance because of treatment in ΔrCBF (55%) was in the right hippocampus, where morphine reduced ΔrCBF within a 95% CI of 6% to 13%; and alcohol increased it within a 95% CI of 5% to 18% of the global mean CBF. A similar effect was also observed in the left frontoparietal network. Opposite effects of morphine and alcohol on ΔrCBF were also present in the cerebellum, where morphine increased ΔrCBF by up to 7% and alcohol reduced it between 3% and 10%.
Effects of Physiological Factors on Global and Regional CBF
Because respiration (after morphine treatment) and heart rate (after alcohol and placebo) were significantly affected by treatment, their effect on variations on global and regional CBF was examined. It has been shown that altered respiration because of opiate treatment can cause a hypercapnic-induced increase in CBF (MacIntosh et al, 2008; Pattinson et al, 2007). Also, heart rate increase because of alcohol might be associated with vasoreactive changes that alter the arterial blood flow velocity (Blaha et al, 2003).
Linear regression analysis indicates that lowering of respiration rate after treatment is associated with an increase in global CBF (slope: −0.2361 ± 0.08444;
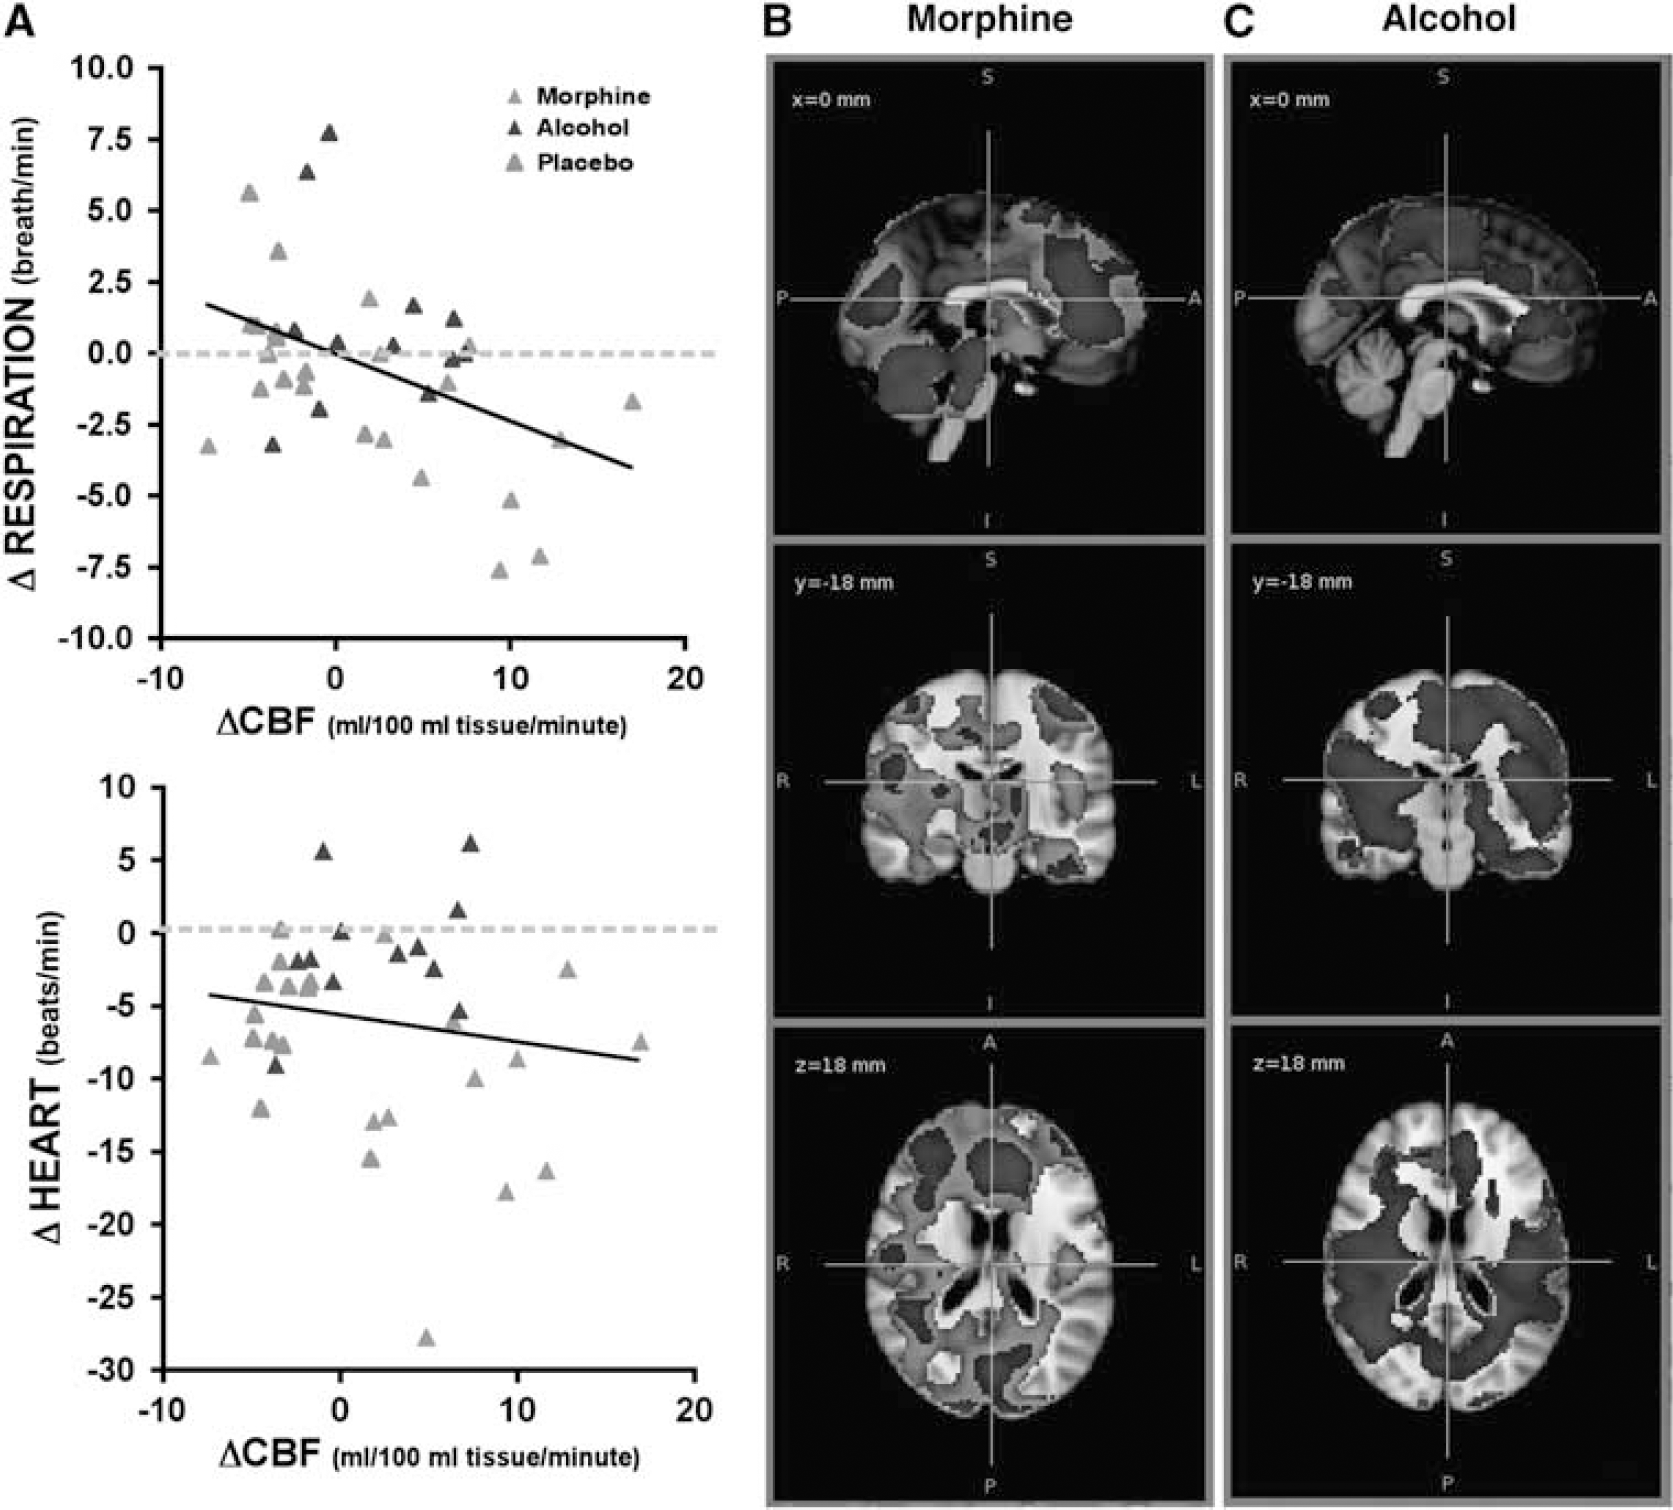
Significant effect of respiration on cerebral blood flow (CBF). (
The extent of absolute CBF changes because of morphine became smaller, if average physiological variables were included in the model (Figure 5B), but no effect on the CBF changes because of alcohol was observed (Figure 5C). Exclusion of the heart rate covariate from the model did not change the effects (data not shown).
Main effects of respiration and heart rate (while effects of treatment and time are modeled) do not satisfy any of the statistical criteria after correction for multiple comparisons.
Placebo Effects Over Time
Our statistical tests did not reveal any relation between the order of the visits, or treatments in preinfusion global CBF averages (see above). However, as Figure 2C indicates, there is a small but consistent decrease in global CBF (average 2.5/100 ml tissue/min) in all but one subject. Using a paired
Discussion
Our results indicate that PCASL is sensitive to detecting drug-specific regional and quantifiable changes in cerebral perfusion. Importantly, we show that the loci of the most significant effects survive after controlling for physiological covariates, such as respiration depression and heart rate, which generate global effects on cerebral perfusion. Our
The primary objective of this study was methodological. Improved signal to noise ratio, improved tagging efficiency, and higher spatial resolution afforded by PCASL make it a desirable quantitative and noninvasive tool in early phases of pharmacological CNS research. An ideal pharmacological tool would be independent of any
Before interpreting neurological significance of our findings, several methodological aspects of our findings must be considered.
First, we detected highly localized effects within anatomical areas, such as putamen (where rCBF changes because of morphine were less than placebo) and hippocampus (where absolute CBF changes because of alcohol were greater than placebo, and rCBF effects of morphine and alcohol were different). This observation is noteworthy because it shows sensitivity and anatomical specificity of PCASL to measuring variations in subcortical perfusion. Secondly,
Another important reason for examining the rCBF maps is that the variance explained by them is directly related to systemic physiological effects of drugs on cerebral autoregulation (e.g., respiration frequency) that affects perfusion. Here, the average respiration rate explained 18% of variance in global perfusion. Although we did not have data for end-tidal CO2, or arterial CO2 tension, our results are consistent with previous reports of a hypercapnia-induced increase in CBF related to respiratory depression caused by opioidergic drugs (MacIntosh et al, 2008; Pattinson et al, 2007). As expected, inclusion of respiration rates in our statistical model reduced the spread of the observed effect on absolute CBF maps, without diminishing the significance of the peak effects of morphine. Obviously, such a correlated physiological factor also confounds rCBF effects (where the rCBF maps are obtained by normalization of absolute CBF maps to global mean CBF), which needs to be considered in interpretation of distinct effects in rCBF maps after morphine treatment in comparison with placebo and alcohol treatments. For example, the observed differences in effects of morphine and alcohol on the rCBF of the putamen were more prominent on the left side (Figure 3C, blue color). Pattinson and colleagues have shown that putamen and left sensory motor areas have an important role in motor control of respiration, irrespective of the pharmacological effect of an opioidergic drug (Pattinson et al, 2009). However, MacIntosh and colleagues (MacIntosh et al, 2008) have shown that hypercapnia because of opioidergic respiratory depression is associated with reduced arterial transit time in the left putamen (and insula), which they interpreted as the possible outcome of higher arteriolar density in these regions. Although our current data cannot substantiate either interpretation, the anatomical specificity of the treatment effects on rCBF maps (also observed in the hippocampus, brainstem, and cerebellum, which are important structures for adaptation) suggests that this metric (rCBF) can salvage important information about the neuronal substrates of the global physiological effects of the drug. Therefore, these various CBF metrics may help future validation studies that aim to establish a direct link between changes in CBF and other factors, such as receptor activation, or event-related potentials.
Given these methodological considerations, how do our PCASL observations compare with previous findings regarding the effects of these drugs?
For morphine, we observed the highest increases in absolute CBF in the ACC, right operculum, brainstem, and the cerebellum. PET studies with opioidergic radiotracers have shown that the ACC, opercular/insular cortex, thalamus, amygdala, and putamen (the medial parts of the pain system) have the highest (Baumgartner et al, 2006; Jones et al, 1991; Zubieta et al, 2001) and that the primary somatosensory, sensorimotor areas (the lateral parts of the pain system) (Baumgartner et al, 2006; Jones et al, 1991; Zubieta et al, 2001), and occipital areas (Sadzot et al, 1991) have the lowest binding potentials. It has also been shown that the cerebellum has spatially differential binding potential for different subtypes of opioid receptors (Schadrack et al, 1999). Moreover, previous perfusion studies with opioid drugs, such as hydromorphone (Schlaepfer et al, 1998), remifentanil (Kofke et al, 2007; Petrovic et al, 2002; Wagner et al, 2007), and fentanyl (Casey et al, 2000), corroborate our finding of regional increase in the CBF of these regions. Notably, a bilateral reduction in rCBF because of morphine was present in the primary sensory; primary motor and occipitotemporal cortex, bilateral putamen, and the right hippocampal area. Considering that the putamen has opioidergic binding potentials comparable to the ACC (Baumgartner et al, 2006), it is surprising that the rCBF in this region decreases similar to the primary sensorimotor and occipital regions with lower binding potentials. Because a similar observation is reported in a pulsed arterial spin labeling (PASL) study with remifentanil and controlled respiration (Wise et al, 2010), it may be worth noting that a simple paired
For alcohol, the strongest effect on the absolute CBF was in the primary sensory and primary motor regions (more on the left side), as well as the left temporal pole and bilateral hippocampus, where a strong increase in absolute CBF of alcohol versus placebo manifested. Alcohol is a depressant of cerebral metabolism (de Wit et al, 1990; Volkow et al, 2006, 2008; Wang et al, 2000) and it impairs memory, visual, and motor coordination, which seems contradictory with regional increases in the CBF. However, frontal and temporal increase, and cerebellar decrease in absolute CBF are also observed in earlier placebo-controlled O15 PET perfusion studies (Boecker et al, 1996; Volkow et al, 1988). Moreover, depressant effects of alcohol are not ubiquitous. When normalizing to the global metabolism, relative metabolic increases in the left temporal lobe (Wang et al, 2000) and the ‘reward’ centers of the brain (Volkow et al, 2008) are also reported. Therefore, increased CBF in the hippocampus and sensory and motor areas is plausibly related to disinhibitory effects of alcohol on related functions (Rose and Duka, 2007). Interestingly,
A unique feature of this study is that effects of morphine and alcohol are examined in a within-subject crossover and placebo-controlled study, allowing inferences about common or divergent effects of these drugs. Here, we observed a mild and consistent reduction of the global CBF (a least 2.5/100 mL tissue/min) in the placebo session. Although this did not produce statistically significant regional effects, the rCBF changes because of placebo condition were not similar in all brain regions; for instance, ΔrCBF was positive in the putamen and negative in the brainstem of most of the participants (see Figure 4C, also the Supplementary Figure for uncorrected
In summary, we have illustrated that PCASL is able to reveal most of the effects of alcohol and opioids that were previously observed with PET studies using receptor-specific, CBF, or metabolic ligands. Research and development of drug-specific radiotracer ligands for PET continues to provide essential understanding of how different psychoactive substances interact with neurotransmitter signaling pathways. However, initial phases of drug development require a cost-efficient, repeatable, and generally applicable measurement tool that allows quantifiable measurement of regional changes in cerebral physiology. Methodologically, PCASL has higher spatial resolution and is considerably simpler to use in a research setting than 15O-PET. With simple preprocessing steps, and without
Footnotes
The authors declare no conflict of interest.
References
Supplementary Material
Please find the following supplemental material available below.
For Open Access articles published under a Creative Commons License, all supplemental material carries the same license as the article it is associated with.
For non-Open Access articles published, all supplemental material carries a non-exclusive license, and permission requests for re-use of supplemental material or any part of supplemental material shall be sent directly to the copyright owner as specified in the copyright notice associated with the article.