
Abstract
We present a novel contrast agent (CA) extravasation-correction method based on analysis of the tissue residue function for assessment of multiple hemodynamic parameters. The method enables semiquantitative determination of the transfer constant and can be used to distinguish between T1- and T*2-dominant extravasation effects, while being insensitive to variations in tissue mean transit time (MTT). Results in 101 patients with confirmed glioma suggest that leakage-corrected absolute cerebral blood volume (CBV) values obtained with the proposed method provide improved overall survival prediction compared with normalized CBV values combined with an established leakage-correction method. Using a standard gradient-echo echo-planar imaging sequence, ∼60% and 10% of tumors with detectable CA extravasation mainly exhibited T1- and T*2-dominant leakage effects, respectively. The remaining 30% of leaky tumors had mixed T1- and T*2-dominant effects. Using an MTT-sensitive correction method, our results show that CBV is underestimated when tumor MTT is significantly longer than MTT in the reference tissue. Furthermore, results from our simulations suggest that the relative contribution of T1-versus T*2-dominant extravasation effects is strongly dependent on the effective transverse relaxivity in the extravascular space and may thus be a potential marker for cellular integrity and tissue structure.
Introduction
Quantitative dynamic susceptibility contrast (DSC) magnetic resonance imaging (MRI) introduces many technical challenges related to the reliable detection of the arterial input function (AIF), choice of deconvolution method, and complex in vivo dose response (Calamante et al, 2002). Furthermore, contrast agent (CA) extravasation is a general problem for all DSC-based MRI methods used for brain tumor assessment because the kinetic models used explicitly assume that the CA remains in the intravascular space (IVS) for the duration of the dynamic acquisition (Lev and Rosen, 1999). Studies have suggested that CA leakage can lead to either overestimation or underestimation of relative cerebral blood volume (rCBV) in tumors with blood–brain-barrier breakdown unless specifically corrected for (Paulson and Schmainda, 2008). Different approaches to limit the error introduced by CA extravasation have been proposed, including use of predosing (Donahue et al, 2000), double-echo acquisitions (Uematsu et al, 2001; Vonken et al, 2000), and parametric modeling (γ-variate fit) of the dynamic response (Rosen et al, 1990). Weisskoff et al (1994) proposed a correction method in which CA extravasation is estimated in each voxel by determining the voxel-wise deviation from a ‘nonleaky’ reference tissue response curve. This approach is appealing in that it does not require the use of nonstandard imaging sequences or CA injection schemes, and the method has been shown to improve the diagnostic accuracy of DSC-MRI in glioma grading (Boxerman et al, 2006). The potential limitation of the method is that the model assumes that mean transit time (MTT) and bolus arrival time are the same in tumor and nonpathologic tissue. Quarles et al (2005) showed that, based on simulations and data in a rat gliosarcoma model, the leakage-correction method of Weisskoff et al may result in incorrect rCBV values in tumors with significant alteration in the hemodynamic state. On the basis of this observation, they proposed an alternative method in which CA extravasation is accounted for by incorporating a leakage term in the tissue residue function, thereby providing an MTT-insensitive estimate of the transfer constant describing the CA flux between the IVS and extravascular extracellular space (EES). We recently proposed an alternative approach in which the transfer constant is directly determined from the tissue residue function (Bjornerud and Emblem, 2009). This method can be combined with a fully automated approach for quantitative DSC-MRI incorporating automatic slice-wise detection of the AIF and partial volume correction (Bjornerud and Emblem, 2010). From this, a direct estimation of perfusion metrics and MTT-insensitive CA extravasation from the resulting tissue residue function may be derived. The primary aim of our study was to fully expand the development of the proposed MTT-insensitive leakage-correction method from its theoretical basis through data simulations and finally by analysis of clinical DSC data in patients with confirmed glioma.
Theory
Estimation of Tumor Hemodynamic Parameters in the Presence of Contrast Agent Extravasation
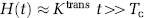
Weisskoff et al (1994) proposed a correction method, later elaborated by Boxerman et al (2006), whereby CA extravasation is estimated in each voxel by determining the voxel-wise deviation from a ‘non-leaky’ reference tissue response curve:
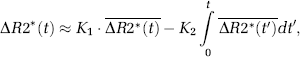
where ΔR2*(t) is the measured CA-induced change in transverse relaxation rate (ΔR2* or ΔR2) in the presence of CA extravasation,
This approach will be used as the reference-correction method in this study. One potential limitation of this method is that it explicitly assumes that MTT in a leaky voxel is identical to MTT of the mean tissue response curve (Quarles et al, 2005). This can be seen from equation (1) because, in the absence of extravasation, any given response curve should be related to the reference curve by a single scaling constant (K1). Any deviations in MTT (or CA delay) would thus introduce an incorrect nonzero value of K2.
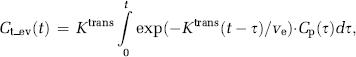
An alternative approach accounting for variations in tissue MTT is to estimate CA extravasation from the tissue residue function obtained after AIF deconvolution. In the absence of CA extravasation, tissue flow can be estimated from the convolution integral (Ostergaard et al, 1996):
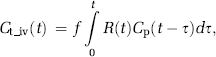
where Cp is the tracer concentration in the plasma and Ct_iv the tracer concentration in the tissue (confined to the IVS), R(t) the tissue-specific residue function, and f the tissue flow (in units of 1 per sec). Given that CA concentration in blood and tissue can be determined, f and R(t) can be estimated by deconvolution, and perfusion (in units of mL blood/100 g per min) is then given by:

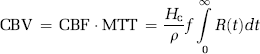
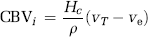
where ρ is the tissue density and Hc = Hctart/1−Hctcap takes into account differences in hematocrit values in large vessels and capillaries (Rempp et al, 1994). The MTT is given by the area under the residue function and, in the absence of CA extravasation, CBV can then be estimated from the central volume principle (Lassen and Perl, 1979):
If the tracer is not confined to the IVS, CA extravasation can be expressed in terms of a two-compartment model (Larsson et al, 1990; Tofts, 1997; Tofts et al, 1999):
where Ktrans is the transfer constant describing CA flux from the IVS to the EES, ve the leakage space per unit volume, and Ct_ev the tracer concentration in the EES.
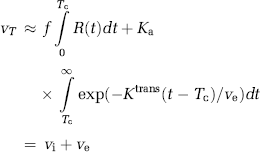
To estimate both perfusion and permeability from a single acquisition, a combined model of the two processes is required. We base our combined analysis approach on the adiabatic approximation to the tissue homogeneity model (St Lawrence and Lee, 1998). Here, the intravascular response is modeled as a function of both time and distance along the capillaries, and it is assumed that the dynamic time course is separable into an early (fast) vascular phase, followed by a (slow) extravasation phase. The tissue response, including both intravascular and extravascular responses can then be expressed as:
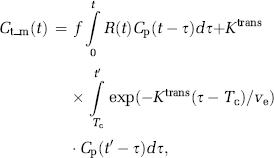
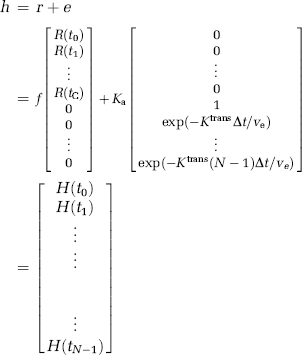
where Tc is the capillary transit time of CA, so that t < Tc and t′≥Tc The combined residue function H(t) scaled by flow and the extravasation transfer constant can then be expressed as:
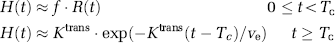
Complete separation of the intravascular and extravasation phase using this model requires R(t) to be a box function, so that R(t) = 1 for 0≤t> Tc and R(t) = 0 for t≥ Tc. However, because the intravascular residue function is in reality a monotonically decreasing probability function, the two phases will overlap and Tc is an average transit time (MTT) for all capillary paths. However, for t > > Tc, H(t) is dominated by the leakage term and by further assuming limited reflux within the measurement time, TN, so that KtransTN/ve << 1, we get:
Dose-Response Considerations
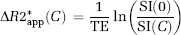
In DSC-MRI, CA concentration can only be estimated in relative terms through measurements of change in transverse relaxation rate (ΔR2* or ΔR2), which in turn is estimated from measured change in MR signal intensity (SI). In single-shot gradient echo–echo planar imaging (GRE-EPI) sequences used in DSC-MRI, the SI can be approximated by the steady-state expression:
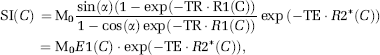
where Mo is proportional to the equilibrium magnetization, C the CA concentration, R1, R2* the T1 and T*2 relaxation rates, respectively, TE the echo time, and a the flip angle. The change in SI caused by CA-induced increase in relaxation rates can then be expressed as:
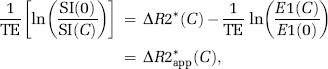
where AR2* is the change in T2* relaxation rate, ΔR2*app the measured apparent change in ΔR2* including T1 effects, and E1(C) > E1(0). In DSC imaging, the T1 term in equation (11) is commonly assumed to be negligible compared with the much stronger T2* relaxation effects for an intravascular CA distribution (Boxerman et al, 1995; Kjolby et al, 2006). In the case of CA extravasation, T1 relaxation effects may become significant because of a reduction in CA compartmentalization (reduced T2* relaxation) combined with increased distribution volume and water access to the paramagnetic center of the CA (Donahue et al, 1997). Hence, the extravascular CA-induced signal change is more difficult to predict, and both T1 and T2* effects may dominate when the CA is present in the EES.
From this, it cannot be assumed that the transfer constant measured from a single-echo DSC-MRI acquisition reflects the underlying Ktrans. Therefore, we distinguish between the apparent transfer constant, Ka, estimated through measurements of ΔR2* combined with the proposed models, and the true transfer constant Ktrans as defined in equation (6). Using this notation, equation (7) can be written in matrix notation in terms of the measured changes in T2* relaxation rates as:

where
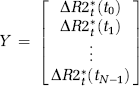
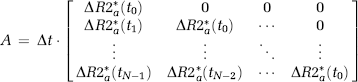
and
where Δt is the sampling interval, N the number of data points, tc the time index corresponding to Tc, ΔR2* the apparent change in R2* in the tissue in the presence of T1 effects and extravasation (equation (11)), and ΔR2*a the corresponding change in R2* in blood. Thus, equation (12) can be solved for h using standard matrix inversion methods such as singular value decomposition (SVD) (Ostergaard et al, 1996), and Ka is then approximated from the tail of H(t) following the assumptions leading up to equation (9).
The apparent blood volume measured in a leaky voxel is given by the area under H(t), which can be expressed in terms of the intravascular (vi) and extracellular (ve) volume fractions as follows:
The intravascular blood volume (in units of mL blood/100 g) is then given by:
As we have assumed negligible CA reflux within the total sampling time, ve cannot be estimated but the error in CBV i caused by CA extravasation can then be estimated from the approximation H(t)≈Ka for t > > Tc, so that the leakage-corrected intravascular blood volume is given by:
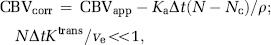
where CBVapp is the apparent CBV value measured by equation (5) and Nc the time index corresponding to Tc. Here, Tc is unknown and tissue dependent, but may be estimated by fitting the initial portion of H(t) to an appropriate parametric function. Cerebral blood flow is not affected by CA extravasation effects because H(t)=fR(t) (t >> Tc) is not dependent on Ka.
Materials and methods
Patient Material
Study approval was obtained from the Regional Medical Ethics Committee, and patients were included only if informed consent was obtained. A total of 101 patients (51 males, mean age 51 years, range 8 to 79 years) with confirmed glioma, selected from an ongoing prospective tumor perfusion study were included in the analysis. The histopathological diagnosis of the included patients is specified in a previous study (Bjornerud and Emblem, 2010), and for this study, patients were divided into two groups in which glioma grades I and II were grouped as low-grade gliomas (LGGs) and glioma grades III and IV were grouped as high-grade gliomas (HGGs).
Magnetic Resonance Imaging
Imaging was performed at 1.5 Tesla (Siemens Sonata, Symphony or Avanto, Siemens AG, Erlangen, Germany), using an 8-channel (Symphony/Sonata) or a 12-channel (Avanto) head-coil. Dynamic susceptibility contrast-MRI was performed using a GRE-EPI sequence acquired during CA administration. The DSC imaging parameters were: repetition time (TR)/TE/flip angle 1,430 milliseconds/46 milliseconds/900, bandwidth 1,345 Hz/pixel (12 axial slices) or 1720/48/90, bandwidth 1,500 Hz/pixel (14 axial slices), field of view 230 × 230 mm2, voxel size 1. 8 × 1.8 × 5 mm3, interslice gap 1.5 mm. For each slice, 70 images were recorded at intervals equal to the TR. After eight time points, 0.2 mmol/kg of the CA gadobutrol (Gadovist, Bayer Schering Pharma AG, Berlin, Germany) was injected at a rate of 5 mL/sec, immediately followed by a 20mL bolus of saline (B. Braun Melsungen AG, Melsungen, Germany), also at 5 mL/sec. The image protocol included axial T2-weighted fast spin-echo images (TR/TE = 4,000 milliseconds/104 milliseconds), coronal fluid-attenuated inversion recovery images (TR/TE = 9,050 milliseconds/114 milliseconds and inversion time (TI) = 1,500-milliseconds) and axial T1-weighted SE images (TR/TE = 500 milliseconds/7.7 milliseconds) obtained before and after intravenous CA injection. The voxel size was 0.45 × 0.45 × 5 mm3 with 19 slices for the T2- and T1-weighted images and 0.9 × 0.9 × 5 mm3 with 25 slices for the fluid-attenuated inversion recovery images.
Data Analysis
Perfusion Analysis and Extravasation Correction: The proposed extravasation-correction methods were compared with the reference method of Boxerman et al (2006), hereby referred to as Method I. Different from the original implementation, the constant K2 (equation (1)) was allowed to assume both positive and negative values to account for the possible presence of both T1- and T2*- dominant relaxation effects during CA extravasation. In the proposed alternative method (denoted Method II), the apparent transfer constant Ka was determined directly from the tail of the residue function as outlined in the ‘Theory’ section. Method I was used only to correct rCBV values normalized to the unaffected white matter (Emblem and Bjornerud, 2009), whereas Method II provided absolute estimates of cerebral blood flow (CBF) and leakage-corrected CBV and MTT from the residue function. The residue function was determined on a pixel-by-pixel basis (or from simulated response curves) using iterative Tikhonov-regularized SVD deconvolution (Bjornerud and Emblem, 2010). The intravascular residue function R(t) was estimated by fitting the initial portion (first five time points) of H(t) to a Lorentzian function of the form (Calamante et al, 2003):
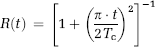
where Tc is the intravascular transit time which was then used as an estimate of the cutoff point between the intravascular phase and the extravasation phase (equation (8)). The curve fit was performed using a Levenberg-Marquardt nonlinear least squares fitting procedure (Press et al, 1992). The Lorentzian function provided excellent goodness of fit to actual residue functions obtained in the unaffected white and gray matter (data not shown).
Simulations: Simulations were performed to investigate the validity of the two extravasation-correction methods under different hemodynamic conditions and to assess the sensitivity of the models to variations in underlying tissue relaxation properties and sequence parameters. For all simulations, the AIF was modeled as a γ-variate function (Benner et al, 1997), but with an additional exponential term to model steady-state effects:
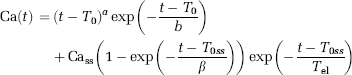
where a, b, β are curve-shape constants, To the CA arrival time, Toss a time delay constant for the steady-state effect, Cass the steady-state CA concentration, and Tel the plasma elimination half-life of the CA. The constants were chosen such that Camax = 7 mmol/L and Cass = 1 mmol/L. A Lorentzian intravascular residue function (equation (19)) was used for all simulations.
Dependence of Ka on Transverse Relaxivity and Sequence Parameters: The concentration time curves Ct_iv(t) and Ct_ev(t) were estimated from the AIF by convolution (equations (3 and 6)) for given values of MTT, CBF, Ktrans, and ve, and the corresponding relaxation rate changes in the respective compartments were calculated as described below. Signal changes corresponding to the estimated CA-induced relaxation rate changes were then calculated using the expression for steady-state GRE signal behavior (equation (11)), and the corresponding changes in apparent R2* relaxation rates were calculated from the simulated signal changes, assuming negligible T1 effects:
R2*app in tissue was then deconvolved with the AIF R2* response curve to estimate the residue function measured in the presence of extravasation and tissue relaxation effects. Finally, Ka was extracted from the residue function using Method II as described in the ‘Theory’ section.
Tissue T1 and T2* relaxation rates were estimated by assuming linear dose-response functions:
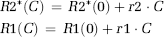
where r1 and r2 are the T1 and T2* CA relaxivities, respectively, in a given tissue compartment, and R1(0) and R2*(0) the relaxation rates in the absence of CA. Change in tissue T1 relaxation was assumed to be a function of extravascular CA concentration only, assuming the intravascular T1 relaxation contribution in tissue to be negligible. The CA-induced change in R2* relaxation rates was assumed to be a linear combination of the intravascular and extravascular contributions:

The dependence of ΔR2*iv on ΔC = |Civ−Cev| is because of the fact that ΔR2*iv is proportional to the susceptibility difference (Δχ) between the two compartments and Δχ Δχ∝ ΔC (Kjolby et al, 2006). The effect of variations in extravascular structure and volume was simulated by varying the effective transverse relaxivity, r2ev in the EES. The value of r2ev was initially set equal to the dipolar value as obtained in a completely homogeneous solution (r2 = 5.3 L/mmol per sec) (Bleeker et al, 2009). This was assumed to be the lower limit in tissue with complete loss of cellular integrity. In tissues with intact cell membranes, r2ev will be higher because of field perturbations at the intracellular and extracellular interface. The effect of increasing the degree of compartmentalization was simulated by a step-wise increasing of r2ev up to a maximum value of 30 L/mmol per sec. For intravascular contribution, r2iv = 44 L/mmol per sec was used, a value which was previously found to be valid for both gray and white matter in the brain at 1.5 T (Kjolby et al, 2006).
A linear dose response was also assumed for the AIF. Although studies have shown that R2* relaxation in large arteries is quadratically dependent on CA concentration, the automated AIF determination implemented in this study tends to select voxels located outside the large arteries where a linear R2* dose response and absence of T1 relaxation effects can be assumed (Bleeker et al, 2009). The tissue contribution to the AIF was assumed to be negligible, and an arterial R2* relaxivity r2a of 8 L/mmol per sec was used. The value of r2a was considered being close to the linear component of the intravascular relaxivity previously described, a value which was also found to give AIF R2* response curves in good agreement with results in patient data. For T1 relaxivity in the EES, r1 = 4.2 L/mmol per sec was used.
Ka estimated from the above method was compared with the actual Ktrans over a relevant range of Ktrans (corresponding to extraction fractions 0≤E≤0.5, where E=Ktrans/f). Sequence parameters were kept constant except for the flip angle that was varied between 30° and 90°. The effect of using a predose was also simulated by estimation of the respective CA concentrations in all compartments after a first injection, and using these concentration values as baseline values for a second injection. The following additional parameters were fixed for all simulations: TR/TE = 1,500 milliseconds/45 milliseconds, CBF = 80mL/100g per min, and MTT = 5 seconds.
Mean Transit Time Dependence: Using predefined values of CBF, MTT and Ka tissue response curves were generated according to equations 13 to 15. Gaussian noise corresponding to an signal-noise ratio (SNR) of 50 in the raw data was added. Defining the apparent extraction fraction as Ea = Ka/f, simulations were performed with Ea = 0.1 and Ea = −0.1 to model both T1- (Ea< 0) and T*2- (Ea>0) dominant extravasation effects. The simulated leakage-affected response curves were then used to estimate Ka or K2, and the corresponding leakage-corrected perfusion metrics obtained using the two correction methods were compared with the same values in the absence of extravasation. When applying correction Method I to the simulated data, a reference tissue response curve with Ea = 0, MTT = 5 seconds, and CBF = 40 mL/100g per min was assumed and leakage-corrected response curves were generated from equation (1). When varying MTT, CBF was kept constant at 80 mL/100g per min, so that CBV varied as a function of MTT. Finally, in the case of no extravasation, MTT varied between 0.5 and 4 times the corresponding MTT in the reference tissue (0.5 < normalized MTT (nMTT)<4). For a given nMTT, the error in K2 (i.e., deviation from zero) and the corresponding error in the leakage-corrected rCBV value were estimated. The error in rCBV was estimated as the percentage difference between rCBV values obtained when applying leakage correction according to Method I compared with values obtained without applying leakage correction.
All data simulations were performed in Matlab 2007a (MathWorks, Natick, MA, USA).
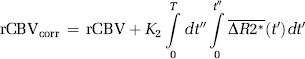
Comparison of Extravasation-Correction Methods in Patient Data: The sensitivity of correction Method I to variations in MTT was tested based on pixel-wise analysis in selected tumors (with tumor MTT values deviating from MTT in nonpathologic tissues) and compared with the expected results based on the simulations. Leakage-corrected MTT values (obtained using correction Method II) were extracted from each voxel within the tumor region of interest and normalized to the MTT derived from a mask of unaffected white and gray matter to yield nMTT values, which were correlated with the corresponding pixel-wise K2 and Ka values. To estimate the error in K2 as a function of nMTT, Ka was assumed to be linearly related to K2 for values of nMTT close to unity. Selecting only tumor pixels with nMTT ≈ 1, the linear correlation coefficient was then estimated so that Kest2= αKa. Under the assumption that Ka is independent of nMTT, the error in K2 as a function of nMTT was then ΔK2 = αKa−K2. The same tissue mask used to extract normalized MTT values was used to determine the reference tissue response curve when estimating K2 according to Method I (equation (1)), so that for pixels with nMTT ≈ 1, it would be expected that ΔK2≈ 0. Finally, under the assumption that corrected CBV obtained from Method II (CBV(II)) is independent of nMTT, the percentage difference between CBV(II) normalized to unaffected white matter and normalized CBV (nCBV) (I) was plotted as a function of nMTT.
Tumor Segmentation: Using anatomic MR images, binary glioma regions of interest were derived from each MR image slice using an automatic tumor segmentation routine based on knowledge-based Fuzzy c-means clustering (Emblem et al, 2009).
Parametric Image Generation: Applying the two correction methods, parametric leakage maps were generated in which T1- and T2*-dominant leakage constants (K2, Method I or Ka, Method II) were rendered with different color palettes (blue for positive T2*-dominant leakage and red for negative T1-dominant leakage). Positive and negative K2 and Ka values were identified in the segmented tumor volume and analyzed separately. When differentiating T1- and T2*-dominant leakage effects, the transfer constants are referred to as Ka(T1) and Ka(T*2), respectively, for T1- and T2*-dominant effects.
All image-processing methods, except for the tumor segmentation method were performed using a modified version of nordicICE (NordicImagingLab AS, Bergen, Norway). Tumor segmentation was performed in Matlab R2007a.
Statistical Comparisons
Group differences between HGGs and LGGs for the derived hemodynamic parameters were tested using the Mann-Whitney U-test with a significance level of 0.01. Using normalized histogram peak values derived from the corrected CBV values from tumor segments (Emblem et al, 2008), logistic regression was used in combination with available survival data to derive Kaplan-Meier survival curves with regard to separating a ‘high-risk group’ (survival < 1year after MRI exam) from a ‘low-risk group’ (survival > 1year) regardless of histopathological grading. Statistical analysis was performed using SPSS 17 (SPSS Inc., Chicago, IL, USA).
Results
Simulations
Figure 1 shows the results of the simulation of the correlation between Ka and Ktrans as function of flip angle (panel A), extravascular transverse relaxivity (r2ev) (panel B), and the presence or absence of predose (panel C). Ka was generally found to be a nonlinear function of Ktrans. At low values of Ktrans and r2ev, combined with large flip angles, Ka was initially negatively related to Ktrans because of a T1-dominant leakage effect. At higher Ktrans values, Ka was almost independent of Ktrans for low values of r2ev. With increasing r2ev and reduction in flip angle, Ka became increasingly positive (T*2-dominant leakage) and was a positive function of Ktrans. The use of predose resulted in mainly T*2-dominant leakage effects and, except for an initial negative dip, Ka being a positive function of Ktrans even for high flip angles and low r2ev values.

Simulations of the relationship between the apparent transfer constant (Ka) and Ktrans. The relationship is shown as function of (
Figure 2 shows the correlations between the estimated CBV and MTT after extravasation correction using the two correction methods compared with actual and uncorrected values. Method II was able to reproduce the reference values after correction for both perfusion metrics, whereas Method I resulted in an increasing underestimation of CBV and MTT with increasing MTT and CBV values. Uncorrected CBV and MTT values were significantly overestimated for T2*-dominant leakage and underestimated for T1-dominant leakage. Cerebral blood flow was not significantly affected by extravasation effects (data not shown).
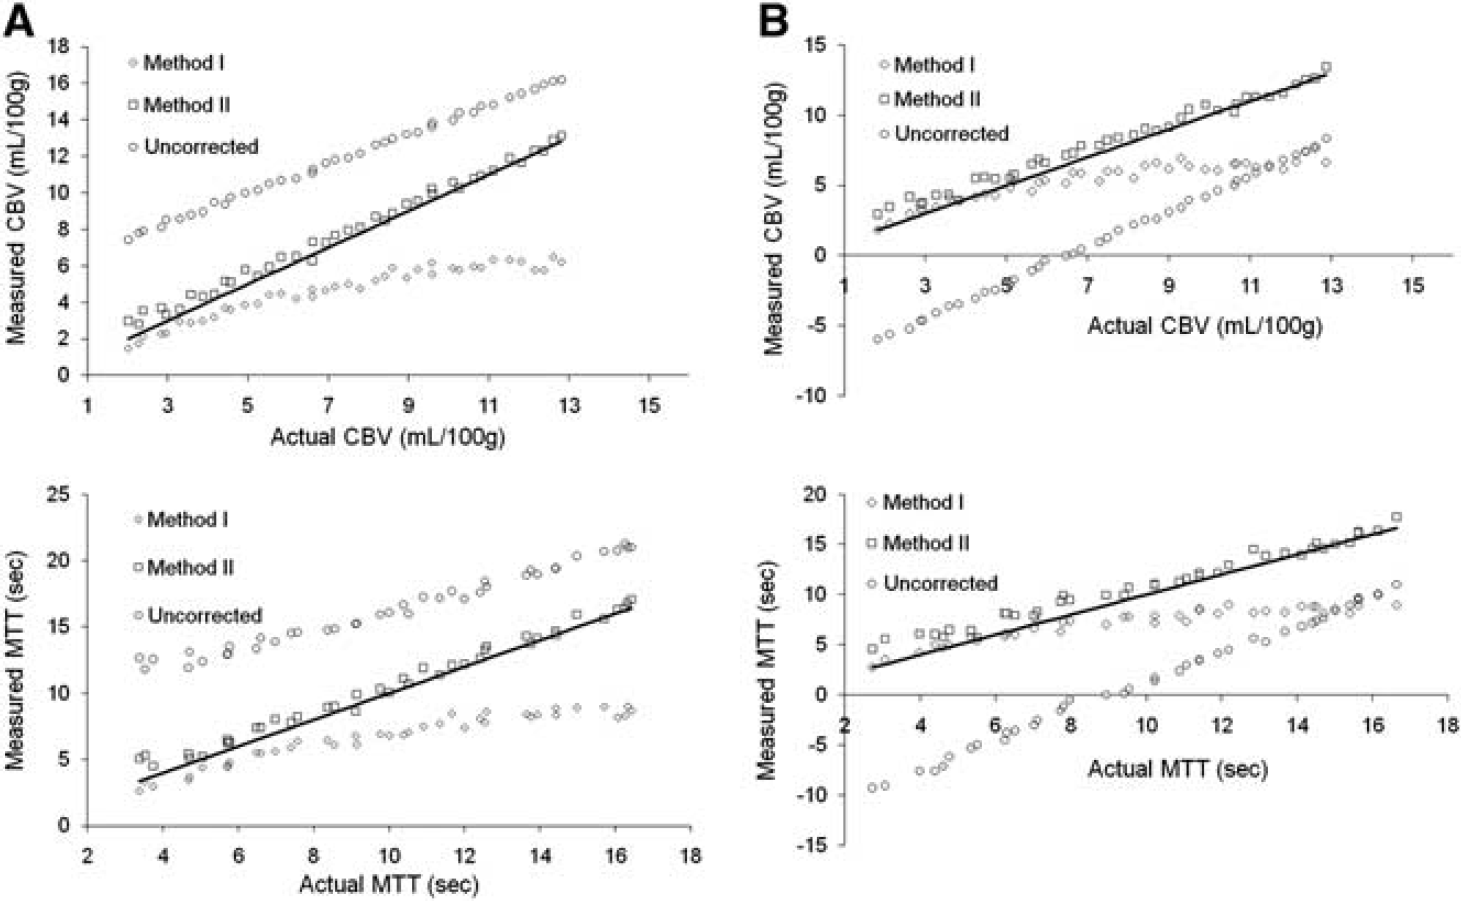
Simulations of the sensitivity of the two leakage correction methods to variations in the underlying hemodynamics and CA extravasation properties. The solid lines indicate the line of unity. The results are shown for (
Figure 3 shows the simulated error in K2 (ΔK2) as a function of nMTT (panel A) and the corresponding error in rCBV (ΔrCBV) in percentage after correction using Method I (panel B) in the situation of no CA extravasation (E = 0). ΔK2 increased quadratically with increasing nMTT and nMTT > 1 resulted in a linear increase in the relative underestimation in rCBV because of an artificially positive value of K2. The error for nMTT < 1 was small for both rCBV and K2.
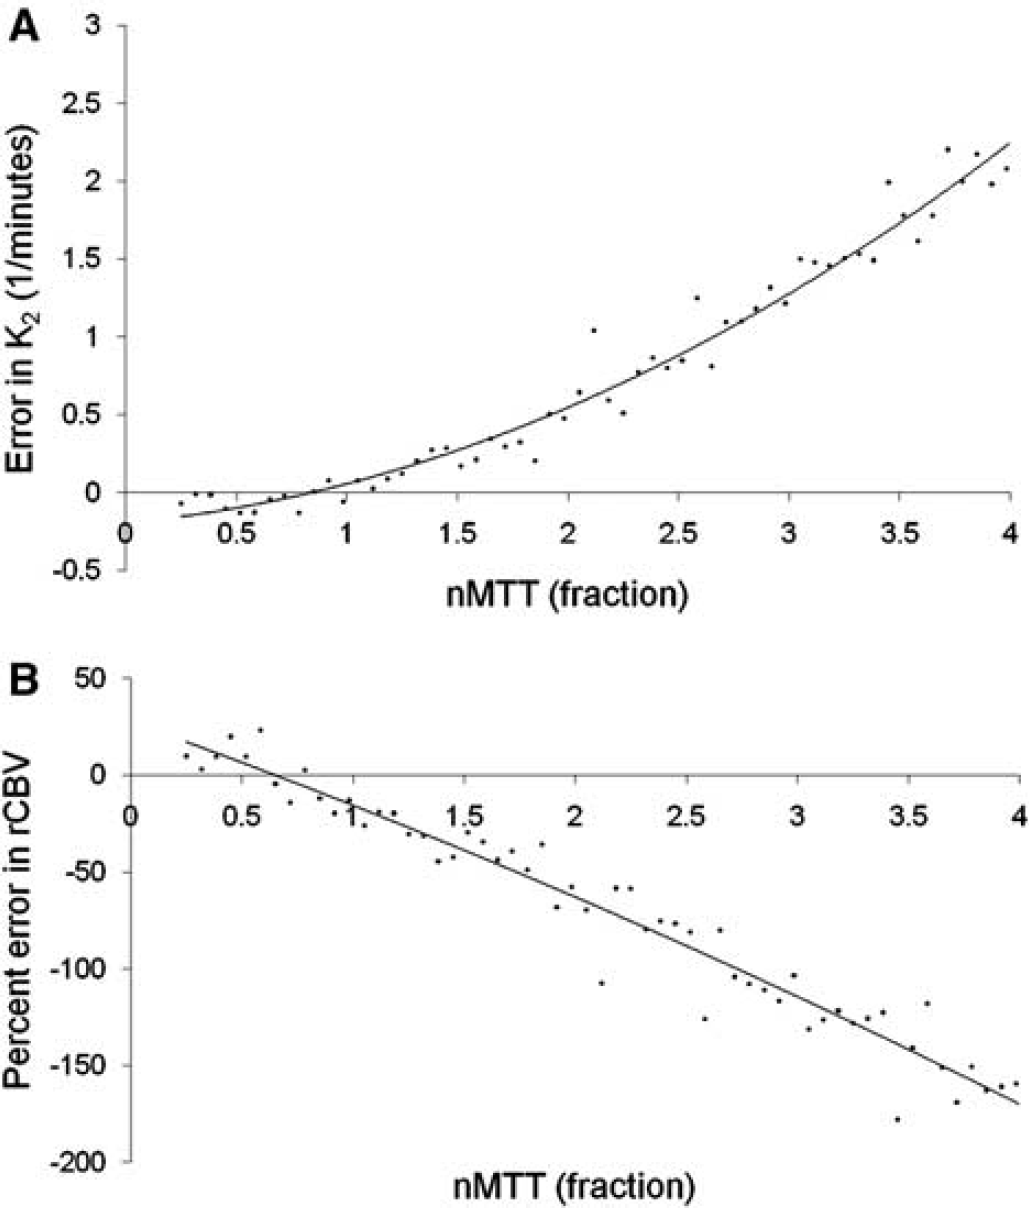
Simulation of errors in K2 due to MTT effects. Simulated error in (
Patient Data
Approximately 60% of all tumors with detectable CA extravasation exhibited predominantly T1-enhancing leakage effects (defined as > 70% of tumor voxels with nonzero Ka having Ka < 0). Approximately 10% of tumors exhibited predominantly T*2-enhancing leakage, and the remaining 30% had an approximately equal mix of T1- and T*2-dominant leakage effects. Figure 4A shows two glioblastoma cases showing T1-dominant (left) and T*2-dominant extravasation effects. Figure 4B shows the corresponding dose-response curves and residue functions for the same two sample cases. As predicted by theory and simulations, the T1-dominant leakage resulted in a negative tail in the residue function and T*2-dominant leakage resulted in a positive tail.
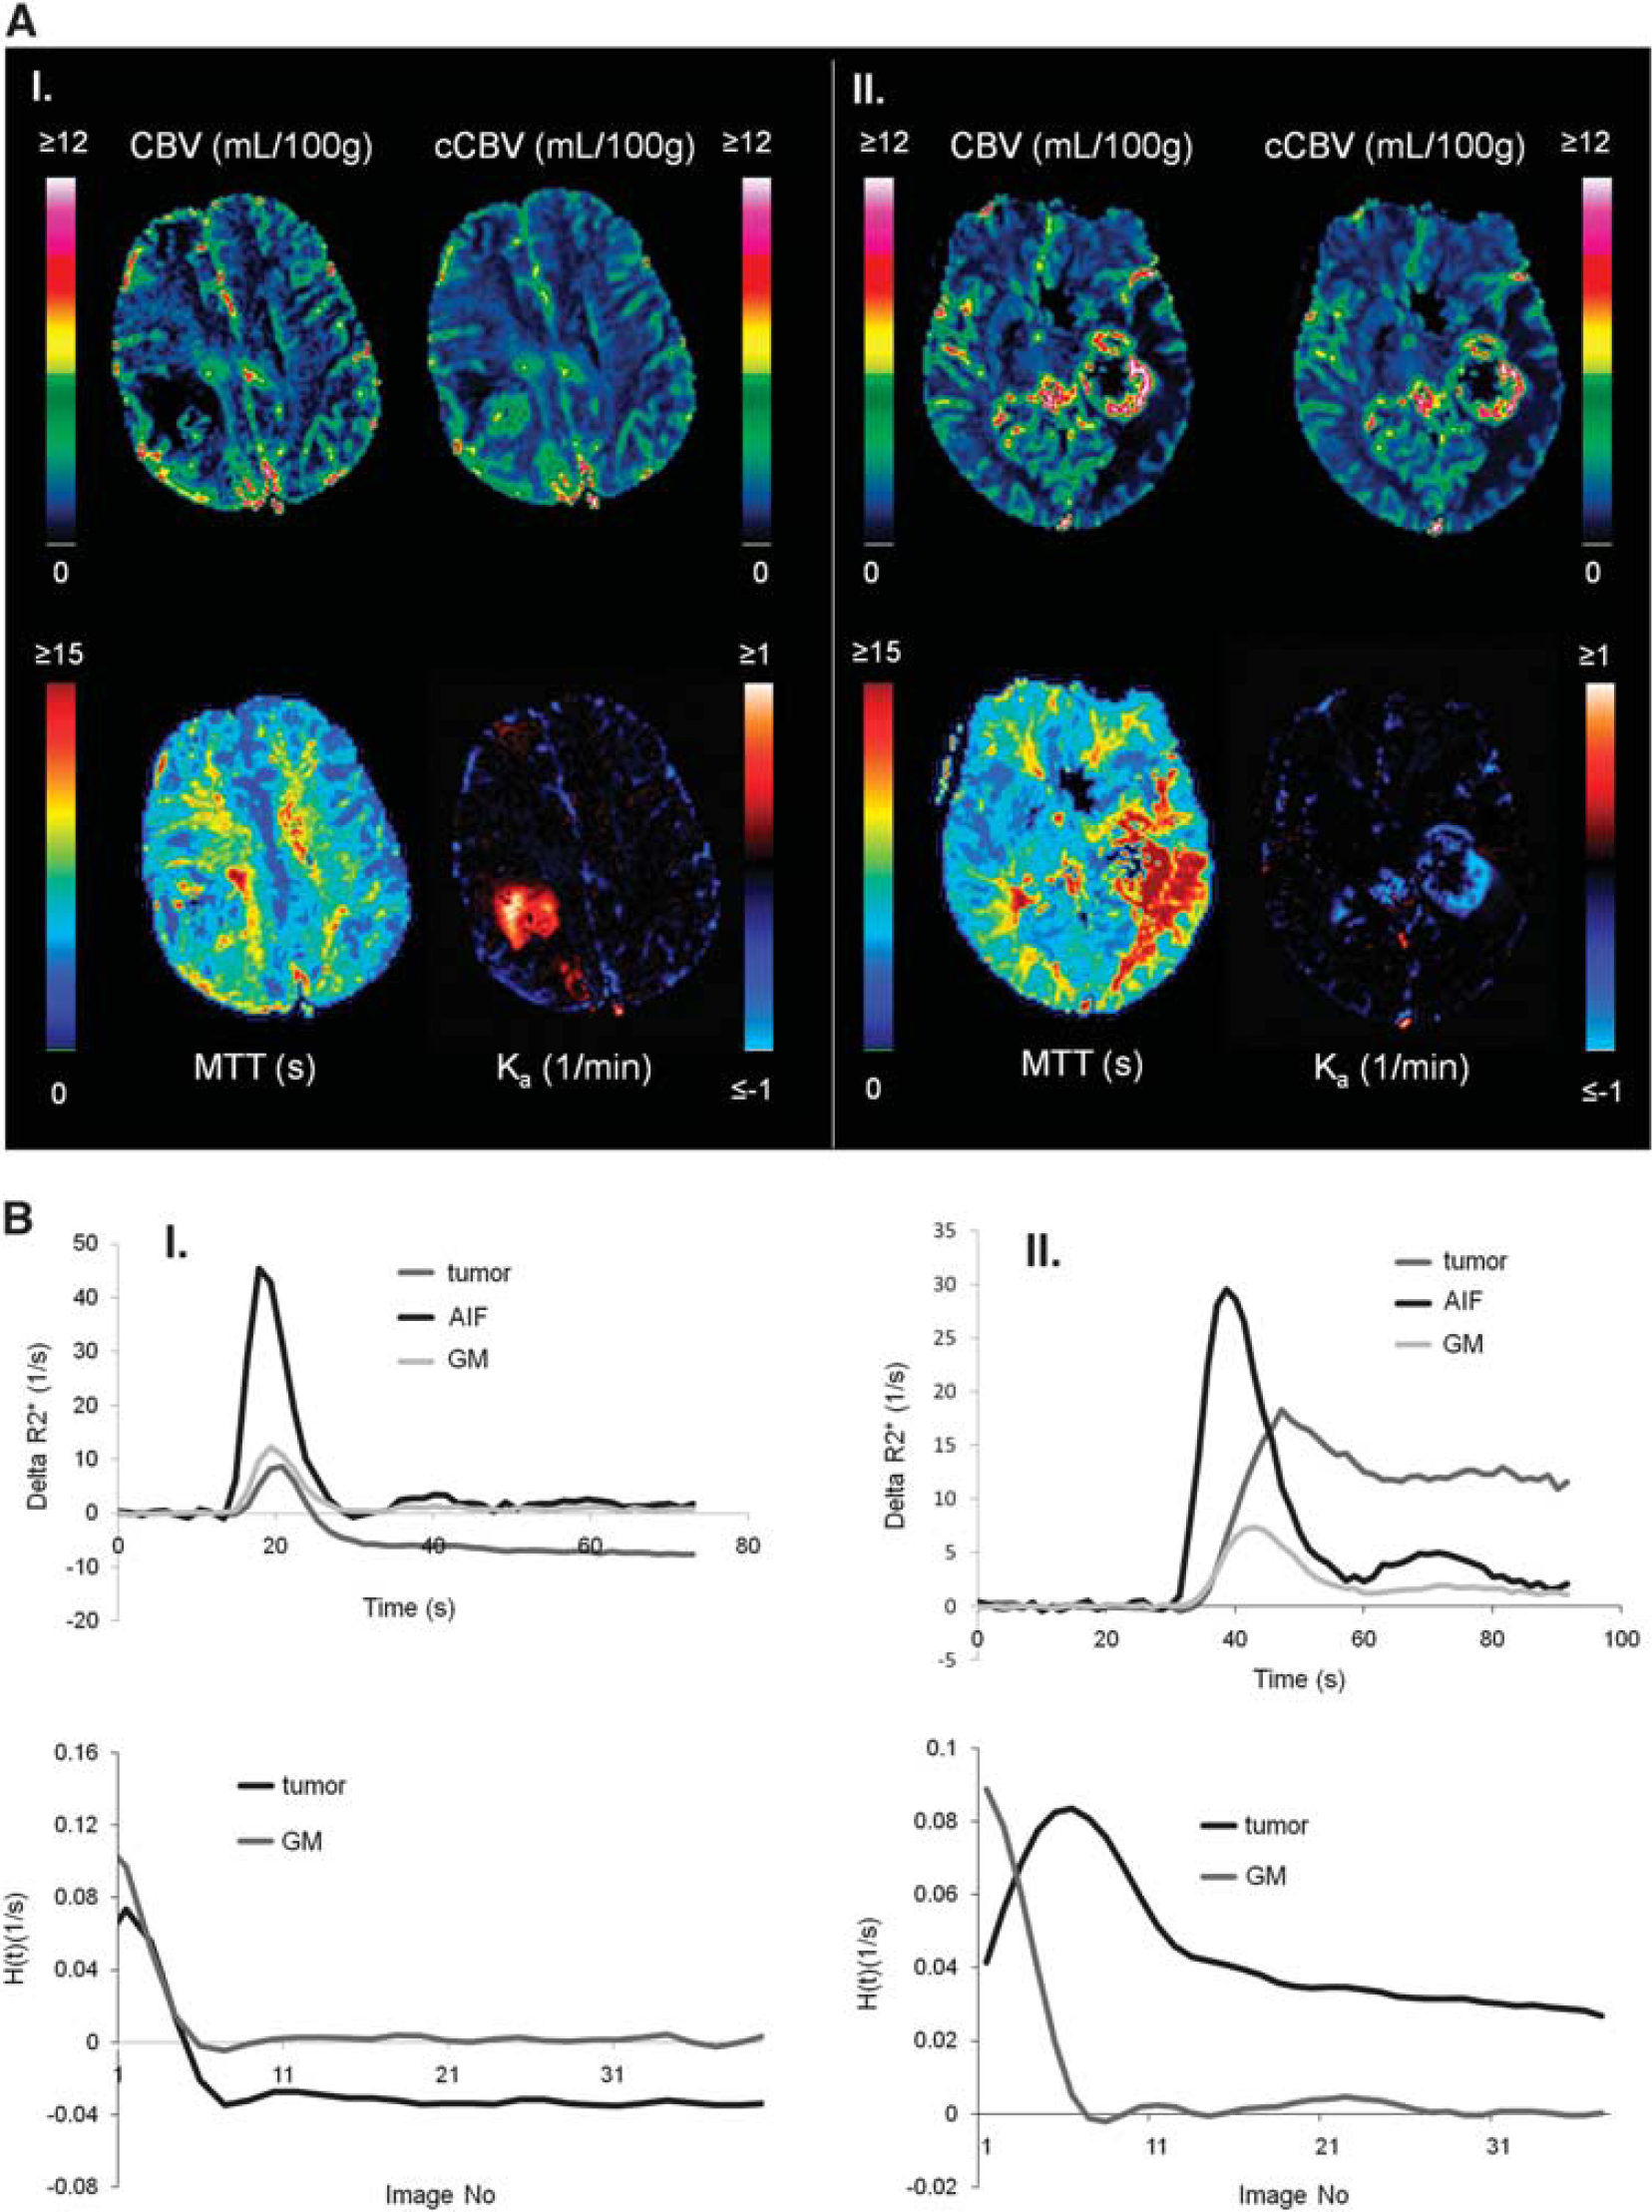
Sample cases showing T1- and T*2-dominant CA extravasation analyzed using Method II. (
Two selected sample cases showing the effect of elevated tumor MTT values are shown in Figure 5. The top row shows a grade III anaplastic astrocytoma with significant elevation of nMTT in tumor resulting in apparent T*2-dominant leakage as seen in the K2 map in spite of the absence of visible contrast enhancement in the T1-weighted image after CA administration. The artificial T*2-dominant leakage resulted in lower nCBV in tumor compared with CBV obtained with Method II. The bottom row shows a glioblastoma with elevated MTT values in the tumor rim resulting in overestimation of K2 and in underestimation of nCBV in areas of elevated MTT values.
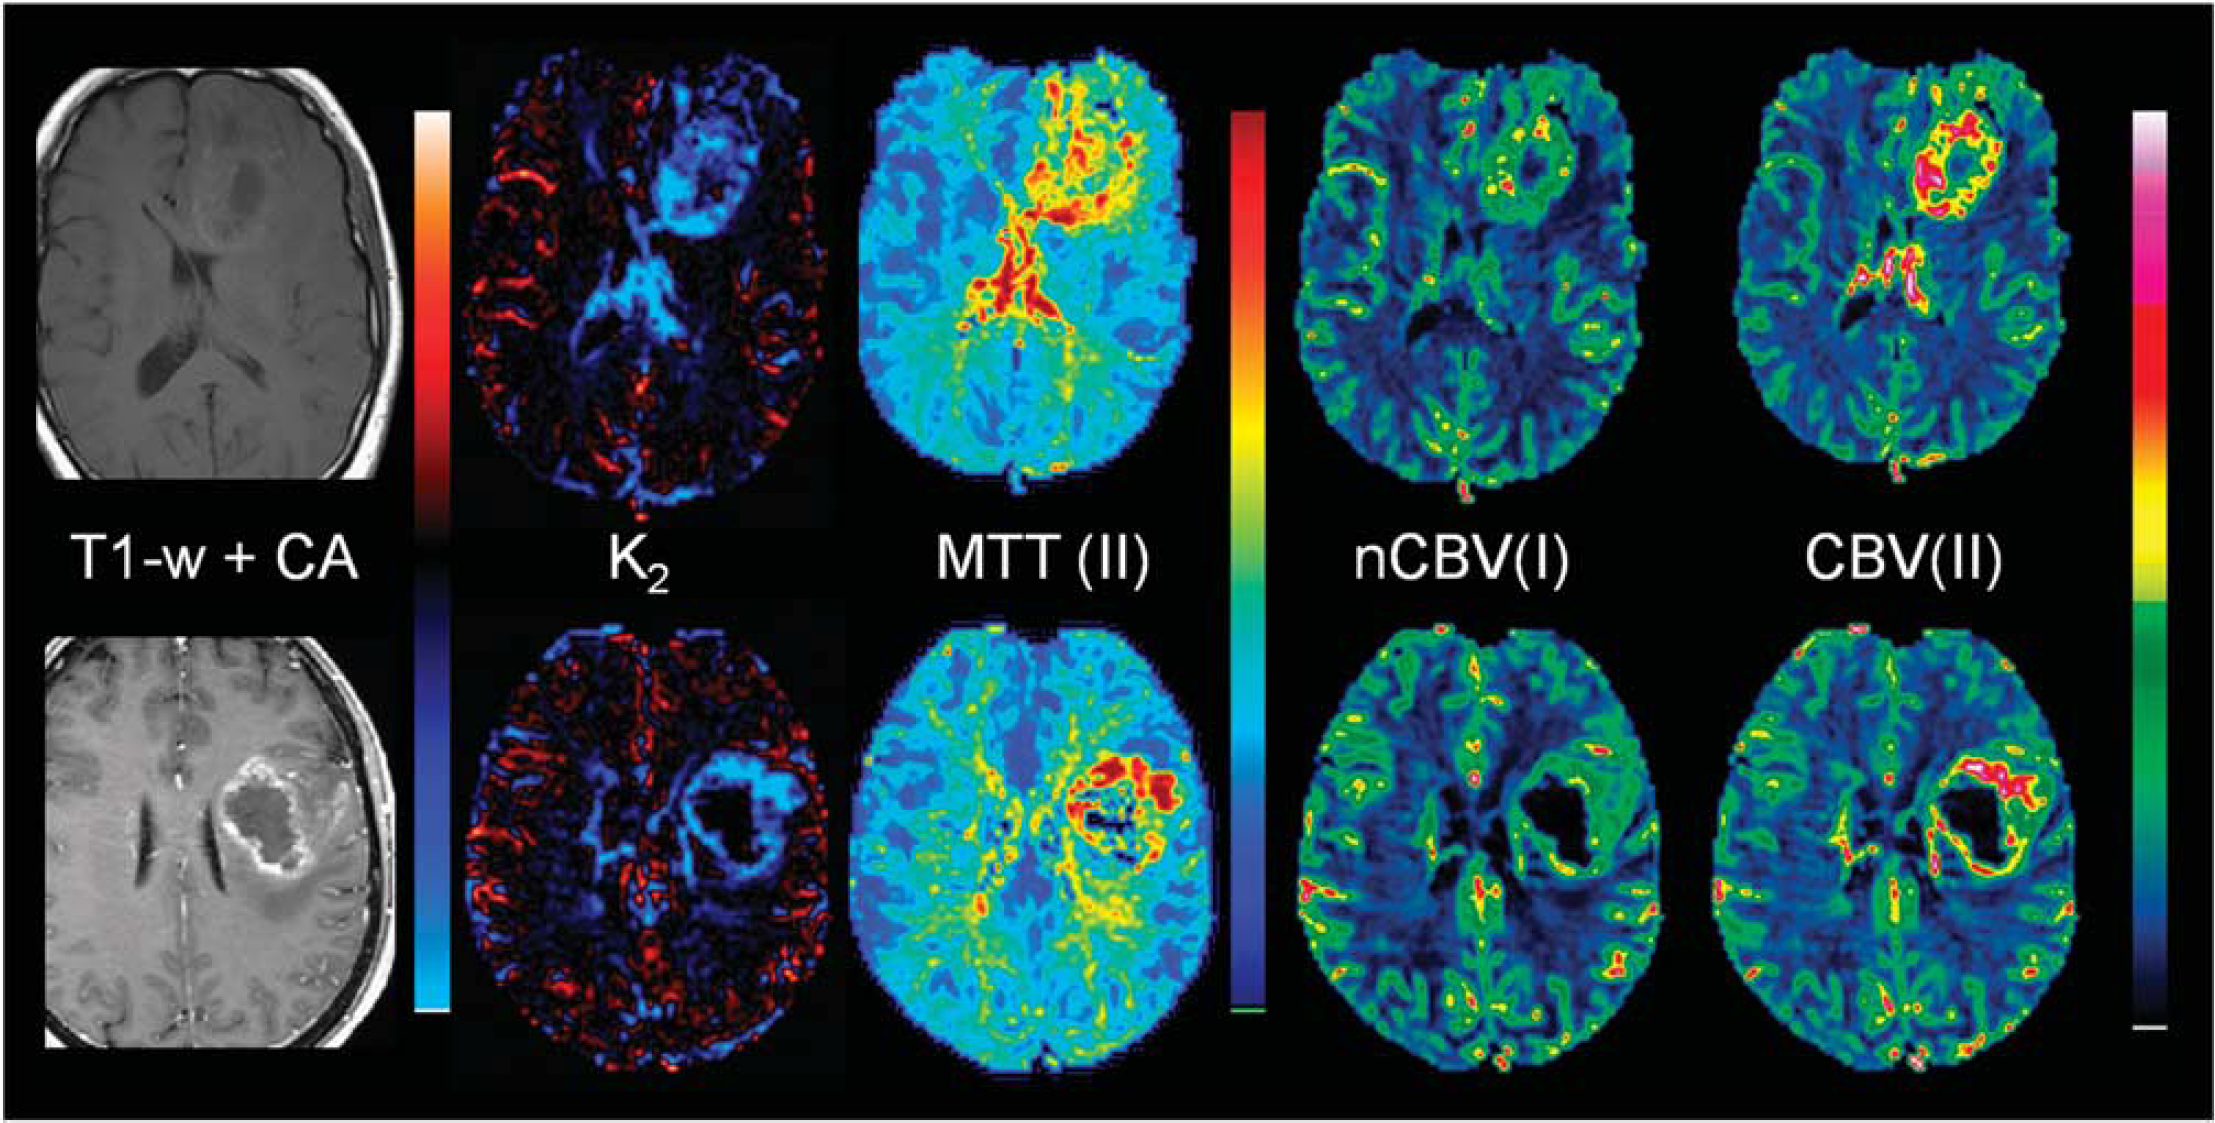
Sample cases showing leakage-correction error using Method I owing to significant deviations in MTT between reference tissue and tumor. The top row shows results in a patient with grade III anaplastic astrocytoma (male, age 53 years). The tumor exhibits significantly elevated MTT values, resulting in large T*2-dominant leakage effects in the tumor in spite of the absence of contrast enhancement on the postcontrast T1-weighted image. The incorrect K2(T*2) estimation results in underestimation of nCBV using Method I (nCBV(I)) compared with the results of Method II (CBV(II)). The bottom row shows results in a patient glioblastoma (female, age 56 years). A similar overestimation of K2 is observed in areas of elevated MTT, with corresponding underestimation of nCBV in the same regions as compared with the CBV values obtained with Method II. nCBV, normalized cerebral blood volume; MTT, mean transit time.
Figure 6 shows pixel-wise analysis of error in K2 and rCBV as function of nMTT for two cases selected based on the presence of a large range of nMTT values in tumor. The left column shows the correlation between Ka and K2 for all pixels with 0.9 < nMTT < 1.1. A significant and similar linear correlation was observed between Ka and K2 for voxels with nMTT ≈ 1 in both cases, and the regression coefficients could therefore be used to determine the residual error in K2 as a function of nMTT. Both cases showed an increase in ΔK2 (center column) and a negative increase in percentage difference between nCBV(I) and nCBV(II) (right column) with increasing nMTT. AK2 had zero crossing at about nMTT = 1, in good agreement with simulations (Figure 3).
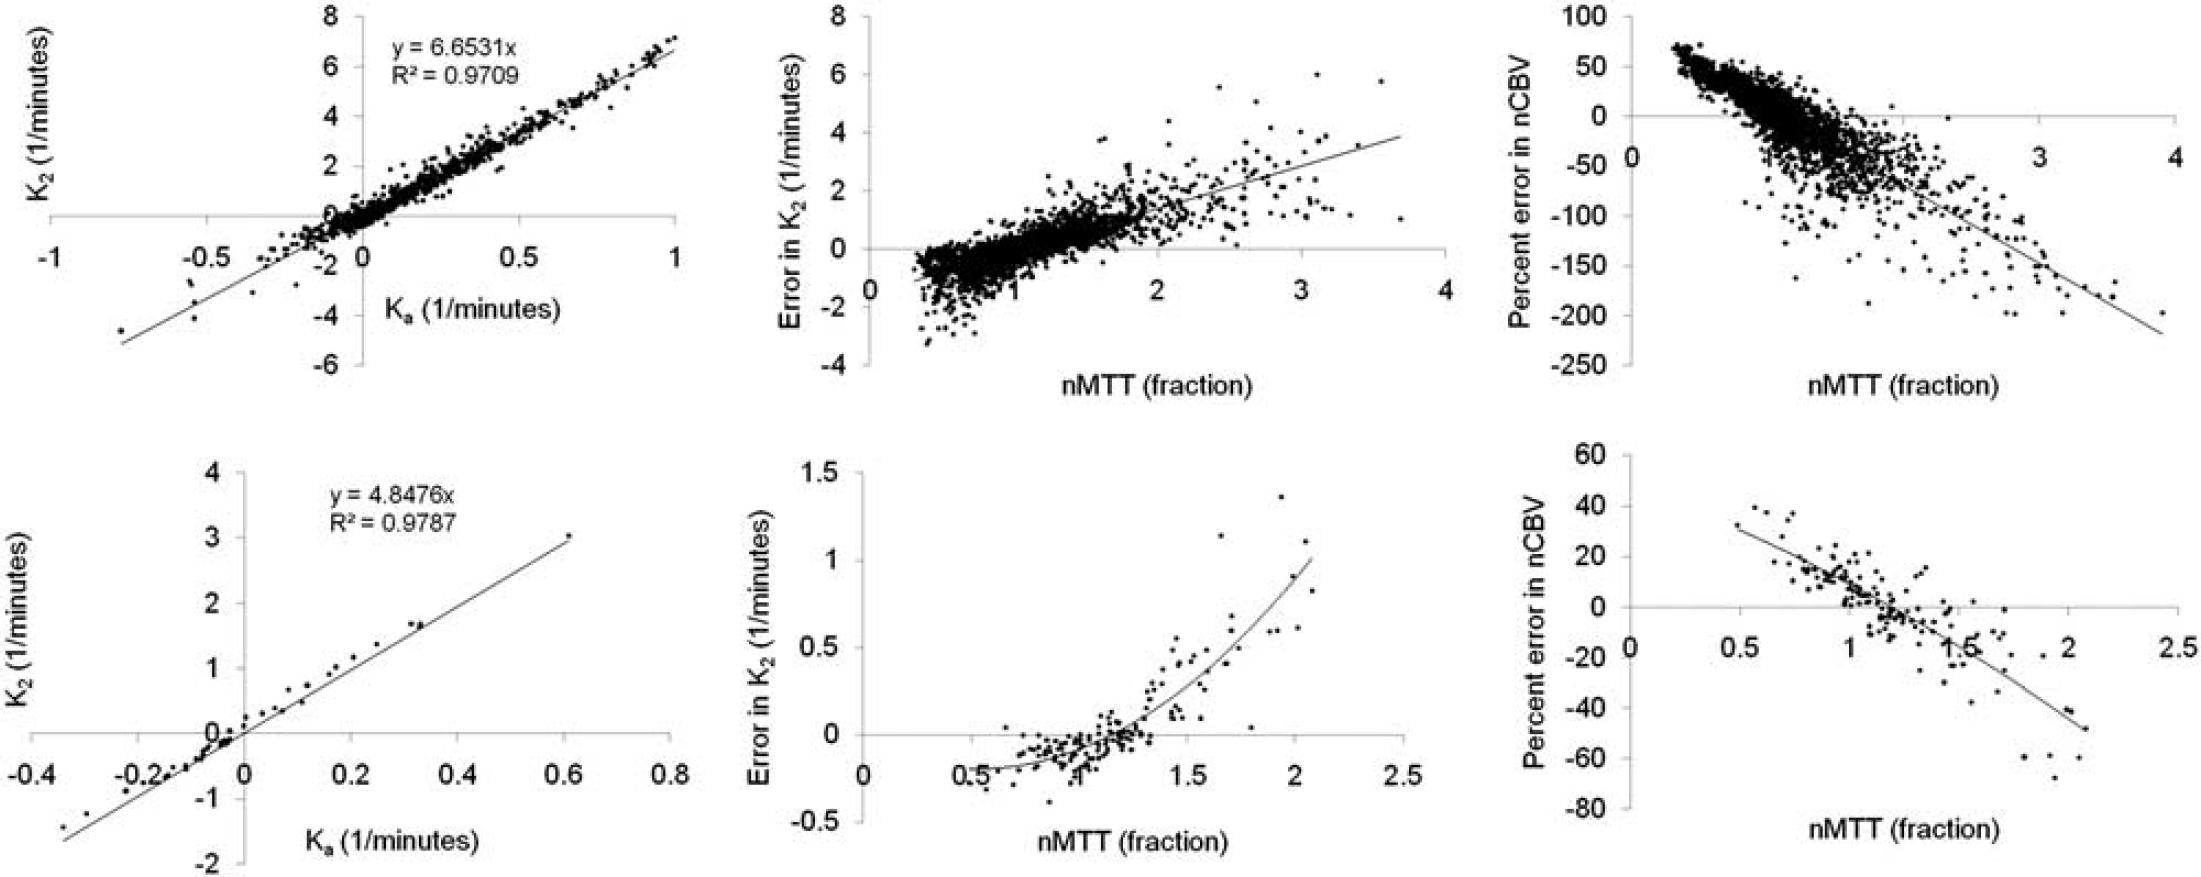
Pixel-wise analysis of error in K2 and nCBV as function of nMTT in two sample cases. The left column shows the relationship between Ka and K2 for pixels with 0.9 < nMTT < 1.1. A high correlation was observed in both cases confirming the validity of the assumption that Ka and K2 are linearly related for nMTT values close to unity. The middle column shows the deviation (ΔK2) from the expected linear relationship between K2 and Ka as function of nMTT. The right column shows the percentage deviation between normalized corrected CBV values (nCBV) obtained with Method I and nCBV values obtained with Method II (ΔnCBV) as function of nMTT. The resulting dependence of ΔK2 and ΔnCBV on nMTT was found to be in good agreement with results from simulations as shown in Figure 3. nMTT, normalized mean transit time; nCBV, normalized cerebral blood volume.
The mean leakage-corrected whole-tumor CBV (± s.d.) was 2.1 ± 0.8mL/100g and 3.9 ± 1.7mL/100g in LGGs and HGGs, respectively (P<.001). Using the same correction method, both mean MTT and Ka(T*2) were significantly higher (P < .001) in HGGs than in LGGs. The average MTT in HGG was 5.6 ± 1.5 seconds and 4.0 ± 1.0 seconds in LGGs. Mean Ka(T*2) was 0.17 ± 0.08 per min in HGGs and 0.11 ± 0.08 per min in LGGs. Ka(T1) was not significantly different in HGGs and LGGs. The Ka values obtained in vivo were in the same range as those obtained in the simulations (Figure 1). For the Kaplan–Meier analysis, the log-rank (Mantel–Cox χ2) values describing the difference between the low-and high-risk survival curves were higher for correction Method II than for Method I (23.69; P < .001 and 16.46; P < .001, respectively). The Kaplan–Meier survival curves are shown in Figure 7.
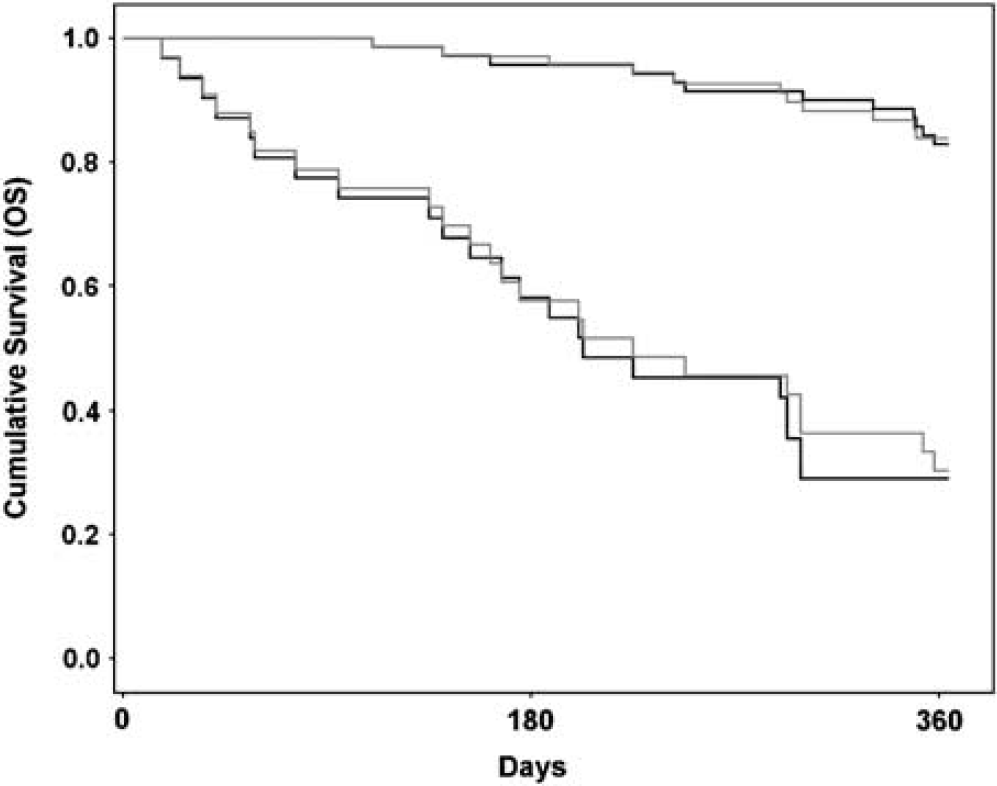
Kaplan-Meier survival analysis for Method II (black lines) compared with Method I (gray lines) when separating a ‘high-risk’ group with expected survival of < 1 year from a ‘low-risk’ group with expected survival of > 1 year. A higher log-rank value was observed for correction Method II than for Method I (23.69 versus 16.46).
Discussion
In this study, we introduce a novel method which enables estimation of CA extravasation and multiple perfusion metrics directly from the tissue residue function. This development was motivated by limitations in existing methodology and an identified need for quantitative assessment of tumor hemodynamic properties. Although a postprocessing-based method for leakage correction is established (Boxerman et al, 2006), two important limitations of this reference-correction method were identified: (1) the method is sensitive to deviations in tumor MTT compared with reference tissue MTT and (2) the method only corrects for T1-dominant leakage. The latter point can easily be overcome by allowing the apparent transfer constant (K2) to assume both positive and negative values. However, MTT sensitivity is inherent in the method, and we show through simulations and in patient data that elevated MTT in tumor tissue may lead to underestimation of rCBV as a result of incorrect estimation of K2. Given that MTT was found to be significantly higher in HGGs than in LGGs, our results suggest that the reference method may underestimate rCBV in tumors even when leakage correction is performed. The proposed correction method providing absolute leakage-corrected CBV values was found to provide improved survival prediction compared with the reference-correction method of Boxerman et al applied to normalized CBV values. The survival analysis was based on whole-tumor CBV histogram analysis (Emblem et al, 2008), an approach previously shown to robustly predict outcome from automatically generated tumor regions of interest (Emblem et al, 2009).
The problem of MTT sensitivity of the reference method has previously been pointed out by other investigators. Quarles et al (2005)proposed an alternative MTT-insensitive correction method which also relies on AIF deconvolution. Different from the method of Quarles et al, we aimed at estimating all hemodynamic parameters directly from the leakage-corrected tissue residue function, thereby avoiding the step of regenerating a leakage-corrected tissue response curve. Although no gold standard currently exists, alternative models providing a combined assessment of both perfusion and CA extravasation have been proposed (Larsson et al, 2009; Singh et al, 2007). The approach of Larsson et al is similar to that of ours in that it is based on a model-independent estimation of the leakage-affected residue function using Tikhonov-regularized deconvolution. However, they estimated the perfusion and permeability parameters by fitting the obtained residue function to a comprehensive two-compartment model. Their approach was found to give robust estimates of both perfusion and permeability when applied to T1-weighted dynamic contrast-enhanced MRI. It remains an open question what the added value of such complex models may be when applied to DSC-MRI because of a much less predictable dose response in tumor tissue with this acquisition method, as shown in our study.
The model assumptions used in the presented correction method deviates somewhat from our previously proposed model in which capillary perfusion and extravascular leakage were assumed to occur as two parallel processes originating from the same arterial source (Bjornerud and Emblem, 2009). Although the current model probably better describes the underlying kinetics of the CA, the estimation of Ka is in practice identical for the two models and the CBV correction differs only by the nonzero offset value Nc (equation (18)) in the modified model.
In spite of eliminated MTT sensitivity in relation to CA leakage estimation, the proposed method has limitations. It is known that SVD-based deconvolution may underestimate flow values when MTT becomes too short relative to the sampling rate (Wu et al, 2003). This effect could lead to a bias in the estimated MTT values. However, we did find MTT to be significantly increased in HGGs than in LGGs, suggesting that CBV increases relatively more than does CBF in malignant gliomas. It is therefore believed that MTT errors owing to limited sampling rate may not be significant in this patient population, but this assumption needs to be investigated further. Moreover, the proposed method relies on accurate estimation of the tissue residue function, which requires both robust estimation of the AIF and stable deconvolution in the presence of noise. Given the recent advent of automated AIF detection methods (Carroll et al, 2003; Mouridsen et al, 2006), it is expected that much of the current user dependence associated with AIF determination can be eliminated. The need of the method to identify a ‘steady-state’ level in a noisy and generally oscillating residue function is also a challenge. We minimized oscillations by using an iterative Tikhonov regularization-based SVD deconvolution method (Calamante et al, 2003; Hansen and Oleary, 1993) and were able to obtain robust estimates of both T1- and T*2-dominant leakage effects using this approach.
Computer simulations were used to investigate the relationship between the measured apparent rate constant Ka and Ktrans. Although the performed simulations make several simplifying assumptions regarding in vivo relaxation effects, the results clearly suggest that the apparent transfer constant estimated from DSC-MRI is generally not linearly related to the underlying permeability surface area product (PS) of the tumor tissue, even when extravasation is permeability limited (CBF > > PS). This lack of linear correlation is partly attributed to the complex relationship between CA concentration in tissue and the measured change SI and corresponding transformation to apparent transverse relaxation rates. The presence of both T1 and T*2 relaxation effects in the EES can result in both positive and negative apparent rate constants depending on the underlying tissue properties, as well as sequence parameters. The presence of both these effect was confirmed in the patient data. An additional source of nonlinearity is attributed to the assumption of negligible CA reflux. For the higher Ktrans values tested in these simulations, the required condition that KtransTN/ve < < 1 is clearly violated, resulting in an underestimation of Ka at high Ktrans values. An improved model in which the tail of H(t) is not assumed to be a constant but is fitted to the full exponential function (equation (15)) is therefore warranted and may provide a better estimate of Ktrans. However, even with improved kinetic models, absolute estimations of Ktrans from DSC acquisitions will remain challenging because of an unpredictable and generally nonlinear dose response in DSC-MRI.
The simulations confirmed that the use of a predose reduces T1 effects and gives predominantly positive Ka values except at very low Ktrans, in which an initial negative ‘dip’ was observed. The presence of this initial ‘inverted’ Ka response at low Ktrans values could be a potential challenge but this effect needs to be confirmed in clinical data in which a predose is used. In this study, no predosing and a large flip angle of 900 was used, both factors resulting in an increased sensitivity to T1-dominant leakage effects. Although Ka should be expected to correlate with tumor grade, such a correlation was only observed for Ka(T*2). The lack of correlation of Ka(T1) with tumor grade may be because of the nonlinear dependence, and to a certain degree the nondependence of Ka(T1 and (Ka<0) on Ktrans, as seen in Figures 4A and 4B. Given the results of the simulations showing that transition from T1- to T*2-dominant leakage depends strongly on the effective transverse relaxivity in the EES, it could be hypothesized that the presence or absence of the two competing leakage effects may convey relevant information regarding the extravascular tissue structure within the tumor. This effect could thus be a potential marker for assessment of treatment response by, for instance, monitoring of changes in the relative Ka(T1)/Ka(T*2) fraction during treatment. This observation warrants further investigation.
In summary, we present a novel extravasation-correction method which enables robust correction for both T1- and T*2-dominant leakage effects independent of the MTT of the target tissue. The method was combined with automated methods for AIF detection, providing estimates of multiple hemodynamic parameters without user interaction. Given the recent focus on longitudinal image-based assessment of treatment response in brain tumor therapy, user-independent analysis methods will become increasingly important. To this end, the utility of the presented perfusion analysis methodology will be tested in longitudinal tumor treatment monitoring analysis in follow-up of this study.
Footnotes
Acknowledgements
The authors thank Inge Rasmussen MD, PhD, for critical reading of this manuscript.
AB Consultant/Advisory Boards; NordicNeuroLab AS, Bergen, Norway. KEE: Grant support; Norwegian Research Council; 191088/V50. AGS: Grant support; National Cancer Institute, National Institutes of Health. Consultant/Advisory boards; ACR-Image Metrix, BayerScheringPharma, Bristol Meyers Squibb, BiogenIdec, Merrimack Pharmaceuticals, Olea Medical, Mitsubishi Pharma, GE Healthcare, Regeneron, Novartis, Roche, Siemens Medical, Takeda, AstraZeneca, National Institutes of Health, Kit, Inc. KM: No potential conflicts of interest.