
Abstract
A ‘vascular normalization index’ (VNI) based on the changes in the magnetic resonance imaging (MRI) parameters Ktrans and cerebral blood volume (CBV), combined with blood sampling, has been shown to correlate with patient outcome in recurrent glioblastoma after a single dose of antiangiogenic therapy. Here, by applying a novel contrast agent extravasation correction method insensitive to variations in tissue mean transit time, we show that a similar VNI parameter can be derived from a single dynamic susceptibility contrast MR acquisition rather than the three parameters shown previously. Our results show that this new VNI parameter, which combines changes in tumoral CBV and an apparent transfer constant from our leakage correction method, may provide prognostic information in an even simpler manner than prior efforts.
Introduction
Magnetic resonance imaging (MRI) can be used to monitor the onset and duration of radiological responses to antiangiogenic therapy in recurrent glioblastoma patients (Pope et al, 2006; Batchelor et al, 2007; Essock-Burns et al, 2010). In one study (Batchelor et al, 2007), the pan-vascular endothelial growth factor (pan-VEGF) receptor tyrosine kinase inhibitor cediranib (AZD2171) was shown to normalize the tumor vasculature from day 1 of treatment until reversal of this ‘normalization window’ approximately 1 month after treatment onset (Rubenstein et al, 2000). Furthermore, in the same patient group, early changes in MR-derived vascular parameters after a single day of treatment predicted patient outcome. By combining MRI biomarkers such as the transfer coefficient related to flow and capillary permeability (Ktrans) and cerebral blood volume (CBV), as well as circulating collagen IV levels, a ‘vascular normalization index’ (VNI) was derived that correlated with time to disease progression and patient survival (Sorensen et al, 2009). A composite biomarker has theoretical advantages such as greater robustness against error in one of the components. Obtaining the VNI parameter as it was originally described, however, is potentially logistically challenging and time consuming in clinical practice, since the VNI requires a combination of vascular MRI parameters from dynamic contrast-enhanced (DCE) imaging (Ktrans) and dynamic susceptibility contrast (DSC) imaging (CBV) as well as peripheral blood sampling. A simpler method that was equally predictive could be more rapidly put into clinical practice.
For DSC imaging, a ‘byproduct’ of the contrast agent leakage correction method proposed by Weisskoff et al (1994) and Boxerman et al (2006) is the ‘K2’ term reflecting the estimated contrast agent extravasation into the interstitial space. Under the assumption that the K2 parameter reflects tumor permeability (i.e., something similar to Ktrans), a single DSC-MRI acquisition could potentially provide estimates of both CBV and permeability for use in an alternative VNI parameter except the collagen blood parameter. One limitation to this approach, however, is that the contrast agent leakage correction model assumes that the contrast agent bolus arrives at the same time in tumor and normal-appearing tissue and that tumoral and nontumor tissue have equal mean transit times (MTTs). Given the irregularity of tumor vasculature (Bastin et al, 2006; Jain et al, 2007), this assumption seems tenuous. Consequently, alternative MTT insensitive correction methods have been proposed that might provide better estimates of tumor permeability (Quarles and Schmainda, 2007; Quarles et al, 2009). We recently described the theoretical basis for an alternative technique where the leakage value is determined by incorporating a contrast agent leakage term in the tissue-specific residue function R(t), which then accounts for leakage-induced variations in the first-pass curve (Bjornerud et al, 2011). First, our results suggested that there was a significant linear correlation between the residual error term of K2 and MTT for both T1- and T2*-dominant extravasation, indicating an increasing error in K2 for increasing tumoral MTT deviations from reference tissue MTT. Second, our results suggested that contrast agent leakage correction assessment directly from the tissue residue function might provide a more accurate estimate of the underlying capillary permeability independent of tumoral MTTs.
Based on these results, we hypothesize that a double-echo DSC-MRI acquisition combined with our recently proposed contrast agent leakage correction method can form the basis of a VNI parameter which is easier to obtain in a clinical setting than the current VNI parameter without losing its diagnostic value. We explore this hypothesis in data collected from 30 recurrent glioblastoma patients undergoing anti-VEGF therapy.
Theory
A detailed description of our approach to estimate and correct for contrast agent extravasation is presented in Part I of our study. In brief, by assuming that the dynamic contrast agent time course is separable into an early (fast) vascular phase followed by a (slow) extravasation phase, the total tissue response Ct_m to a contrast agent bolus can be expressed by (St Lawrence and Lee, 1998):
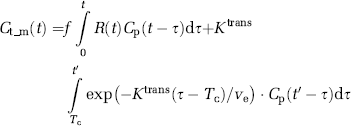
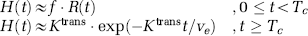
where f is proportional to tissue flow, Cp is the tracer concentration in plasma, Ve is the extravascular extracellular volume fraction, and Tc is the capillary transit time of the contrast agent so that t < Tc and t′ ≥ Tc. The combined residue function H(t) scaled by flow and extravasation can then be expressed as:
From this, as explained in Part I, equation (1) can be written in matrix notation in terms of the measured changes in T2* relaxation rates:

where Y is a matrix describing the apparent change in the transverse relaxation rate (R2*) in tissue in the presence of T1 effects and extravasation, A is a matrix describing the corresponding change in R2* in blood, and h is the apparent residue function in the presence of contrast agent leakage. Following standard arterial input function (AIF) deconvolution, h is given by:
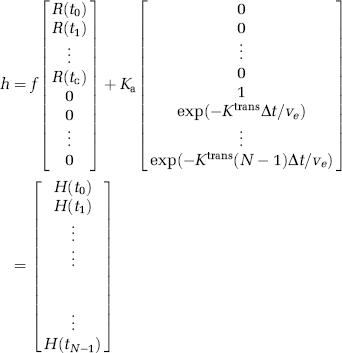
where Ka is the apparent transfer constant between plasma and extravascular, extracellular space, N is the number of data points, Δt is the sampling interval, and tc is the time index corresponding to Tc. If the total measurement time is much greater than Tc, then for t >> Tc, H(t) is dominated by the leakage term. By further assuming negligible reflux, that is exp(−Ktranst/ve) approaching unity because KtransNΔt/ve << 1, we get:
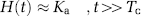
An estimation of Ka can thus be obtained directly from the ‘tail’ of the measured residue function H(t). Finally, the leakage-corrected values of CBVcan then be estimated as

where CBVapp is the apparent CBV in the presence of extravasation as estimated from the central volume principle and the area under H(t), Nc is the time index corresponding to Tc, and ρ is tissue density. The value of Tc is tissue dependent and can be estimated by fitting the initial portion of H(t) to an appropriate parametric function.
Materials and methods
Patients
Our study retrospectively included 30 patients with recurrent glioblastomas who were enrolled in a phase II clinical trial (Batchelor et al, 2007) of an oral pan-VEGF receptor tyrosine kinase inhibitor (Cediranib, AstraZeneca Pharmaceuticals, Macclesfield, Cheshire, UK) sponsored by the National Cancer Institute (Clinicaltrials.gov, NCT00035656). The study was approved by the institutional review board and patients were included only if informed consent was obtained. The study protocol used in our study included a baseline MR examination 1 day before, and an MR examination 1 day after, initiation of therapy. At the time of the baseline MR examination, the patients had received both radiation treatment and chemotherapy as part of the ongoing clinical treatment protocol. Also, dates from treatment onset until disease progression (progression free survival (PFS)) and death (overall survival (OS)) were recorded, where tumor progression was defined according to the Macdonald criteria (Macdonald et al, 1990).
Magnetic Resonance Imaging
All imaging studies were performed on the same 3T MR system (Magnetom Trio, Siemens Medical Solutions, Erlangen, Germany) as part of our comprehensive tumor protocol (Batchelor et al, 2007). Precontrast and postcontrast axial T1-weighted spin-echo (SE) images were included for outlining the lesions based on contrast enhancement alone. The imaging parameters were as follows: repetition time = 600 milliseconds, echo-time = 12 milliseconds, slice thickness = 5 mm, interslice distance = 1 mm, in-plane resolution = 0.45 mm with a matrix size of 384 × 512 and 23 slices. The total imaging time was 1 minute and 59 seconds. The DSC imaging protocol consisted of a double-echo, echo planar imaging sequence acquiring a gradient-echo (GRE) image (echo-time = 34 milliseconds) and an SE image (echo-time = 103 milliseconds) after each 90° excitation pulse. Other imaging parameters were as follows: repetition time = 1,330 milliseconds, slice thickness = 5 mm, interslice distance = 2.5 mm, in-plane resolution = 1.7 mm, matrix size of 128 × 128,10 slices and 120 volumes. The total imaging time was 2 minutes and 45 seconds and 0.2 mmol/kg of gadopentetate-dimeglumine was injected at 5 mL/s after ∼ 85 seconds of imaging. In addition, before DSC imaging, the imaging protocol also included a DCE image sequence using an initial 0.1 mmol/kg dose of gadopentetate-dimeglumine after ∼ 52 seconds of imaging. The DCE imaging parameters were as follows: repetition time = 5.7 milliseconds, echo-time = 2.73 milliseconds, slice thickness = 2.1 mm, interslice distance = 0.4 mm, flip angle = 10°, in-plane resolution = 2.9 × 2.0 mm2, matrix size of 128 × 128, 20 slices and 50 volumes.
Image Analysis
Enhancing lesions as seen on the postcontrast T1-weighted images were outlined by an experienced radiologist blinded to patient information using a previously described volumetric approach (Sorensen et al, 2001). The postcontrast T1-weighted images were coregistered to the first DSC SE and DCE volume before contrast arrival using a standard normalized mutual information algorithm in Statistical Parametric Mapping (SPM5) and the resulting translation matrix for each volume was applied to the binary tumor region of interests images.
Arterial input functions were determined in each DSC image slice using a previously published automatic method based on K-means cluster analysis of the DSC concentration curves (Bjornerud and Emblem, 2010). Here, an iterative Tikhonov regularization-based SVD method was used to minimize oscillations in the ‘tail’ of the residue function used to estimate the rate constant Ka. In addition, a local correction factor was applied to the AIFs to correct for potential partial volume effects. The correction factor was determined from the pseudo-steady-state ‘tail’ following the first-pass response of the concentration curves of the arterial and venous signal, under the assumption that the dose-response is similar in arteries and veins in this phase (Bjornerud and Emblem, 2010).
Using equation 6, leakage-corrected CBV maps were created from the DSC SE images. The SE images were selected over the GRE images as they have been shown to have maximal sensitivity to capillary-sized microvessels, which is considered to be the target of anti-VEGF drugs, and SE CBV but not GRE CBV have been shown to correlate with outcome measures in previous studies (Donahue et al, 2000; Kiselev et al, 2005; Kjolby et al, 2006; Jain et al, 2007; Batchelor et al, 2007; Sorensen et al, 2009). To conform to the reference study (Sorensen et al, 2009), the CBV maps were normalized by dividing every CBV pixel value with a slice-specific mean gray- and white-matter CBV value and were therefore unitless (Emblem and Bjornerud, 2009). Maps of contrast agent leakage were created by pixel-wise estimation of the Ka. For Ka, the DSC GRE images were selected over the SE images because of higher SNR and higher sensitivity to contrast agent leakage effects shifted towards T2*-dominant extravasation due to the use of a predose. Finally, quantitative MTT maps were created by assessing the area under the leakage-corrected residue function. From here on, similar to Part I of our study, the method used for the CBV, Ka, and MTT maps as described above will be referred to as method II.
In addition, for comparison, a second set of leakage-corrected CBV maps (from DSC SE) and contrast agent leakage maps (K2; from DSC GRE) were created using the method proposed by Boxerman et al (2006). In this, contrast agent extravasation is estimated by determining the voxel-wise deviation from a ‘nonleaky’ reference tissue response curve,
The reference
To compare the Ka parameter with Ktrans from DCE imaging, similar to the simulations in Part I of our study, Ktrans maps were derived as described elsewhere (Tofts et al, 1999; Batchelor et al, 2007). Here, the AIF was selected manually in each patient by an experienced radiologist using the straight sinus or adjacent vessel as visualized on the axial DCE images. Image analyses were performed using Matlab R2009b (MathWorks, Natick, MA, USA) and nordi-cICE (NordicImagingLab AS, Bergen, Norway).
Statistical Analysis
Tumoral pixel-by-pixel Ka and Ktrans values were compared by deriving median Ka values for increasing Ktrans cohorts (of 0.05 per minute). The reason for using cohorts was to correct for the relative large number of low-valued Ka and Ktrans pixels compared with those with high permeability values. The relationship between the median Ka values in each patient and the increasing Ktrans cohorts were assessed using linear mixed models and regression analysis.
Mean tumoral values of CBV were recorded for the baseline MR examination and the MR examination at day + 1 after treatment start and Spearman's rank tests of the logarithmic differences between baseline and day + 1 were used to assess any association between changes in CBV and PFS and OS. Because the Ka (method II) and K2 (method I) parameters can have both positive and negative values depending on whether the contrast agent leakage effect is T1- and T2*-dominant, a previously published histogram method (Emblem et al, 2008) was applied instead of using mean values to quantify the patient-specific distribution of Ka (K2) values at the two time points. In this, the peak height of a normalized 100 bin histogram of the Ka (K2) distribution was used as a measure of permeability and Spearman's rank tests were used to assess the correlations between logarithmic differences in Ka (K2) at baseline and day + 1 and PFS and OS. In addition, mean tumoral values of MTT (from SE data) were recorded at the baseline MR examination and Spearman's rank tests were used to assess any systematic correlation between MTT and the logarithmic difference between the T1-dominant (< 0) and T*2-dominant (> 0) Ka and K2 values at baseline.
Logarithmic changes (Δ) in mean tumoral values of CBV and histogram peak heights of Ka (K2) between pretreatment and day + 1 were assessed to create a patient-specific VNI value (unitless) using Cox regression according to the formula (Sorensen et al, 2009)

where ‘a’ and ‘b’ are coefficients of the Cox regression and PFS and OS were used as end points. Any potential correlation between VNI and PFS and between VNI and OS were assessed using Spearman's rank tests. Finally, for PFS and OS, Kaplan-Meier survival curves were used to assess any potential difference between the survival curves (Mantel-Cox log-rank values) of a ‘poor response’ (with ‘short’ PFS and OS expected) group and a ‘good response’ (with ‘prolonged’ PFS and OS expected) group of 15 patients each according to the VNI parameter in ascending order.
For all tests, a P value of 0.05 was considered significant and pixel values above a 95% percentile and below a 5% percentile were removed before analysis to reduce the influence of outliers.
Results
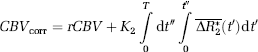
The median PFS and OS of the 30 patients included were 111 days (range 27–252 days) and 220 days (range 48–566 days), respectively. Examples of CBV, MTT, Ka, and K2 maps from the baseline MR examination of a glioblastoma patient are shown in Figure 1.
Axial baseline magnetic resonance (MR) images of a glioblastoma patient where the tumor shows extensive leakage on the postcontrast T1-weighted image (
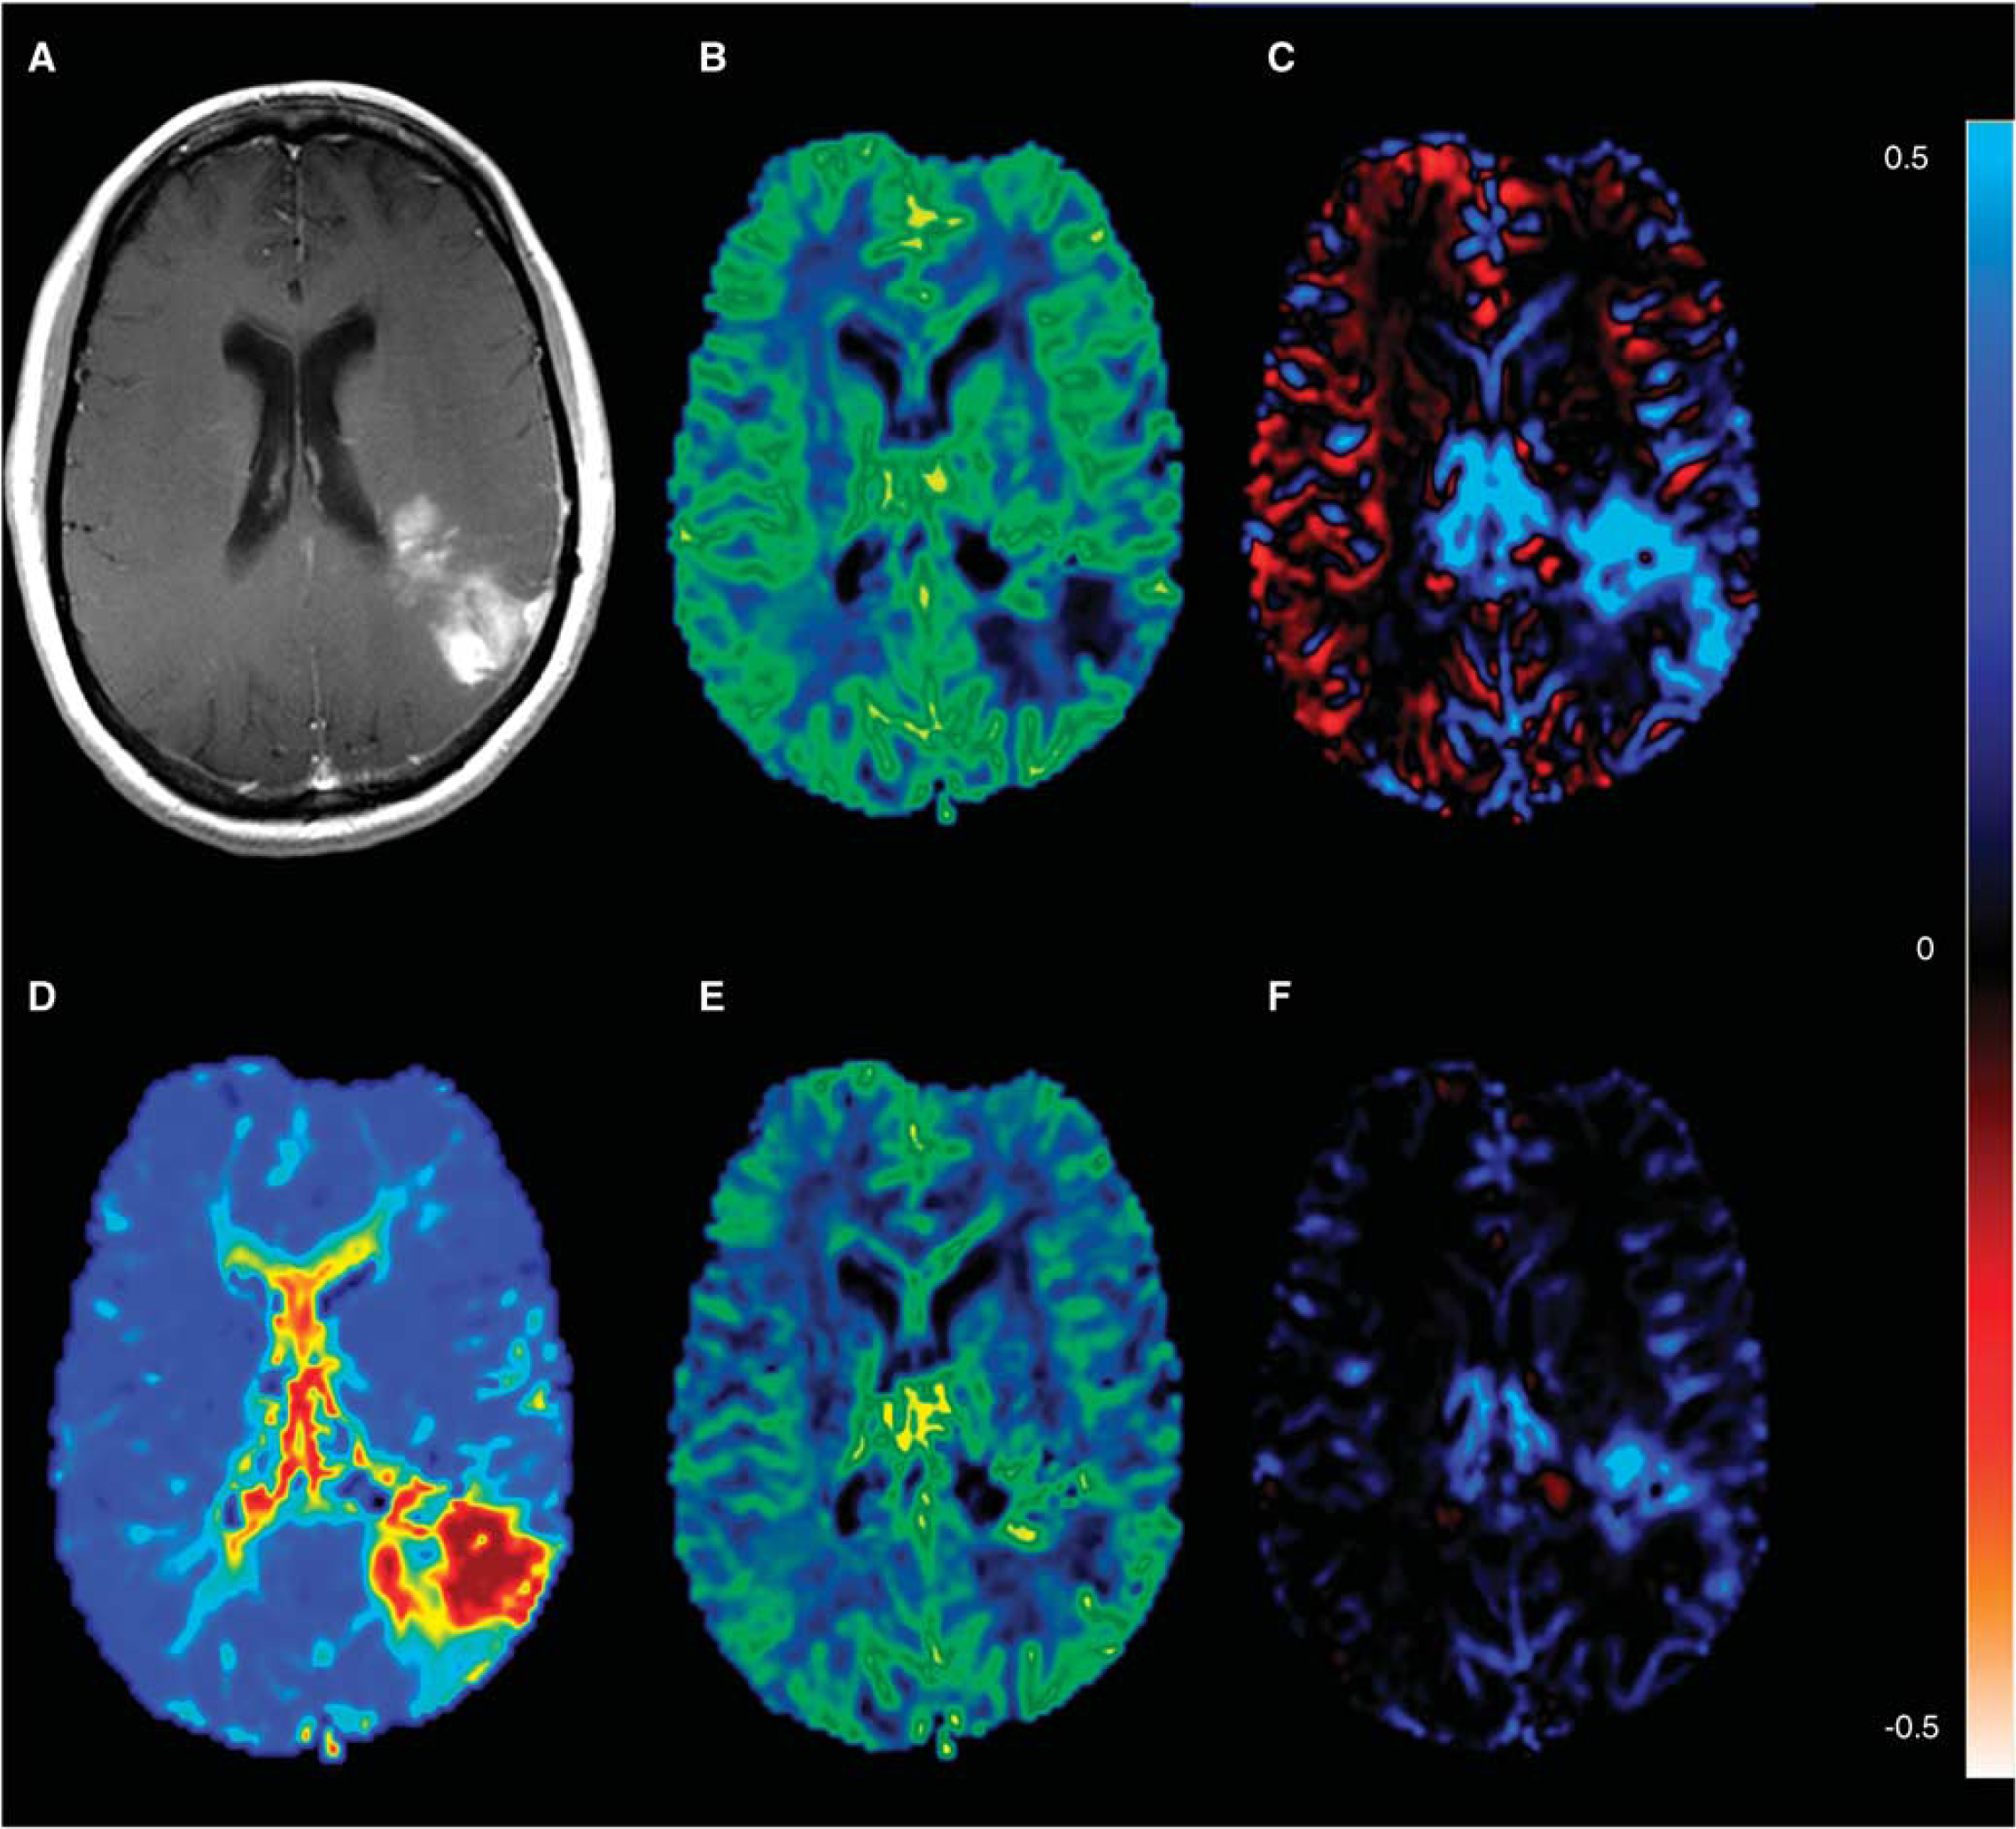
Results of the Ka and Ktrans comparisons are shown in Figure 2. For the patients as a group, the linear mixed model showed a significant relationship between increasing median Ka values and increasing Ktrans cohorts (P < 0.01). Conforming to the simulations in Part I, a borderline significantly higher goodness of fit (F-test; P = 0.05) was observed when fitting a quadratic polynomial curve to the data (smoothened) compared to using a linear fit; adjusted R2 = 0.95 (P = 0.001) versus adjusted r2 = 0.87 (P= 0.001), respectively. In 10 of 30 patient curves, a negative ‘dip’ was seen in the Ka values at low Ktrans values.
(
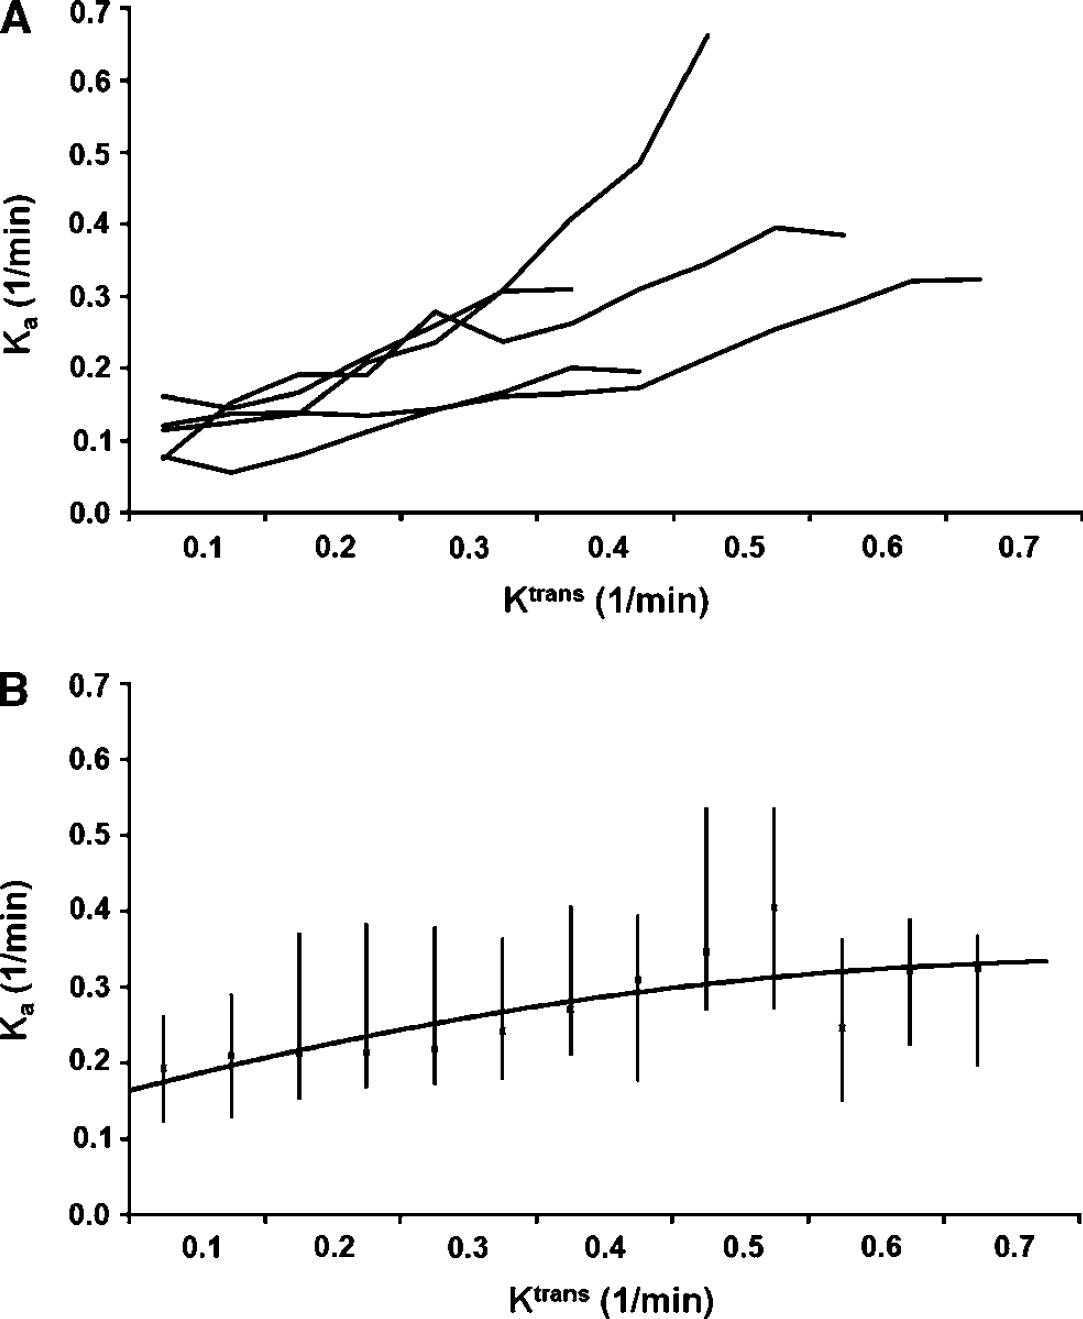
For method II, compared with baseline values, higher normalized CBV values were seen at day + 1 in patients with increased PFS (Spearman's rank: ρ = −0.54, P =0.002) and increased OS (ρ = −0.46, P =0.010). For Ka, borderline significantly higher histogram peak Ka values were observed at day + 1 in patients with increased PFS (ρ = −0.36, P = 0.053). For OS, higher Ka values were seen in patients with increased OS at day + 1 (ρ = −0.49, P =0.006). The median CBV and Ka values at the two time points are shown in Figure 3, separated into three groups according to median PFS and OS. For method I, higher normalized CBV values were seen at day + 1 in patients with increased PFS (Spearman's rank: ρ = −0.50, P =0.005) and OS (ρ = −0.53, P =0.003). For K2, there was no correlation between changes in K2 from baseline to day + 1 and PFS (ρ = −0.014) or OS (ρ = −0.092).
Median cerebral blood volume (CBV) and histogram peak Ka values using method II. The plots show median relative values (unitless) with 75% percentiles at day + 1 after treatment onset normalized to the baseline magnetic resonance (MR) examination values. The values have been sorted into three groups of 10 patients according to ascending progression free survival (PFS) and overall survival (OS). For both CBV and Ka, compared with the baseline MR examination, higher values were seen at day + 1 in patients with prolonged PFS and OS.
Figure 4 shows scatter plots of the relationship between logarithmic differences in patient-specific tumoral mean Ka and K2 values and quantitative mean MTT values at the baseline MR examination for T1- and T2*-dominant contrast agent extravasation, separately. For both T1- and T*2-dominant contrast agent extravasation, significantly larger discrepancies between the Ka and K2 values were observed for larger values of MTT (Spearman's rank: ρ = 0.47, P =0.01 and ρ = 0.46, P =0.01, respectively). There was no significant correlation between the logarithmic differences in CBV (SE images) for the two methods at baseline and MTT in tumor areas with T1- or T*2-dominant contrast agent extravasation.
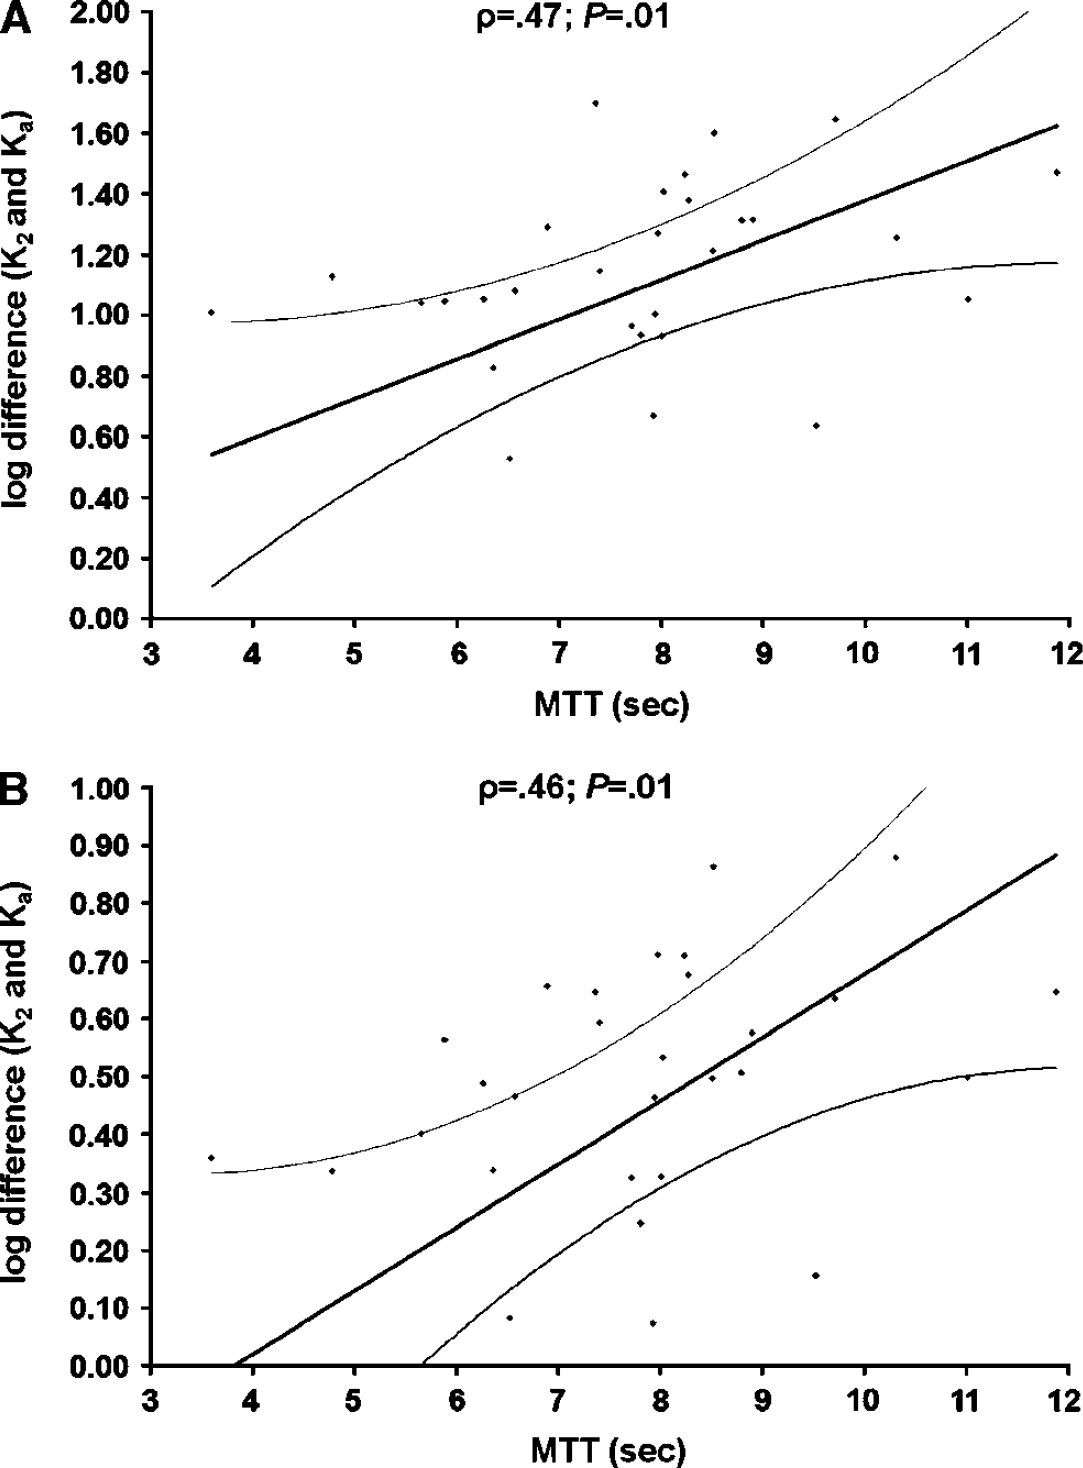
Scatter plots with linear regression (and 95% confidence intervals) showing the relationship between the logarithmic differences in patient-specific tumoral mean Ka and K2 values for T1-dominant (
Using equation 8, the VNI parameter correlated significantly with PFS using both methods I (Spearman's rank: ρ = 0.50, P =0.005) and II (ρ = 0.61, P< 0.001). A higher (positive) VNI value indicated prolonged PFS, whereas a lower (negative) VNI value indicated shorter PFS. The VNI parameters also correlated significantly with OS using method I (ρ = 0.55, P = 0.002) and II (ρ = 0.64, P<0.001). Similar to PFS, a higher (positive) VNI value indicated prolonged OS, whereas a lower (negative) VNI value indicated shorter OS. Scatter plots of the VNI parameter as a function of PFS and OS are shown for both methods in Figure 5. Conforming to the reference study (Sorensen et al, 2009), including values for circulating collagen IV levels in the VNI analysis, the correlation to PFS was improved for both methods (method I: ρ = 0.63 and method II: ρ = 0.67), whereas no improvement was observed for OS for either method.
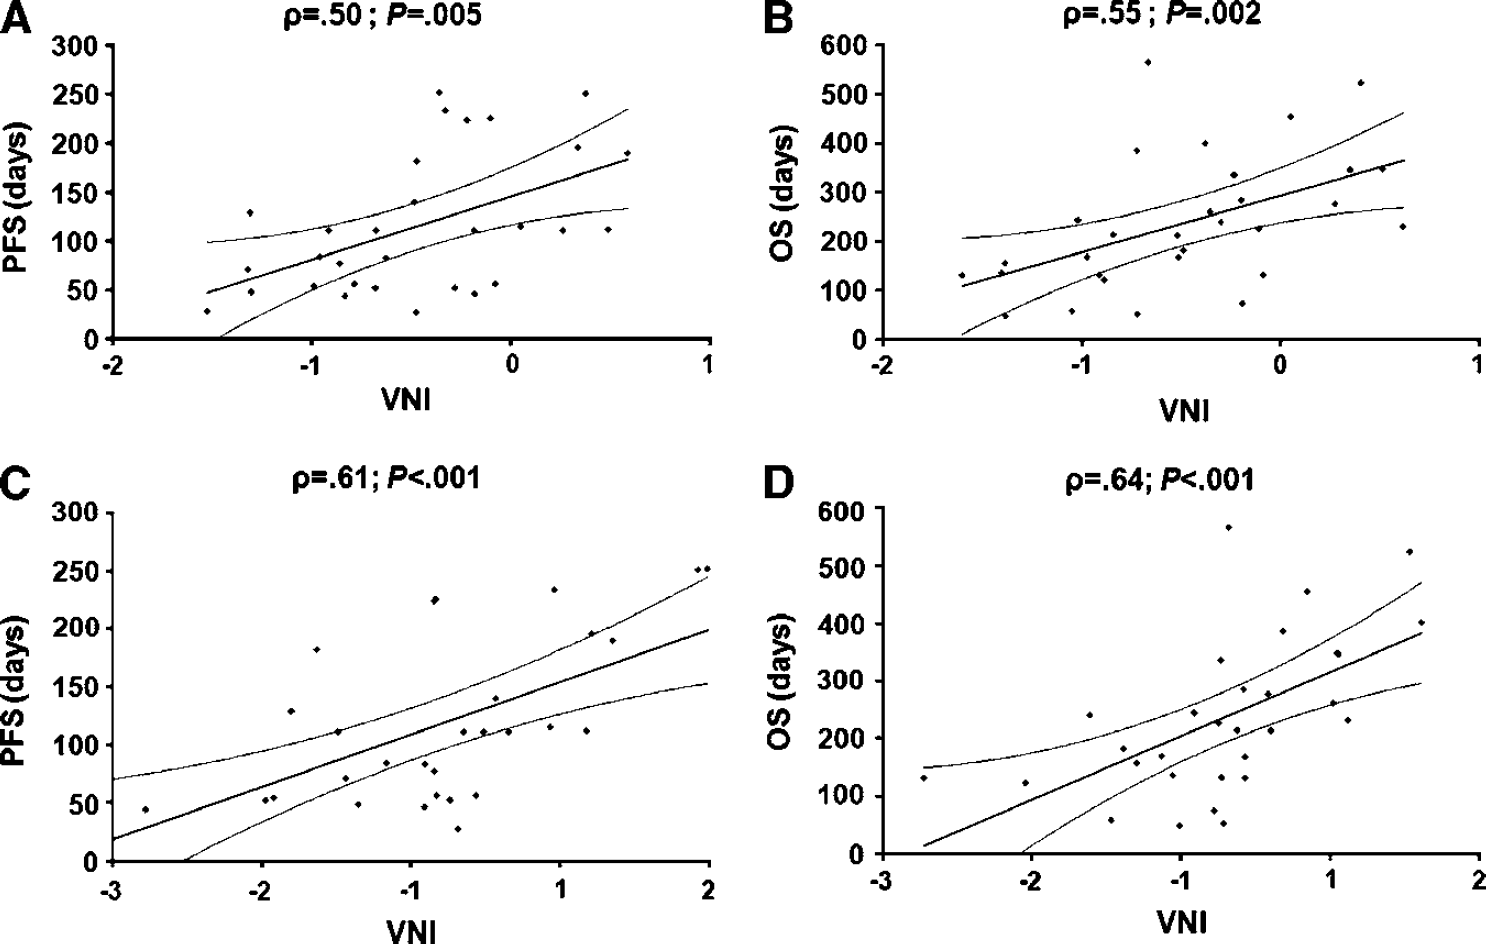
Scatter plots with linear regressions (and 95% confidence intervals) showing the relationship between the vascular normalization index (VNI) parameter and progression free survival (PFS) (
The Kaplan-Meier survival plots for the VNI parameters as a function of PFS and OS using both methods are shown in Figure 6. The log-rank values (Mantel-Cox) of the survival distributions for the ‘poor response’ and ‘good response’ groups for PFS were 12.442 (P < 0.001) and 7.259 (P =0.007) for methods I and II, respectively. The corresponding log-rank values of the survival distributions for OS were 2.864 (P = 0.091) and 14.803 (P < 0.001) for methods I and II, respectively.
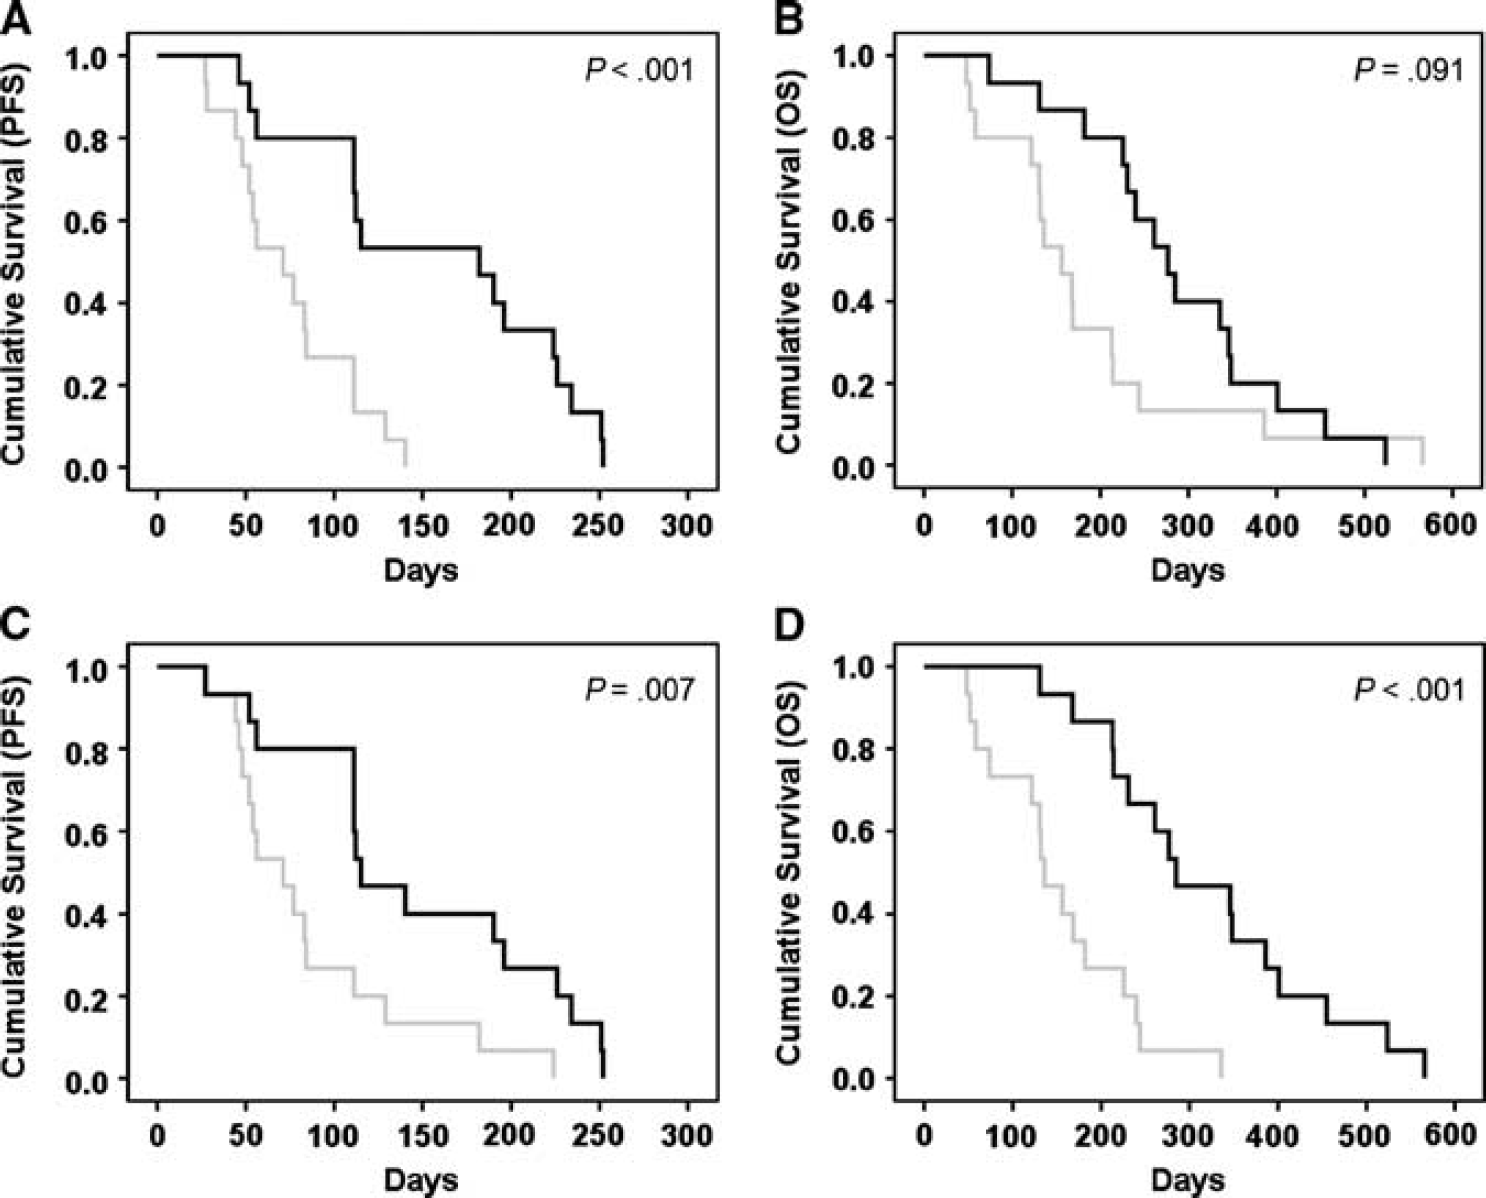
Kaplan–Meier survival curves using the vascular normalization index (VNI) parameter from method I (
Discussion
In our study, we have confirmed that the permeability changes after a single dose of anti-VEGF treatment are correlated with survival measures. We extend these earlier findings by exploring the performance of DSC-MRI rather than DCE-MRI, and by using automatic postprocessing routines. This more streamlined, T2*-based approach appears capable of predicting patient outcome after 1 day of anti-VEGF therapy, just as the dual T1- and T2*-based approach described earlier. As in the original VNI work (Sorensen et al, 2009), including circulating collagen IV levels further improved the correlation to PFS. With the potential to exclude DCE imaging and blood sampling from the analysis, however, MRI (DSC imaging ∼2 minutes) and postprocessing (Bseconds) times are reduced considerably.
Ktrans from DCE imaging is extensively used as an imaging marker for the characterization of glioma type and treatment effect (Tofts and Kermode, 1991; Roberts et al, 2000; Batchelor et al, 2007; Sorensen et al, 2009; Beaumont et al, 2009; Lacerda and Law, 2009). Furthermore, it has also been shown that values at the baseline magnetic resonance (MR) examination. For both T1- and T*2-dominant contrast agent extravasation, significantly larger discrepancies between the Ka and K2 were observed for larger values of MTT. cerebral perfusion, blood volume, and permeability can be simultaneously acquired from the DCE firstpass response and used to characterize gliomas (Li et al, 2003; Larsson et al, 2009). In one study (Li et al, 2003), this was performed by iterative separation of the intravascular and extravascular components of the contrast agent concentration contribution to the first-pass curves. In our study using a fully automated approach, DSC imaging was selected over DCE because optimal assessment of brain tissue hemodynamics from DCE imaging is dependent on correct estimates of T1 and reduction of T2* effects on the AIFs. Also, compared with DSC, DCE usually suffers from lower temporal resolution and spatial coverage. Nevertheless, contrary to DCE imaging, DSC-based measures of permeability have not received as much attention for tumor classification. Reasons for this might be the complexity of the analysis and that DSC-based permeability values are hard to quantify. Consequently, permeability estimates using DSC in the literature vary. One study reported differences in a Ktrans parameter between glioblastomas, meningiomas, and lymphomas by using first-pass pharmacokinetic modeling on the DSC images (Johnson et al, 2004). Using the same method, a second study reported good correlation between Ktrans from DCE and DSC in gliomas, whereas a third study reported poor correlation between Ktrans and glioma grade (Law et al, 2004; Cha et al, 2006). When comparing Ktrans from DCE and DSC in meningiomas, the correlation was poor (Cha et al, 2006). Furthermore, another study used the same method to successfully predict high glioma grade based on a combination of Ktrans and CBV (Law et al, 2006). Using method I, one study showed that the DSC-based K2 parameter could successfully differentiate between high- and low-grade gliomas, whereas another study did not observe this effect (Donahue et al, 2000; Provenzale et al, 2002). Also, similar to our study, K2 has been shown to be unsuccessful in predicting response (time to progression) of antiangiogenetic therapy in glioblastomas (Sawlani et al, 2010).
Results from the simulations in Part I and the patient data in Part II suggest a similar relationship between the DSC-derived Ka permeability parameter and Ktrans from DCE imaging. Using linear mixed model analysis on the patient data, median Ka values were found to increase significantly for increasing Ktrans cohorts. Furthermore, our results showed the Ka data tended to converge at higher values of Ktrans, resulting in a borderline significantly higher goodness of fit when using a quadratic polynomial function compared with that of a linear function. Thus, although the assumption of a linear relationship to Ktrans will be valid for most Ka values, care should be taken with high Ka values as our proposed DSC leakage correction model assumes a negligible reflux (KtranstN−1/ve<<1), which is not reasonable for high values of permeability. As discussed in more detail in Part I, this leads to an underestimation of Ka. Our group is currently working on a method that will assess and correct for this effect by applying a second linear fit to the tail of the residue function. Furthermore, even with the use of a 0.1-mmol/kg predose to minimize T1-dominant extravasation effects (Paulson and Schmainda, 2008; Hu et al, 2010), 10 of 30 patients showed a negative ‘dip’ in the Ka values at low Ktrans. As discussed in Part I, this might be explained by the predose not being able to remove all T1 effects in the MR signal in all patients. Here, it has been previously shown that the size of the loading dose needs to be sufficiently high (≥ 0.1 mmol/kg) for optimal tissue saturation (Donahue et al, 2000). Consequently, for the range of Ka (K2) values reported in our study, care should be taken when evaluating values close to zero. Potentially, at the cost of lower SNR, using a lower flip angle in the DSC imaging protocol should minimize this effect.
Nevertheless, our results showed Ka to be sensitive to anti-VEGF treatment effects and predictive of both PFS and OS. Thus, the Ka values obtained in our patient data suggest that DSC imaging can form the basis for a pseudo-leakage parameter that scales with tumor permeability and consequently patient prognosis. Using a histogram-based method (Emblem et al, 2008), more homogenous distributions of Ka values (comparable to a greater reduction in mean values) were seen at day + 1 in patients with increased PFS and OS. Compared to using mean values (assuming T2*-dominant leakage only), a higher correlation with PFS and OS was observed for both methods when using the histogram method (data not shown). Furthermore, compared to the reference study (Sorensen et al, 2009), a higher correlation with PFS and OS was observed for CBV using both methods. This is probably due to the use of a fully automated, user-independent analysis method including automatic AIF selection and partial volume correction (Bjornerud and Emblem, 2010). Interestingly, although the resulting CBV maps of the two methods can have clearly visible differences, our results suggest that the influence of the leakage correction method on predictive values of CBV to survival is relatively limited. Hence, when using CBV as the only parameter to assess tumor response to therapy, the choice of leakage correction method seems relatively unimportant. While this argument may not hold true for preoperative tumor grading, the high prognostic value of the CBV parameter to progression and survival during anti-VEGF treatment in our study seem to suggest that the dramatic changes in microvasculature blood volume reduce the influence of the leakage correction error. When including the Ka (K2) parameter in the analysis, however, choosing an MTT insensitive correction method can prove important as studies have shown that MTT increases with the higher vascular complexity associated with tumor angiogenesis (Bastin et al, 2006; Jain et al, 2007). This may be especially critical when assessing therapy-induced vascular normalization properties as anti-VEGF therapy in combination with radiation and chemotherapy kills or suppress cancer cells thereby normalizing tumor vascularity and potentially restoring impaired blood flow (Griffon-Etienne et al, 1999; Batchelor et al, 2007; Sorensen et al, 2009; Jain et al, 2009). Furthermore, the Kaplan-Meier curves suggest that the VNI parameter derived using method II is able to consistently identify patients that respond to anti-VEGF therapy and subsequently have longer PFS and OS. Using method I, however, the survival distributions for OS were not different for the ‘poor responding’ and ‘good responding’ groups. Although these results should be used with care and there may be more than one choice of survival distribution groups, our results indicate that the VNI parameter of method II holds a higher sensitivity to potential treatment effects to that of method I.
Whether the higher predictive values of the Ka parameter over K2 is because Ka is closer to a true measure of the permeability surface area product remains to be explored, but the correlation between the logarithmic differences in Ka and K2 and MTT suggests that K2 deviate from Ka at higher MTT values resulting in an overestimation of the K2 leakage effect, an argument also supported by the results from Part I of our study. This effect was observed for both T1- and T*2-dominant contrast agent extravasation. Contrary to Part I, however, there was no correlation between the logarithmic differences in CBV and MTT. This result is in line with the survival analysis discussed above, in that the Ka (K2) seem to hold a higher sensitivity towards changes in MTT compared with CBV. A reason for this might be that relative changes in CBV are modest compared with relative changes in Ka (K2). Nevertheless, it should be noted that this discrepancy between Parts I and II may in part also be explained by differences in sampling sizes between the two studies.
A potential limitation to method II is that an AIF needs to be identified. Although this is the focus of much research and debate (Rausch et al, 2000; Kiselev, 2001; Knutsson et al, 2004) selecting an optimal AIF with correct tissue density and large/small vessel hematocrit values can be difficult and further complicates the analysis compared with method I. However, to improve stability, we applied a recently published fully automatic method for AIF selection and partial volume correction (Bjornerud and Emblem, 2010). Furthermore, we minimized unwanted oscillations in the residue functions by employing a heavy computational iterative Tikhonov regularization-based SVD deconvolution method. Results from Part I of our study showed that the estimation of Ka is rather insensitive to oscillations and the use of a much faster truncated SVD approach should potentially have little influence on our results. Also, contrary to our simulations, an offset in Ka values for Ktrans values equal to zero was observed in our patient data. This may be explained by an incorrect nonzero estimation of Ka for low leakage values due to noise limitations. Thus, a better estimation of the residue function by fitting a Lorentzian function and a linear component to the data may reduce this systematic error. This relatively small error, however, should be uniform across patients and have minimal influence on our results.
In conclusion, we have shown that prognostic values of progression and survival in brain tumor patients undergoing anti-VEGF therapy can be assessed using a single MRI acquisition and automatic postprocessing routines insensitive to variations in MTTs. Our results are comparable to previous studies using more input data. The reduced complexity of the proposed method brings MRI one step closer to providing clinically feasible imaging biomarkers for monitoring early tumor response to treatment.
Footnotes
KEE received grant support from Norwegian Research Council, 191088/V50. AB is a consultant and on the advisory board of NordicNeuroLab AS, Bergen, Norway. RJHB received grant support from The Sigrid Juselius Foundation, the Instrumentarium Research Foundation, the Academy of Finland, the Paulo Foundation, and the Finnish Medical Foundation. TTB is a consultant and on the advisory boards of Vertex, Schering-Plough, Acceleron, Imclone, AstraZeneca, Roche/Genentech, and Amgen and received grant support from Takeda-Millennium, AstraZeneca, and Pfizer. RKJ received grant support from AstraZeneca, Dyax, and MedImmune and is a consultant and on the advisory boards of Astellas-Fibrogen, Dyax, Genzyme, Morphosys, AstraZeneca, Noxxon Pharma, Regeneron, and SynDevRx. AGS received grant support from National Cancer Institute and National Institutes of Health and is a consultant and on the advisory boards of ACR-Image Metrix, BayerScheringPharma, Bristol Meyers Squibb, BiogenIdec, Merrimack Pharmaceuticals, Olea Medical, Mitsubishi Pharma, GE Healthcare, Regeneron, Novartis, Roche, Siemens Medical, Takeda, AstraZeneca, National Institutes of Health, and Kit, Inc.