
Abstract
Perfusion imaging is crucial in imaging of ischemic stroke to determine ‘tissue at risk’ for infarction. In this study we compared the volumetric quantification of the perfusion deficit in two rat middle-cerebral-artery occlusion (MCAO) models using two gadolinium-based contrast agents (P1152 (Guerbet) and Magnevist (Bayer-Schering, Pittsburgh, PA, USA)) as compared with our well established continuous arterial spin labeling (CASL) perfusion imaging technique. Animals underwent either permanent MCAO or transient MCAO with 80-min reperfusion. Imaging was performed at four different time points after MCAO. A region-of-interest (ROI) analysis of the subregions of the ischemic zone (core, penumbra, transient reversal (TR), and sustained reversal (SR)) using P1152 showed significant reduction in blood flow in the core and TR subregions relative to the penumbral and SR subregions while occluded. After reperfusion, a significant increase in blood flow was recorded at all time points after reperfusion in all regions except TR. From the ROI analysis the threshold for the penumbra was determined to be −62±11% and this value was subsequently used for quantification of the volumetric deficit. The ischemic volume as defined by dynamic susceptibility contrast (DSC), was only statistically different from the CASL-derived ischemic volume when using Magnevist at post-reperfusion time points.
Introduction
With magnetic resonance imaging (MRI), the ischemic penumbra can be approximated as the mismatch between the volume of the perfusion deficit and the volume of ischemic tissue injury as measured by apparent diffusion coefficient (ADC) mapping (Bardutzky et al, 2007; Meng et al, 2004). The characterization of this mismatch has implications clinically for identifying patients who may respond to acute therapies (Fisher, 2006). Preclinical models of ischemic stroke in rats have shown that areas of penumbra ultimately are destined to become infarcted tissue without intervention (Bardutzky et al, 2007; Carano et al, 2000; Henninger et al, 2006).
The perfusion deficit can be characterized by using a number of different methodological approaches. In one approach, an exogenous contrast agent, typically gadolinium (Gd)-based, is injected intravenously and flows through the capillary system of the brain parenchyma (Schlaug et al, 1999). The presence of the agent causes a concentration-based change in both the longitudinal and transverse relaxation rates. Commonly, a dynamic single-shot gradient echo sequence is performed to measure the contrast-induced magnetic susceptibility (T2*) changes over time, which has been termed dynamic susceptibility contrast (DSC). These data can be used to define cerebral blood volume (CBV) and mean transit time (MTT), which can be combined to construct the cerebral blood flow (CBF) as a function of voxel position (Gall et al, 2009). Quantification of the parameters is only possible when an arterial input function can be measured (Hofmeijer et al, 2005).
In a second approach, the proton spins in the blood are magnetically labeled with a technique known as arterial spin labeling (ASL) (Williams et al, 1993). In the typical ASL imaging sequence, the flowing spins in the blood are inverted or saturated. The contrast is produced as the magnetically labeled spins replace unlabeled spins in the cerebral vasculature, typically causing reduction of signal in the areas of blood flow. This image is then subtracted from a control image in which labeling of the blood has not occurred. While a variety of methods exist to perform ASL, continuous ASL (CASL) has been well validated by our group in preclinical ischemic stroke models (Bardutzky et al, 2007; Henninger et al, 2006; Henninger et al, 2009; Meng et al, 2004). Preclinically, both contrast and ASL-based MR perfusion measurements are used. While thresholds have been derived to determine hypoperfused tissue for the CASL perfusion method, minimal work has been performed to derive such a threshold for the contrast-enhanced perfusion method (Shen et al, 2003). Further, a comparison of the two methods for determining the regions of hypoperfusion has not been performed. Therefore, in this study we examined perfusion deficits in permanent (pMCAO) and transient (tMCAO) middle-cerebral-artery occlusion models in rats using both the contrast-enhanced and CASL methods of perfusion MRI. Changes in CBF in ischemic stroke subregions as well as volumetric analysis of the perfusion deficit were determined. Based on CASL perfusion measurements, ADC mapping, and histology, we derived a contrast perfusion-based threshold for identifying tissue at risk for ischemia and further measured relative CBF (rCBF) in ischemic subregions.
Materials and methods
All procedures used in this study were performed in accordance with our institutional guidelines. Spontaneously breathing male Wistar rats (n = 20; Taconic Farms, Hudson, NY, USA) weighing 300 ± 30g were anesthetized with isoflurane (5% for induction, 2% for surgery, 1.2% for maintenance) in room air. PE-50 polyethylene tubing was inserted into the femoral artery and vein. The femoral artery was used for monitoring the mean arterial blood pressure and blood gases (pH, PaO2, PaCO2), electrolytes (Na+, K+, Ca2+), and plasma glucose levels. The femoral vein was used for intravenous bolus injection of the contrast agent. Body temperature was monitored continuously with a rectal probe and maintained at 37.0 ± 0.3°C with a thermostatically controlled heating pad.
Middle Cerebral Artery Occlusion
Suture MCAO was performed as previously described in detail (Koizumi et al, 1986). Ten animals were subject to pMCAO using 4-0 silicone-coated nylon filament sutures, and 10 to tMCAO using the in-bore reperfusion technique where the rats were mechanically reperfused by withdrawing the occluder at 80 mins after MCAO while the animal was in the magnet (Li et al, 1998). On the day of the experiment, rats were randomly assigned to receive either temporary or permanent MCAO. Further, data analysis was performed by an author masked to the occlusion type and time point.
DSC Properties
In this study, P1152 (Guerbet, Roissy Charles-de-Gaulle, France) and Magnevist (Bayer-Schering, Pittsburgh, PA, USA) were used for DSC measurements. P1152 (Guerbet) is an investigational small-molecular-weight Gd chelate compound with r1 longitudinal and r2 transverse relaxivities of 11.7 and 13.8 mmol/L/s in water at 0.5 T, respectively. These values are significantly higher than those reported for conventional Gd chelates such as Gd–DTPA (Magnevist) or Gd–DOTA (Dotarem) (Laurent et al, 2006). P1152 does not display any protein binding and shows a similar pharmacokinetic profile as Dotarem in anaesthetized rats with a blood half-life of 50 ± 7 versus 38 ± 2 mins, a blood clearance of 6.9 ± 0.6 versus 8.4 ± 0.8 ml/min/kg, and a distribution volume of 322 ± 27 versus 293 ± 6 ml/kg for both contrast agents respectively (unpublished Guerbet data). Magnevist and Dotarem are standard Gd chelates with comparable blood pharmacokinetics (Berlex, 2005; Corot et al, 2000).
Experimental Protocol
All 20 rats were imaged at the same time points (30, 60, 90, 120, 150, 180, and 210 mins) after MCAO. ADC and CBF maps derived from CASL were recorded at each imaging time point. For DSC, a contrast agent (P1152) was injected over ∼1 s at a dose of 0.1mmol/kg followed by a saline bolus chaser (n = 12). DSC data were acquired every hour starting at 30mins (30, 90, 150, and 210mins). DSC data were also acquired in a subgroup of animals using Magnevist at a dose of 0.1 mmol/kg (n = 8). At 24 h after MCAO, brains were removed and sectioned coronally into seven 1.5-mm thick slices corresponding to the MR slices and stained with 2,3,5-triphenyltetrazoliumchloride. All histological analyses were conducted by an author who was masked to the experimental protocol.
MRI Measurements
Magnetic resonance imaging experiments were performed with a 4.7-T/400-mm horizontal magnet equipped with a Biospec Bruker console (Billerica, MA, USA), and a 2.0-G/mm gradient insert (inner diameter = 120 mm, rise time = 120 μs). A surface coil (inner diameter = 23 mm) was used for brain imaging with an actively decoupled butterfly neck coil for carotid blood spin labeling. Three diffusion-weighted images were separately acquired with diffusion-sensitive gradients applied along the x, y, or z direction. Single-shot, spin-echo, echo-planar images were acquired over 2.5 mins with a matrix size of 64 × 64, spectral width of 200 kHz, repetition time 2 secs (90 degree flip angle), echo time (TE) 37.5 ms, b = 8 and 1,300 s/mm2, Δ = 24 ms, δ = 4.75 ms, field of view 25.6 × 25.6 mm, seven 1.5-mm slices, and 16 averages. Quantitative CBF measurements were made using the CASL technique with single-shot, gradient-echo, echo-planar image acquisition. Sixty paired images (for signal averaging) were acquired over 4 mins, alternately, one with and the other (control) without spin labeling preparation. The MRI parameters were similar to ADC measurements except that TE was 13.5 ms. The labeling pulse used a 1.78-s, square radiofrequency pulse in the presence of 1.0G/cm gradient along the flow direction. The sign of the frequency offset was switched for non-labeled images. DSC measurements were performed using an echo-planar, gradient-echo imaging sequence with a repetition time of 1 s, TE of 15 ms, and flip angle of 90 degrees. The field of view was 25.6 mm × 25.6 mm with a matrix size of 64 × 64. Ten dummy scans were conducted to reach steady state and contrast injection was performed after 25 acquisitions.
Apparent Diffusion Coefficient and Quantitative CBF Mapping
Diffusion-weighted and CASL perfusion images were analyzed using QuickVol II (http://www.quickvol.com/). Quantitative CBF and ADC maps, and their corresponding threshold-derived lesion volumes, were calculated as described previously (Shen et al, 2003). The thresholds used to define respective abnormal ADC and CBF regions were a reduction to 0.53 × 10⁻³ mm2/s and reduction of 57 ± 11%, as previously validated (Shen et al, 2003).
Derivation of ROIs
Four subregions in the ischemic zone were investigated. To locate these regions, ADC and CASL maps were compared with24-h histology by co-registration of the imaging-derived pixels on the corresponding triphenyltetrazoliumchloride pixels. The ischemic core was defined as abnormal by the previously validated threshold on the ADC maps and infarcted tissue on the 24-h histology. The penumbra was defined as abnormal on the CASL map using the previously validated threshold, but was not abnormal on the ADC map at 30 mins after MCAO. Transient and sustained reversal (TR and SR) were both regions with a deficit on the ADC map at 30 mins, but with normalization of that region on the ADC map after reperfusion. In the SR region, the 24-h histology did not show infarction, whereas in the TR region the 24-h histology did show infarction. TR and SR were only found in the tMCAO group. A graphical description of the four regions of interest (ROIs) is presented in Supplementary Figure 1. The ROIs were manually outlined based on the criteria described above using QuickVol II.
Derivation of rCBF From DSC Data
Curves from contrast-enhanced perfusion images and ROI data were fit to a modified gamma variate, which allows for simplified fitting of first-pass data implemented using Mathwork's Matlab software (Madsen, 1992). Briefly, the first pass of a bolus contrast can be described as a gamma variate function defined as follows:
where α and β are shape and scale parameters, and A is the amplitude of the change in bolus concentration (Madsen, 1992). While fitting DSC to this equation can be performed using non-linear techniques, Madsen (1992) describes a method in which the equation can be linearized to allow for more simplified fitting. The gamma variate fit allowed for determination of the relative CBV (rCBV), and relative MTT (rMTT), which were used to construct the rCBF maps as follows:
where ΔR*2 is the change in transverse relaxation rate and t is the time after bolus arrival. The term relative indicates that deconvolution with an arterial input function was not performed (Hofmeijer et al, 2005). rCBF values were reported as percent changes in rCBF between the ipsilateral and contralateral regions as previously described (Gall et al, 2009). A threshold for ischemic tissue was derived by averaging the rCBF in the penumbral area at all time points in the pMCAO group and at the 30-min time point in the tMCAO group. Volumetric analysis of rCBF-based perfusion deficit was identified by a combination of the derived threshold and visual inspection.
Statistical Analysis
Data are presented as mean ± standard deviation unless otherwise indicated. Statistical comparisons were performed using analysis of variance with post hoc Bonferroni test, Mann–Whitney U, and Wilcoxon signed-rank test, where appropriate. Calculations were performed using SPSS (v15.0, Chicago, IL, USA). P < 0.05 was considered significant.
Results
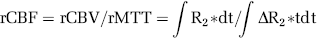
There were no between-group differences with regard to physiological parameters (mean arterial blood pressure, blood gases, electrolytes) (data not shown). To illustrate a typical pMCAO and tMCAO animal, representative images of each image modality (ADC, CASL, DSC) and histology are presented in Figure 1.
Representative images of an (
Region of Interest Analysis
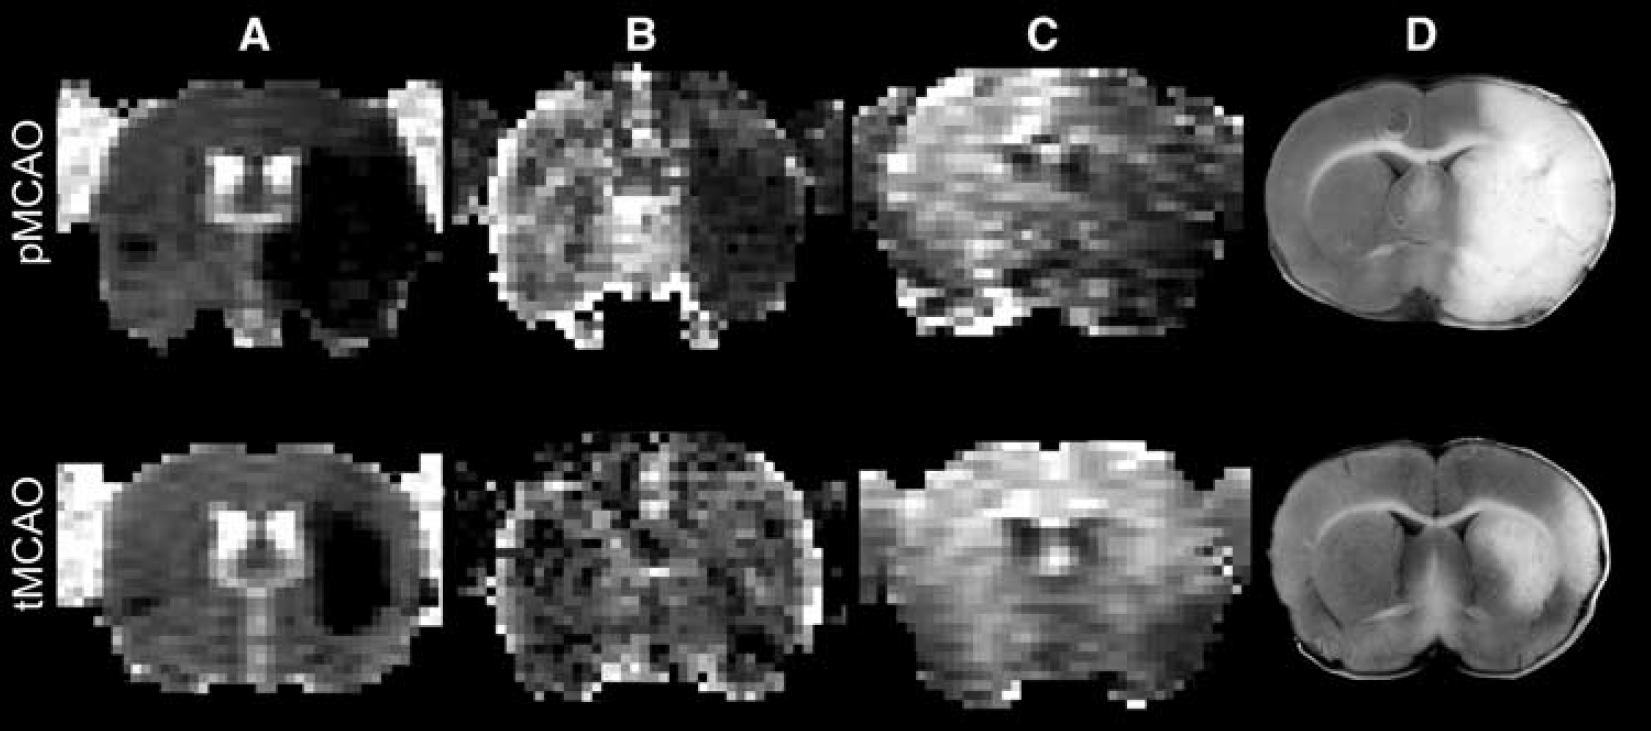
An ROI analysis was performed to characterize the temporal changes in the ischemic subregions (core, penumbra, TR, SR). Based on the DSC imaging with the contrast agents, rCBF data were derived from each of the subregions (see Figure 2). In animals subjected to pMCAO, rCBF in the ischemic core and penumbra was depressed. This observation persisted over all time points. In the tMCAO group, significant increases in rCBF were found at all time points after reperfusion as compared with that in the pre-reperfusion time point for both core and penumbra regions. The post-reperfusion time points had also significantly increased rCBF as compared with the same time points in the pMCAO model. A significant increase in rCBF was also found between pre- and post-reperfusion time points in the SR region. Interestingly, although not statistically significant, the TR region showed large increases in rCBF after reperfusion. Statistical differences in rCBF were also found between the four subregions. Core and TR regions were found to have significantly lower rCBF as compared with the penumbra and SR region at the initial time point (see Table 1). Based on DSC-derived penumbral blood flow using P1152 during ischemia, an rCBF threshold of −62 ± 11% was derived.
Time course of rCBF differences between the ipsi- and contralateral side in the (
Significance levels in ischemic subregions during occlusion of animals subjected to MCAO
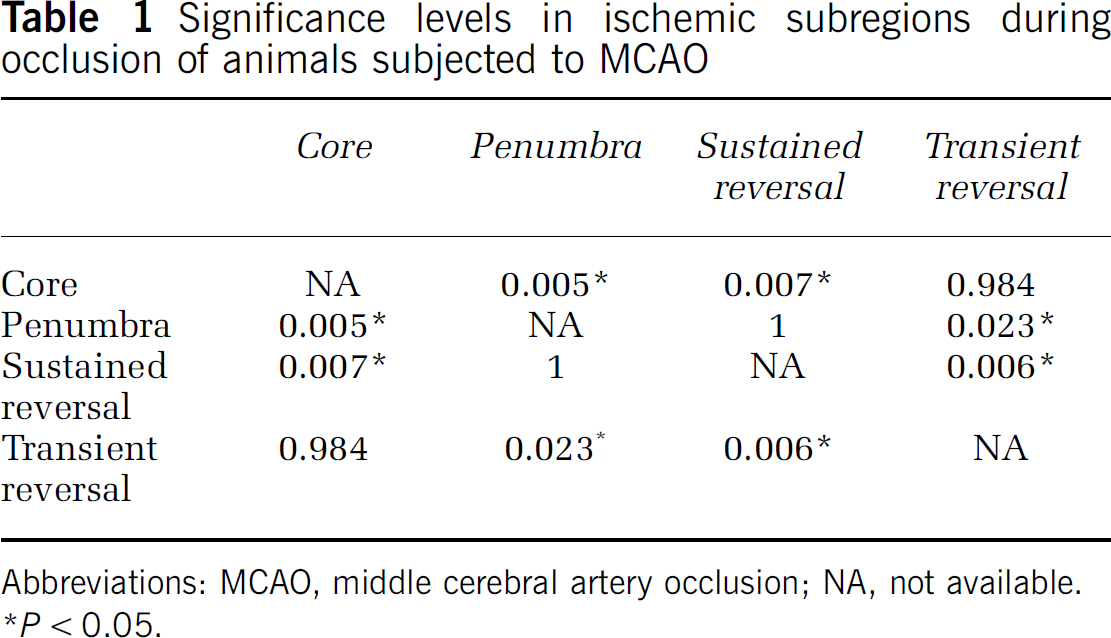
Abbreviations: MCAO, middle cerebral artery occlusion; NA, not available.
P < 0.05.
Spatiotemporal Evolution of the Perfusion Modalities
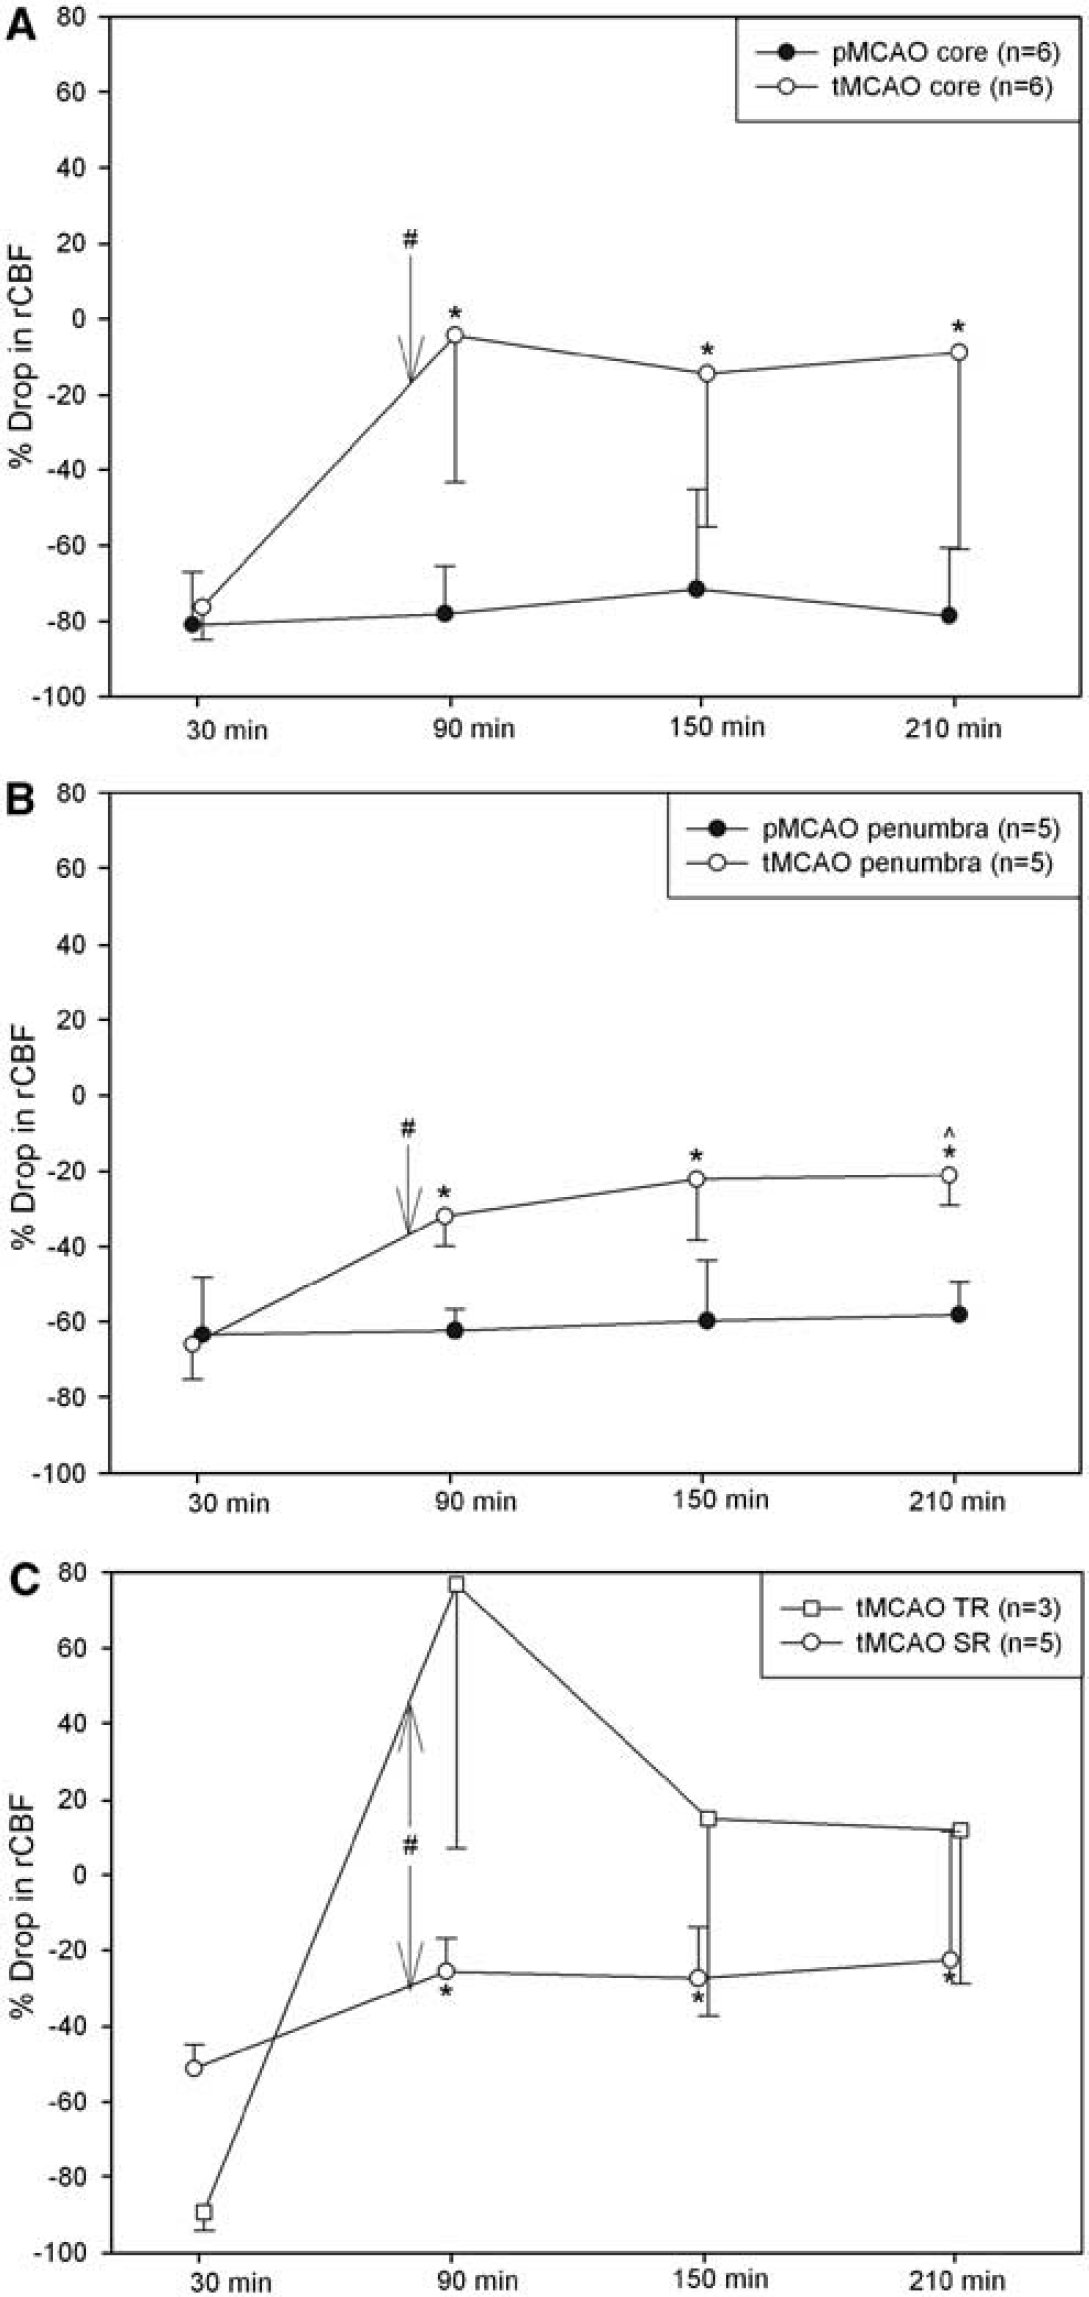
Figure 3A shows perfusion lesion volume evolution over time for CASL and P1152-derived DSC measurements in the pMCAO and tMCAO models. At each time point, no statistically significant volumetric difference was found between the perfusion lesion volume measured by CASL and contrast perfusion-based rCBF as measured by P1152. As expected, in the pMCAO model, the volume of the perfusion deficit remained constant as shown by both the CASL and DSC techniques. As expected, the perfusion lesion volume in the tMCAO model revealed a large initial deficit with a rapid decrease after the 80-min reperfusion. This decrease in hypoperfused volume was statistically significant as compared with the pMCAO time point for both CASL and P1152.
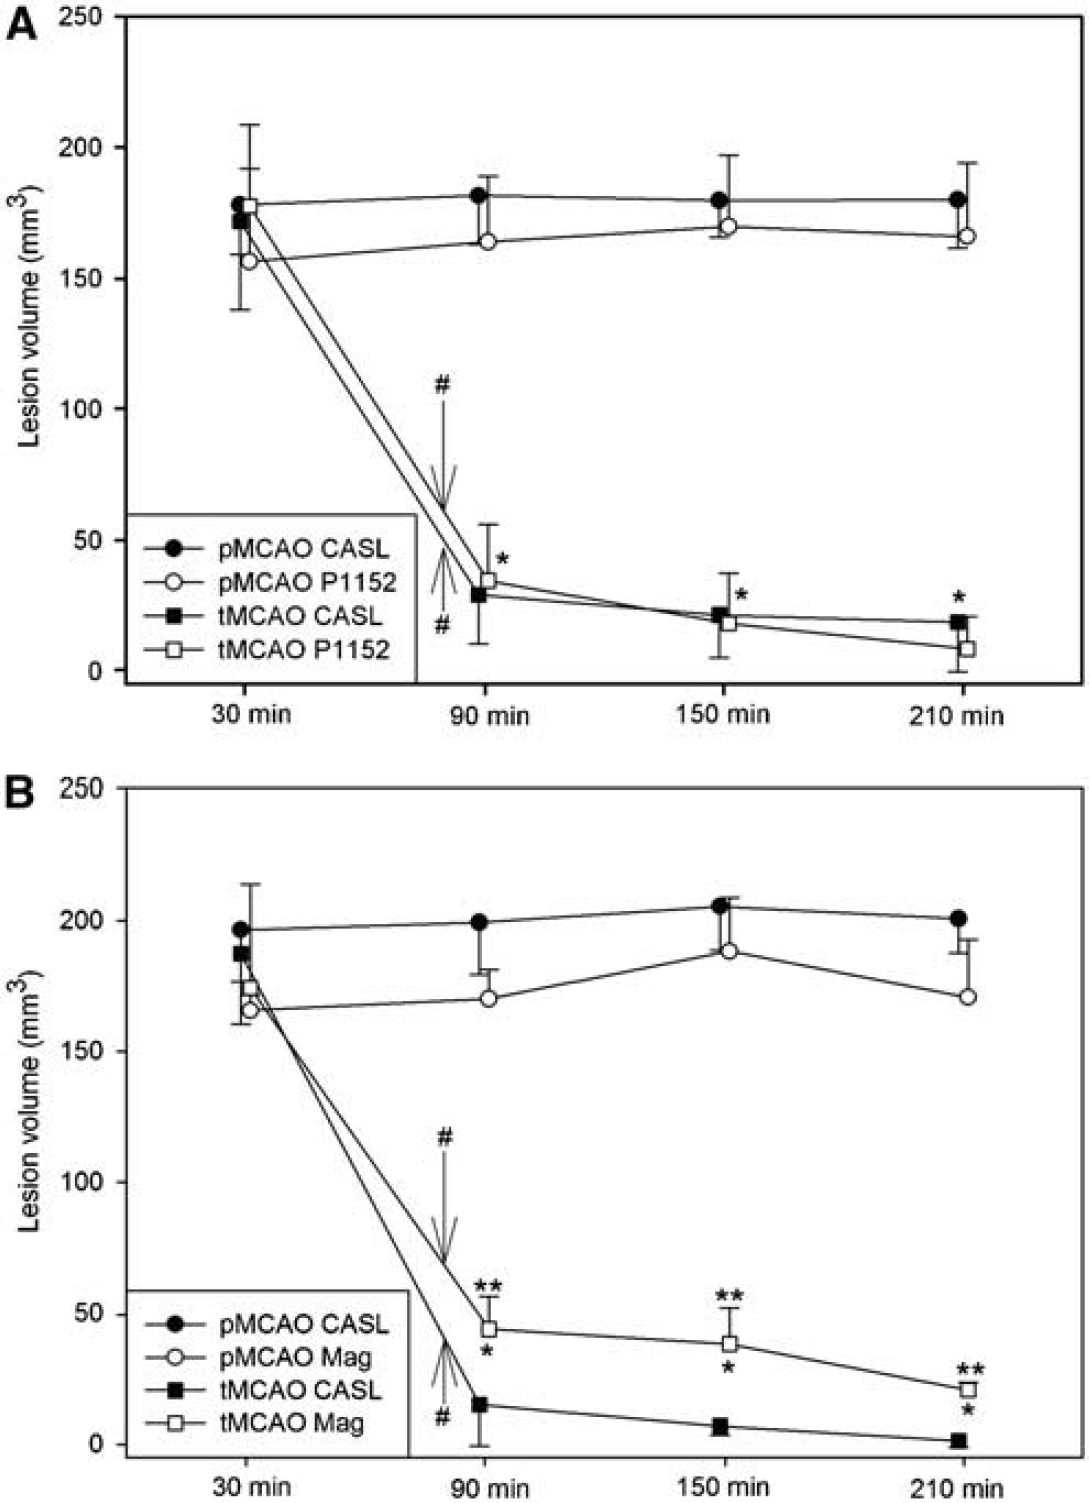
Volumetric analysis of the perfusion deficits in the pMCAO and tMCAO model. (
To evaluate the generalizability of the P1152 DSC-derived perfusion data, perfusion measurements were performed in a group of animals with Magnevist and CASL. Similar to the results obtained with P1152, no statistical significant differences were found between the perfusion lesion volumes as measured by CASL and Magnevist DSC in animals subjected to pMCAO. However, the lesion volumes were significantly overestimated by Magnevist DSC in tMCAO animals as compared with CASL after reperfusion. The perfusion deficit derived from Magnevist DSC showed a similar temporal perfusion lesion volume evolution as that with P1152 (see Figure 3B).
Discussion
Our results presented here show that DSC-based relative perfusion measurements can potentially be used to monitor different regions of ischemic tissue in a preclinical model of stroke. Our results characterizing the time course of rCBF in ischemic subregions in both transient and permanent MCAO models of stroke are consistent with previously published results on spatiotemporal changes in blood flow as measured by CASL (Bardutzky et al, 2005b; Bardutzky et al, 2007; Henninger et al, 2006).
Results from animals subjected to tMCAO showed statistically significant increase in rCBF in areas of the core and penumbra as compared with pre-reperfusion values. Areas of SR and TR also showed increase in blood flow from pre-reperfusion time points. The increase in rCBF as measured by P1152 in areas of SR after reperfusion reached significance; however, areas of TR did not show any increase. Lack of statistical significance may be due to the relatively small number of animals available displaying areas of TR and to the high inter-animal variability of the data.
Our results are consistent with previous work. For animals subjected to 35 mins of MCAO followed by reperfusion, Bardutzky et al (2007) reported that pixels, which were characterized as being in the ischemic core during occlusion, experienced increase in rCBF after reperfusion. Despite different ultimate tissue fate, blood flow restoration was similar for each identified subregion (core, penumbra, SR, TR). This is similar to our results with the exception of the TR region where blood flow is more heterogeneous and tends to have a large initial overshoot in rCBF recovery followed by a decline. In penumbral regions, we showed moderate increase after reperfusion that leveled off at later time points. This is also similar to the results reported by Bardutzky and co-workers.
Interestingly, the initial values of rCBF for areas of SR were higher than those for TR. We also observed that penumbral regions had significantly higher rCBF than both core and areas of TR. While a number of factors play a role in the recovery of tissue after ischemia, the amount of remaining perfusion certainly plays a major role in tissue preservation (Bardutzky et al, 2007). Our data suggest that careful analysis of the blood flow in the ischemic region as defined by ADC suppression may provide clues as to the extent of infarction recovery on recanalization.
Based on our ROI analysis, we were able to derive a threshold value of −62 ± 11% for the determination of ischemic tissue based on DSC-derived rCBF. This threshold is slightly lower than the established threshold of a 57 ± 11% reduction of CBF for ischemic tissue as derived by CASL (Shen et al, 2003). This difference may be explained by the fact that quantitative CBF measurements in ASL techniques are highly dependent on the transit time of the labeled spins. Longer transit time, as is the case in ischemic stroke, causes longitudinal relaxation of the spins and may lead to underestimation of the blood flow in regions of low flow. Further, gradient echo-based DSC measurements have been shown to overestimate the blood flow in areas of large vessels (Carroll et al, 2002). Given the spatial resolution, it is likely that some cerebral parenchyma voxels are partial volume averaged with large vessels. This would serve to increase the magnitude of the rCBF reduction between ischemic and normal tissue. Nevertheless, the threshold derived here for rCBF measurements can be used for quantitative analysis of the volumetric perfusion deficit in experimental stroke models. The derived threshold should be considered in light of the experimental technique used to acquire the data set. Contrast administration methodology and MR imaging parameters such as recovery and echo times can affect the derived threshold. Laboratories attempting to undertake contrast-based MR perfusion measurements as the main modality for determining perfusion deficit in preclinical stroke models are encouraged to derive thresholds relevant to their contrast administration and imaging techniques.
Our DSC-based volumetric analysis of the perfusion lesion in pMCAO and tMCAO models of stroke correlates well with the previously validated CASL volumetric analysis. Moreover, there was no statistically significant difference between the volumetric analysis derived by DSC using P1152 and CASL. The volumetric measurements as derived by DSC matched well with the time course defined previously (Bardutzky et al, 2005a; Bardutzky et al, 2007; Meng et al, 2004). While results demonstrated a similar temporal evolution of lesion volume between Magnevist- and P1152-derived measurements, Magnevist-derived data overestimated the perfusion deficit as compared with CASL in animals subjected to tMCAO. This is not entirely unexpected as areas on the border of tissue that remained ischemic and tissue that is fully reperfused may not be well characterized by Magnevist as compared with P1152 due to its lower relaxivity.
These results lend credence to the use of DSC with P1152 to evaluate penumbral lesion volume in preclinical models of ischemic stroke. Although CASL offers many advantages over DSC-based perfusion measurements, it suffers from more complex implementation from a hardware perspective. Transit time in normal rats from the spin labeling location (i.e., carotid arteries) to the brain parenchyma is rapid on the time scale of the longitudinal recovery rate of the blood magnetization. This is not the case in ischemic stroke where the transit time is increased (Hofmeijer et al, 2005). We have shown that contrast perfusion can be used to accurately measure the perfusion deficit in stroke. Due to its ease of implementation and the wide availability of contrast materials, it represents a viable alternative to CASL imaging in stroke in rats and perhaps clinically for perfusion deficit volume measurements. One of the main weaknesses of contrast-enhanced methods from an imaging point of view is contrast retention in the blood causing (1) a second-pass phenomenon and (2) a lack of rapid repeatability of perfusion measurements (Keston et al, 2003). The impact of the first issue has been addressed by fitting the data to a gamma variate function. This data set can be fit using non-linear least-square fitting to a gamma variate model. Alternatively, a simplified form of the gamma variate, which was used in this study, allows for linear fitting of the data. One difficulty that has been pointed out for both approaches is the identification of the bolus arrival time, which can be particularly problematic in regions of low blood flow where the bolus arrival time may be indistinguishable from the baseline data. Automated detection schemes have been proposed to find the arrival time, but all require clear delineations between the trend of the baseline and the bolus (Cheong et al, 2003).
It is interesting to note that we were able to conduct these experiments using the same molarity per kilogram body weight of P1152 and Magnevist as typically administered in clinical procedures for standard contrast agents. In other similar animal studies, double and triple doses of Magnevist and other compounds are administered to be able to adequately characterize the rCBF (Hofmeijer et al, 2005; Schepers et al, 2004).
A limiting factor for the ROI analysis is the small number of tMCAO animals that had TR regions that could be analyzed. The analysis of the TR and SR regions was not the primary goal of this study and should, therefore, be considered exploratory.
Conclusion
In this investigation, we have shown that MRI paramagnetic contrast agent-based perfusion measurements reveal different blood flow changes within ischemic subregions. Further, we showed that ischemic lesion volume determination based on contrast perfusion measurements was not different as compared with CASL-derived ischemic region volumes. High relaxivity contrast agents like P1152 may be more appropriate for measuring blood flow in certain ischemic subregions.
Footnotes
References
Supplementary Material
Please find the following supplemental material available below.
For Open Access articles published under a Creative Commons License, all supplemental material carries the same license as the article it is associated with.
For non-Open Access articles published, all supplemental material carries a non-exclusive license, and permission requests for re-use of supplemental material or any part of supplemental material shall be sent directly to the copyright owner as specified in the copyright notice associated with the article.