
Abstract
Dynamic susceptibility contrast (DSC)-based perfusion analysis from MR images has become an established method for analysis of cerebral blood volume (CBV) in glioma patients. To date, little emphasis has, however, been placed on quantitative perfusion analysis of these patients, mainly due to the associated increased technical complexity and lack of sufficient stability in a clinical setting. The aim of our study was to develop a fully automated analysis framework for quantitative DSC-based perfusion analysis. The method presented here generates quantitative hemodynamic maps without user interaction, combined with automatic segmentation of normal-appearing cerebral tissue. Validation of 101 patients with confirmed glioma after surgery gave mean values for CBF, CBV, and MTT, extracted automatically from normal-appearing whole-brain white and gray matter, in good agreement with literature values. The measured age- and gender-related variations in the same parameters were also in agreement with those in the literature. Several established analysis methods were compared and the resulting perfusion metrics depended significantly on method and parameter choice. In conclusion, we present an accurate, fast, and automatic quantitative perfusion analysis method where all analysis steps are based on raw DSC data only.
Introduction
Dynamic susceptibility contrast (DSC) perfusion magnetic resonance (MR) imaging (MRI) is a relatively new technique to characterize brain tumors and in particular gliomas. Analysis of relative cerebral blood volume (rCBV) is used to differentiate low-grade from high-grade gliomas (Covarrubias et al, 2004) and to assess patient prognosis and tumor progression (Law et al, 2008). Although some investigators have reported quantitative analysis of tumor blood volume and perfusion values using DSC-based MRI (Law et al, 2006), quantitative perfusion analysis of this patient group has not received as much attention to date. The limited number of quantitative studies may reflect a combination of the increased complexity and user dependence associated with quantitative analysis methods, combined with an unclear need for such methods due to the already high diagnostic accuracy of qualitative methods.
An increasing need for quantitative perfusion analysis techniques may, however, become apparent with the move toward using MR-based perfusion analysis in longitudinal analysis of treatment response in primary brain tumor patients (Gerstner et al, 2008). Absolute CBV and cerebral blood flow (CBF) derived from DSC imaging have been monitored in tumoral, peri-tumoral, and normal-appearing brain tissue before, during, and after radiation treatment, and some preliminary studies already indicate that the tracer mean transit time (MTT) may provide important information on treatment response (Nagesh et al, 2007). Other studies have shown that early CBV changes during radiotherapy in gliomas predicted different physiological responses to treatment, and this information may help identify tumor sub-volumes that are radioresistant and might benefit from intensified radiation (Fuss et al, 2000). Given the abnormal properties of the neovasculature associated with malignant tumors, showing a combination of high vascular density and disorganized vessel architecture, it would be expected that the MTT would be altered in malignant tissue. Further, quantitative perfusion analysis may enable the monitoring of baseline perfusion in unaffected brain tissue, allowing inter- and intra-patient comparisons across MR machines and institutions.
It is therefore believed that DSC imaging-based quantitative perfusion analysis of patients with primary brain tumors may become increasingly important. Such analysis does, however, pose several methodological challenges related to, for example, identification of arterial input function (AIF), AIF partial volume (PV) effects (PVEs), non-linear dose response, and choice of deconvolution method. Although the technical literature addressing these issues is extensive, little has been done to test the clinical utility of quantitative DSC-based perfusion imaging in large patient materials. Clinical implementation of quantitative methods adds further challenges related to user friendliness, user independence, robustness, and processing speed. The aim of this work was thus to develop and validate an end-to-end automatic method for quantitative perfusion analysis using DSC images for routine clinical use. A wide range of deconvolution techniques and methodological variations have been proposed in the literature, and hence several deconvolution methods and models were tested. As a first validation step, the focus of the analysis in our study was perfusion measurements in normal-appearing white and gray matter in patients with confirmed glioma. Hence, the methodology presented includes automated algorithms for extraction of normal-appearing brain tissue using only raw DSC data, thereby eliminating the need for image co-registration and processing of multiple data sets.
Materials and methods
Patient Selection
Study approval was obtained from the Regional Medical Ethics Committee and patients were included only if informed consent was provided. A total of 101 patients (51 males, mean age 51 years, range 8 to 79 years) with confirmed glioma, selected from an ongoing prospective tumor perfusion study, were included in the analysis. All patients received a glioma diagnosis after MR perfusion imaging and subsequent surgery (resection or biopsy). All imaging was performed before surgery and any subsequent treatment.
MR Imaging
Imaging was performed at 1.5T (Siemens Sonata, Symphony, or Avanto; Siemens AG, Erlangen, Germany), using an eight-channel (Symphony/Sonata) or a 12-channel (Avanto) head-coil. DSC–MRI was performed using a gradient-echo, echo-planar imaging sequence acquired during contrast agent (CA) administration. The imaging parameters were the following: TR/TE 1,430 ms/46 ms, bandwidth 1,345 Hz/pixel (12 axial slices) or 1,720/48, bandwidth 1,500 Hz/pixel (14 axial slices), field of view 230 × 230 mm, voxel size 1.8 × 1.8 × 5 mm3, and inter-slice gap 1.5 mm. For each slice, 70 images were recorded at intervals equal to the repetition time. After approximately eight time points, 0.2 mmol/kg of the CA gadobutrol (Bayer Schering Pharma AG, Berlin, Germany) was injected at a rate of 5 mL/sec, immediately followed by a 20-mL bolus of saline (B Braun Melsungen AG, Melsungen, Germany) also at 5 mL/sec.
Image Analysis
AIF detection:
The AIF was automatically identified in each slice using K-means cluster analysis (Mouridsen et al, 2006a). The K-means cluster implementation was based on a method developed for automatic segmentation of brain tissue sub-classes in diffusion-weighted images (Hadjiprocopis et al, 2005), but for our purpose applied to DSC concentration–time curves (CTCs) rather than pixel intensities (Emblem et al, 2009). In short, CTCs were assumed to belong to one of five tissue sub-classes (white matter, gray matter, arterial blood, venous blood, or ‘other’), and multiple features were used to assign each CTC into the most probable tissue class. The following CTC features were used: first moment (FM) of the CTC time integral, peak height (
Since the final cluster allocation for each CTC is based on an iterative procedure with random starting points, there is no guarantee that the final solution is unique and optimal. The cluster analysis procedure was therefore repeated 50 times and the final AIF for each image slice was selected from the lowest FM cluster (determined for each run) with the highest average
AIF PV correction:
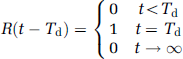
Since arterial diameters are small compared with the voxel size used in DSC–MRI, the measured AIFs are attenuated and distorted by PVEs (Kjolby et al, 2009; van Osch et al, 2005). Given that the dose-response is the same in venous and arterial voxels, and that venous voxels without PVEs can be identified, the PV correction factor can be estimated from the area under the curve of the respective arterial and venous CTCs (Ziegelitz et al, 2009). However, in DSC acquisitions the first-pass T2* effect in voxels containing only blood is generally so large that complete signal loss occurs, with resulting venous CTC distortion (Knutsson et al, 2007). Therefore, the first-pass phase was not used to correct for PVEs. Instead, the pseudo-steady-state phase after the first pass was used under the assumption that the venous CA concentration is sufficiently low to avoid complete signal loss. Assuming that the dose-response is similar in arteries and veins in the steady-state phase, and that the measured voxel-wise change in T2* relaxation rate is proportional to CA concentration, the PV correction factor,
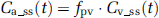
where
where
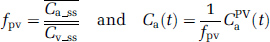
Venous output functions (VOFs) were identified using the same cluster analysis approach as described above, but using a large CTC FM as the selection criterion. The steady-state levels in the AIFs and VOFs were estimated by first fitting a γ-variate function to the respective CTCs. The CTC tails were then identified as the portion of the curves with amplitude above the corresponding value of the γ-variate-fitted curve (starting at the last time-point), as shown in Figure 1B. A Fourier-based, low-pass filter was applied to the identified AIF and VOF before identification of the PV factor to improve the stability of the method. A single PV correction factor was estimated for all slices based on the average steady-state concentration levels obtained from the identified arterial and venous CTCs. For each subject, the validity of the PV correction factor was assessed (from the criterion that 0 <
Estimation of PV correction factor. (
Quantitative perfusion analysis:
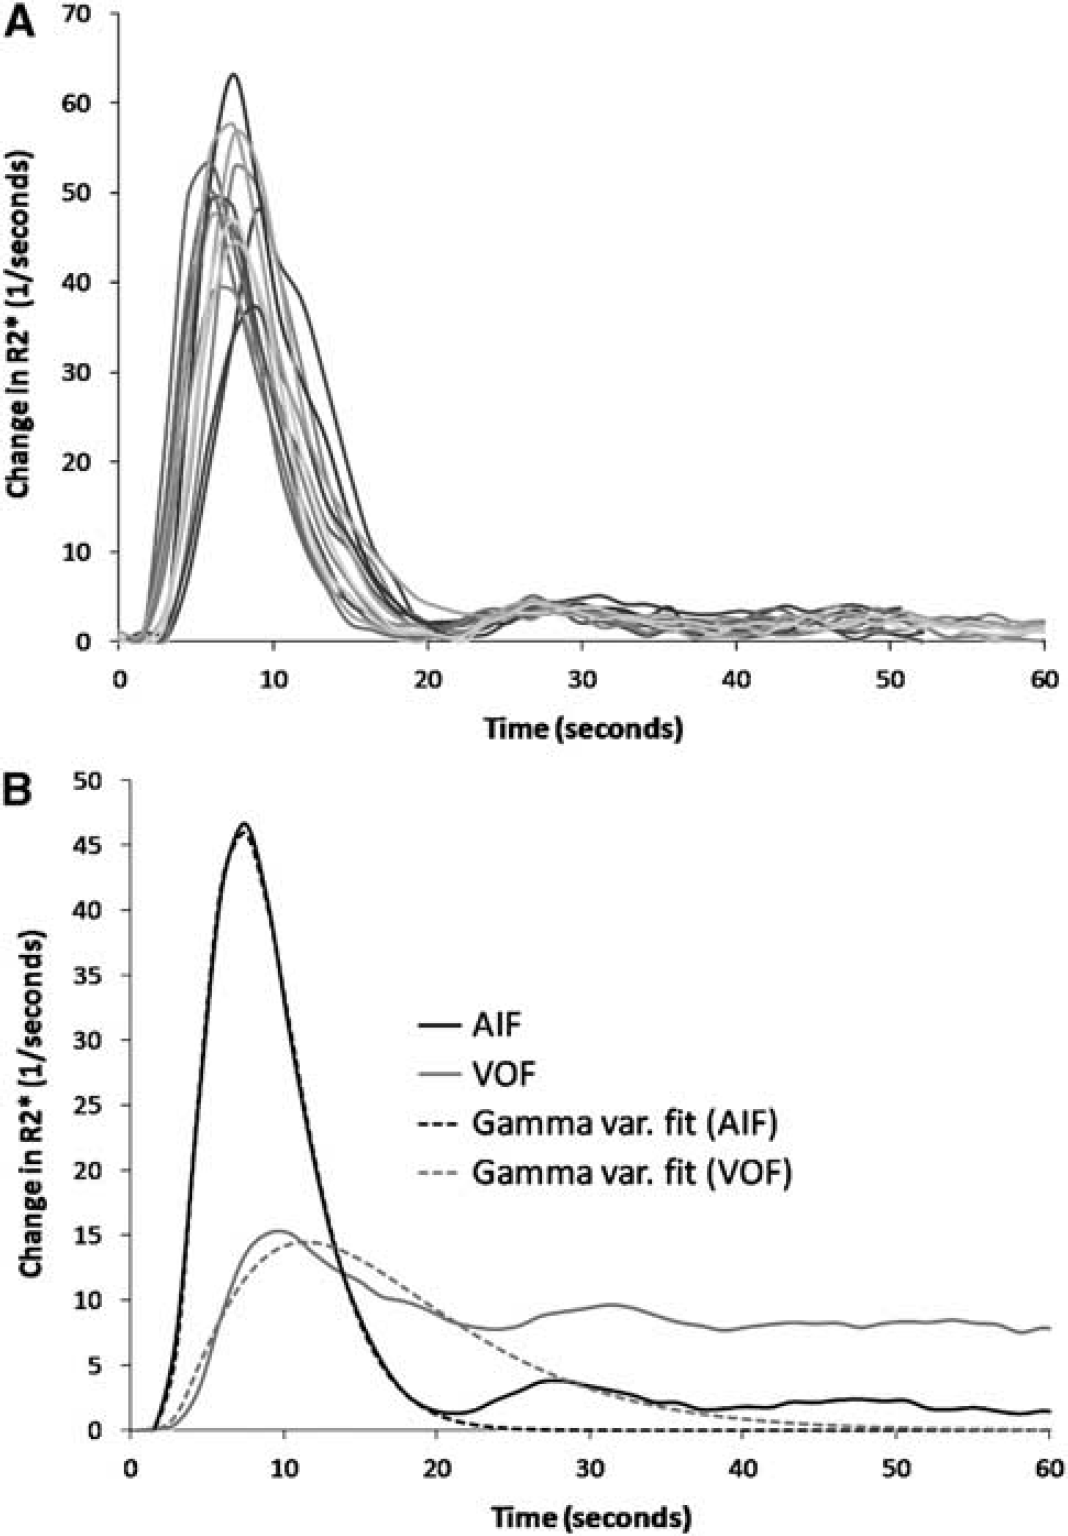
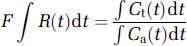
Quantitative analysis of tissue perfusion and blood volume was performed using established tracer kinetic models (Ostergaard et al, 1996; Wu et al, 2003) expressing the relationship between the tissue response and the AIF in terms of the convolution integral:
where ⊗ denotes convolution,
Equation (4) assumes that the AIF is not significantly dispersed (Calamante, 2005) and

Two different methods to estimate CBV an MTT (henceforth referred to as method-I and method-II) were compared. In method-I, CBV was estimated from the assumption that fractional blood volume in a voxel scales with the area under the CTC, normalized to the area under the curve of the AIF (Ostergaard et al, 1996):
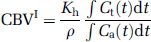
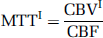
From the central volume principle (Lassen and Perl, 1979) the corresponding MTT is then given as:
In method-II, MTT was determined independently from the area under the residue function (Vonken et al, 1999) as follows:
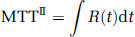
and CBV is then given by the central volume principle as follows:
Equation (3) was solved to obtain CBF, MTTII, CBVII, and
Method (a): A standard truncated SVD (sSVD), as originally proposed by Ostergaard et al (1996).
Method (b): A block-circulant SVD (cSVD) extension of sSVD, which has been shown to be less sensitive to tracer delays (Wu et al, 2003).
Method (c): Oscillation-limited cSVD (oSVD), which is an iterative method repeating the cSVD deconvolution process until the oscillation in the residue function is below a threshold defined by the oscillation index (OI) (Wu et al, 2003).
Method (d): Iterative Tikhonov regularization SVD method (iTrSVD) using the L-curve criterion to determine the optimal regularization parameter (Hansen and Oleary, 1993).
For methods (a) and (b) the singular value threshold (
Tissue clustering:
The gray and white matter were automatically segmented using cluster analysis based on the temporal characteristics of the CTCs. Before this classification, areas of edema secondary to brain tumor were identified by a simple one-feature cluster analysis eliminating the class with the highest signal intensity in the baseline (pre-contrast) images. This approach assumed that the baseline DSC images were sufficiently T2-weighted to render pathological tissue hyper-intense in the baseline images. Once areas of abnormal appearance were removed, the remaining CTCs were classified using K-means cluster analysis with three classes and a single feature (area under the CTC). The cluster with the highest area under the curve was assumed to represent blood, the middle cluster gray matter, and the lowest cluster white matter.
Non-brain tissue voxels were removed before tumor extraction and tissue classification using a two-step procedure. First, the noise level in the baseline DSC images was determined automatically using the method of Otsu (1979). A seed point was then automatically selected centrally in the brain and a seed-growing algorithm was used to select all connecting voxels above the noise level. Due to the relatively poor resolution of the DSC images, the orbital structures as well as the skull appeared disconnected from the brain and were thus consistently removed with this approach.
All image-processing methods were written in C+ + (CodeGear C+ + Builder; Embarcadero Technologies, San Francisco, CA, USA) and integrated in a modified version of the software package nordicICE (NordicImagingLab AS, Bergen, Norway).
Statistical Analysis
Possible correlation between the perfusion metrics and patient age was tested using stepwise linear regression analysis and analysis of variance, with tumor grade and gender included as possible confounding factors. Regression analysis was performed for the whole patient population as well as separately for males and females and the regression coefficient, β, was determined. Gender differences in the perfusion metrics were tested using two-sample
Since identification of both AIF and VOF (and hence PV correction factor), as well as the gray/white-matter tissue classes, was based on iterative cluster methods with random initial seed points, stability analysis was performed to assess the uncertainty in the resulting perfusion values introduced by the cluster analysis. Ten subjects were selected randomly and the complete perfusion analysis was repeated 50 times in each of these subjects. Mean and s.d. values for CBF and CBVII for the combined gray- and white-matter tissue classes were obtained using cSVD deconvolution, with a fixed value for
Statistical analysis was performed using Minitab15 (Minitab, State College, PA, USA).
Results
Of the 101 cases investigated, there were six WHO grade-I pilocytic astrocytomas, 19 grade-II diffuse astrocytomas, 5 grade-II oligodendrogliomas, 6 grade-II oligoastrocytomas, 3 grade-II ganglioglioma, 6 grade-III anaplastic astrocytomas, 2 grade-III anaplastic oligodendrogliomas, 5 grade-III anaplastic oligoastrocytomas, and 49 grade-IV glioblastomas. There was no difference in mean age between the gender groups (mean age 51.8 years in males and 50.6 years in females;
AIF/VOF Detection and Tissue Cluster Analysis
For all patients, an AIF and a valid PV correction factor could be identified in all image slices using the automated method. Figure 1A shows the resulting AIFs for each slice in a sample subject with glioblastoma (male, age 40 years). Figure 1B shows the corresponding mean AIF and the mean VOF averaged across all slices. The average (± s.d.) correction factor was
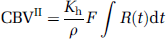
A sample case showing segmentation of tumor and classification of non-affected white/gray matter in a patient with glioblastoma (40-year-old male). Identification of gray- and white-matter tissue classes and blood was based on cluster analysis of the relative CBV (rCBV) values, resulting in the three tissue segments shown in panel
Dependence of Perfusion Metrics on Deconvolution Method
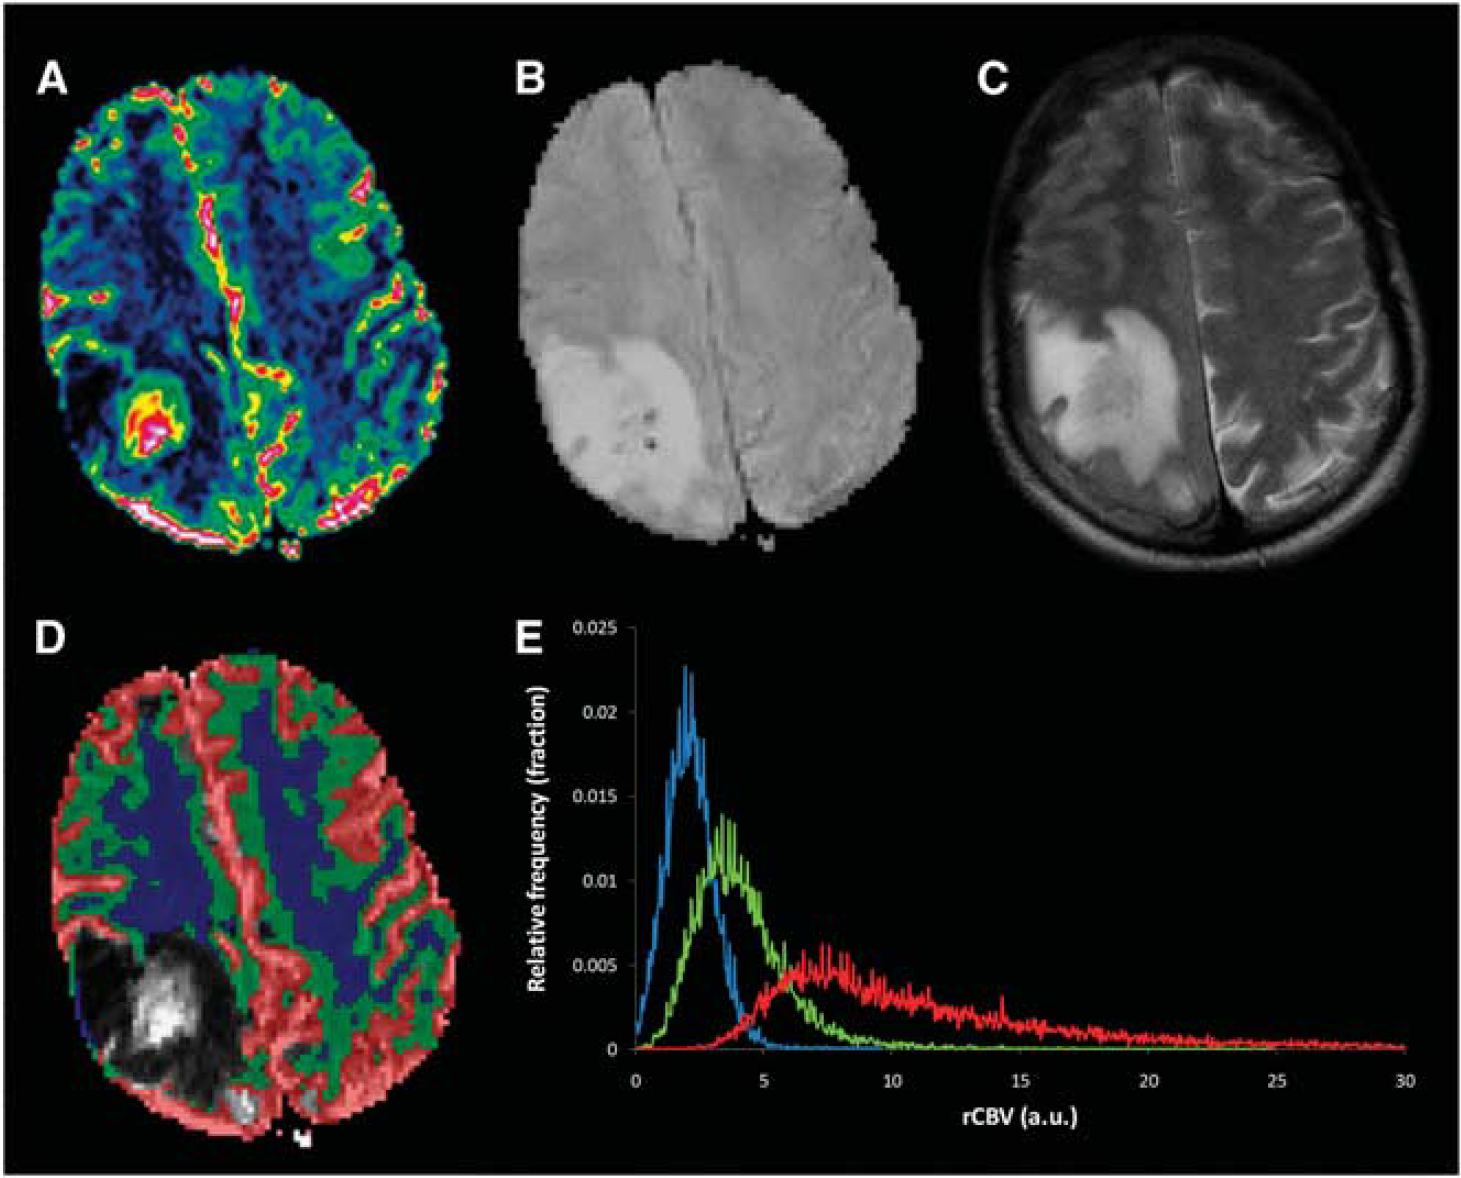
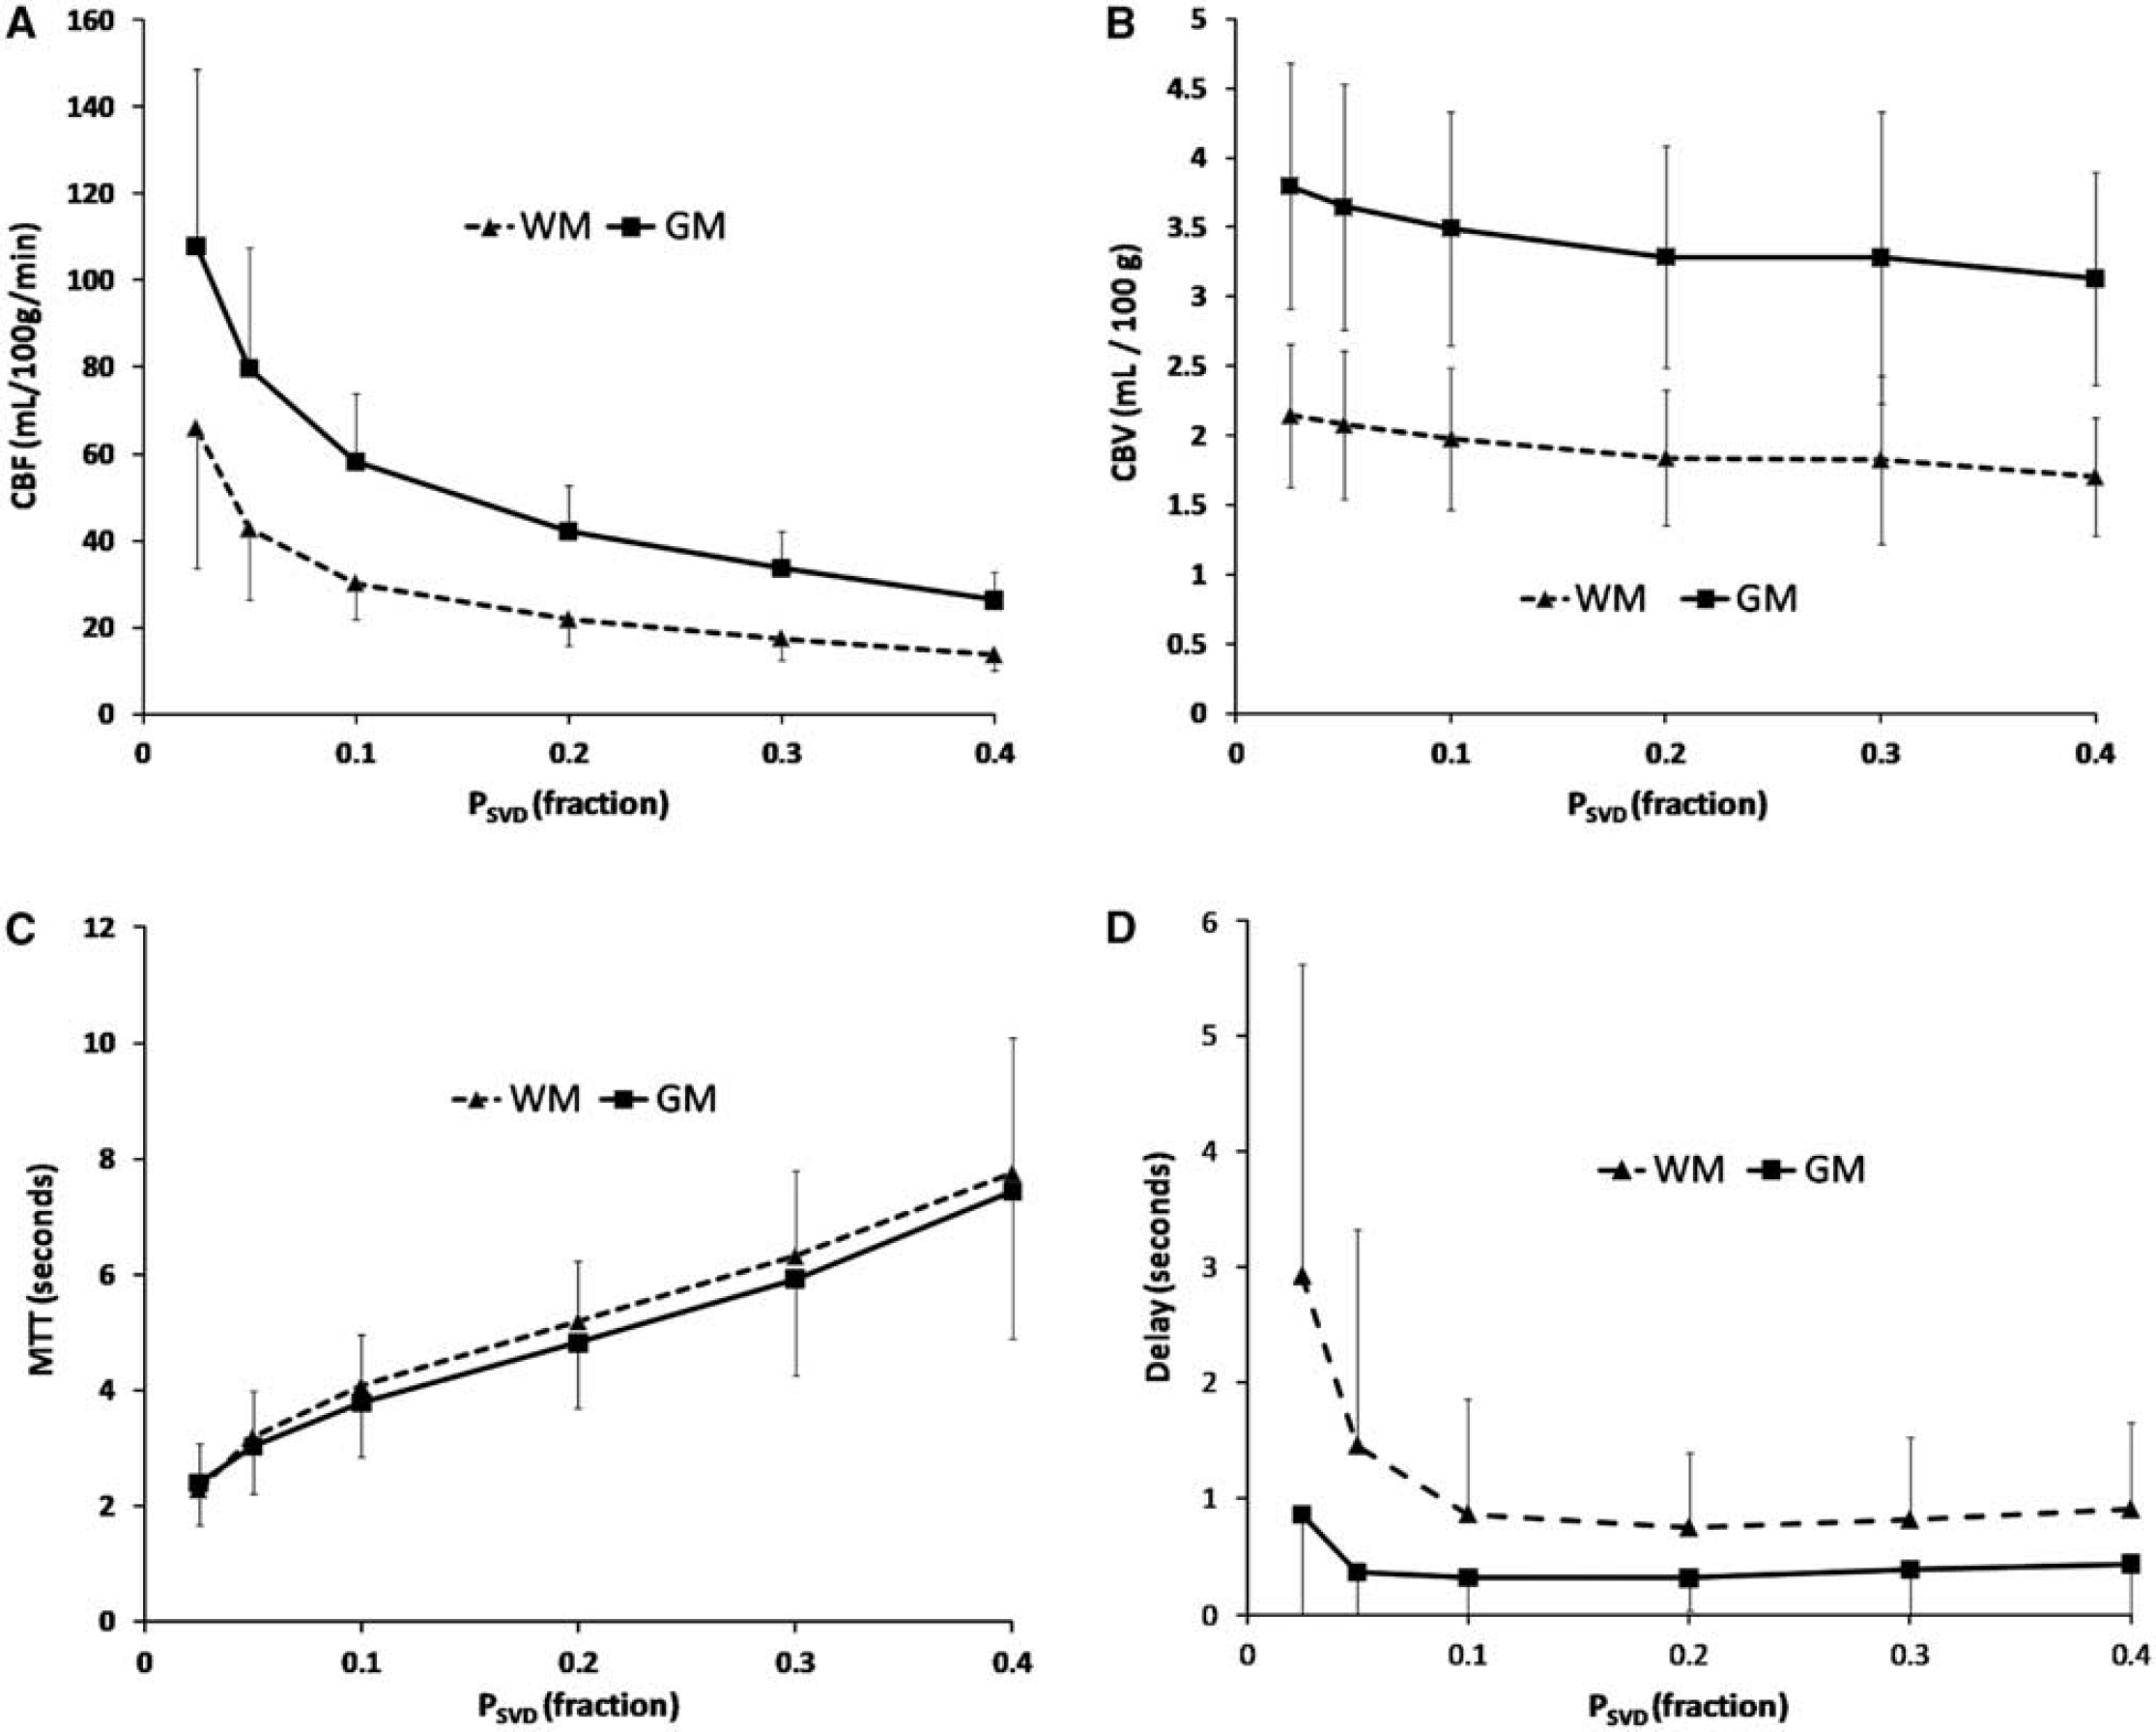
CBF in both gray and white matter decreased monotonously in a bi-linear manner with increasing
Dependence of CBF estimates on SVD regularization parameter. The figures show the change in estimated CBF for the combined gray- and white-matter tissue classes as function of singular value cut-off (
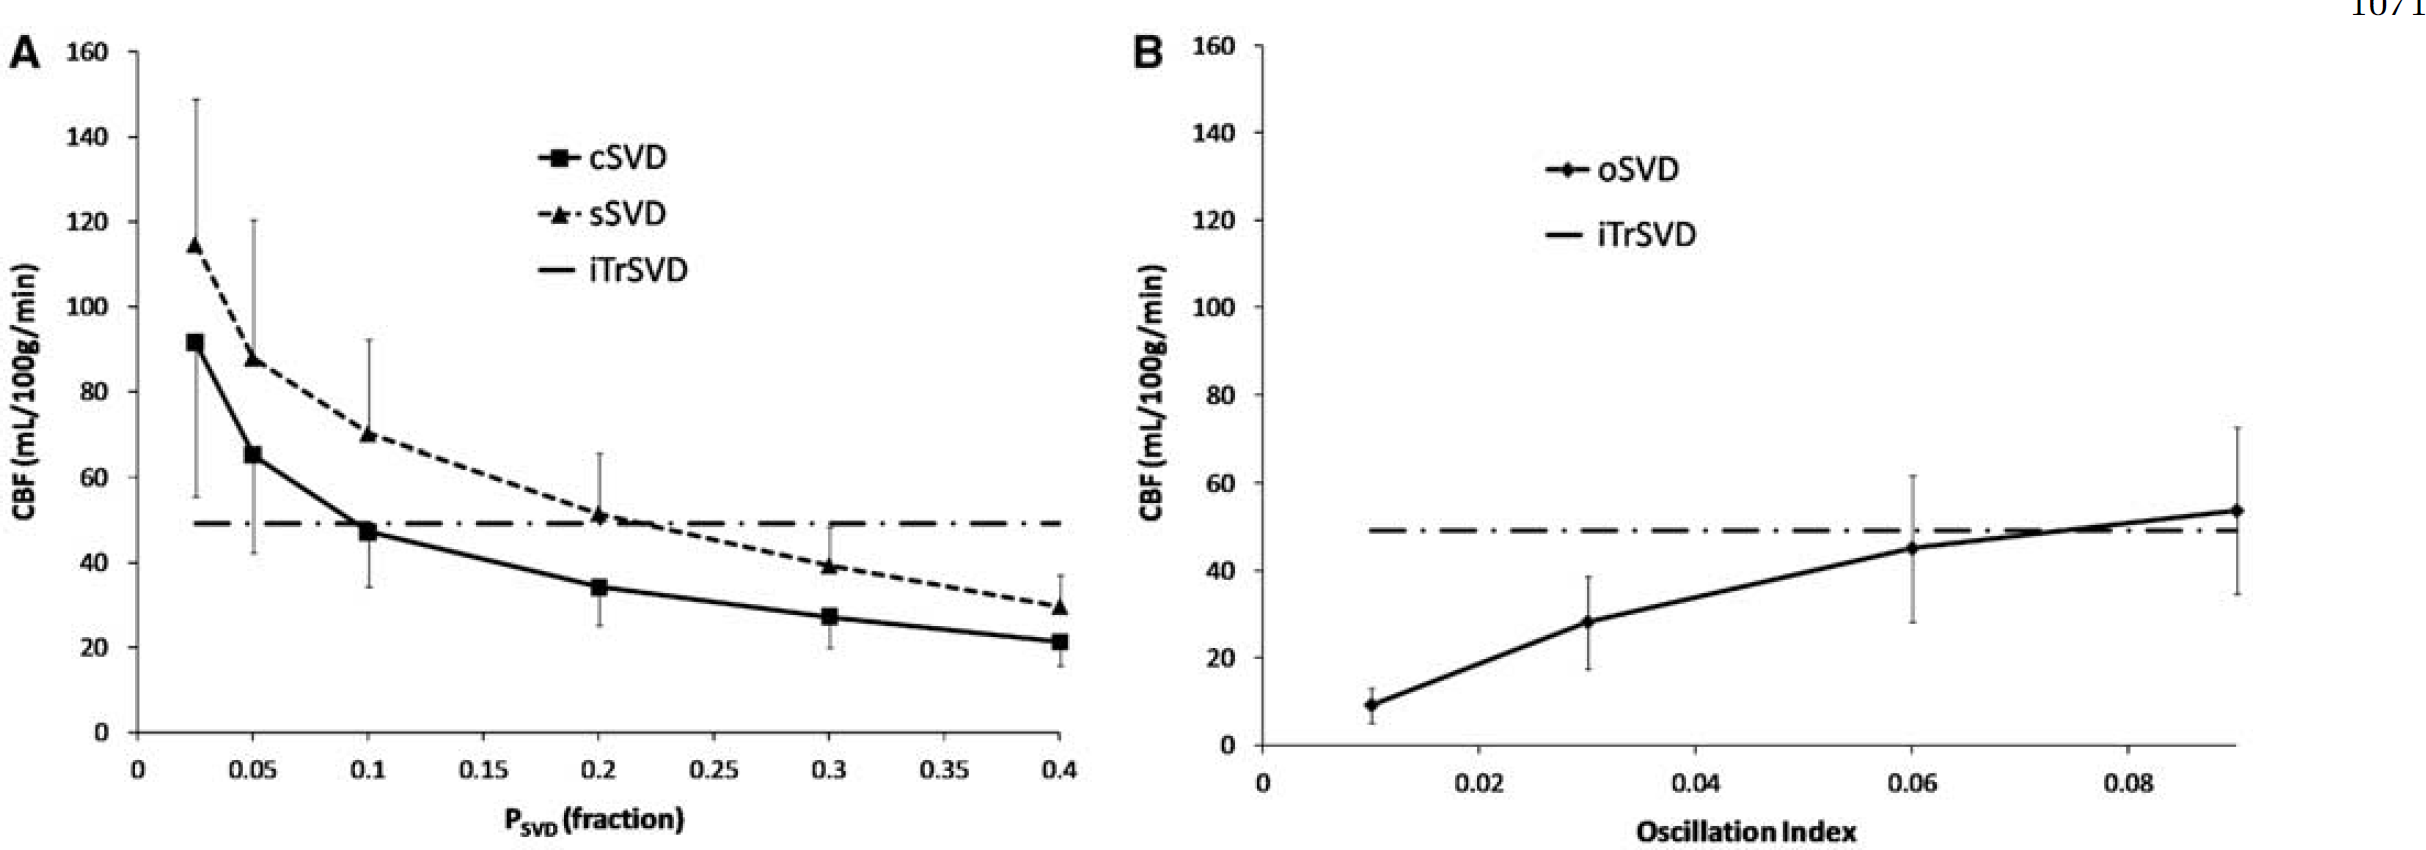
Comparison of perfusion metrics obtained for 101 subjects with different deconvolution methods and kinetic models
Abbreviations: CBF, cerebral blood flow; CBV, cerebral blood volume; cSVD, block-circulant SVD; GM, gray matter; iTrSVD, iterative Tikhonov regularization SVD method; MTT, mean transit time; oSVD, oscillation-limited cSVD; sSVD, standard truncated SVD; SVD, singular value decomposition;
CBF (± s.d., mL/100 g/min), CBV (mL/100 g), and MTT (secs) obtained with the different deconvolution methods: sSVD (0.2) with singular value threshold,
Significant difference (paired
Figure 4 shows the changes in CBF, CBVII, and MTTII and
Correlation between perfusion metrics and applied singular-value threshold (
CBVI was significantly higher in both gray matter and white matter as compared with the corresponding values of CBVII, irrespective of the deconvolution method used to estimate CBVII. The corresponding values of MTTI were also significantly higher both in gray and white matter as compared with the same values obtained for MTTII.
Correlation of Perfusion Metrics with Age, Gender, and Tumor Grade
The correlation between CBF and patient age was generally higher using cSVD as compared with sSVD and the highest correlation was obtained using cSVD (0.1). A significant correlation between CBF and age was only observed using cSVD or sSVD deconvolution and not using iTrSVD or oSVD (for any OI value). The age and gender correlations obtained with cSVD (0.1) deconvolution are summarized in Table 2 and the linear regressions of age versus CBF, CBVII, and MTTII are shown in Figure 5. CBF decreased with age and MTTII increased with age in both gray and white matter. No correlation was found between CBVII or CBVI and age or gender in any tissue type. CBF was significantly higher, and MTTII significantly shorter, in females as compared with that in males both in both gray and white matter. The correlation between age and CBF/MTTII was generally more pronounced in females than in males. No correlation was found between tumor grade and any of the perfusion metrics for normal-appearing gray or white matter. CBF was higher—and MTT was shorter—in females than in males for all deconvolution methods except for oSVD with OI < 0.06.
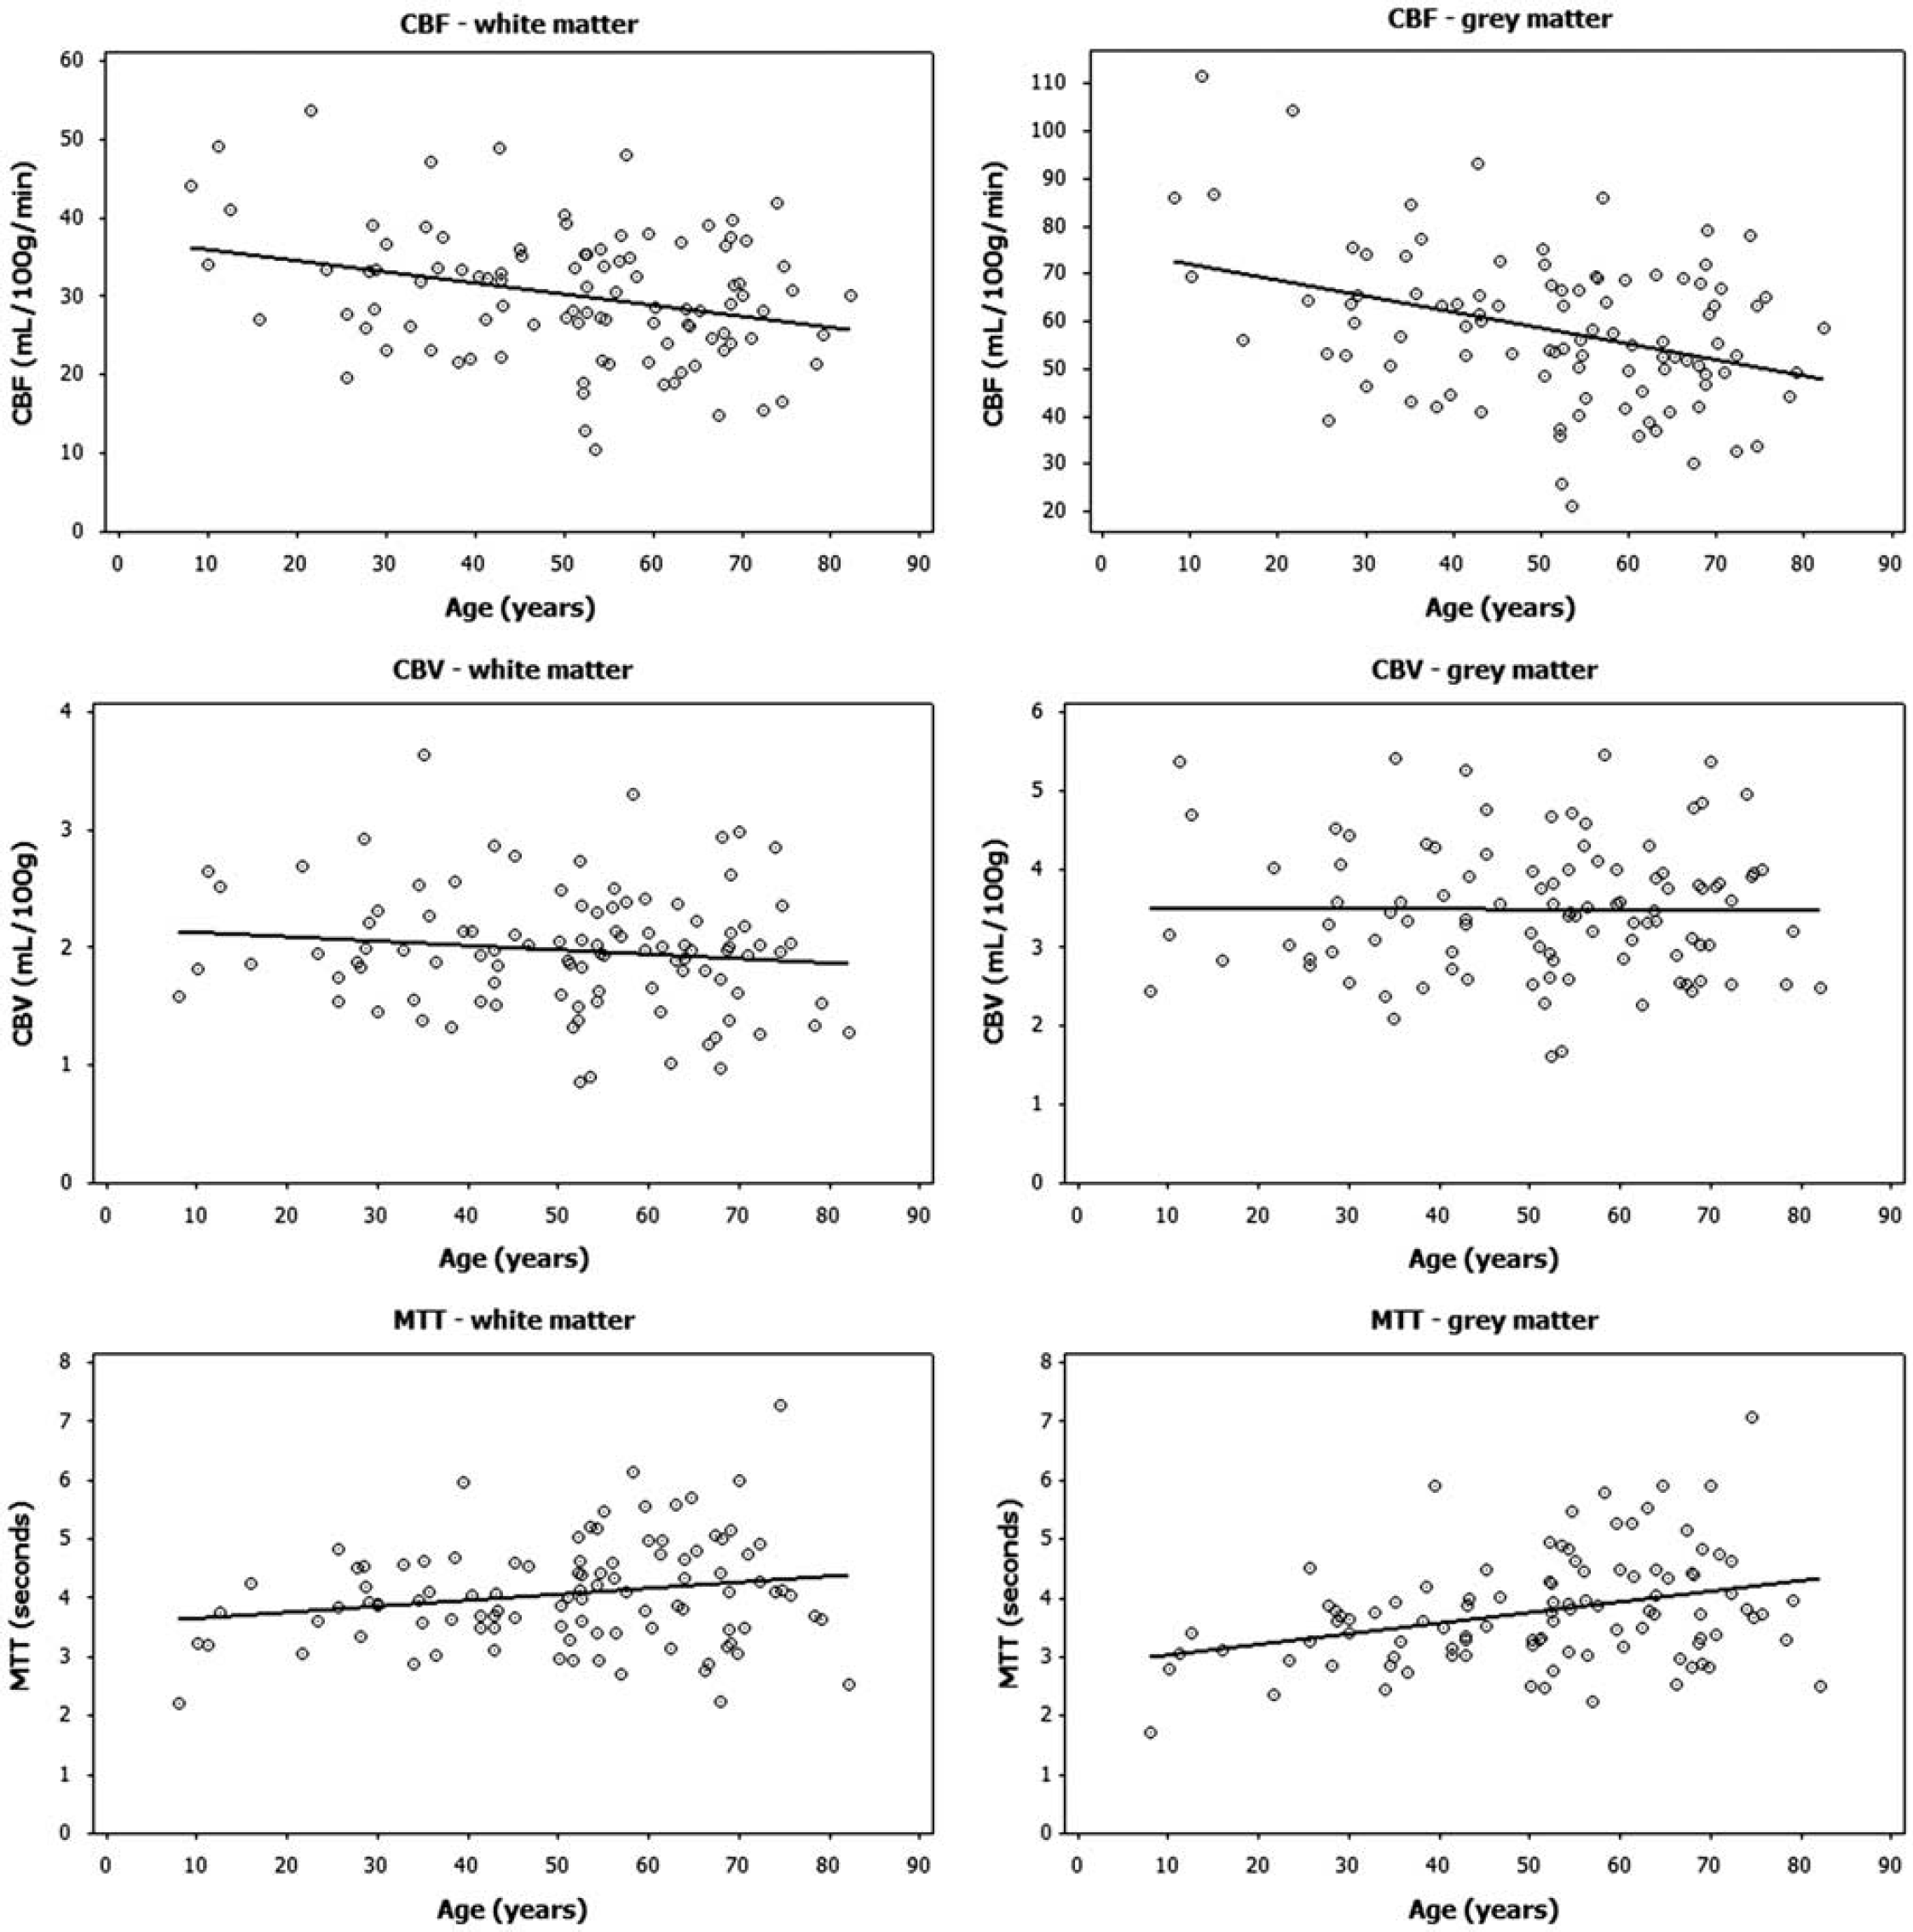
Dependence of perfusion metrics on age. Linear regression showing correlation between age and CBF (top row), CBV (middle low), and MTT (bottom row) for white matter (left column) and gray matter (right column). Significant age dependence was found for CBF and MTT in both WM and GM, but not for CBV, in any tissue type. The highest age correlation (as shown in this figure) was observed using cSVD with a singular value threshold (
Age and gender dependence of CBF, CBV, and MTT
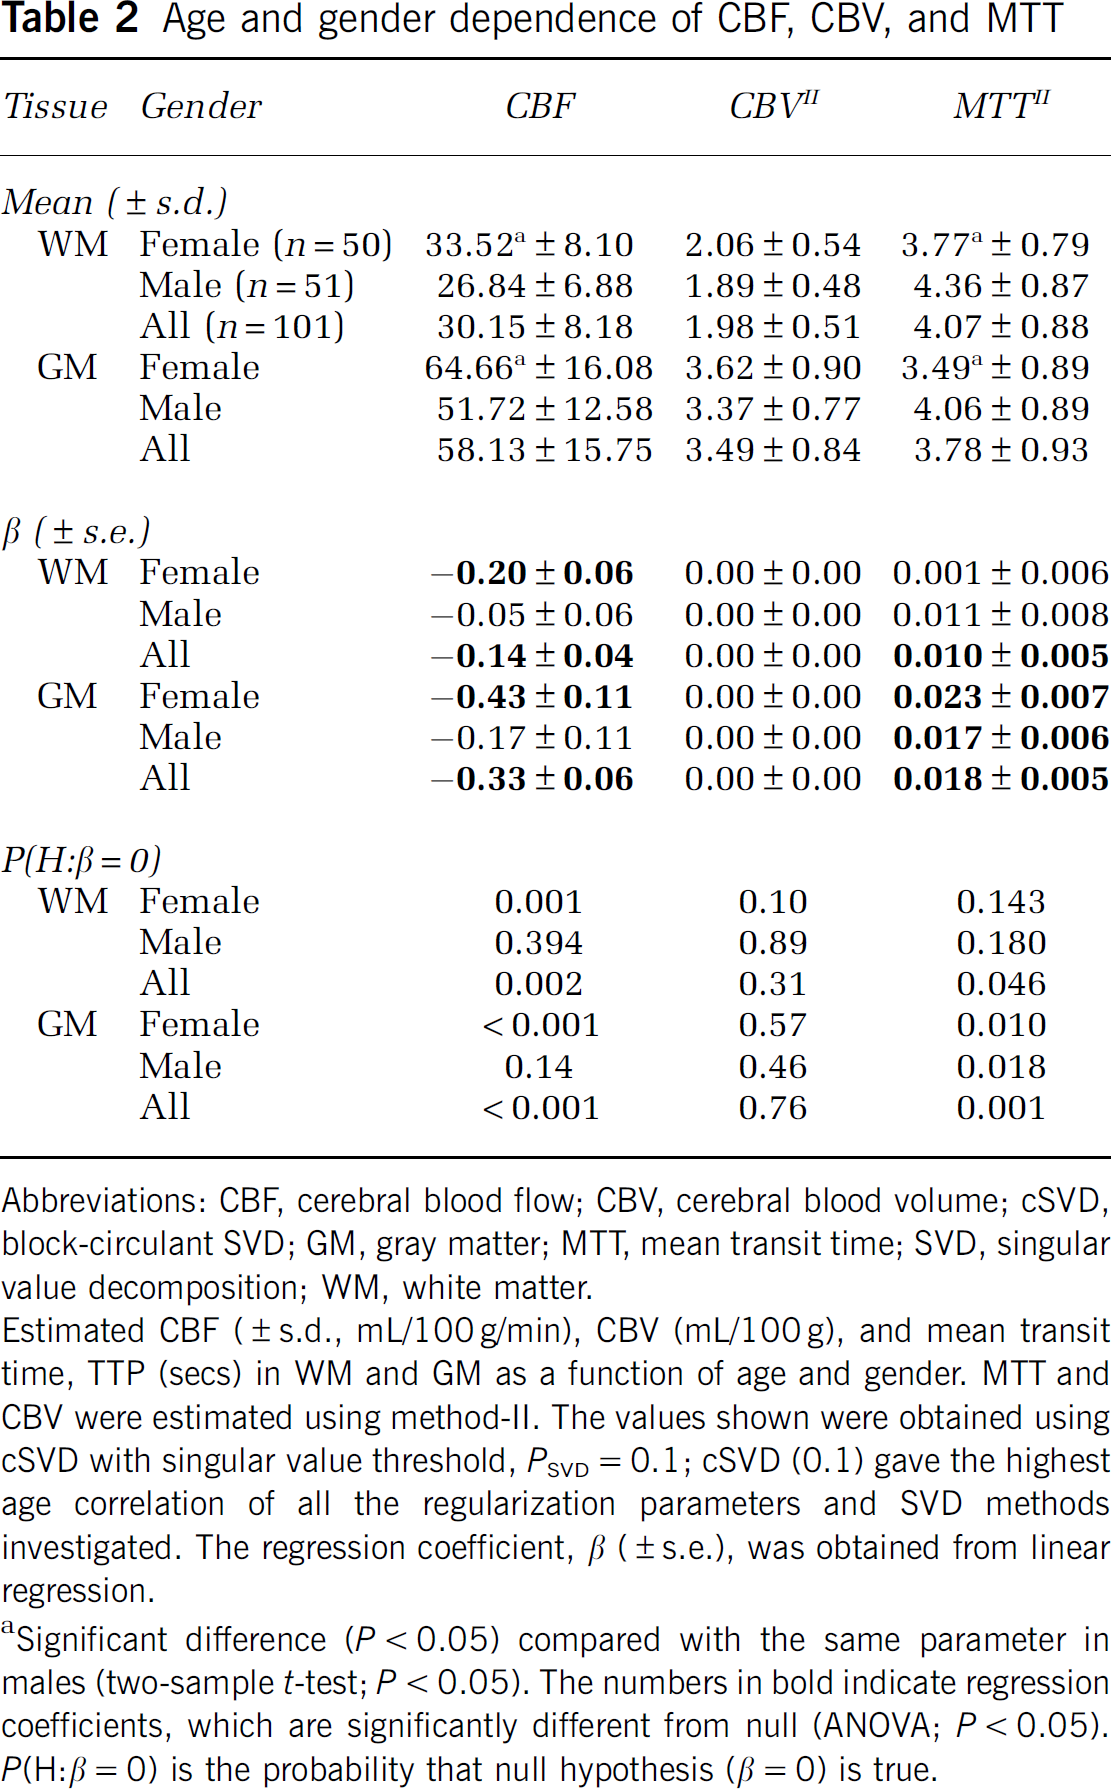
Abbreviations: CBF, cerebral blood flow; CBV, cerebral blood volume; cSVD, block-circulant SVD; GM, gray matter; MTT, mean transit time; SVD, singular value decomposition; WM, white matter.
Estimated CBF (± s.d., mL/100 g/min), CBV (mL/100 g), and mean transit time, TTP (secs) in WM and GM as a function of age and gender. MTT and CBV were estimated using method-II. The values shown were obtained using cSVD with singular value threshold,
Significant difference (
SNR and Stability Analysis
The average whole-brain SNR measured from the pre-contrast dynamic signal was 45.6 ± 14.5. SNR was higher in white matter (47.4 ± 15) than in gray matter (45.5 ± 15) (paired
Discussion
We present a fully automated, user independent tool for quantitative analysis of hemodynamic parameters using DSC images. The proposed methods provide global gray- and white-matter perfusion analysis, including slice-wise identification of AIFs, PV corrections, and tissue segmentation, computed in about 10 to 15 secs on a standard desktop computer without any user interaction. Contrary to other reported DSC-based methods (Shin et al, 2007), all analysis is based solely on the DSC images, eliminating the need for time-consuming MR protocols and complex image co-registration routines.
The average CBV and CBF values obtained from normal-appearing white and gray matter in the 101 glioma patients investigated are in good agreement with previously reported values for patients and normal subjects obtained using different MR-based techniques (Larsson et al, 2008; Petersen et al, 2009; Shin et al, 2007). The observed decrease in CBF with age and the gender differences in CBF and MTT are also in agreement with previous MRI and [15O]H2O positron emission tomography studies (Borghammer et al, 2008; Leenders et al, 1990; Shin et al, 2007). Contrary to some previous studies, no age-related changes in CBV were observed. The absence of any change in CBV with age is consistent with the observed age-related increase in MTT, suggesting that decrease in CBF with age is caused by a true reduction in tissue blood flow and is not just an indirect effect of reduced CBV, which (from the central volume principle) would have left MTT unchanged.
In spite of the good agreement between our results and those of many previous studies, large discrepancies exist in the reported normal cerebral CBF and CBV values, as well as age and gender variations in these values, obtained using different MR techniques and also using different imaging modalities, and a gold standard seems hard to establish. The large deviation in the reported normal perfusion values probably reflects both true inter- and intra-patient physiological variations (Leenders et al, 1990), as well as methodological differences between the different imaging techniques used to measure cerebral perfusion. The methodological challenges are particularly apparent in MR-based perfusion analysis and an extensive literature exists in addressing the various problems relating to AIF selection (Bleeker et al, 2009; Calamante et al, 2004; Mouridsen et al, 2006a), PVEs in the AIF (Kjolby et al, 2009; van Osch et al, 2005), non-linear dose response (Calamante et al, 2007; Kiselev, 2005), and choice of optimal deconvolution technique and model parameters (Calamante, 2005; Calamante et al, 2003; Knutsson et al, 2004; Murase et al, 2001; Wu et al, 2003). Since the aim of this study was to establish a user-independent tool for robust automated quantitative perfusion analysis, several of the most commonly used deconvolution techniques were tested and compared.
Our results raise some important methodological issues related to quantitative DSC perfusion imaging. The significant dependence of CBF and MTT on the choice of SVD singular value threshold (
MTT, which may imply that the method generally applies too much SVD regularization in both tissue types. We used an iterative Tikhonov regularization algorithm that aims at minimizing the residual norm while keeping the residual function solution norm as small as possible (Hansen and Oleary, 1993). Others have expanded this method further, minimizing the first-order derivative of the solution norm, thereby minimizing oscillations in the resulting residue function estimate (Calamante et al, 2003; Larsson et al, 2008). This method was not tested in this work due to the anticipated resulting increase in the already long processing time of the iTrSVD method (90 secs) as compared with that of the standard non-iterative SVD techniques (15 to 20secs). Further, since oscillations in the residue function,
Two different kinetic models for deriving CBV and MTT values were compared. In the most commonly used approach (model-I), only CBF is determined by deconvolution and CBV is determined independently from the tissue/AIF CTC time integrals. MTT is then given by the central volume principle: MTTI = CBVI/CBF. In model-II both CBF and MTT are determined from the residue function after deconvolution and CBV is then the dependent parameter given by the product of CBF and MTTII. For the two models to provide equal estimates of CBV and MTT (Equations (6) and (9)), the following criterion must be satisfied:
Model-I was found to give significantly higher CBV values as compared with model-II for all deconvolution methods and
Since the aim of our work was to develop a quantitative perfusion method that can readily be implemented in a clinical setting, it was found highly desirable to base all analysis solely on raw DSC images to simplify the analysis and speed up processing. Automatic correction for PVEs in the AIF is a critical component in the processing pipeline, and the aim to only use raw DSC images prevented the use of more common PV correction schemes based on additional T1-weighted images (Wirestam et al, 2007) or quantitative T1 maps (Shin et al, 2007). The venous first-pass signal response is generally distorted in DSC images due to excessive T2* effects in intravascular voxels unaffected by PVEs, and complex, user-dependent correction regimes are needed to restore the true VOF (Knutsson et al, 2007). These saturation effects could in theory be reduced by reducing the echo time, but this would also negatively affect the dynamic signal change in parenchymal voxels, reducing the sensitivity of the method. The PV correction factor was therefore determined from the tail of the CTC in the identified AIF and a corresponding VOF in each slice. This was found to give a much more robust estimate of the PV correction factor as compared with using the first-pass venous response when implemented as an automated routine.
Different from most previously published methods, both AIF and VOF were identified in each slice to eliminate the need for automatic identification of a given vessel segment based on anatomical location, which would significantly complicate image processing. The slice-wise AIF determination may have advantages in that the AIF may better reflect the true input function for each slice, minimizing artificial delays and dispersion effects (Calamante et al, 2006). The disadvantage of this approach is that the AIF may not be well-defined in all slices, especially in the basal part of the brain. In spite of this potential limitation, the slice-wise AIF/VOF determination approach was found to be robust and reproducible, and providing physiologically plausible perfusion estimates with inter-patient variations comparable to the values obtained using different modalities and perfusion analysis methods.
We obtained an average PV correction factor of 0.3 in our study, with a variation across subjects of about 20% (in terms of the relative s.d.), suggesting that the method provides a reasonable estimate of PVEs across subjects. Assessing the overall inter-patient variation in the perfusion estimated, there is, however, clearly a significant variability, which cannot be explained by gender- or age-dependent effects. Some of this variability is likely due to imperfections in the PV estimation and AIF determination. One limitation with the proposed method is a lack of correction for possible shape distortion in the AIF due to, for example, non-linearity in the arterial dose-response. Such distortions, not observable from the steady-state signal, could lead to broadening of the residue function (and hence the MTT). Further, significant CA-induced T1-shortening effects could potentially occur in the steady-state phase, which may lead to under-estimation of the steady-state CA concentrations. This effect would, however, affect both arteries and veins, and the net effect on the AIF/VOF steady-state ratio is therefore expected to be small.
A limitation in the study design was that a healthy, age-matched control group was not included. Only patients with known primary brain tumor were investigated and although we implemented a method to automatically exclude pathological tissue from the analysis, there is no guarantee that a portion of the normal-appearing tissue masks may include tissue with abnormal hemodynamic properties. There was, however, no correlation between the CBV or CBF measured in the apparent unaffected tissue and tumor grade. Such a correlation would be expected if a significant portion of the tissue masks included tumor tissue, since high-grade gliomas are known to give significantly higher CBF and CBV values as compared with low-grade gliomas (Law et al, 2006). Other studies have also shown that normal-appearing regions of interest do not show altered CBV values compared with healthy controls in patients with primary brain tumors (Wenz et al, 1996). A further potential limitation in the methodology is that gray- and white-matter tissue clustering was based solely on the dynamic properties of the CTC, without any reference to structural images. Identification of the different tissue classes is commonly based on signal intensity differences in heavily T1-weighted images, but structure-based identification of gray matter would not account for long-range T2* effects occurring in large vessels in the DSC images, leading to significant over-estimation of CBF and CBV in gray matter. Large vessel domination could potentially have been reduced by using a spin echo-based EPI sequence rather than a gradient echo-based sequence, but this would have resulted in significant reduction in temporal resolution or brain coverage since longer echo times are needed in spin echo–EPI sequences to maintain sufficient CA sensitivity. Gray- and white-matter identification based on the dynamic CTC information was shown to reliably identify two tissue classes unaffected by large intravascular T2* effects, as shown in Figure 2. The fact that voxels that would structurally be identified as gray matter were excluded (due to intravascular T2* effects) from the gray matter class in our analysis, is reflected in the lower gray/white-matter volume ratio (0.6) compared with that in the literature (Wenz et al, 1996). This approach also eliminates the need for co-registration of structural images and DSC images, which would add complexity to the analysis procedure.
In summary, a fast and fully automated quantitative perfusion analysis method is presented where all analytical steps are based on raw DSC data only. The resulting hemodynamic parameters extracted automatically from normal-appearing gray- and white matter, are in good agreement with the literature values. The gender- and age-related changes in CBF were best observed using cSVD with
Footnotes
Acknowledgements
We thank I Rasmussen, MD, PhD, for critical reading of the paper.
AB is a consultant for NordicNeuroLab (Bergen, Norway). KEE has no conflict of interest to declare.