
Abstract
The exact mechanism of selective motor neuron death in amyotrophic lateral sclerosis (ALS) remains still unclear. In the present study, we performed in vivo capillary imaging, directly measured spinal blood flow (SBF) and glucose metabolism, and analyzed whether if a possible flow—metabolism coupling is disturbed in motor neuron degeneration of ALS model mice. In vivo capillary imaging showed progressive decrease of capillary diameter, capillary density, and red blood cell speed during the disease course. Spinal blood flow was progressively decreased in the anterior gray matter (GM) from presymptomatic stage to 0.80-fold of wild-type (WT) mice, 0.61 at early-symptomatic, and 0.49 at end stage of the disease. Local spinal glucose utilization (LSGU) was transiently increased to 1.19-fold in anterior GM at presymptomatic stage, which in turn progressively decreased to 0.84 and 0.60 at early-symptomatic and end stage of the disease. The LSGU/SBF ratio representing flow—metabolism uncoupling (FMU) preceded the sequential pathological changes in the spinal cord of ALS mice and was preferentially found in the affected region of ALS. The present study suggests that this early and progressive FMU could profoundly involve in the whole disease process as a vascular factor of ALS pathology, and could also be a potential target for therapeutic intervention of ALS.
Keywords
Introduction
Amyotrophic lateral sclerosis (ALS) is a progressive and fatal disease that is caused by the selective death of motor neurons. Approximately 5% to 10% of patients have a genetically inherited form known as familial ALS. About 15% to 20% of familial ALS cases are associated with missense mutations or small deletions in the gene that encodes Cu/Zn-superoxide dismutase 1 (SOD1) (Aoki et al, 1993; Rosen et al, 1993). Transgenic (Tg) mice that carry mutant SOD1 genes have been generated to elucidate how mutations in the SOD1 gene cause motor neuron death (Gurney et al, 1994; Murakami et al, 2007). Although the underlying mechanism of ALS has not yet been fully clarified, several reports have demonstrated noncell autonomous death of motor neurons (Boillee et al, 2006; Clement et al, 2003; Llinas et al, 2004; Nagai et al, 2007; Pramatarova et al, 2001; Wang et al, 2005).
During physiological conditions, there was a close relationship between blood flow and glucose metabolism (flow—metabolism coupling; FMC) (Leybaert, 2005; Weir et al, 2002), and this coupling was tightly controlled through functional regulation of neurovascular unit (NVU) (del Zoppo, 2010). Structural and functional abnormalities in this NVU have not been fully elucidated under pathological conditions (Lo and Rosenberg, 2009) especially in ALS. Several reports have demonstrated the reductions of blood flow and glucose metabolism in the cerebral cortex and the spinal cord of both ALS patients and the animal model (Dupuis et al, 2011; Guo et al, 2000; Waldemar et al, 1992; Zhong et al, 2008). Furthermore, we have very recently found that the damage in NVU was observed before motor neuron degeneration (Miyazaki et al, 2011), which may be an important pathologic pathway in human and animal model of ALS.
It remains still unclear whether if a possible FMC abnormality is present in ALS, and if such a FMC abnormality is related to motor neuron degeneration. In the present study, therefore, we performed in vivo capillary imaging and directly analyzed the FMC with spinal circulation and glucose metabolism.
Materials and methods
Animal Models
During the experiment, the animals were treated in accordance with the declaration of Helsinki and the guiding principles in the care and use of animals. Also, all experimental and animal care procedures were approved by the Animal Care and Use Committee of the Graduate School of Medicine, Dentistry, and Pharmaceutical Science of Okayama University. A Tg mouse line with the G93A human SOD1 mutation (G1H/+) was obtained from Jackson Laboratories (Bar Harbor, ME, USA) and maintained as hemizygotes by mating Tg males with C57BL/6J females. The offspring were genotyped using a PCR assay with DNA obtained from tail tissue samples. We used 12-, 16-, and 19-week-old (W) G93A mice and age-matched non-Tg C57BL/6J littermates (wild type, WT) as controls. The 12-W Tg mice were considered to be at the presymptomatic stage, the 16-W mice to be at the early-symptomatic stage, and the 19-W mice to be at the end stage of the disease.
In Vivo Imaging of Spinal Capillary Vessels
For in vivo imaging, 12, 16, and 19 W of Tg mice (n=5, 6, 8 at each W), and 19 W of WT littermates (n=5) were used. The animals were initially anesthetized with 2% isoflurane and maintained with 1% during surgical procedures. Rectal temperature was maintained at 37.0°C±0.2°C by means of a feed back-controlled warm pad. The back of the animal was shaved, and the midline incision of the skin was made to expose the back musculature. The paravertebral muscles were carefully removed from the vertebral column, and laminectomy of the lumber vertebrae at the level of L4–5 was performed. Bleeding was controlled either by coating bone wax or by using small pieces of gelatin sponges (Astellas Pharma, Tokyo, Japan). For visualization of the spinal vasculature, a bolus of Qdot605 (2 μmol/L in 50 μL buffered solution; Invitrogen, Carlsbad, CA, USA) was injected from tail vein. Mice were put in lateral decubitus position, and the spinal column was stabilized by placing two of the spinal clamps along the anterior—posterior axis using stabilized devise as described in previous report (Davalos et al, 2008) with some modifications. A small well of Gelseal (GE HealthCare, Milwaukee, WI, USA) was built around the exposed spinal cord and filled with physiological saline, followed by immersion of × 20 objective lens (0.5 Na; Leica Microsystems, Wetzlar, Germany). The spinal vasculature was visualized with multiphoton excitation fluorescent microscope (TSC SP5; Leica Microsystems) at 900-nm excitation (Mai Tai HP; Spectra-Physics, Santa Clara, CA, USA) with an emission band-pass filter of 655/50 nm. Images were captured toward anterior horn (AH) region up to 500 μm depth from the spinal surface with a step size of 0.01 mm in the z-direction. A single capillary was defined as the single vessel having crosssectional thickness <8 μm and for both edges continued to two new vessels as a branching, and the capillary diameter was measured using LAS AF software (Leica Microsystems). Capillary density was measured as percentage of area using ImageJ software (National Institutes of Health, Bethesda, MD, USA). For creation of Figures 1A–1D, each image was converted to TIFF format using LAS AF software and three continuous images were merged using photoshop software (Adobe, San Jose, CA, USA). The red blood cell (RBC) velocity was measured by tracking RBC that appeared as dark segment against brilliant plasma background through single capillary. Time-lapse images were obtained by line scan in each single flame, and image processing and calculation of average RBC velocity in each capillary were performed as described (Autio et al, 2011).
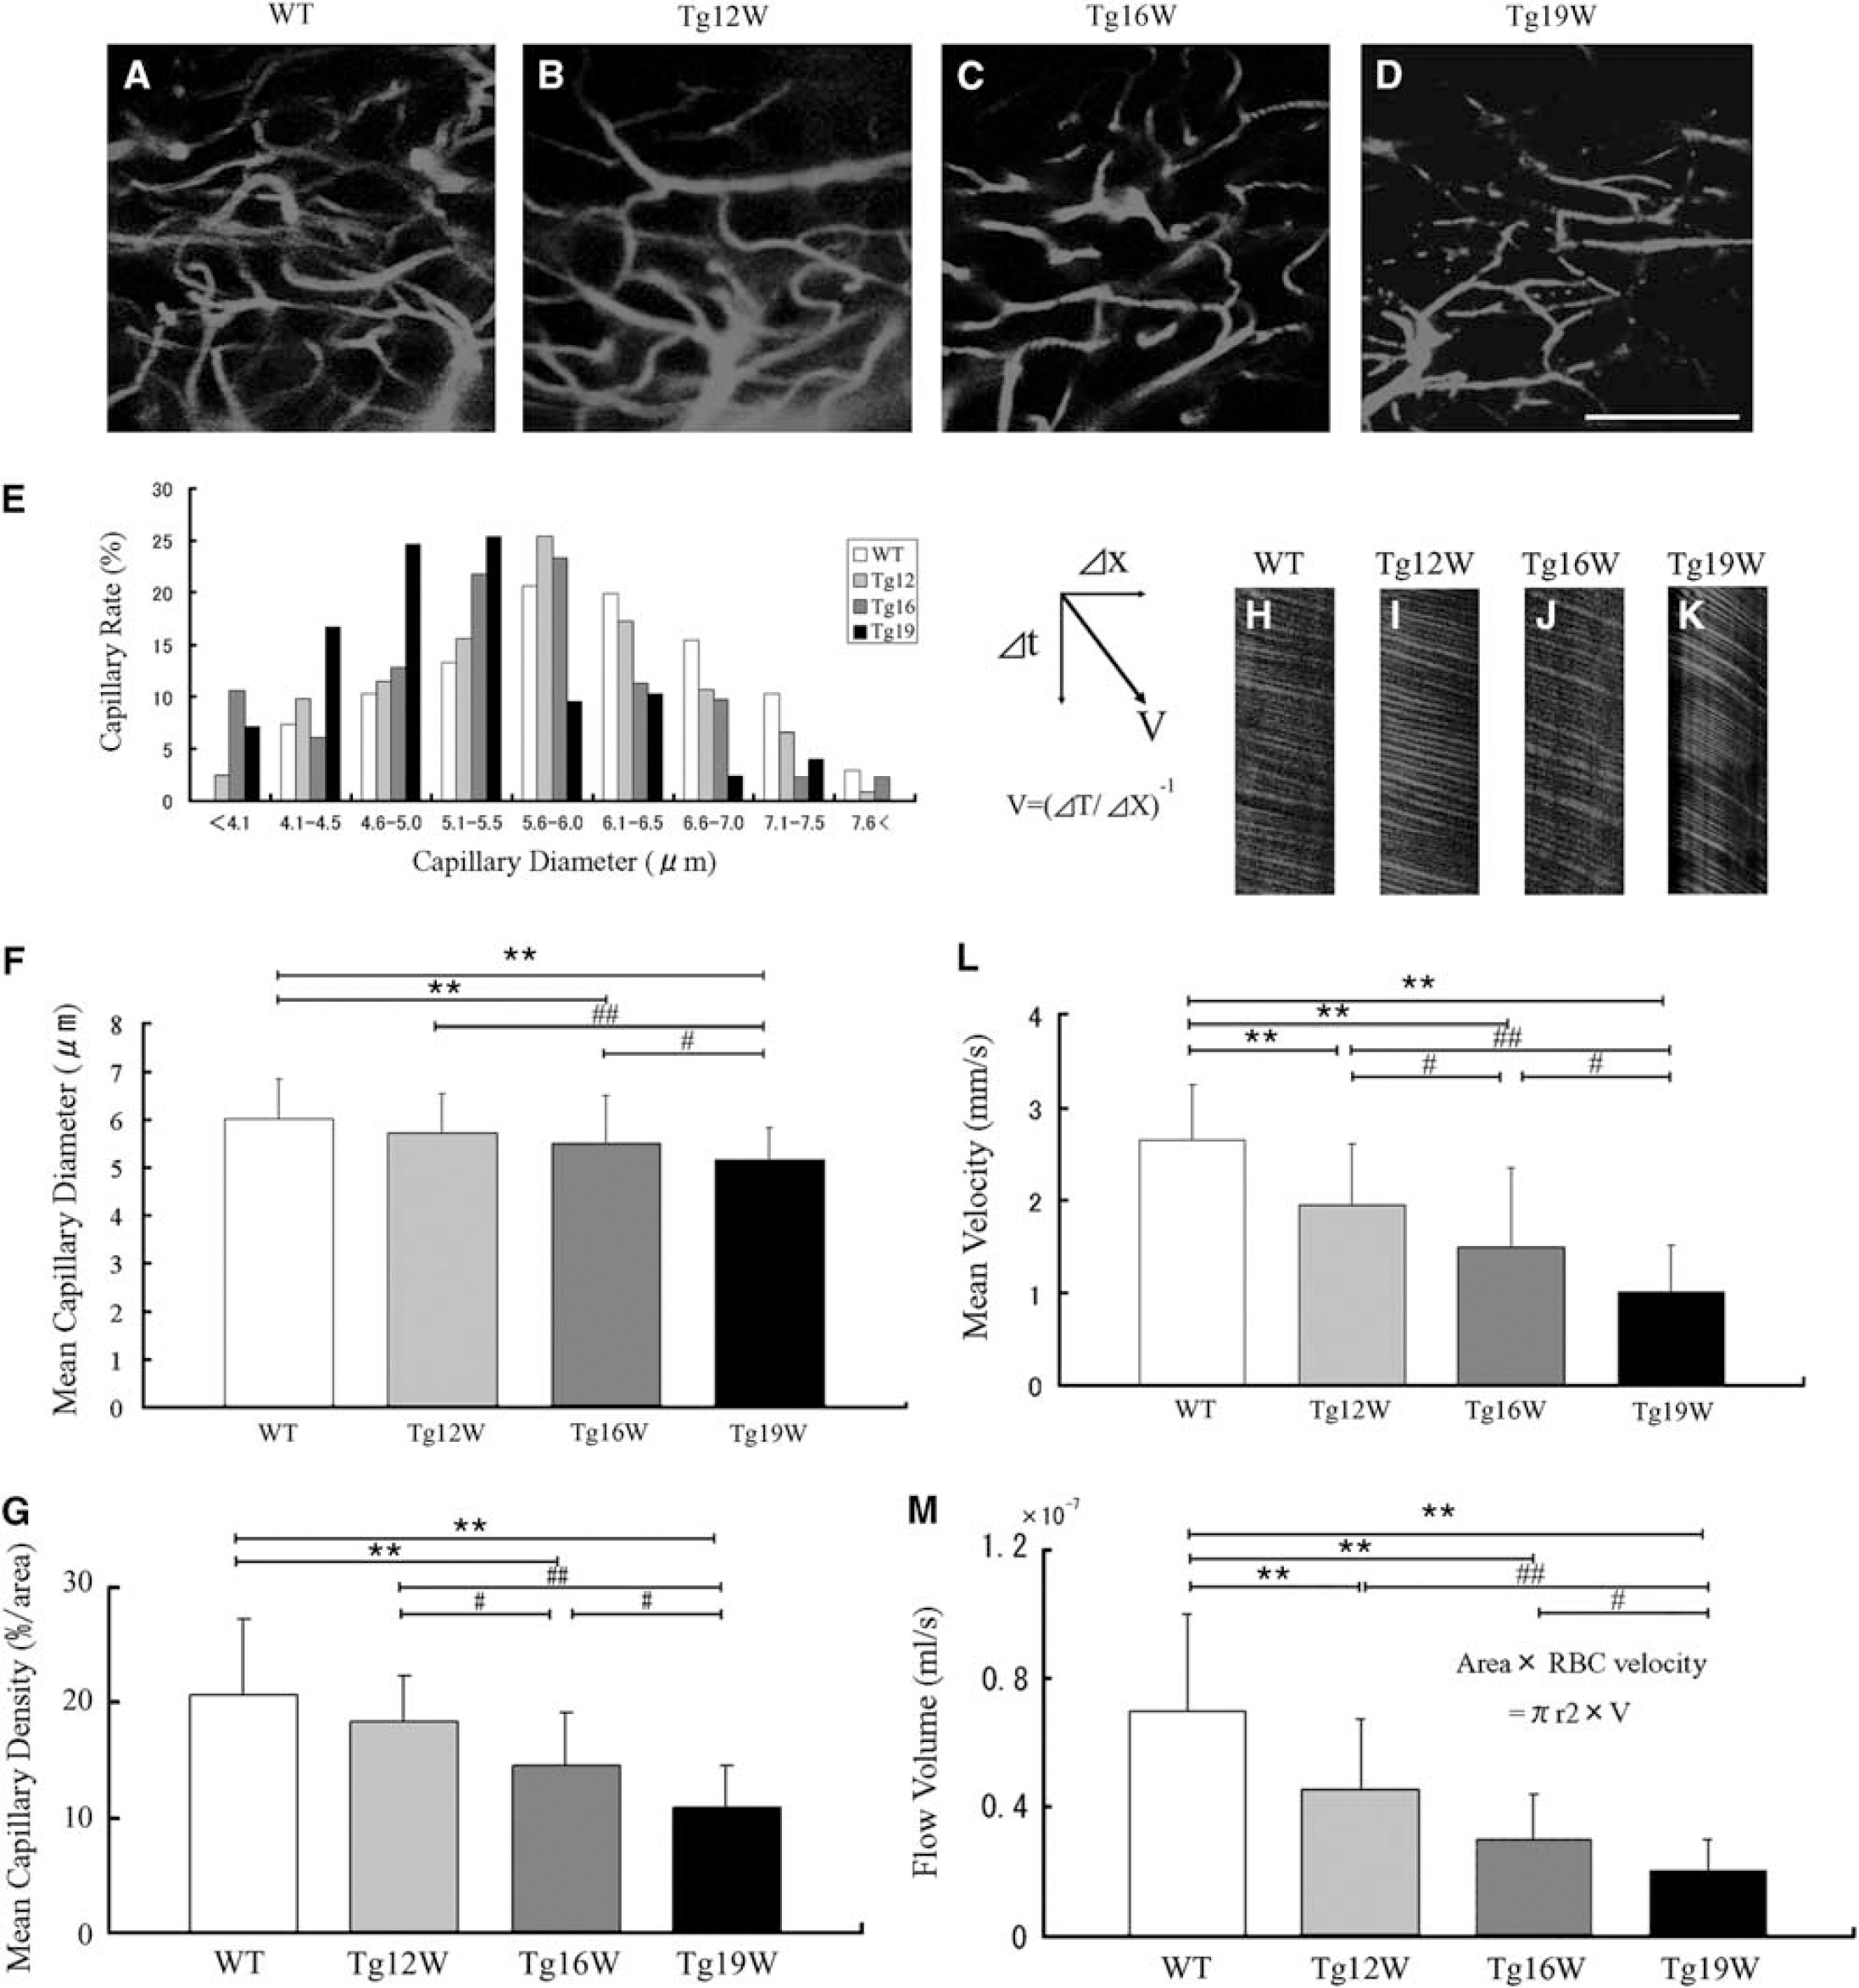
In vivo capillary vessel imaging in the anterior horn (AH) of lumbar cord in wild-type (WT; 19 W;
Histological Pathology
For histological pathology, 12, 16, and 19 W Tg mice (n=5 at each W), and 19 W WT littermates (n=5) were used. Each mouse was deeply anesthetized and transcardially perfused with heparinized saline, followed by 4% paraformaldehyde in 0.1 M phosphate buffer (pH 7.4). The lumbar spinal cord spanning L4–5 was removed and further fixed by immersion in the same fixative for 4 hours and then frozen after cryoprotection with a series of phosphate-buffered sucrose solutions of increasing concentration (10%, 15%, and 20%). Transverse sections of 12 μm thickness were cut through the lumbar cord with a cryostat following cresyl violet staining (Nissl stain).
Measurement of Spinal Blood Flow
For the measurement of spinal blood flow (SBF), 12, 16, and 19 W of Tg mice (n=6, 5, 5 at each W), and age-matched WT littermates (n=5 at each W) were used. Prior to experiment, HR (heart rate) and blood pressure (SBP (systolic blood pressure), MBP (mean blood pressure), and DBP (diastolic blood pressure)) were measured by tail-cuff method in each mouse (PB-98A; Softron, Tokyo, Japan). Spinal blood flow was determined by the standard autoradiographic 14C-iodoantipyrine (IAP) method as described (Sakurada et al, 1978) modified for mice (Jay et al, 1988). Briefly, the animals were initially anesthetized with 2% isoflurane and maintained with 1% in 69% N2O/30% O2, and polyethylene catheters (Neuroscience, Tokyo, Japan) were inserted into the left femoral artery and vein. Arterial blood was collected, and physiological parameters such as Hct (hematocrit), Hb (hemoglobin), pH, PO2, PCO2, and HCO3 were measured (iSTAT300F, Fuso Pharmaceutical Industries, Osaka, Japan). 14C-IAP (5 μCi in 100 μL of physiological saline; Perkin-Elmer Life and Analytical Sciences, Boston, MA, USA) was injected continuously via the femoral venous catheter. During injection, timed arterial blood was collected in preweighed tubes, and volume was calculated. Blood samples were resolved in tissue solubilizer (Perkin-Elmer), reacted with hydrogen peroxide to reduce quenching, added 3 mL of scintillation fluid (Clear-Sol II, Nacalai tesque, Kyoto, Japan), and 14C-IAP concentration was determined using liquid scintilation counter (TRICARB; Packard Instrument, Downers Grove, IL, USA). Precisely 1 minute after the IAP injection, mice were decapitated. The spinal cords were rapidly removed, frozen on a powdered dry ice, cut into 20 μm sections on a cryostat, and dried on a hot plate at 55°C. The sections were subject to autoradiography with 14C-standards on an imaging plate (BAS-SR, Fujifilm, Tokyo, Japan) for 7 days, and autoradiograms were captured by image reader (FLA-7000, Fujifilm). Local tissue 14C-concentrations were determined according to standards using densitometric analysis software (Multi Gauge Ver3.0, Fujifilm). The regions of interest were placed on five regions in gray matter (GM) (right and left AH, middle region of AH, right and left dorsal horn (DH)), and four regions in white matter (WM) (anterior funiculus, right and left lateral funiculus, and dorsal funiculus). Local SBF was calculated from the tissue concentration of 14C-IAP and timed tracer concentration in the arterial blood according to the operational equation as described (Sakurada et al, 1978). Mean SBF for each region was determined by three contiguous sections in each regions of interest.
Measurement of Local Spinal Glucose Utilization
With a different set of mice group, 12, 16, and 19 W of Tg mice (n=6, 5, 5 at each W, and age-matched WT (n=5 at each W), were used for the measurement of local spinal glucose utilization (LSGU). Local spinal glucose utilization was determined by the standard autoradiographic 14C-2-deoxyglucose (DG) method as described (Sokoloff, 1977). Briefly, the animals were inserted catheter under isoflurane condition. 14C-2DG (3 μCi in 50 μL of physiological saline; Perkin-Elmer) was intravenously injected, and timed arterial blood was collected. The blood samples were centrifuged, and plasma glucose (Glucose analyzer, Pilot) and tracer 14C-concentrations (Liquid Scintillaqtion Counter, Packard Instrument) were determined. After 45 minutes experimental period, spinal cords were removed, sectioned, and autoradiography was performed as described above. The setting of regions of interest and densitometric methodology were as same as SBF measurement described as above. Local spinal glucose utility was calculated from the tissue concentration of 14C-2DG, timed tracer concentration and glucose concentration in the arterial plasma according to the operational equation with a lumped constant for rat as described (Sokoloff, 1977). Mean LSGU for each region was determined by three contiguous sections in each regions of interest.
Statistical Analysis
For the in vivo imaging analysis, differences among the each group were evaluated with one-way analysis of variance with normal distribution followed by the Tukey—Kramer test. Statistical differences in the physiological parameters, SBF, and LSGU analyses between the age-matched WT and Tg mice were evaluated by Student's t-test with normal distribution. A probability value <0.05 was regarded as statistically significant. Parametric data were presented as mean±s.d.
Results
Physiological Parameters
There was no significant difference in physiological parameters (HR, SBP, MBP, DBP, Hct, Hb, pH, PO2, PCO2, and HCO3) in Tg mice compared with age-matched WT mice (Table 1).
Physiological parameter
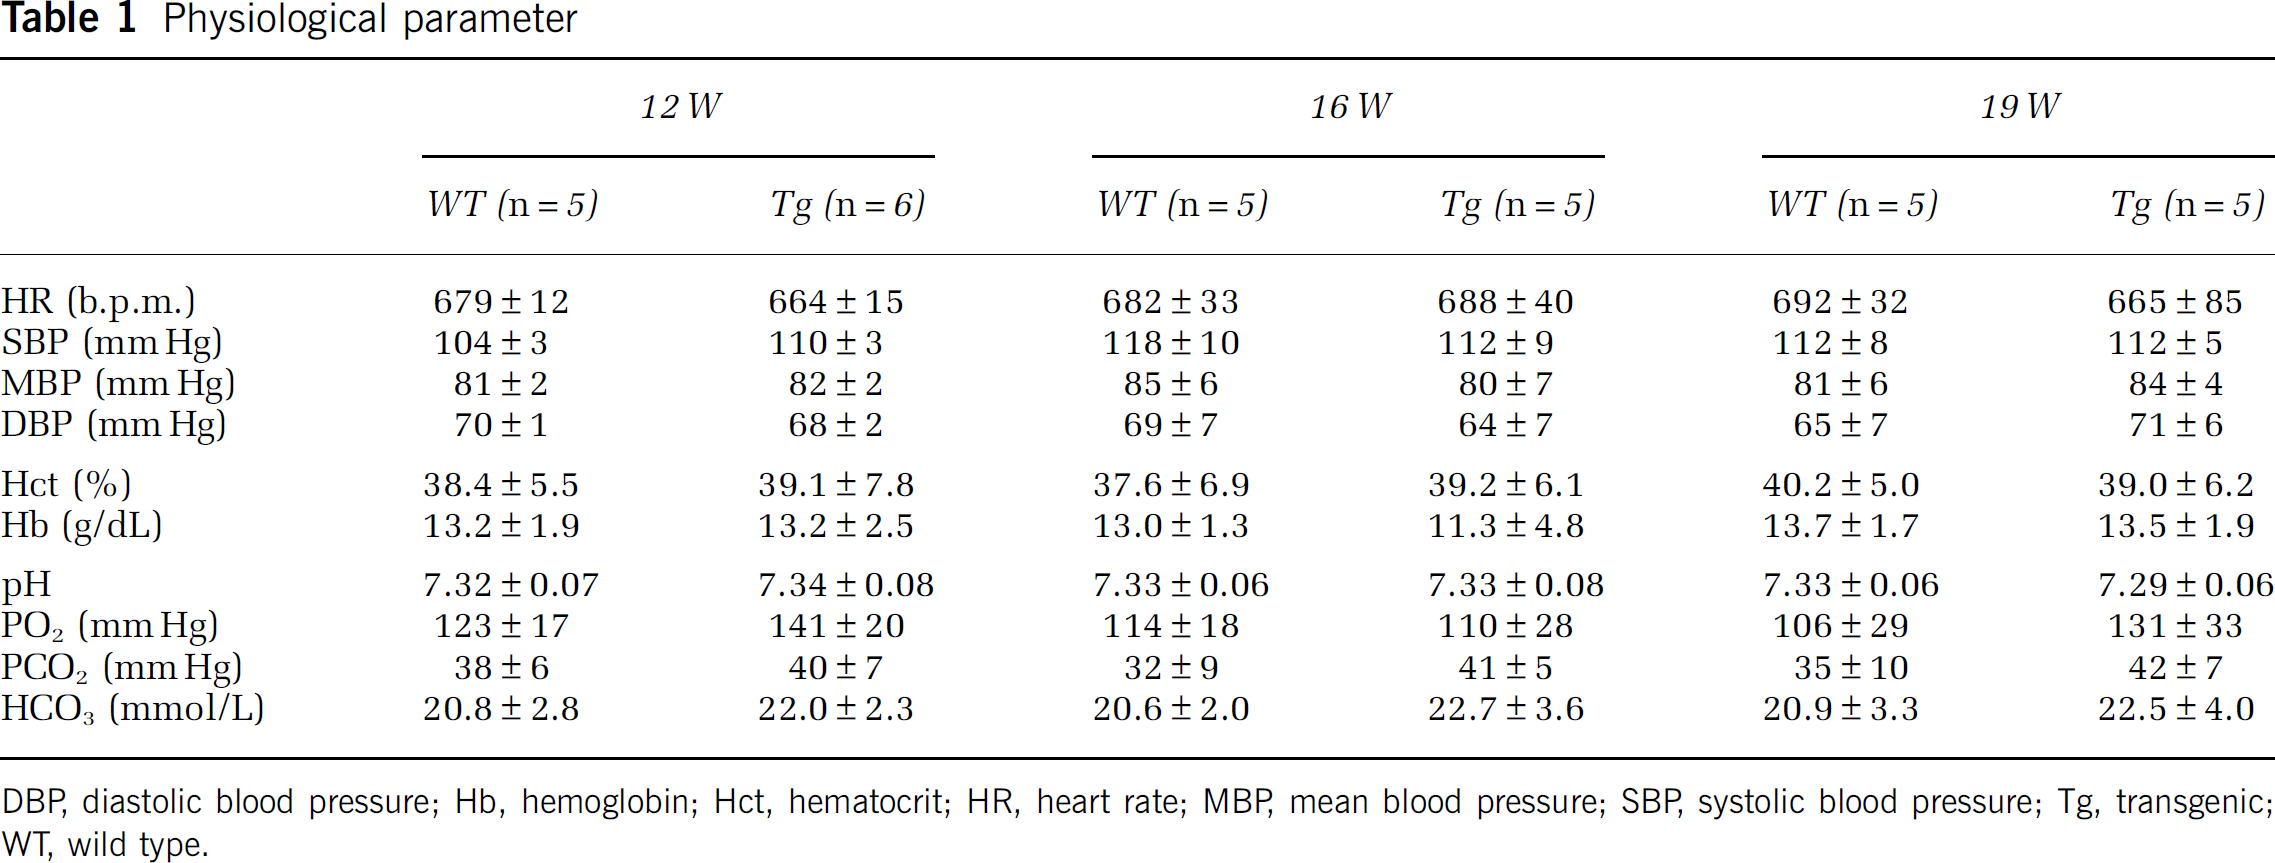
DBP, diastolic blood pressure; Hb, hemoglobin; Hct, hematocrit; HR, heart rate; MBP, mean blood pressure; SBP, systolic blood pressure; Tg, transgenic; WT, wild type.
In Vivo Imaging of Spinal Capillary Vessels
There were considerable amount of blood vessel capillaries in the lumbar spinal GM of the WT with a diameter <8 μm (Figure 1A), but less dense in the (WM) (data not shown). The diameter of capillary vessels apparently became smaller in Tg mice with disease progression, and density of the capillary vessels progressively became lower (Figures 1B–1D). The histograms of capillary diameter gradually shifted from the right (large) to the left (small) with age in Tg mice (Figure 1E, gray to black bars), with the average of capillary diameter of progressive smaller among WT, Tg12, Tg16, and Tg19 W of 6.01±0.84 μm, 5.72±0.81 μm, 5.50±0.99 μm (∗∗P<0.01 versus WT), and 5.16±0.68 μm (∗∗P<0.01 versus WT, ##P<0.01 versus Tg12, #P<0.05 versus Tg16) (Figure 1F). Mean capillary density measured as percentage of area showed progressive decrease from 20.7% in WT mice to 18.3% in Tg12 W, 14.6% in Tg16 W (∗∗P<0.01 versus WT, #P<0.05 versus Tg12), and 10.8% in Tg19 W (∗∗P<0.01 versus WT, ##P<0.01 versus Tg12, and #P<0.05 versus Tg16) (Figure 1G). The mean RBC speed in a single capillary significantly decreased with disease progression (Figures 1H–1L), from 2.66±0.59 mm/s of WT to 1.95±0.65 mm/s of Tg12 W (∗∗P<0.01 versus WT), 1.50±0.85 mm/s of Tg16 W (∗∗P<0.01 versus WT, #P<0.05 versus Tg12), and 1.01±0.51 mm/s of Tg19 W (∗∗P<0.01 versus WT, ##P<0.01 versus Tg12, and #P<0.05 versus Tg16), respectively. Flow volume was calculated from RBC velocity and diameter in each capillary, and showed significant decrease with disease progression in 0.70±0.30 10−7 mL/s in WT, 0.46±0.21 10−7 mL/s in Tg12 W (∗∗P<0.01 versus WT), 0.30±0.14 × 10⁻⁷ mL/s in Tg16 W (∗∗P<0.01 versus WT), and 0.20±0.10 10−7 mL/s in Tg19 W (∗∗P<0.01 versus WT, ##P<0.01 versus Tg12, and #P<0.05 versus Tg16), respectively (Figure 1M).
Histological Analysis
Nissl staining of the lumbar cord revealed that there were a number of large motor neurons in the AH of WT mice (Figure 2A). Although the number of motor neuron of Tg mice was similar to that of WT mice at 12 W (Figure 2B), it decreased progressively to ∼78% of WT level at 16 W (∗P<0.05), and 35% at 19 W (∗∗P<0.01) (Figures 2C and 2D).
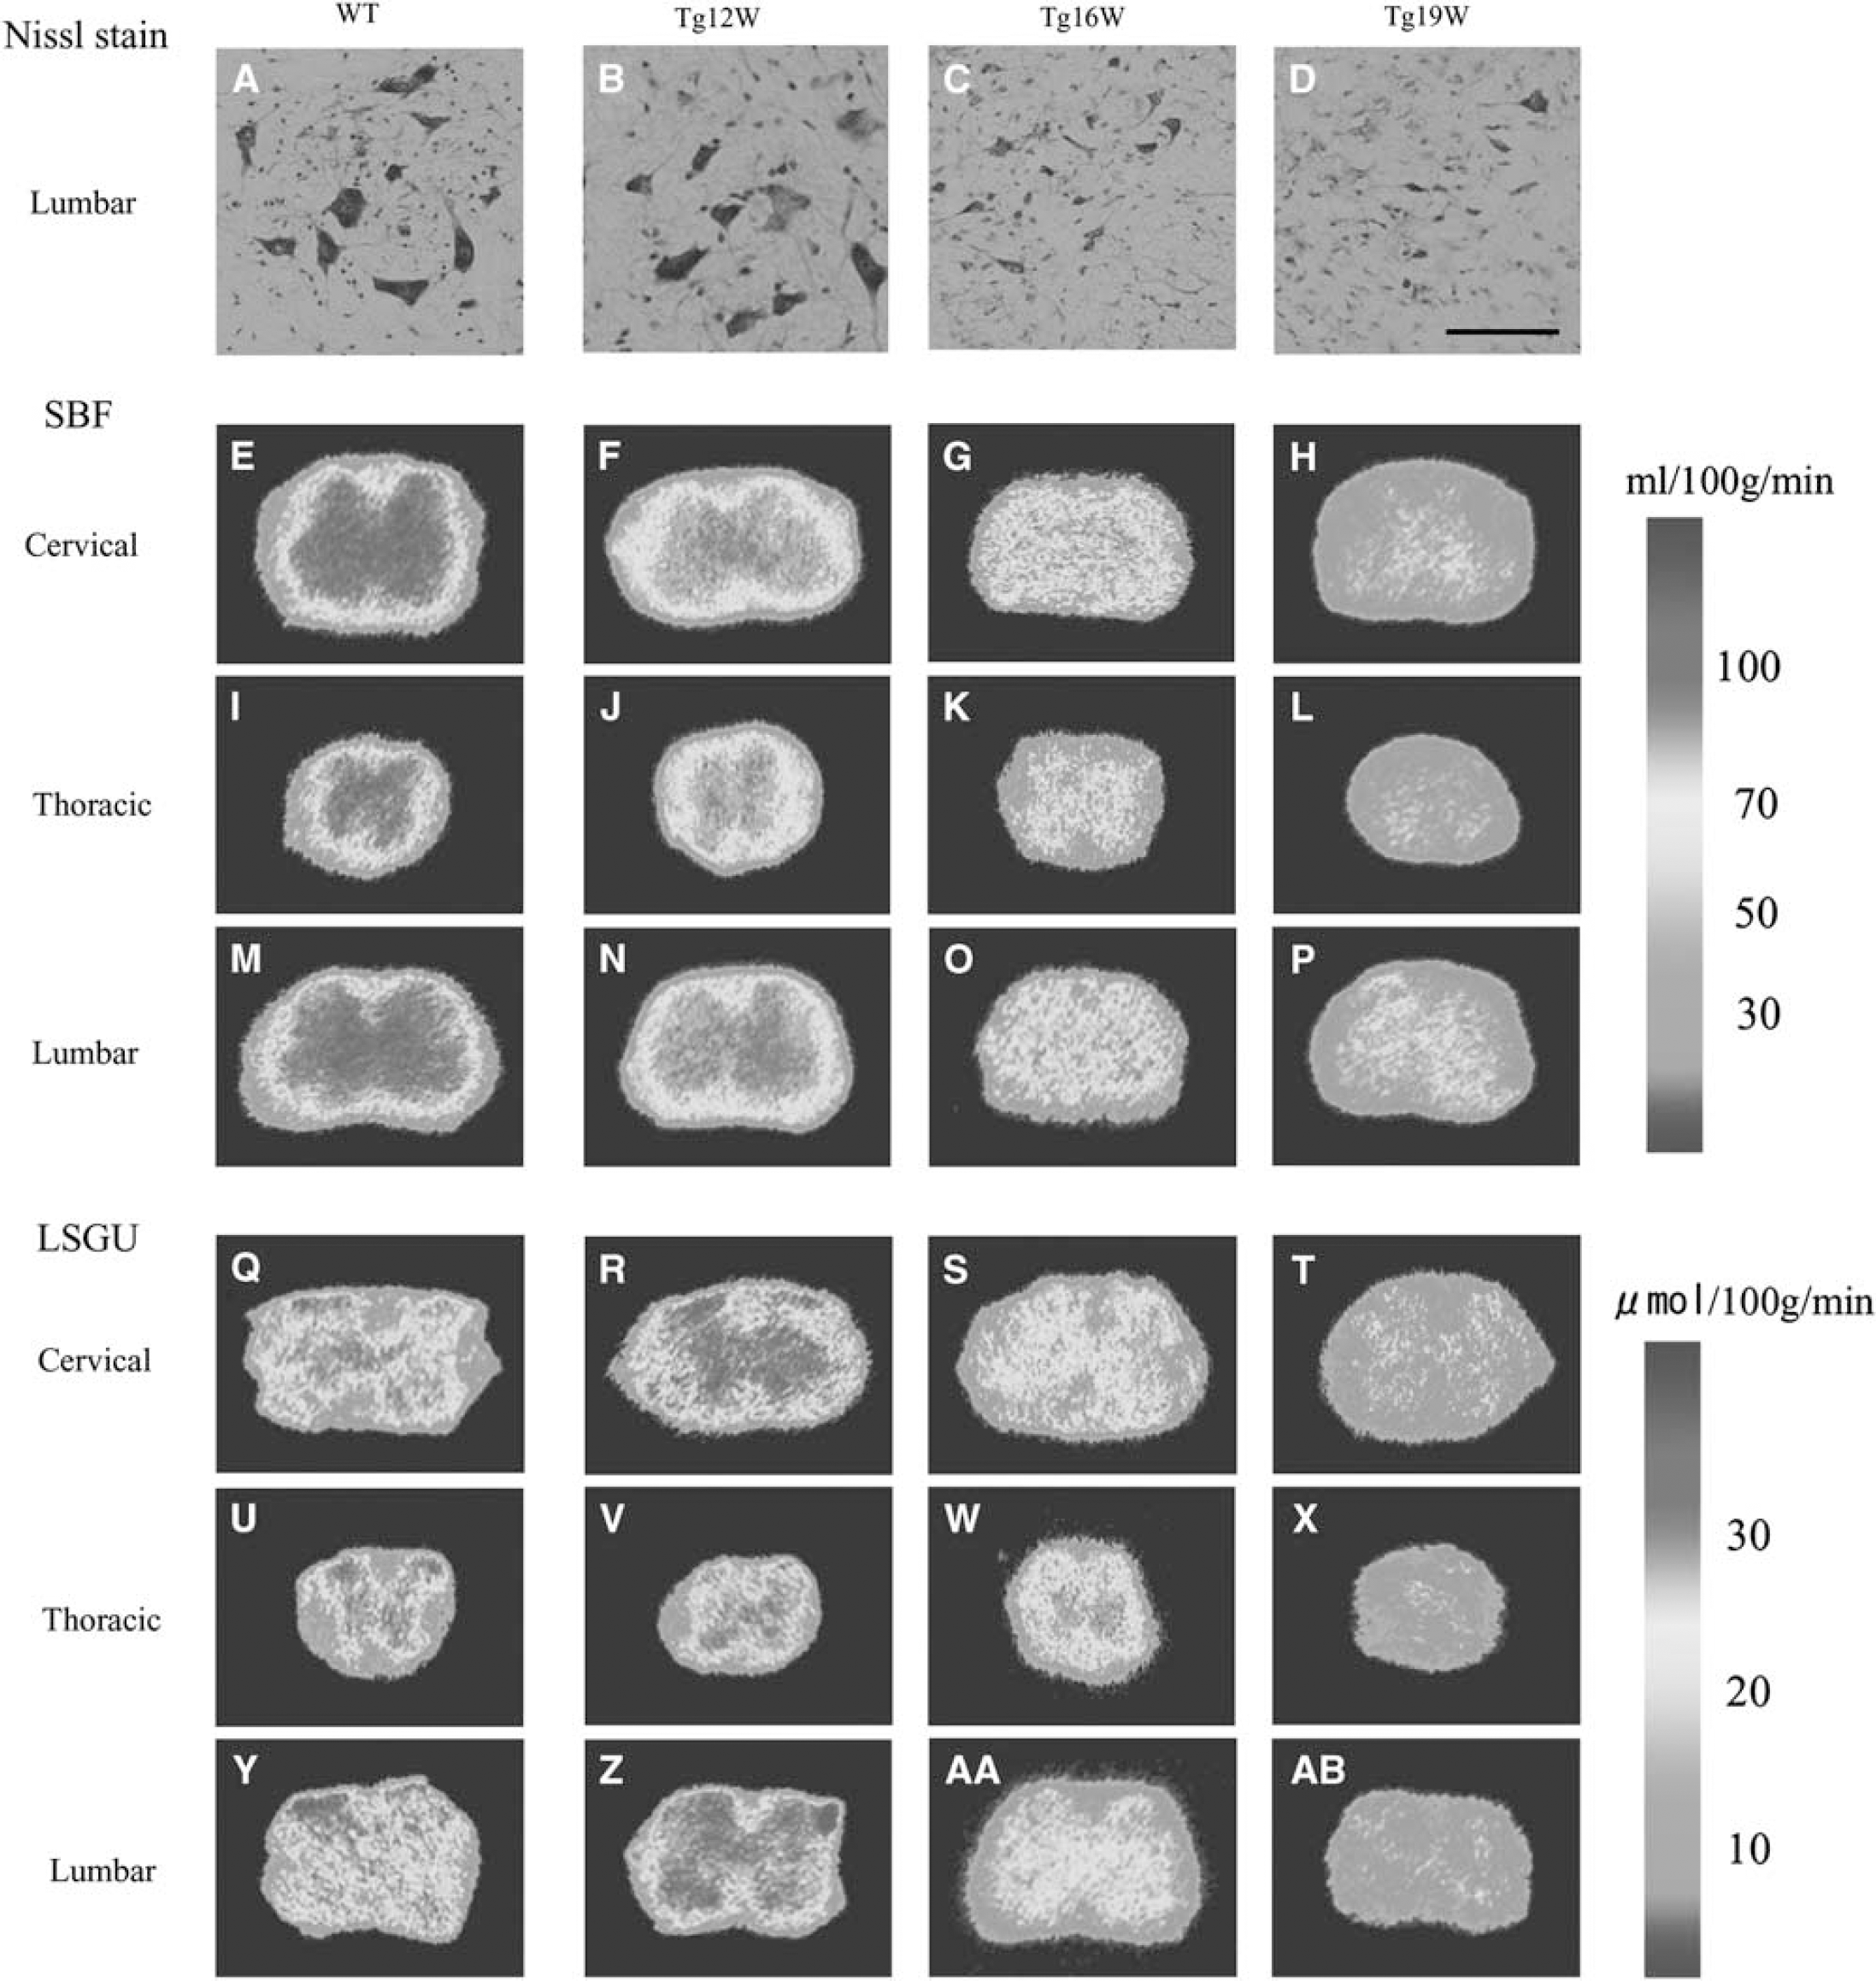
Nissl staining in anterior horn (AH) of lumbar cord in wild-type (WT) and transgenic (Tg) mice (
Spinal Blood Flow
In WT mice, SBF of GM was much higher than that of WM, and was slightly increased with normal aging from 12 to 19 W (Table 2; Figures 2E, 2I, 2M, and 3A–3I). Anterior horn showed a trend toward higher SBF than DH in cervical, thoracic, and lumbar regions (Table 2). As compared with age-matched WT mice, significant reduction of SBF was found in GM of Tg mice as early as 12 W, especially AH of cervical (−20%, ∗∗P<0.01 in AH; −15%, ∗∗P<0.01 in DH), thoracic (−16%, ∗P<0.05 in AH), and lumbar cord (−24%, ∗∗P<0.01 in AH; −18%, ∗∗P<0.01 in DH), except for dorsal region of thoracic cord (Table 2; Figures 2F, 2J, 2N, 3A, 3D, and 3G). In contrast, there were no significant changes of SBF in any region of WM at 12 W. At 16 W of Tg mice, the reduction of SBF was progressively exacerbated in GM, and the reduction rate of SBF was prominent in AH (−39%, −32%, and −45% in cervical, thoracic, and lumbar cord, respectively, ∗∗P<0.01 in each), and not so prominent in DH (−23%, −20%, and −32% in cervical, thoracic, and lumbar cord, respectively, ∗∗P<0.01 in each), resulting in dissociative reduction of SBF between AH and DH (Table 2; Figures 2G, 2K, 2O, 3B, 3E, and 3H). There was no significant difference of SBF in WM too at this 16 W. At 19 W of Tg mice, the reduction of SBF in GM was further aggravated in cervical (−52%, ∗∗P<0.01 in AH; −48%, ∗∗P<0.01 in DH), thoracic (−41%, ∗∗P<0.01 in AH; −35%, ∗∗P<0.01 in DH), and lumbar cord (−56%, ∗∗P<0.01 in AH; −50%, ∗∗P<0.01 in DH) (Table 2; Figures 2H, 2L, 2P, 3C, 3F, and 3I). At this 19 W, SBF was only slightly reduced in WM especially lateral funiculus of cervical (−22%, ∗∗P<0.01) and lumbar cord (−23%, ∗∗P<0.01).
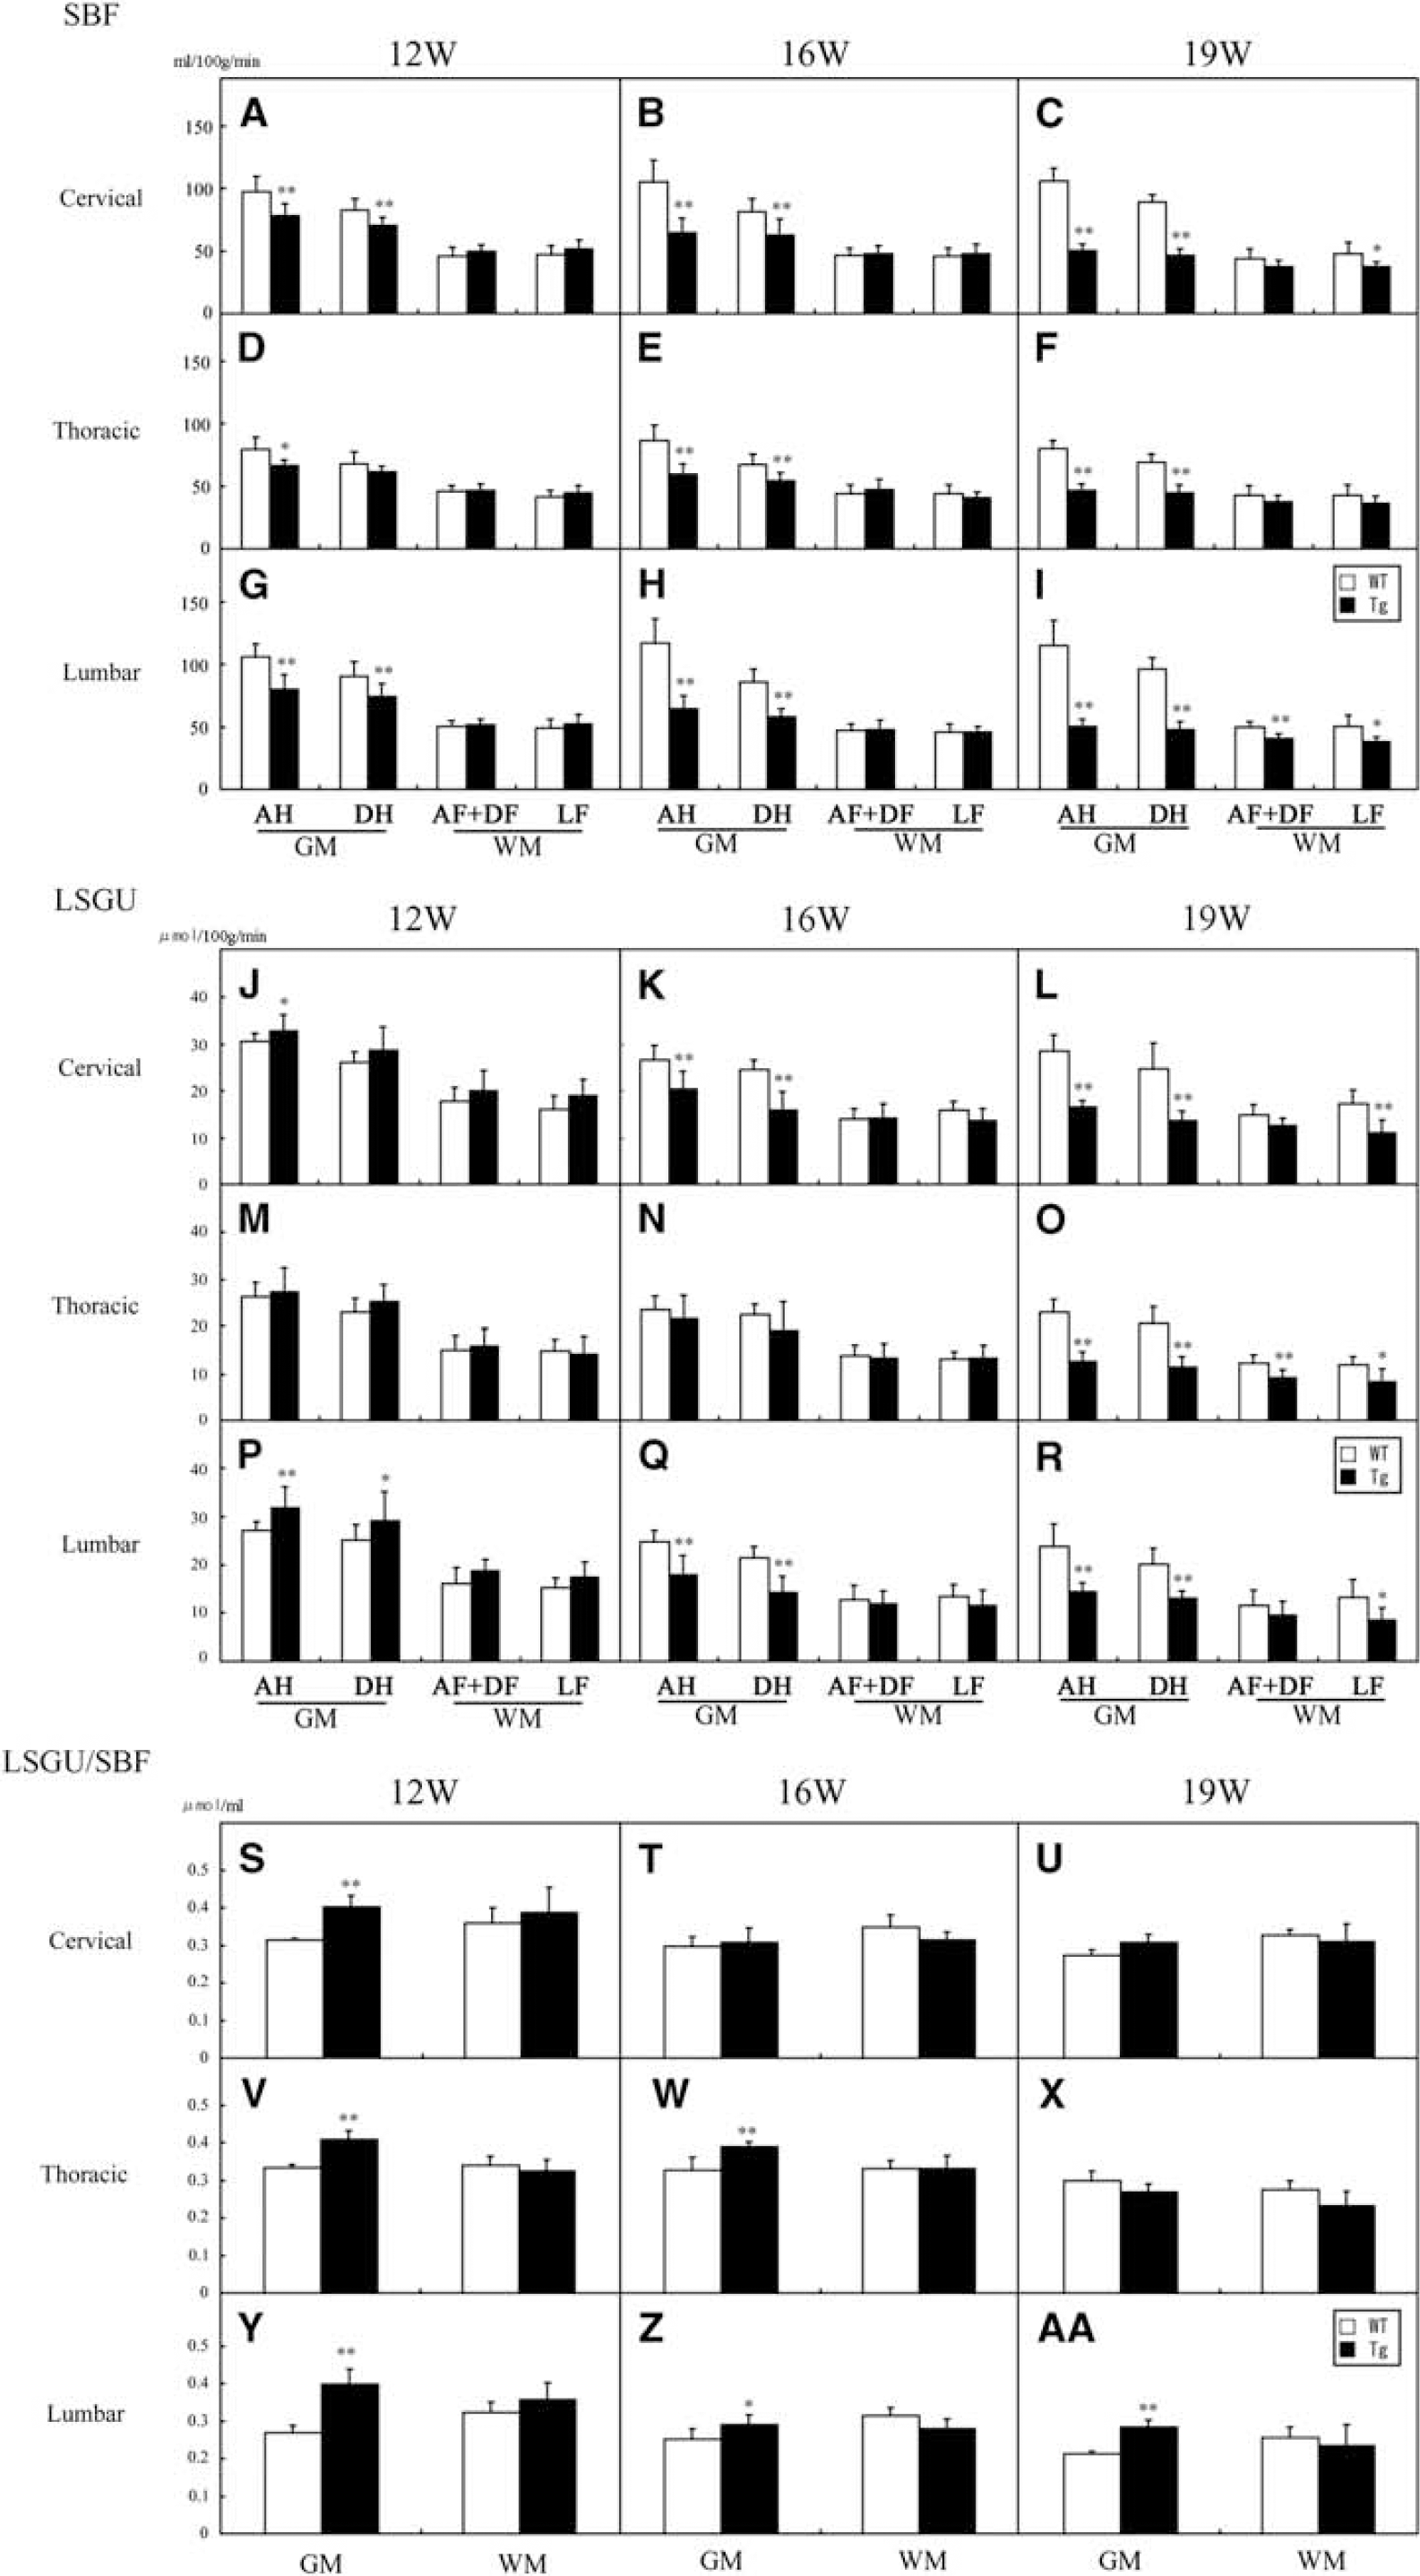
Regional spinal blood flow (SBF) in anterior horn (AH), dorsal horn (DH), anterior and dorsal funiculus (AF+DF), and lateral funiculus (LF) of cervical (
Spinal blood flow (SBF)
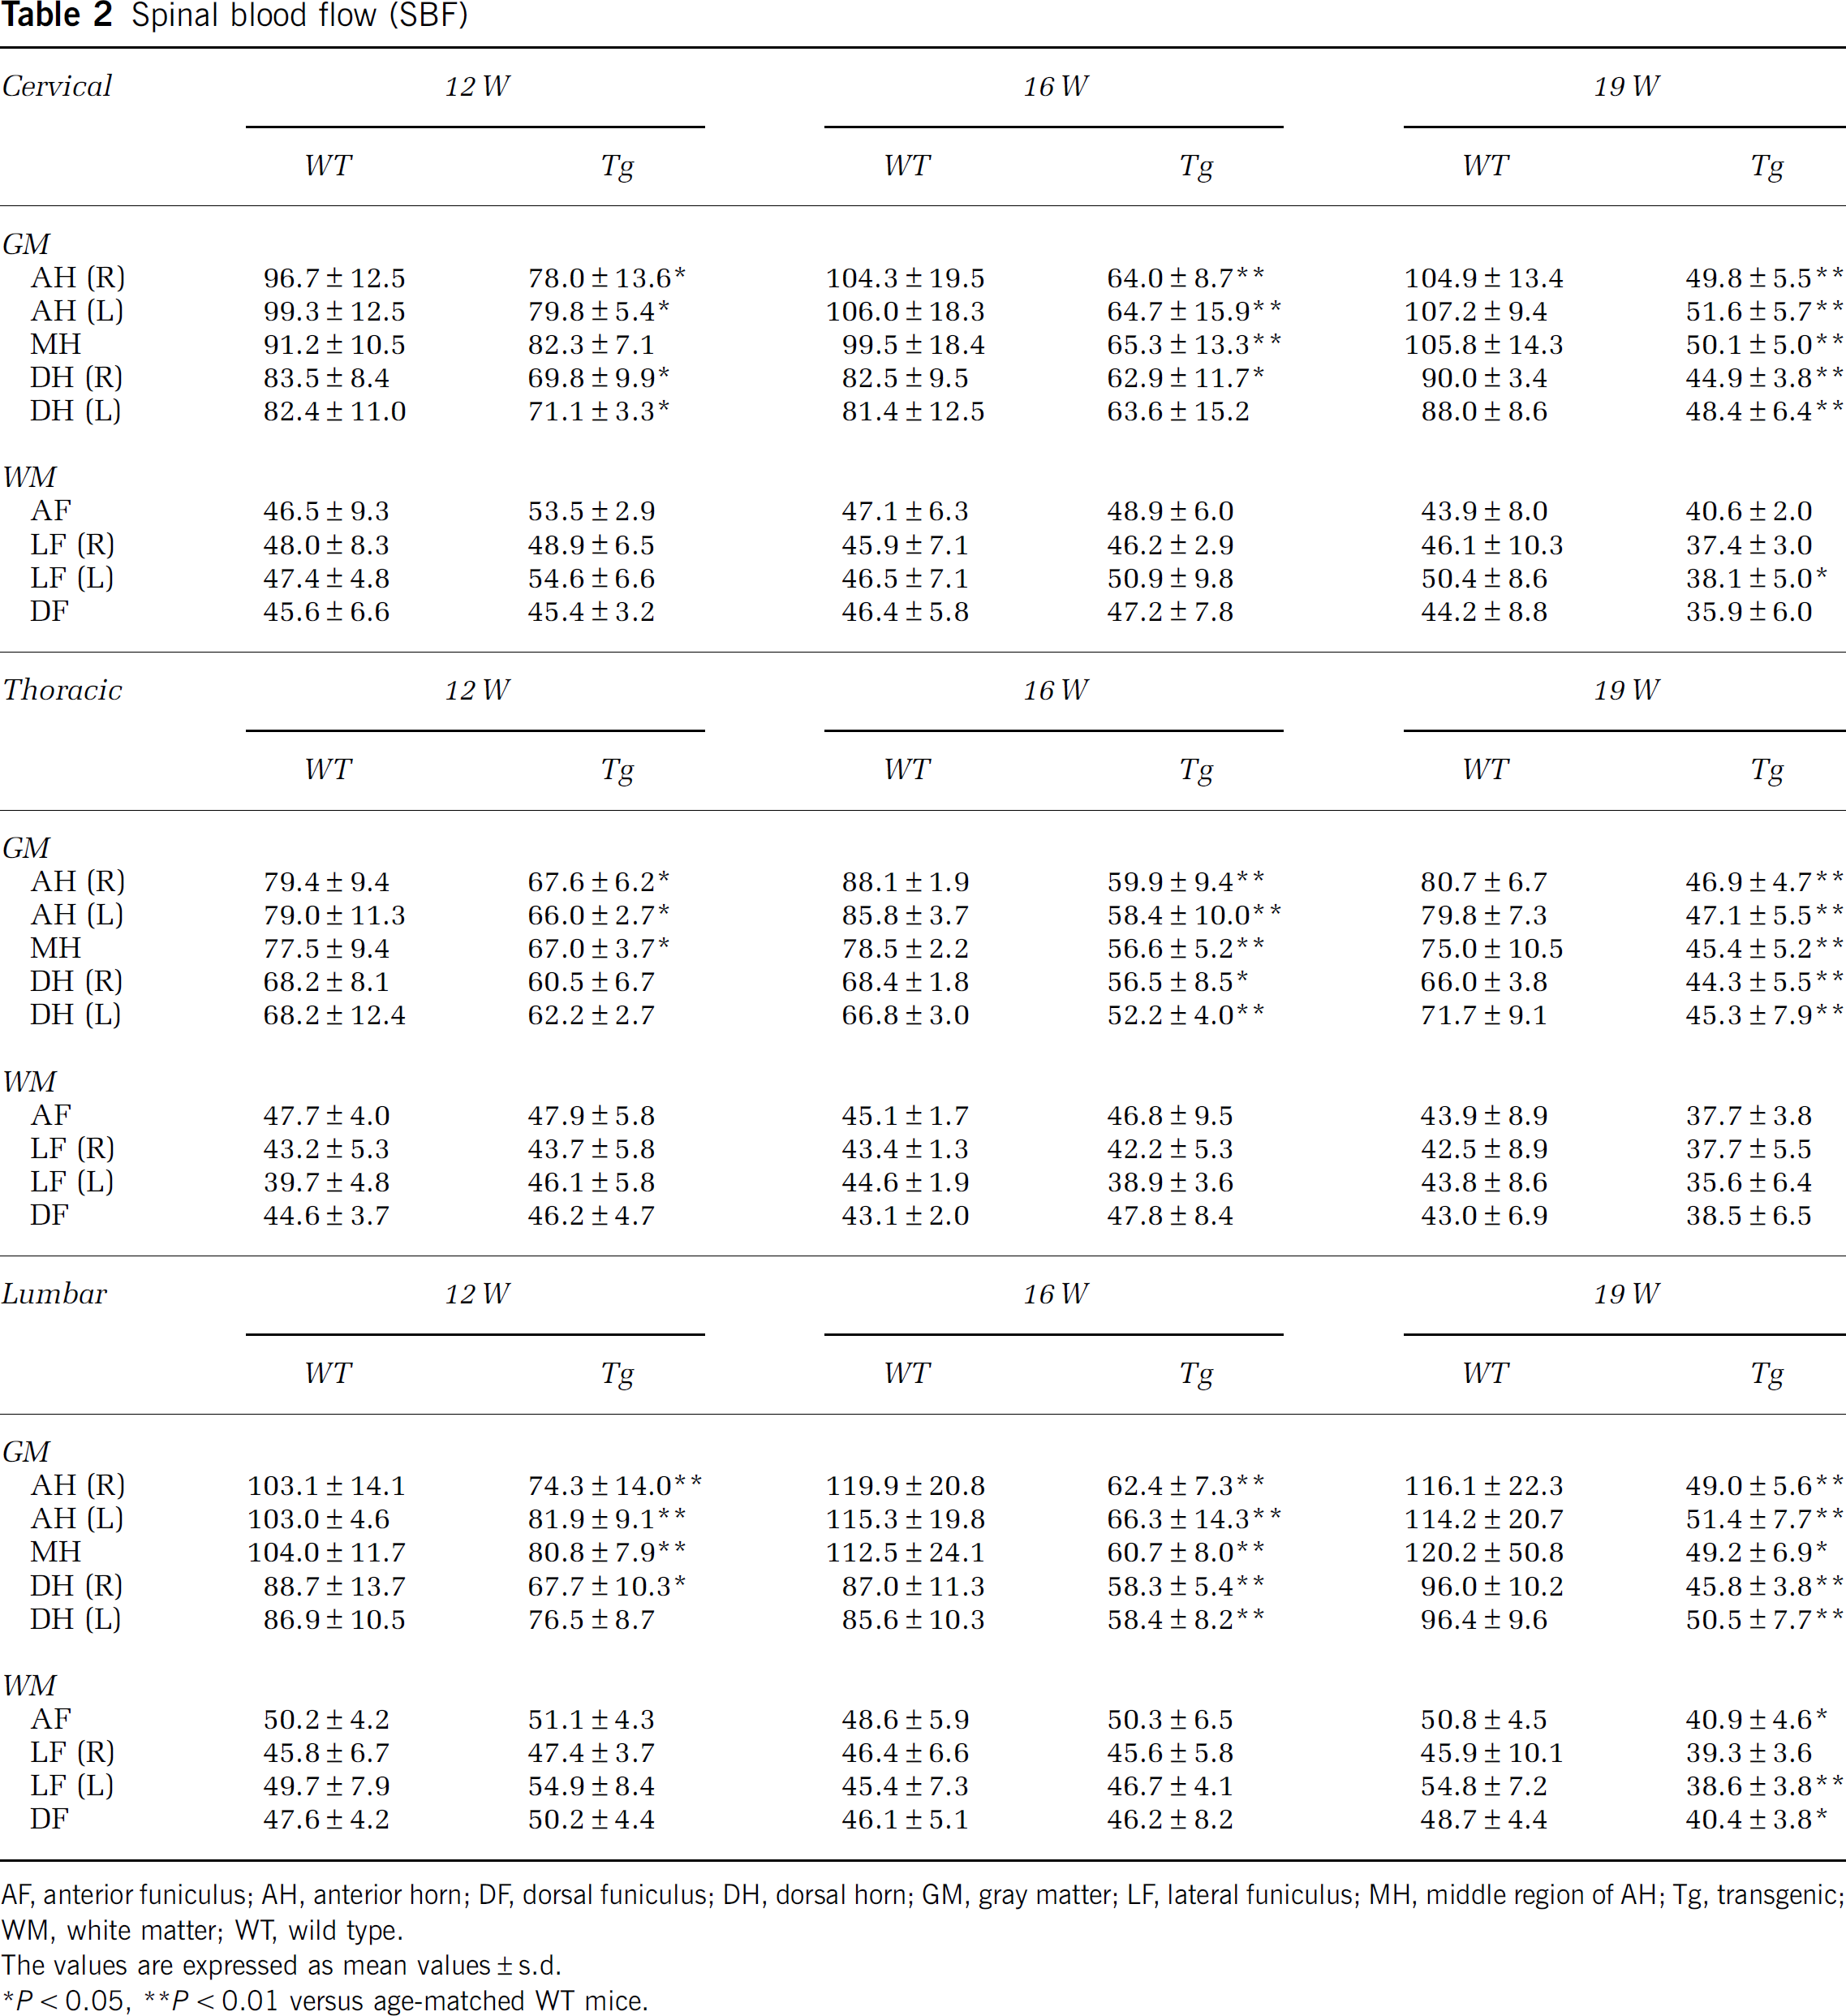
AF, anterior funiculus; AH, anterior horn; DF, dorsal funiculus; DH, dorsal horn; GM, gray matter; LF, lateral funiculus; MH, middle region of AH; Tg, transgenic; WM, white matter; WT, wild type.
The values are expressed as mean values±s.d.
∗P<0.05, ∗∗P<0.01 versus age-matched WT mice.
Local Spinal Glucose Utility
In WT mice, there were higher levels of LSGU in GM than WM of cervical, thoracic, and lumbar cords (Table 3; Figure 2Q, 2U, 2Y, 3J—R). The LSGU of AH had higher tendency than that of DH in each part of spinal cord, and LSGU were slightly decreased with normal aging from 12 to 19 W (Table 3). Transgenic mice at 12 W showed significant increases of LSGU in GMs of cervical (+8%, ∗P<0.05 in AH) and lumbar cord (+18%, ∗∗P<0.01 in AH; +16%, ∗P<0.05 in DH) (Table 3; Figures 2R, 2V, 2Z, 3J, 3M, and 3P). No significant difference of LSGU was observed in GM of thoracic cord, or WM of all spinal cord regions at 12 W. In Tg mice at 16 W, significant reductions of LSGU were observed in GM regions of cervical (−23%, ∗∗P<0.01 in AH; −35%, ∗∗P<0.01 in DH) and lumbar spinal cord (−28%, ∗∗P<0.01 in AH; −33%, ∗∗P<0.01 in DH) (Table 3; Figures 2S, 2W, 2AA, 3T, 3W, and 3Z). There was no significant change in GM of thoracic cord and WM of all levels of spinal cord. In Tg mice at 19 W, the LSGU further decreased in GMs of cervical (−42%, ∗∗P<0.01 in AH; −45%, ∗∗P<0.01 in DH), thoracic cord (−45%, ∗∗P<0.01 in AH; −45%, ∗∗P<0.01 in DH), and lumbar cord (−40%, ∗∗P<0.01 in AH; −35%, ∗∗P<0.01 in DH) (Table 3; Figure 2T, 2X, 2AB, 3L, 3O, and 3R). Local spinal glucose utilization were slightly reduced in funiculus at this 19 W in cervical (−35%, ∗∗P<0.01 in lateral funiculus; −21%, ∗P<0.05 in dorsal funiculus), thoracic (−29%, ∗P<0.05 in anterior funiculus; −30%, ∗∗P<0.01 in lateral funiculus), and lumbar cord (−35%, ∗∗P<0.05 in lateral funiculus).
Local spinal glucose utilization (LSGU)
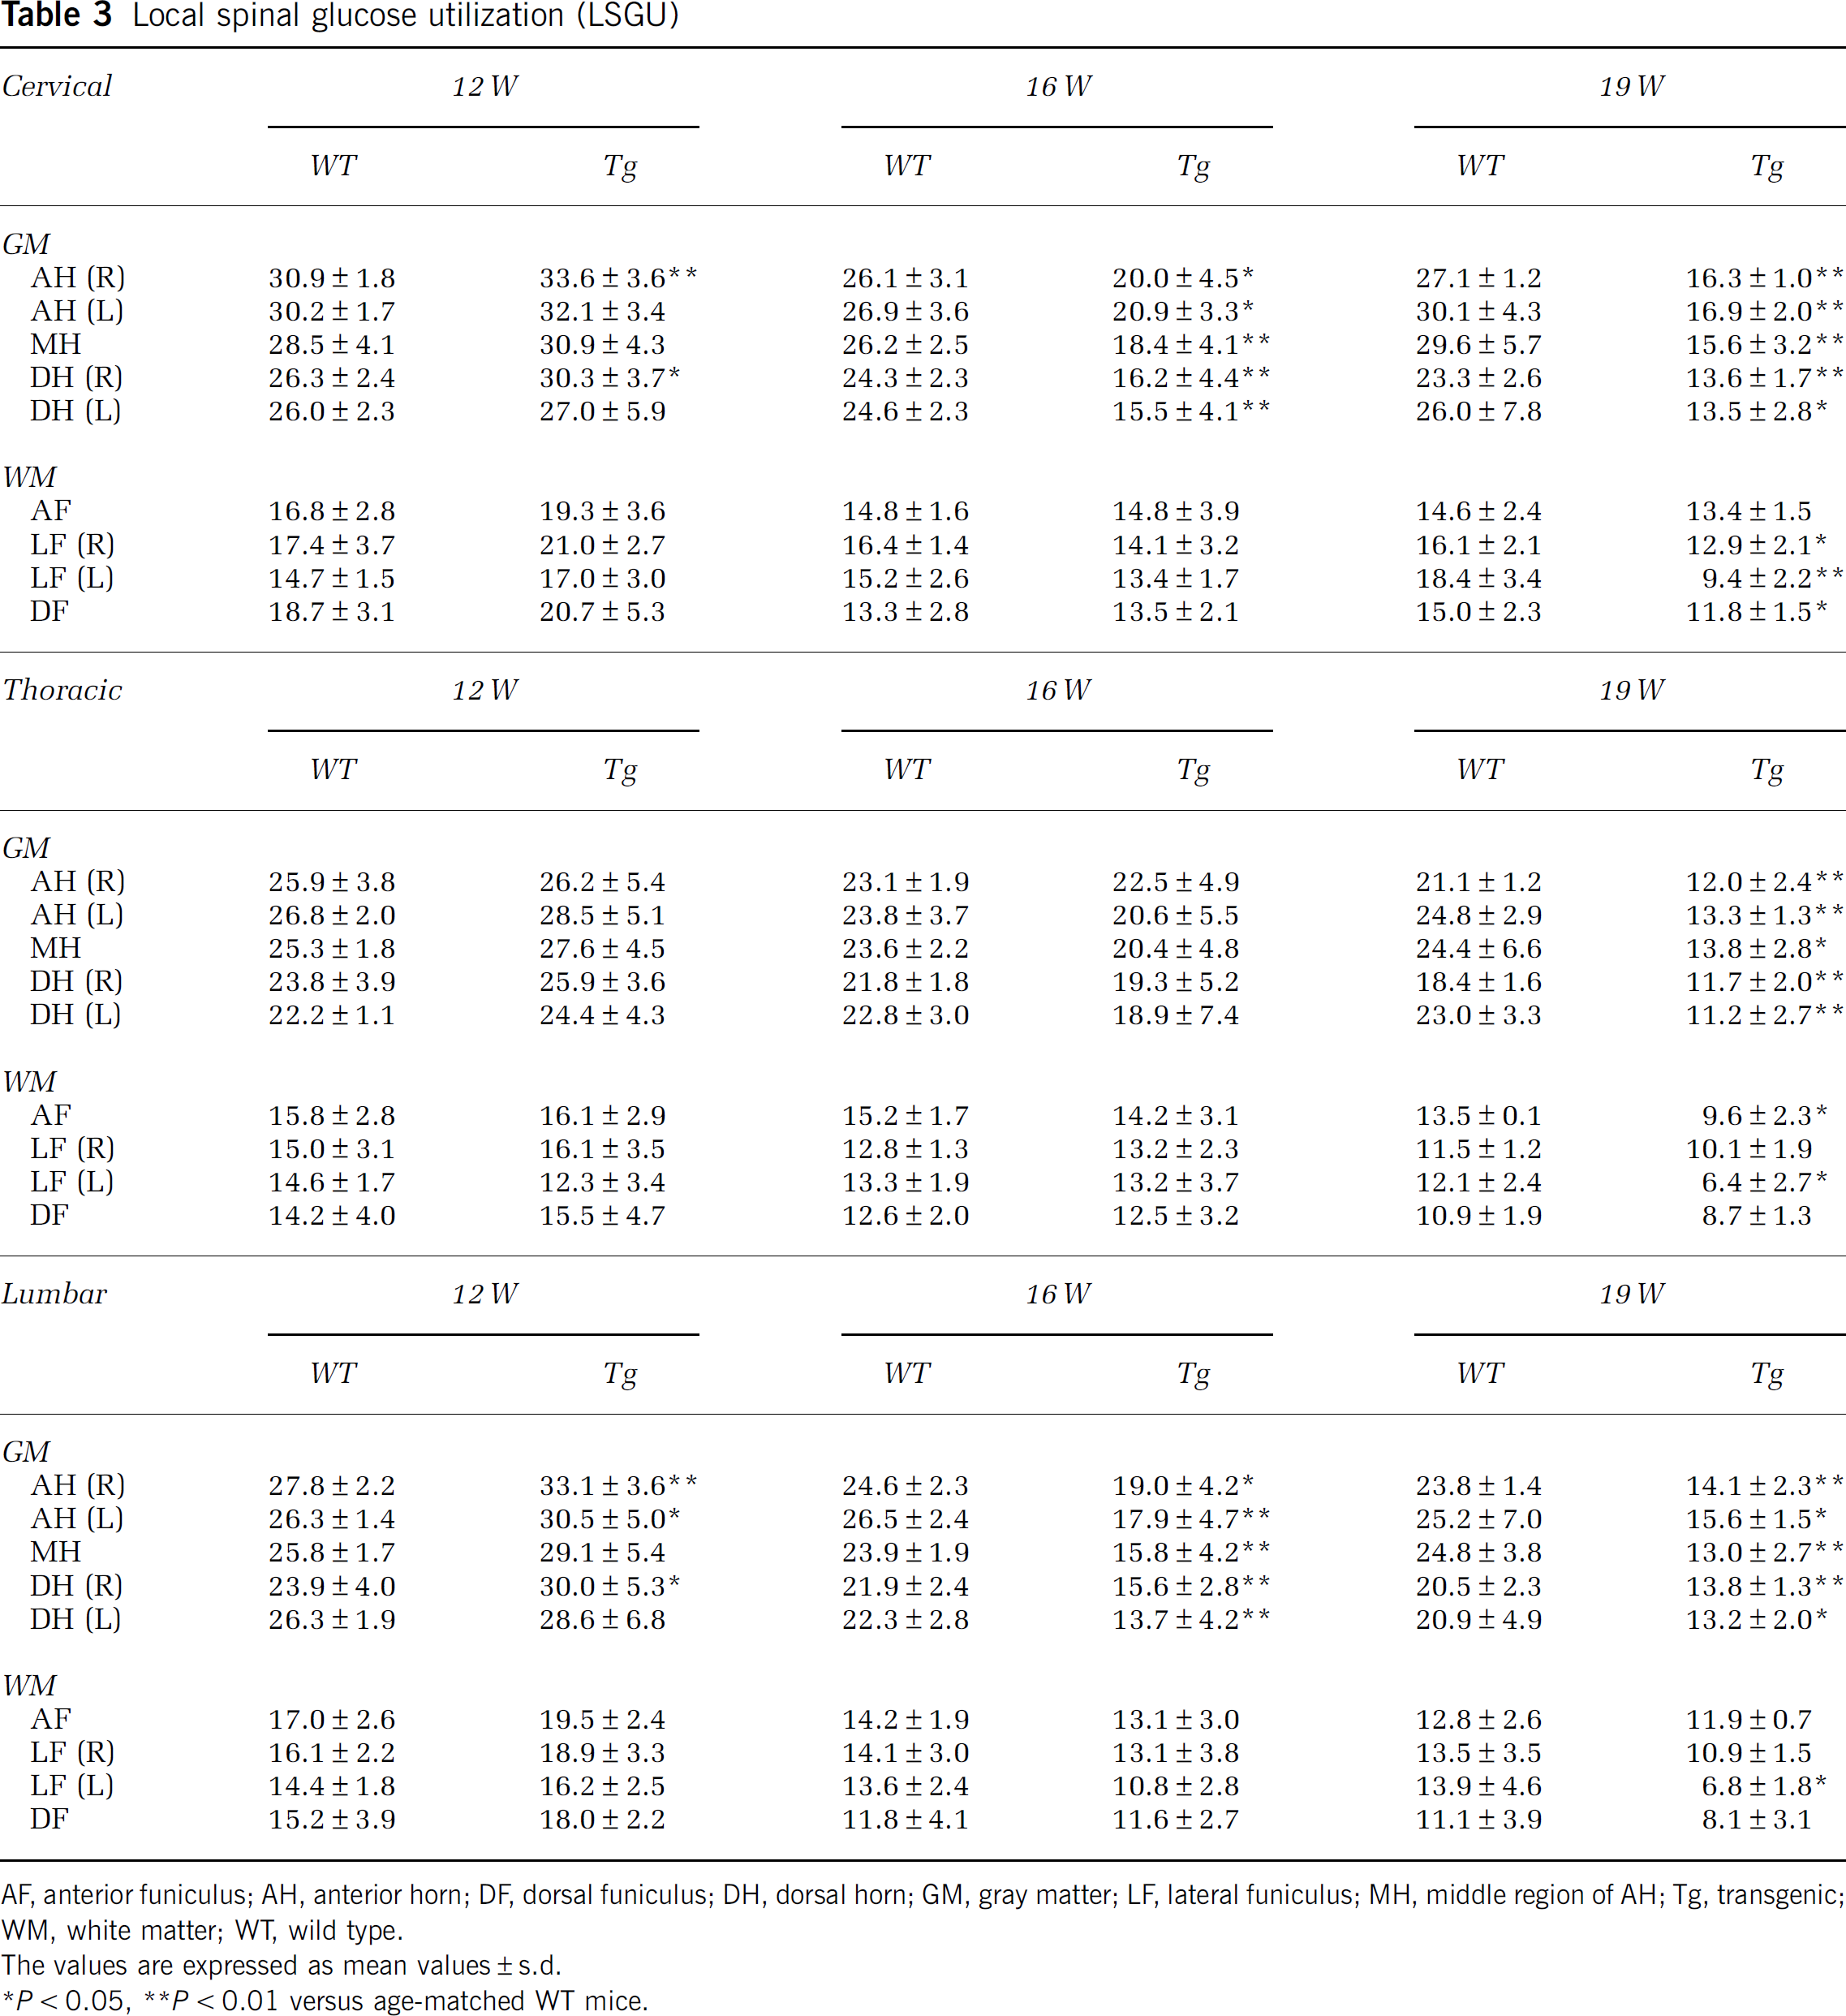
AF, anterior funiculus; AH, anterior horn; DF, dorsal funiculus; DH, dorsal horn; GM, gray matter; LF, lateral funiculus; MH, middle region of AH; Tg, transgenic; WM, white matter; WT, wild type.
The values are expressed as mean values±s.d.
∗P<0.05, ∗∗P<0.01 versus age-matched WT mice.
Ratio of Local Spinal Glucose Utilization to Spinal Blood Flow
In WT mice, LSGU/SBF ratio of WM was slightly higher than that of GM, which slightly decreased with normal aging from 12 to 19 W. Although the LSGU/SBF ratio remained at about 0.30 in most GM and WM of each spinal level, GM of lumbar cord showed the lowest ratio (0.27±0.02, 0.23±0.02, 0.21±0.01 at 12, 16, and 19 W, respectively) among spinal coronal areas and longitudinal levels. The LSGU/SBF ratio of Tg mice at 12 W were significantly increased in GM of 0.40±0.01 (+29%, ∗∗P<0.01) in cervical, 0.41±0.02 (+23%, ∗∗P<0.01) in thoracic, and 0.39±0.04 (+48%, ∗∗P<0.01) in lumbar cord (Figures 3S, 3V, and 3Y). At 16 W, significant increases of the ratio were also seen in the GM of 0.36±0.01 (+19%, ∗∗P<0.01) in thoracic and 0.27±0.02 (+15%, ∗P<0.05) in lumbar cord. This increase continued until 19 W in lumbar GM of 0.28±0.02 (+34%, ∗∗P<0.05), but not seen in cervical and thoracic levels (Figure 3AA). In contrast, there was no significant difference of the LSGU/SBF ratio in WM between WT and Tg mice and no significant change with age in WT and Tg mice at any region (Figures 3S–3AA).
Discussion
In the present study, we first performed an in vivo capillary imaging of lumbar spinal cord using two-photon microscope. In Tg mice, capillary diameter in AH of lumbar cord became progressively smaller (Figures 1A–1F), capillary density became lower (Figure 1G), and mean RBC speed progressively decreased during the disease course (Figures 1H–1L), resulting in progressive decrease of flow volume only in Tg mice (Figure 1M). We then analyzed SBF and LSGU of cervical, thoracic, and lumbar cord using standard autoradiographic technique. In Tg mice, SBF was significantly decreased in GM, especially AH, before motor neuron loss at 12 W, and then progressively decreased with disease progression from 16 to 19 W (Table 2; Figures 2E–2P and Figures 3A–3I). Contrary to the results of SBF, Tg mice initially showed a significant increase of LSGU at 12 W in GM of cervical and lumbar cords (Table 3; Figures 2Q—AB and Figures 3J–3R). However, LSGU now turned a progressive decrease from 16 to 19 W (Figures 3J–3R, black bars). The LSGU/SBF ratio showed a significant and continuous increase in GM of cervical, thoracic, and lumbar cords from 12 to 19 W of Tg mice (Figures 3S—AA).
Zhong et al (2008) showed a reduction of SBF in the cervical and lumbar cord as a whole in the same mice model of ours, but did not examine detailed regional differences and throughout the course before and after the disease onset. Decrease of cerebral blood flow was reported in ALS patients (Abe et al, 1997; Ishikawa et al, 2007; Waldemar et al, 1992), but that of SBF has not been reported in the ALS patients. Capillary diameter, density, and RBC velocity are important parameters of SBF. Our in vivo optical study strongly suggests that such an SBF reduction (Table 2; Figures 2E–2P) was closely related to the decrease of capillary diameter, density, and RBC velocity (Figure 1), and the early SBF reduction from the presymptomatic stage at 12 W might provide chronic and progressive ischemic stress to the affected spinal cord as implicated by early increase of Hif-1α and vascular endothelial growth factor (Murakami et al, 2003; Xu et al, 2011).
Several reports have shown weight loss, hypermetabolism, and hyperlipidemia in ALS patients and the animal model, suggesting a disturbance of energy metabolism (Dupuis et al, 2011; Guo et al, 2000; Hatazawa et al, 1988). Amyotrophic lateral sclerosis patients showed a reduced glucose metabolism in their cerebral cortex (Dalakas et al, 1987; Ludolph et al, 1992; Waldemar et al, 1992). Amyotrophic lateral sclerosis model mice showed a slight but nonsignificant increase of LSGU in the spinal cord at presymptomatic stage with a significant reduction at the end stage (Browne et al, 2006). Blood flow and glucose metabolism are well coupled under physiological conditions in both the brain and spinal cord FMC, where blood flow increases in response to an increased glucose metabolism (Krafft et al, 2000; Lenz et al, 1999; Leybaert, 2005; Leybaert et al, 2007; Sokoloff, 1977; Weir et al, 2002; Zivin et al, 1982).
In the present study, we found four important aspects of flow—metabolism uncoupling (FMU) in ALS spinal cord. (1) Spinal blood flow was progressively reduced beginning before the disease onset, and did not couple to the increasing LSGU at 12 W (Figures 2D,2E and Figures 3A–3I). (2) The initial LSGU increase at presymptomatic stage was followed by the LSGU reduction after the disease onset, when SBF reduction seemed to be partially coupled (Figures 2Q–2AB and Figure 3J–3R). (3) The LSGU/SBF ratio, a good indicator of FMC, showed that a high LSGU with uncoupled SBF continued from presymptomatic to the end stage of ALS (Figures 3S—AA). (4) Such an FMU was found only in Tg mice, preferentially in GM (AH>DH) and LF (Figures 2 and 3), where pathological changes are the most prominent in this ALS mice. The increase of LSGU at 12 W might be compensatory mechanism against early depletion of ATP (Browne et al, 2006) probably accompanied by mitochondrial deficit and hyperactivation of synaptic terminal, both of which were observed before apparent motor neuron degeneration (Gordon et al, 2010; Sasaki et al, 2004). The initial high LSGU with SBF reduction could cause not only an absolute ischemia (absolute SBF reduction) but also a relative hypoxia (regardless of LSGU increase or decrease) in the spinal motor neurons, resulting in a strong hypoxic/oxidative damage and reactive inflammatory responses. Such an initial presymptomatic event to spinal motor neurons and the surrounding inflammatory responses could bring secondary and continuous damage to motor neurons after the disease onset (Figure 3).
Recent reports have demonstrated a damage of blood spinal cord barrier components (Garbuzova-Davis et al, 2007; Henkel et al, 2009; Ishikawa et al, 2007) of both ALS patients and the model mice. Vascular endothelium, neurons, and glial cells form a functional unit together, called NVU (del Zoppo, 2010; Zlokovic, 2008), and blood flow is regulated by modulating blood vessel diameter to couple to the demand of glucose metabolism depending on local neuronal activity (Dirnagl, 1997; Harder et al, 1998; Kuschinsky, 1997). We have previously shown that a disruption of NVU enhanced an acute ischemic brain damage (Yamashita et al, 2009) and aggravated ALS pathology in the model mouse (Miyazaki et al, 2011). We found that significant changes of SBF and LSGU were largely restricted to GM, where damage of NVU was also prominent. The constant increase of LSGU/SBF ratio (Figures 3S–3AA) regardless of initial increase of LSGU and the later decrease (Figures 3J–3R) strongly suggests a larger decline of SBF than LSGU increase/decrease (Figures 3S–3AA). Such a large decline of SBF could be accounted for this NVU disruption (Miyazaki et al, 2011), as well as decreasing capillary diameter and density cooperatively affecting the neurodegenerative process of ALS. We have previously shown that motor function was decreased after 15 W using rotarod test in the same line of this model mouse (Ohta et al, in press). Thus, aberrant changes of SBF and LSGU persuaded the initiation of motor function reduction, and then progressively decreased with disease progression.
In the present study, we first showed a progressive impairment of FMU in the spinal cord of ALS mice, preceding the sequential changes of the disease, which strongly correlated with the affected regions of ALS, and is strongly related to decreasing capillary diameter and density and to NVU disruption. Although the reason why the presence of SOD1 caused initial SBF reduction and LSGU increase has to be dissolved by further analysis, we conclude that this early FMU could profoundly involve in the whole disease process as a vascular factor of ALS pathology, and could be a potential target for therapeutic intervention of ALS.
Footnotes
The authors declare no conflict of interest.