
Abstract
In vivo 1H magnetic resonance spectroscopy (1H-MRS) investigations of amyotrophic lateral sclerosis (ALS) mouse brain may provide neurochemical profiles and alterations in association with ALS disease progression. We aimed to longitudinally follow neurochemical evolutions of striatum, brainstem and motor cortex of mice transgenic for G93A mutant human superoxide dismutase type-1 (G93A-SOD1), an ALS model. Region-specific neurochemical alterations were detected in asymptomatic G93A-SOD1 mice, particularly in lactate (−19%) and glutamate (+8%) of brainstem, along with γ-amino-butyric acid (−30%), N-acetyl-aspartate (−5%) and ascorbate (+51%) of motor cortex. With disease progression towards the end-stage, increased numbers of metabolic changes of G93A-SOD1 mice were observed (e.g. glutamine levels increased in the brainstem (>+66%) and motor cortex (>+54%)). Through ALS disease progression, an overall increase of glutamine/glutamate in G93A-SOD1 mice was observed in the striatum (p < 0.01) and even more so in two motor neuron enriched regions, the brainstem and motor cortex (p < 0.0001). These 1H-MRS data underscore a pattern of neurochemical alterations that are specific to brain regions and to disease stages of the G93A-SOD1 mouse model. These neurochemical changes may contribute to early diagnosis and disease monitoring in ALS patients.
Introduction
Amyotrophic lateral sclerosis (ALS) is a fatal neurodegenerative disease that leads to specific degeneration of motor neurons originating in the central nervous system (e.g. spinal cord, brainstem and motor cortex). ALS patients simultaneously suffer from progressive paralysis of skeletal muscles. ALS diagnosis currently relies on clinical assessment and compatible electrophysiological findings, whereas imaging is mostly used to exclude other pathologies. However, the aetiology of ALS in motor neurons, particularly in upper motor neurons, remains variable.1–3 A crucial advantage of animal studies is the opportunity to follow animals before symptom onset and throughout the disease progression. Therefore, in vivo characterization of the aetiology (e.g. brain metabolism) in the most consistent murine model of ALS is particularly important for early diagnosis and follow-up of therapeutic interventions in animal models. Remarkably, mice that ubiquitously overexpress mutant human superoxide dismutase 1 (hSOD1) develop an adult-onset hind limb paralysis that closely mimics human disease ALS.4–6 Consequently, mice transgenic for G93A mutant hSOD1 (G93A-SOD1 mice) became widely used as the model for ALS and have been characterized for their neuropathology.7,8 Therefore, longitudinally studying metabolism of brain regions with abundant motor neurons in the G93A-SOD1 mouse model could provide neurochemical alterations associated with disease progression and hint towards a metabolic signature of motor neuron degeneration that may help the early diagnosis, evaluation of therapeutic treatments and follow-up of ALS patients.
Recently, magnetic resonance techniques, such as imaging (MRI) and spectroscopy (MRS), have proven to be powerful investigation tools for non-invasive studies in ALS patients. 9 For instance, in addition to the aforementioned ALS diagnosis purpose for ALS patients, MRI techniques have shown promising results in detection of abnormal T2-hyperintensities in central nervous regions only with abundant lower motor neurons (i.e. spinal cord and brainstem of G93A-SOD1 mice).10,11 Unlike MRI, which provides anatomical and structural contrasts, 1H-MRS has been used to evaluate brain metabolism (e.g. highly abundant metabolites of the primary motor cortex and brainstem of ALS patients) and metabolic alterations specific to motor neurons.12–20 However, except some in vitro spectroscopy analyses of murine ALS models,10,21 in vivo 1H MRS studies of the ALS mice remains limited. Therefore, the aim of this study was to longitudinally follow neurochemical profile evolutions of the striatum, motor cortex and brainstem in a transgenic G93A-SOD1 mouse model with well-characterized neuropathology 7 to provide plausible changes and to seek potential ALS biomarkers specific to motor neurons.
Materials and methods
Animals
All animal experiments were approved by the Veterinary Office of Canton de Vaud, and were conducted according to the federal and local ethical guidelines, EXPANIM (Expérience sur animaux- SCAV, Service de la consommation et des affaires vétérinaires, Switzerland) and in compliance with ARRIVE guidelines (Animal Research: Reporting in Vivo Experiments) for how to REPORT animal experiments. Transgenic mice overexpressing G93A human SOD1 (B6SJL-Tg(SOD1 × G93A)1Gur/J) were originally obtained from the Jackson Laboratory (Bar Harbor, Maine, USA). This line was thereafter maintained by breeding G93A males with wild-type (WT) females (B6SJL/F1, L’Arbresle, France). The offspring were genotyped by PCR amplification of DNA extracted from the ear tissue as described previously. 22 Thereafter, all mice were collectively housed (maximum five individuals per MICE cage, surface area 528 cm2, with standard beddings) on a 12-h light/dark cycle (lights on at 7 a.m.) and fed with a standard chow (Diet 2918, Provimi Kliba AG) in specific pathogen-free facility. Thirteen male G93A-SOD1 mice were obtained along with their 14 WT cohorts for this study. The mean lifespan of the transgenic animals was approximately 125 days, identical to an ALS mouse model with well-documented neuropathology. 7 Based on visible motor abnormality, e.g. hind limb splay,7,23 and preliminary electromyographical measurements and swimming ability (data not shown), 8 postnatal day 60 (P60) as an asymptomatic stage and disease onset at 90 days of age were found in our transgenic mice, similar to the aforementioned ALS mouse model. 7 Therefore, with the aim to detect potential biomarkers relating to diagnosis and prognosis, the mice were studied at asymptomatic (P60), at a mildly post-symptomatic stage (P100), at an advanced symptomatic stage (P115) and at an end stage close to moribund (P120-122, simplified as P122). 7
In order to reduce any potential effects of repetitive measurements on mice under isoflurane, animals were studied in a random manner. In each group, we typically measured more than seven mice (n ≥ 7), which was reached for this study except for transgenic mice at advanced symptomatic stage (n = 6 at P115 for both striatum and motor cortex, and n = 5 for brainstem). In late stage animals (P120–122), only four out of seven transgenic animals could be measured by 1H-MRS, because of the death of some mice before the measurement could be performed.
For MR studies, anaesthesia was induced under 3% isoflurane mixed with air and oxygen (2:1). Isoflurane flow rate was then reduced to 2% for further procedures. The animals were then fixed in a stereotaxic holder (RAPID Biomedical GmbH, Rimpar, Germany) with two earpieces and a bite bar. Rectal temperature and respiratory rates of animals were recorded using an MR-compatible system (Model 1025, SA Instruments Inc., NY, USA). The isoflurane flow concentration was continuously adjusted in the range of 0.8–2% to maintain physiological conditions (i.e. the respiratory rates of animals in the range of 90–120 breaths per minute). The rectal temperatures of animals were kept at 35–37℃ by circulating warm water. The entire period of MR study was in the range of 1.5–2 h for each mouse. Immediately after all MR measurements, 15 µL of tail bleeds were recovered and diluted in 15 µL of Dulbecco's phosphate-buffered saline (Sigma-Aldrich Inc., USA). Glucose and lactate contents of the diluted samples were immediately measured using two nearby pre-calibrated analysers (GM7 Micro-Stat, Analox Instruments Inc., UK).
MR instruments
All MR studies were carried out in a horizontal 9.4 Tesla (T) magnet (26 cm-inner-diameter, Magnex, UK) with a 12-cm-diameter gradient (400 mT/m, 200 µs). The magnet was interfaced to a DirectDrive console (Vnmrj, Agilent Inc., USA). B0 drift was less than 10 Hz and eddy currents were minimized within 0.01%. 24 A homemade quadrature 1H radiofrequency (RF) coil with two geometrically decoupled 12-mm-diameter loops resonating at 400 MHz was used for transmitting and receiving RF.
Anatomical MRI and localised 1H MRS
Fastest spin echo (FSE) imaging was applied to acquire multi-slice anatomical images with the following parameters: a 20 × 20 mm2 field of view (FOV) with a 256 × 256 matrix, 20 × 0.6 mm slices, 8 echo train lengths, 50 ms effective echo time (TEeff), repetition time (TR) = 5000 ms and 4 averages. Such imaging parameters result in T2-weigted images that allow identifying abnormal T2 hyper-intensities. 25
Local field homogeneities were optimised for each examined brain region using FASTMAP 26 without exceeding the maximum strength of both first and second-order shim gradients, as previously described. 27 The resulting spectral linewidths (FWHMs) of unsuppressed water signals were in the range of 11–18 Hz. Localised 1H-MRS was applied using SPECIAL (SPin ECho, full Intensity Acquired Localized, TE/TR = 2.8/4000 ms) 28 on two brain regions with abundant motor neurons (i.e. motor cortex and brainstem). A control brain region was selected (e.g. striatum). To obtain sufficient signal-to-noise ratios (e.g. SNRs ≥ 10) for further quantification, 160–320 averages were used.
LCModel 29 was applied to quantify the 1H-MR spectra, which had been carefully processed (i.e. frequency drift corrected and summed). 25 The unsuppressed water signals from the identical regions of interests (ROIs) were used as internal references for absolute concentrations. Water contents of mouse cortex (77 ± 1%) and striatum (78 ± 3%) measured in our preliminary results were similar to other studies. 30 However, the water content of mouse brainstem, measured at 73 ± 0% was significantly lower. Therefore, 73% water content (40 mol/L) was used for the brainstem, whereas 80% water content (44 mol/L) was used for the cortex and striatum to be consistent with previous studies.25,31–33 Since T1 reflects brain water content linearly 34 and changed minimally in ALS mice with disease progression, 11 water contents were assumed to not vary during the entire period of MR experiment.
In this study, all metabolites except macromolecules (Mac) in the basic set of the LCModel were simulated, i.e. alanine (Ala), ascorbate (Asc), aspartate (Asp), β-hydroxybutyrate, creatine (Cr), myo-inositol (myo-Ins), γ-aminobutyric acid (GABA), glucose (Glc), glutamine (Gln), glutamate (Glu), glycine (Gly), glycerophosphocholine (GPC), glutathione (GSH), lactate (Lac), N-acetyl-aspartate (NAA), N-acetyl-aspartyl-glutamate (NAAG), phosphocholine (PCho), phosphocreatine (PCr), phosphorylethanolamine (PE), scyllo-inositol, and taurine (Tau). In general, metabolites with Cramér–Rao bounds (CRLBs) > 50% were considered not detectable.27,31 For instance, Tkac et al. 31 reported that sufficient signal-to-noise ratios (i.e. SNR > 10) and quality spectral data at 9.4 T offered CRLBs ≤ 30% among most metabolites, except Ala, Asp, GSH, NAAG and PE. 31 Since GPC and PCho were strongly correlated in the LCModel analysis (|r| ≥ 0.8) due to the very similar spectral resonances, the sum of GPC and PCho (GPC + PCho) was reported. In our preliminary results, scyllo-inositol and β-hydroxybutyrate were noticeably with CRLBs > 50% over several brain regions and therefore not reported. Some metabolites show regional variation in concentration18,22 e.g. Ala, Asp Glc, Gly and NAAG etc., CRLB variations are also anticipated.
Statistics
Statistical tests were carried mainly in GraphPad (STATCON, Witzenhausen, Germany). Initially, unpaired student t-test was applied. To further evaluate genotype and age factors, two-way ANOVA was applied. Values were shown as mean ± standard errors of means (SEMs) unless specified and a significant level was reached when p-value was ≤ 0.05. Since the partial least squares discriminant analysis (PLS-DA) has been shown capable of analysing a large number of metabolites to identify potential biomarkers, 35 a similar approach was used to evaluate our data at an early stage of the disease (P60, asymptomatic).36,37
Results
Regional 1H-MR spectra and neurochemical profiles of wild-type mouse striatum, motor cortex and brainstem were distinct
Initially, we acquired multi-slice FSE images with the desired spatial resolution, depicting fine anatomical structures of mouse brain (Figure 1(a)). The quality images allowed for precise localisation of three investigated brain regions – striatum, motor cortex and brainstem – for further 1H-MRS studies. After adjustments of local field homogeneities, the resulting metabolic linewidths of volumes of interests (i.e. striatum, motor cortex and brainstem) were 7 ± 1 Hz, 10 ± 1 Hz and 13 ± 2 Hz, respectively. The combination of satisfactory water suppression and sufficient scans (160–320, as in methods) led to the sufficient spectral SNRs to be 14 ± 2, 14 ± 3 and 16 ± 2, respectively.
Typical MR images and spectra (a) of one wild-type (WT) mouse, and quantified regional neurochemical profiles (b) of striatum (grey, n = 7), motor cortex (white, n = 9) and brainstem (solid black, n = 7). Both transverse and sagittal images were acquired to locate the volume of interests (VOIs), such as striatum (1.5 × 2 × 1.8 mm3), motor cortex (2 × 1 × 1.5 mm3) and brainstem (3.5 × 1.5 × 2.5 mm3). MR spectra were from specific regions were shown in the right most side. All spectra were processed to have similar metabolic linewidths and scaled to the intensities of total creatine (Cr + PCr) and macromolecule (Mac). Panel b illustrates spectral quantification and further two-way ANOVA analysis followed by the Bonferroni post-tests. “*” indicates difference between brainstem and striatum. “&” indicates difference between motor cortex and striatum. The increased number of symbols indicates p = 0.05, 0.01 and 0.001.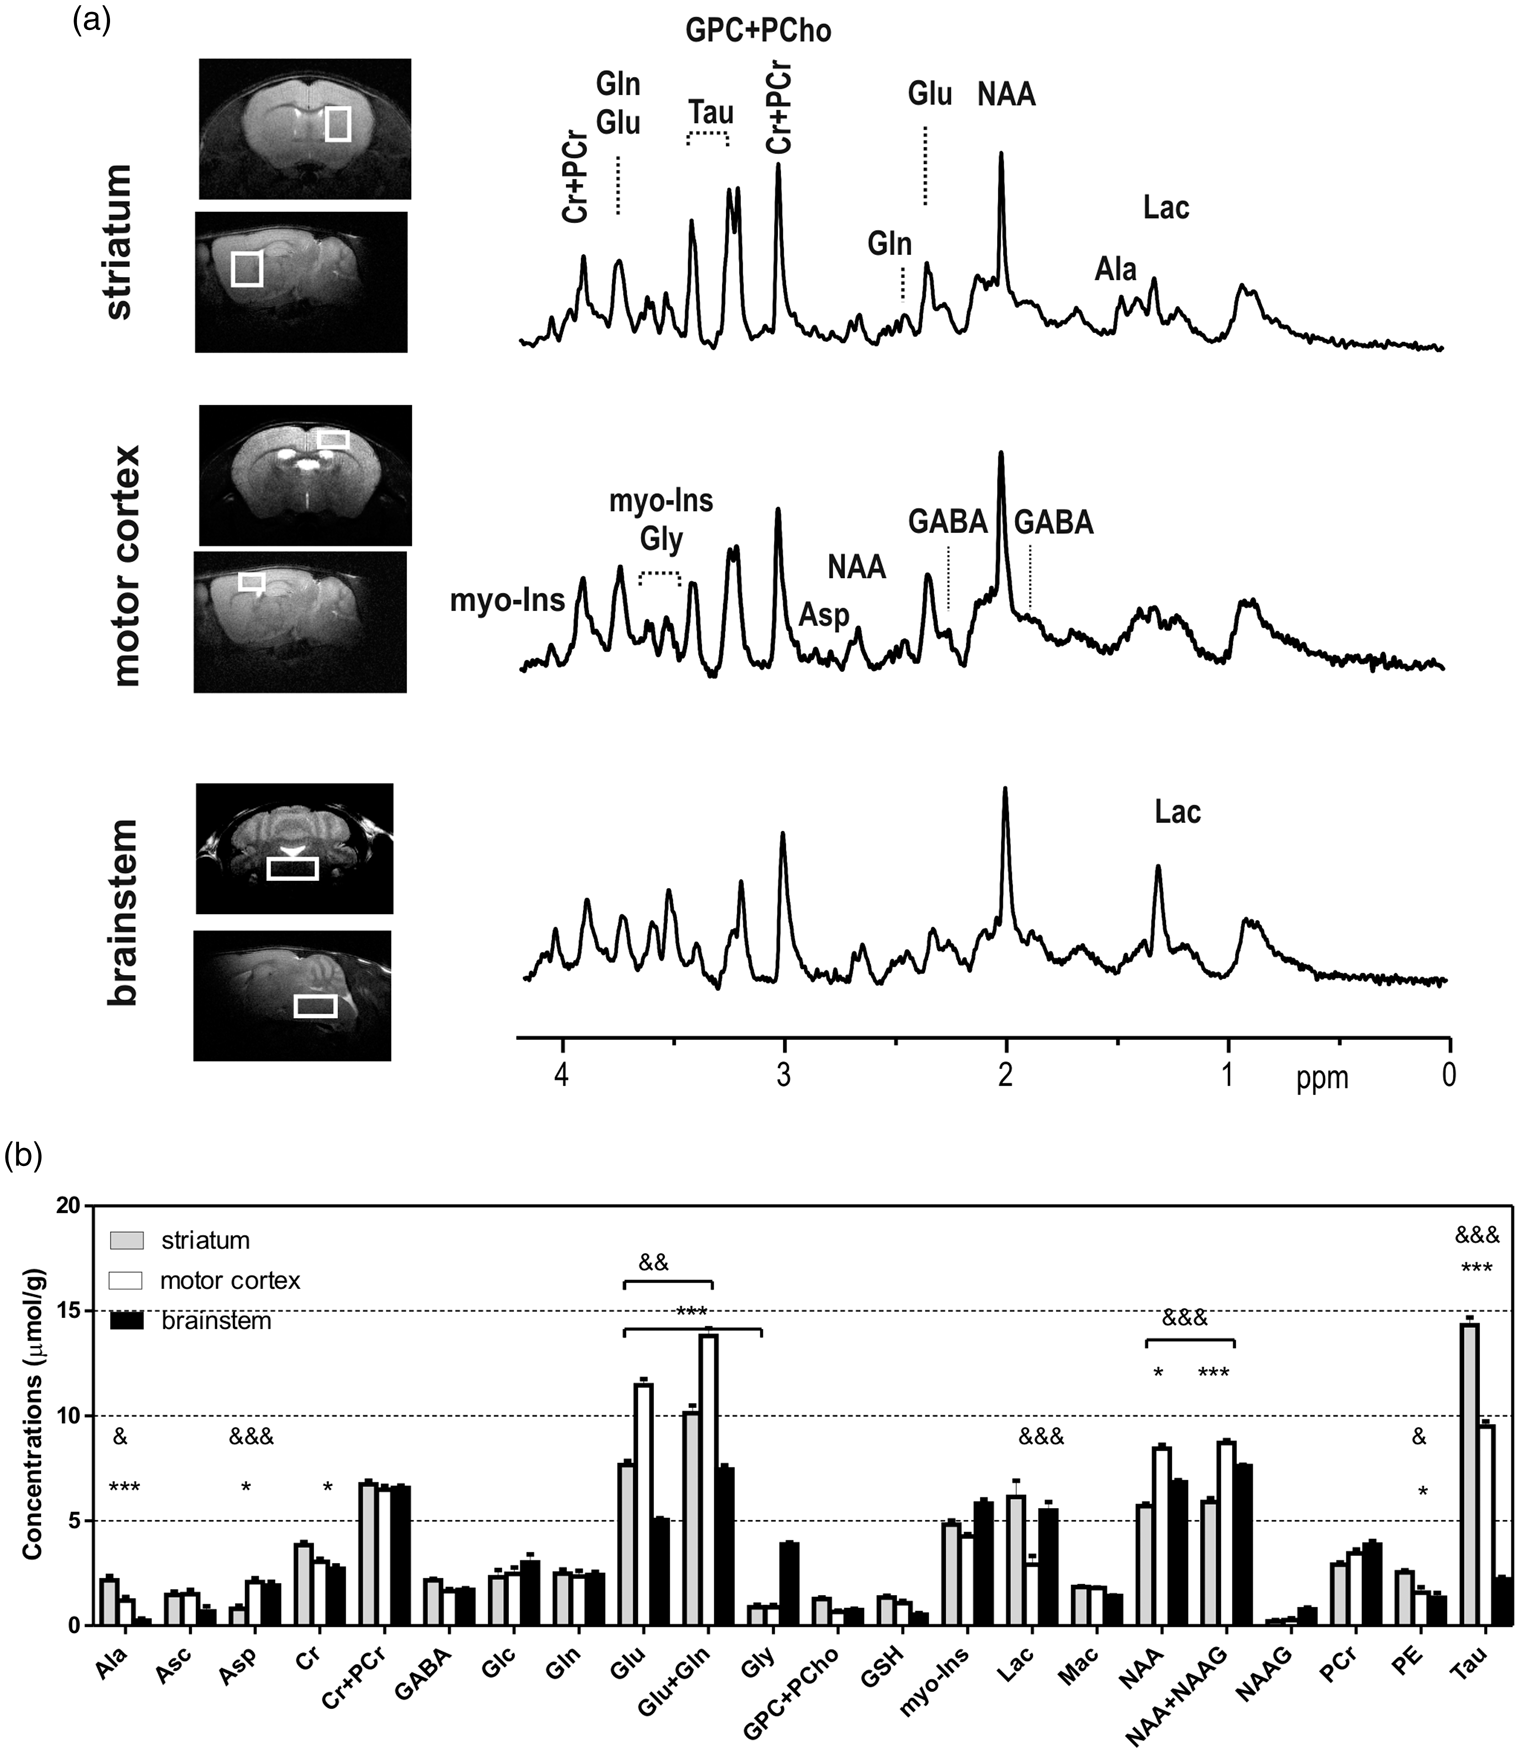
From the obtained 1H-MR spectra (Figure 1(a)), striking spectral characteristics of three examined brain regions were apparent. For instance, a typical 1H-MR spectrum of mouse motor cortex revealed lower Tau, Ala and Lac signals but higher NAA and Glu signals when compared to the striatum. In addition, lower Ala, Tau and Glu but higher Gly, NAA and Lac spectral signal intensities were consistently observed in the 1H-MR spectra of mouse brainstem (Figure 1(a)) when comparing to both motor cortex and striatum. As depicted in Figure 1(b), a total of 19 metabolites were reliably quantified (CRLBs in Supplemental Table 1) in each brain region, showing region-specific characteristics.
1H-MRS revealed metabolic changes in the brain of asymptomatic G93A-SOD1 mice
In the absence of apparent T2-hyperintensity enhancement, we next focused on spectral analysis of specific metabolites in all investigated brain regions, comparing the ALS G93A-SOD1 mice with their WT counterparts. Based on both symptom and lifespan of the G93A-SOD1 mice, four different ages, including P60 (asymptomatic), P100 (mild symptomatic), P115 (advanced symptomatic stage) and P122 (end-stage), were studied and analysed.
Summary of metabolic changes observed in the brainstem, motor cortex and striatum of G93A-SOD1 mice and their countertypes at P60, P100, P115 and a very late stage (P120–122, simplified as P122).
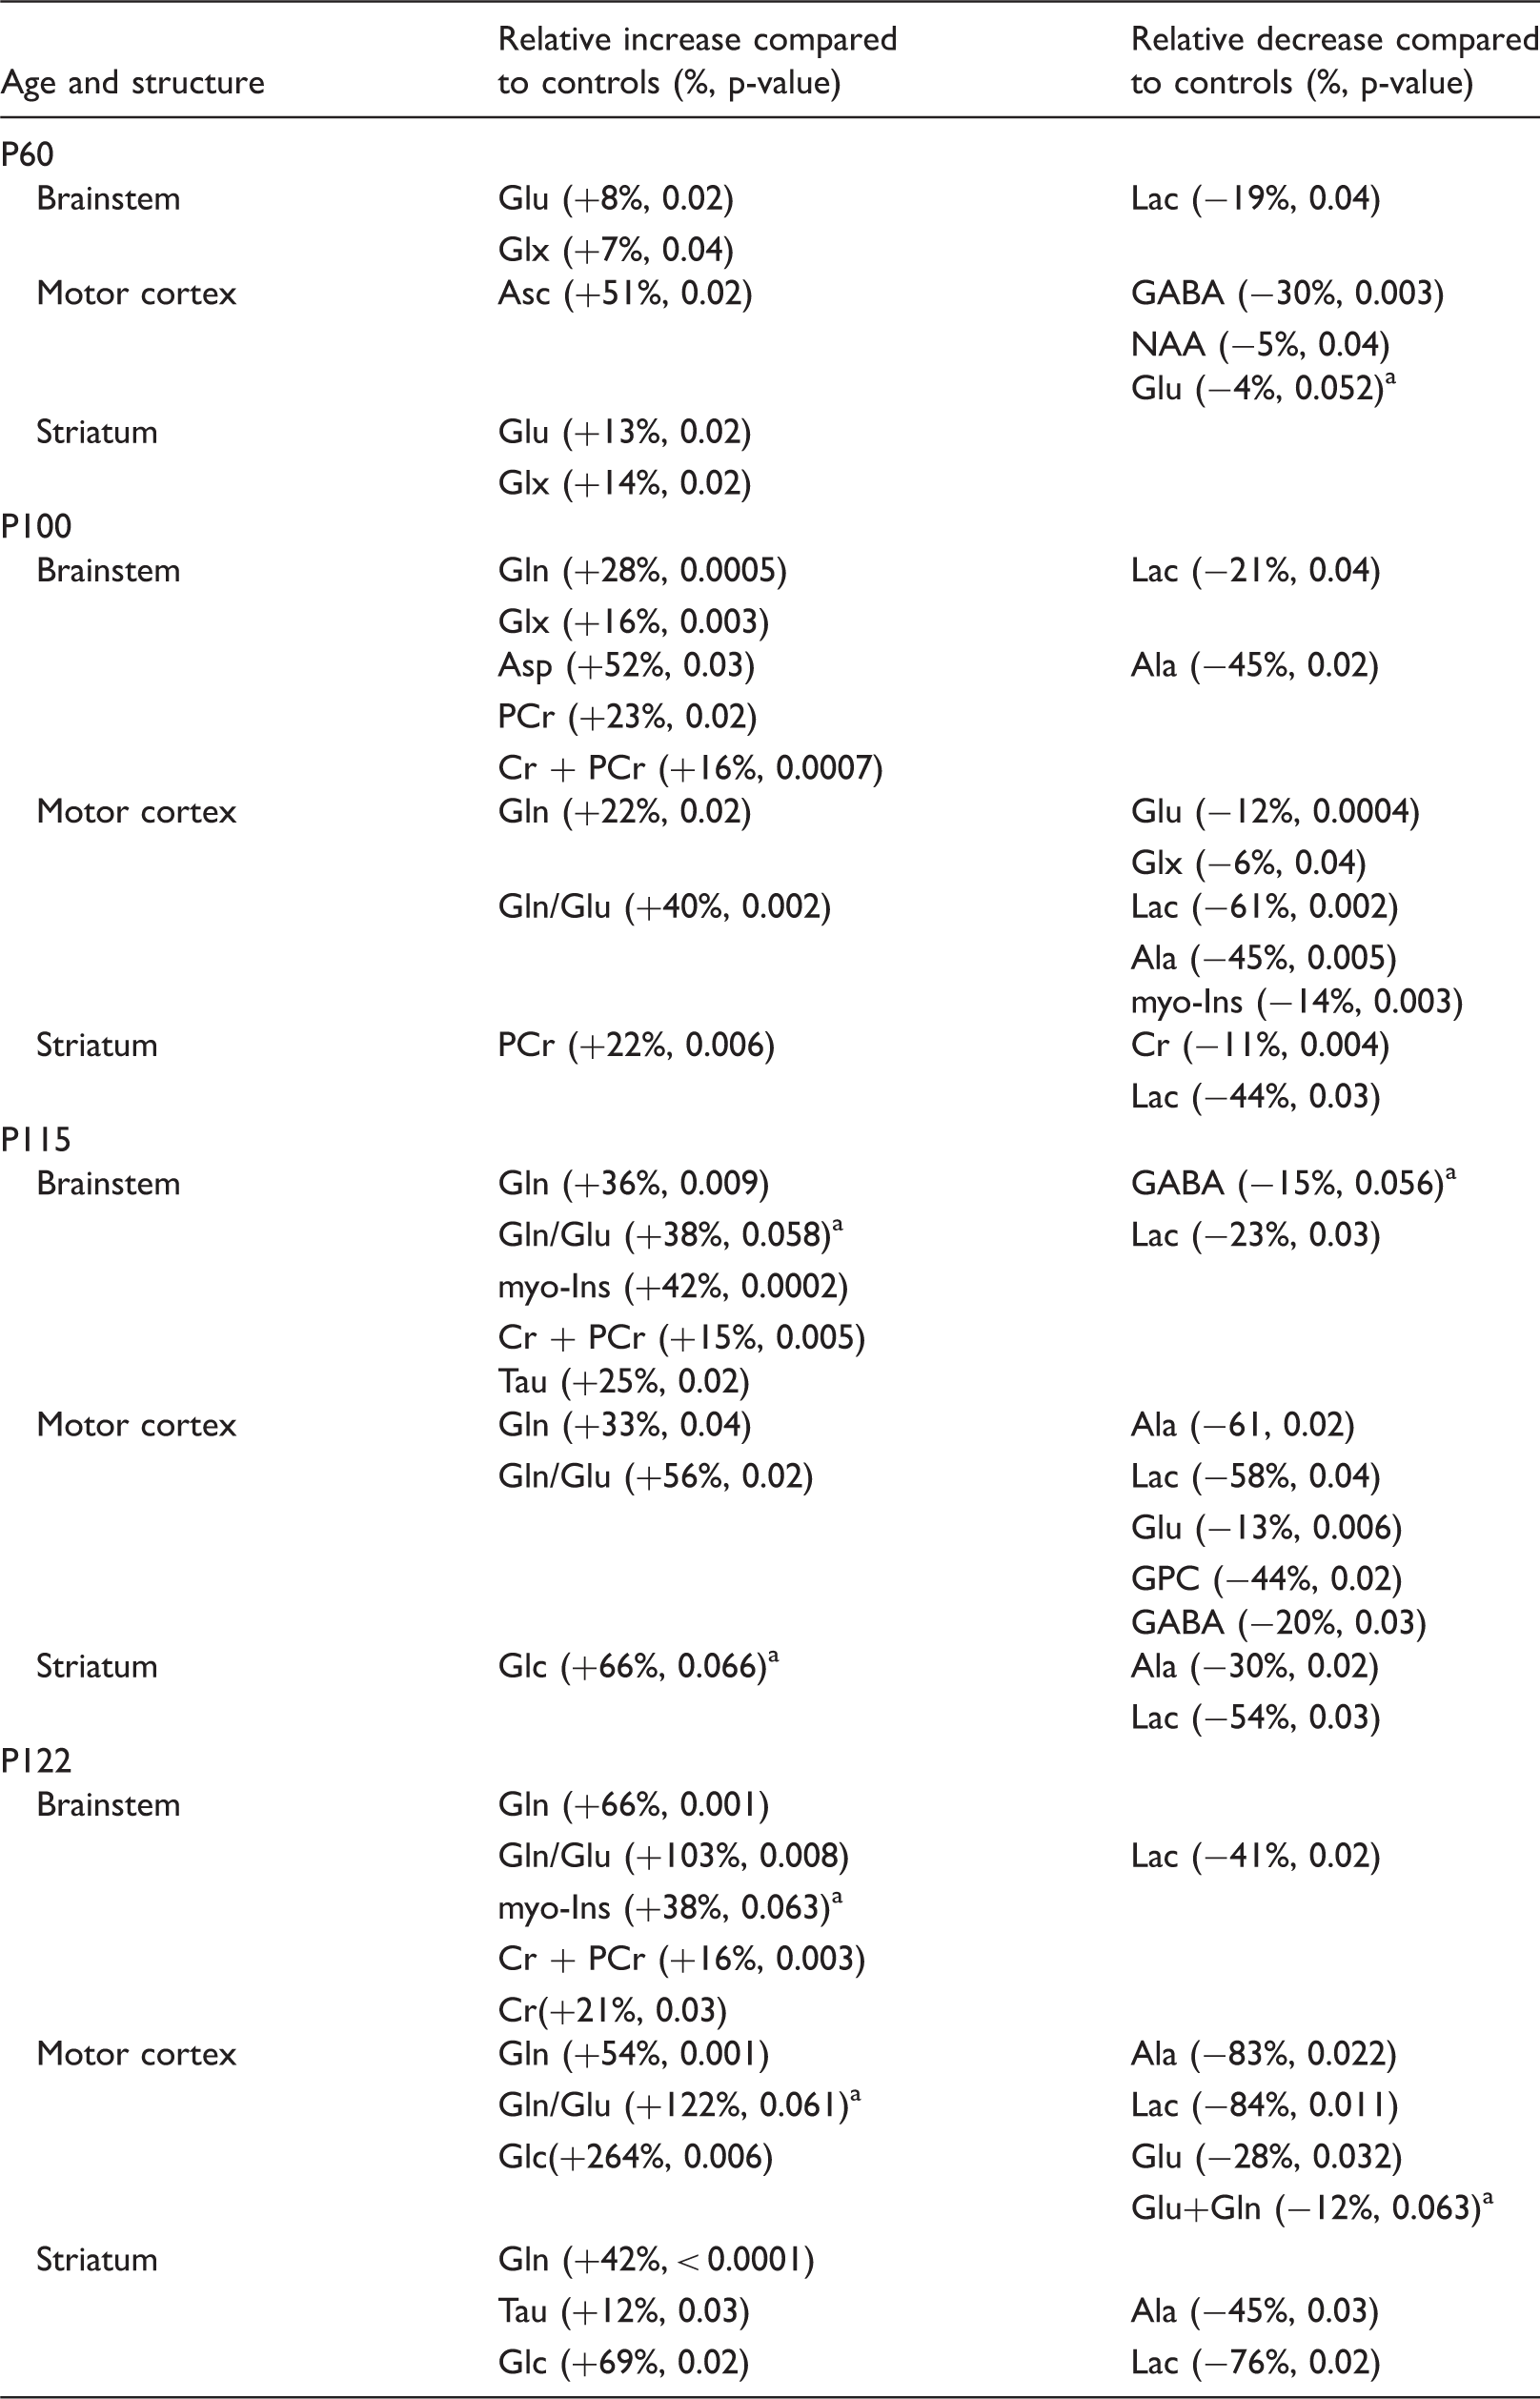
Note: p-value was evaluated using unpaired student t-test.
Indicates a statistically different trend.
Summary of physiological parameters including body weight, blood glucose and lactate (mean ± SDs).
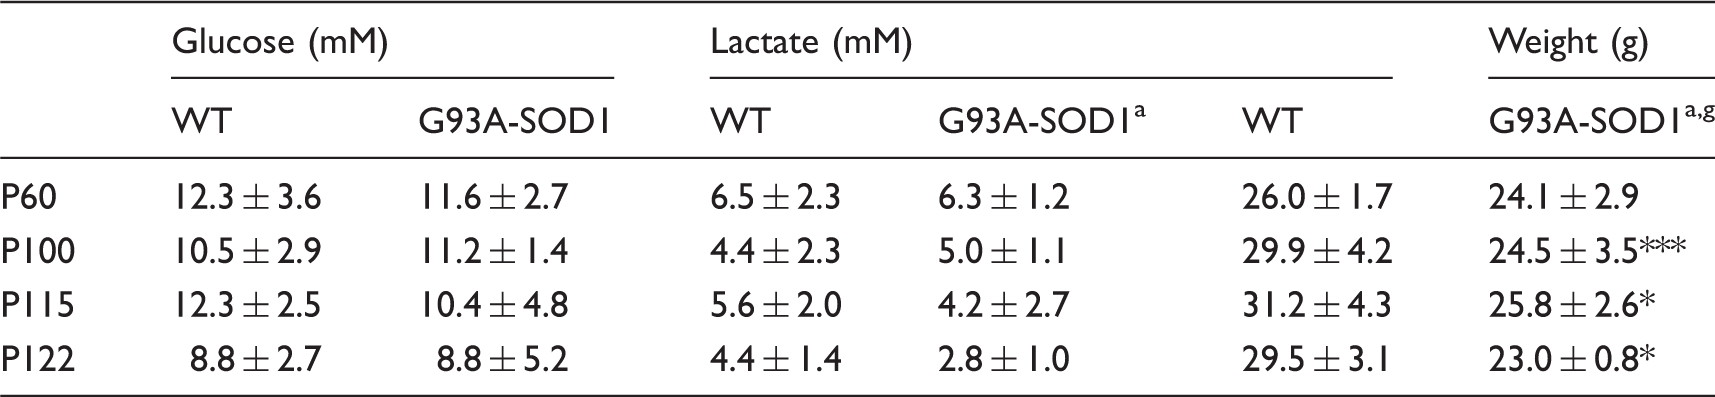
Note: Statistical differences between groups were evaluated using two-way ANOVA and marked “g” for the genotype factor and “a” for the age factor, as superscripts. The increased number of symbols represents the levels of significant differences for the post hoc analysis of variance comparisons between genotypes, such as “*”: p < 0.05; “**”: p < 0.01; “***”: p < 0.001.
Neurochemical profiles were modified in the brain of symptomatic G93A-SOD1 mice
The non-invasive characteristics of 1H-MRS allow studying G93A-SOD1 mice with disease progression. The G93A-SOD1 mice presented mild motor dysfunction that reflected symptoms of ALS patients at the time when they first sought medical advice (i.e. P100 and 1H-MRS data at this time point revealed spectral modifications in the G93A-SOD1 mice that were distinct from those observed at P60 (Table 1, unpaired student t-test)). While glucose and lactate levels in blood did not differ between the two groups despite a decrease trend in body weights in G93A-SOD1 mice (Table 2, two-way ANOVA), a prominent decrease in Lac was noticeable in all three examined brain regions of G93A-SOD1 mice (Table 1). In G93A-SOD1 mice, increases in Gln were observed in the brainstem ( + 28%, 2.9 ± 0.1 vs. 2.3 ± 0.1 µmol/g, G93A-SOD1 vs. WT) and in the motor cortex (+22%, 3.0 ± 0.1 vs. 2.4 ± 0.2 µmol/g), while decreases in both Glu (−12%, 9.9 ± 0.2 vs. 11.3 ± 0.2 µmol/g) and myo-Ins (−14%, 3.5 ± 0.2 vs. 4.1 ± 0.2 µmol/g) occurred in the motor cortex (Table 1).
When at P115, the G93A-SOD1 mice presented strong motor dysfunction similar to the advanced stages of ALS. There were increased numbers of neurochemical changes at this advanced stage, in particular in the brainstem and motor cortex (where motor neurons are mainly located). More specifically, increases in Gln, Gln/Glu, myo-Ins and the sum of creatine and phosphocreatine (Cr + PCr), and decreases in Lac and GABA were observed in the brainstem of transgenic mice (Table 1). Increases in Gln and Gln/Glu, and reductions in Ala, Lac, Glu, GPC and GABA were detected in the motor cortex of G93A-SOD1 mice (Table 1). When compared to their mild symptomatic stage (i.e. at P100), most changes in both regions of G93A-SOD1 mice were preserved except Asp in the brainstem and myo-Ins in the motor cortex. Yet, even at this advanced stage, we consistently observed reductions in both Ala and Lac in the striatum of G93A-SOD1 mice (Table 1).
At P122, G93A-SOD1 mice became symptomatic with hind limb paralysis. At this stage, most neurochemical changes in G93A-SOD1 mice at P115 persisted. Highly elevated Gln and reduced Lac levels were consistently observed in all three brain regions (Table 1). Furthermore, Glc in both the motor cortex and brainstem was substantially elevated, while both blood glucose and lactate levels were not different from their WT cohorts (Tables 1 and 2).
Neurochemical profile evolved in specific brain region
In addition to genotype, we further analysed the most relevant time-dependent metabolic changes of G93A-SOD1 and WT mice. Less time-dependent variations were observed in WT mice compared to their G93A-SOD1 counterparts (Figures 2 to 4). Among all investigated brain regions, the striatum exhibited limited age-dependent metabolites when compared to motor cortex and brainstem, two brain regions with abundant motor neurons (Supplementary Table 2).
Changes of major metabolites related to neurotransmission, glutamine (Gln, row a), glutamate (Glu, row b), γ-aminobutyric acid (GABA, row c), glycine (Gly, row d), the sum of glutamate and glutamine (Glx, row e) and the ratio of glutamine and glutamate (Gln/Glu, row f) from striatum (1st column), motor cortex (2nd column) and brainstem (3rd column) of WT (solid dots) and G93A-SOD1 (solid triangles). Statistical differences between groups were evaluated using two-way ANOVA and marked “g” for the genotype factor, “a” for the age factor and “i” for the interaction. The increased number of symbols represents the levels of significant differences for the post hoc ANOVA comparisons between genotypes, such as “*”: p < 0.05; “**”: p < 0.01; “***”: p < 0.001 and “****”: p < 0.0001. Error bars are standard errors of means (SEMs).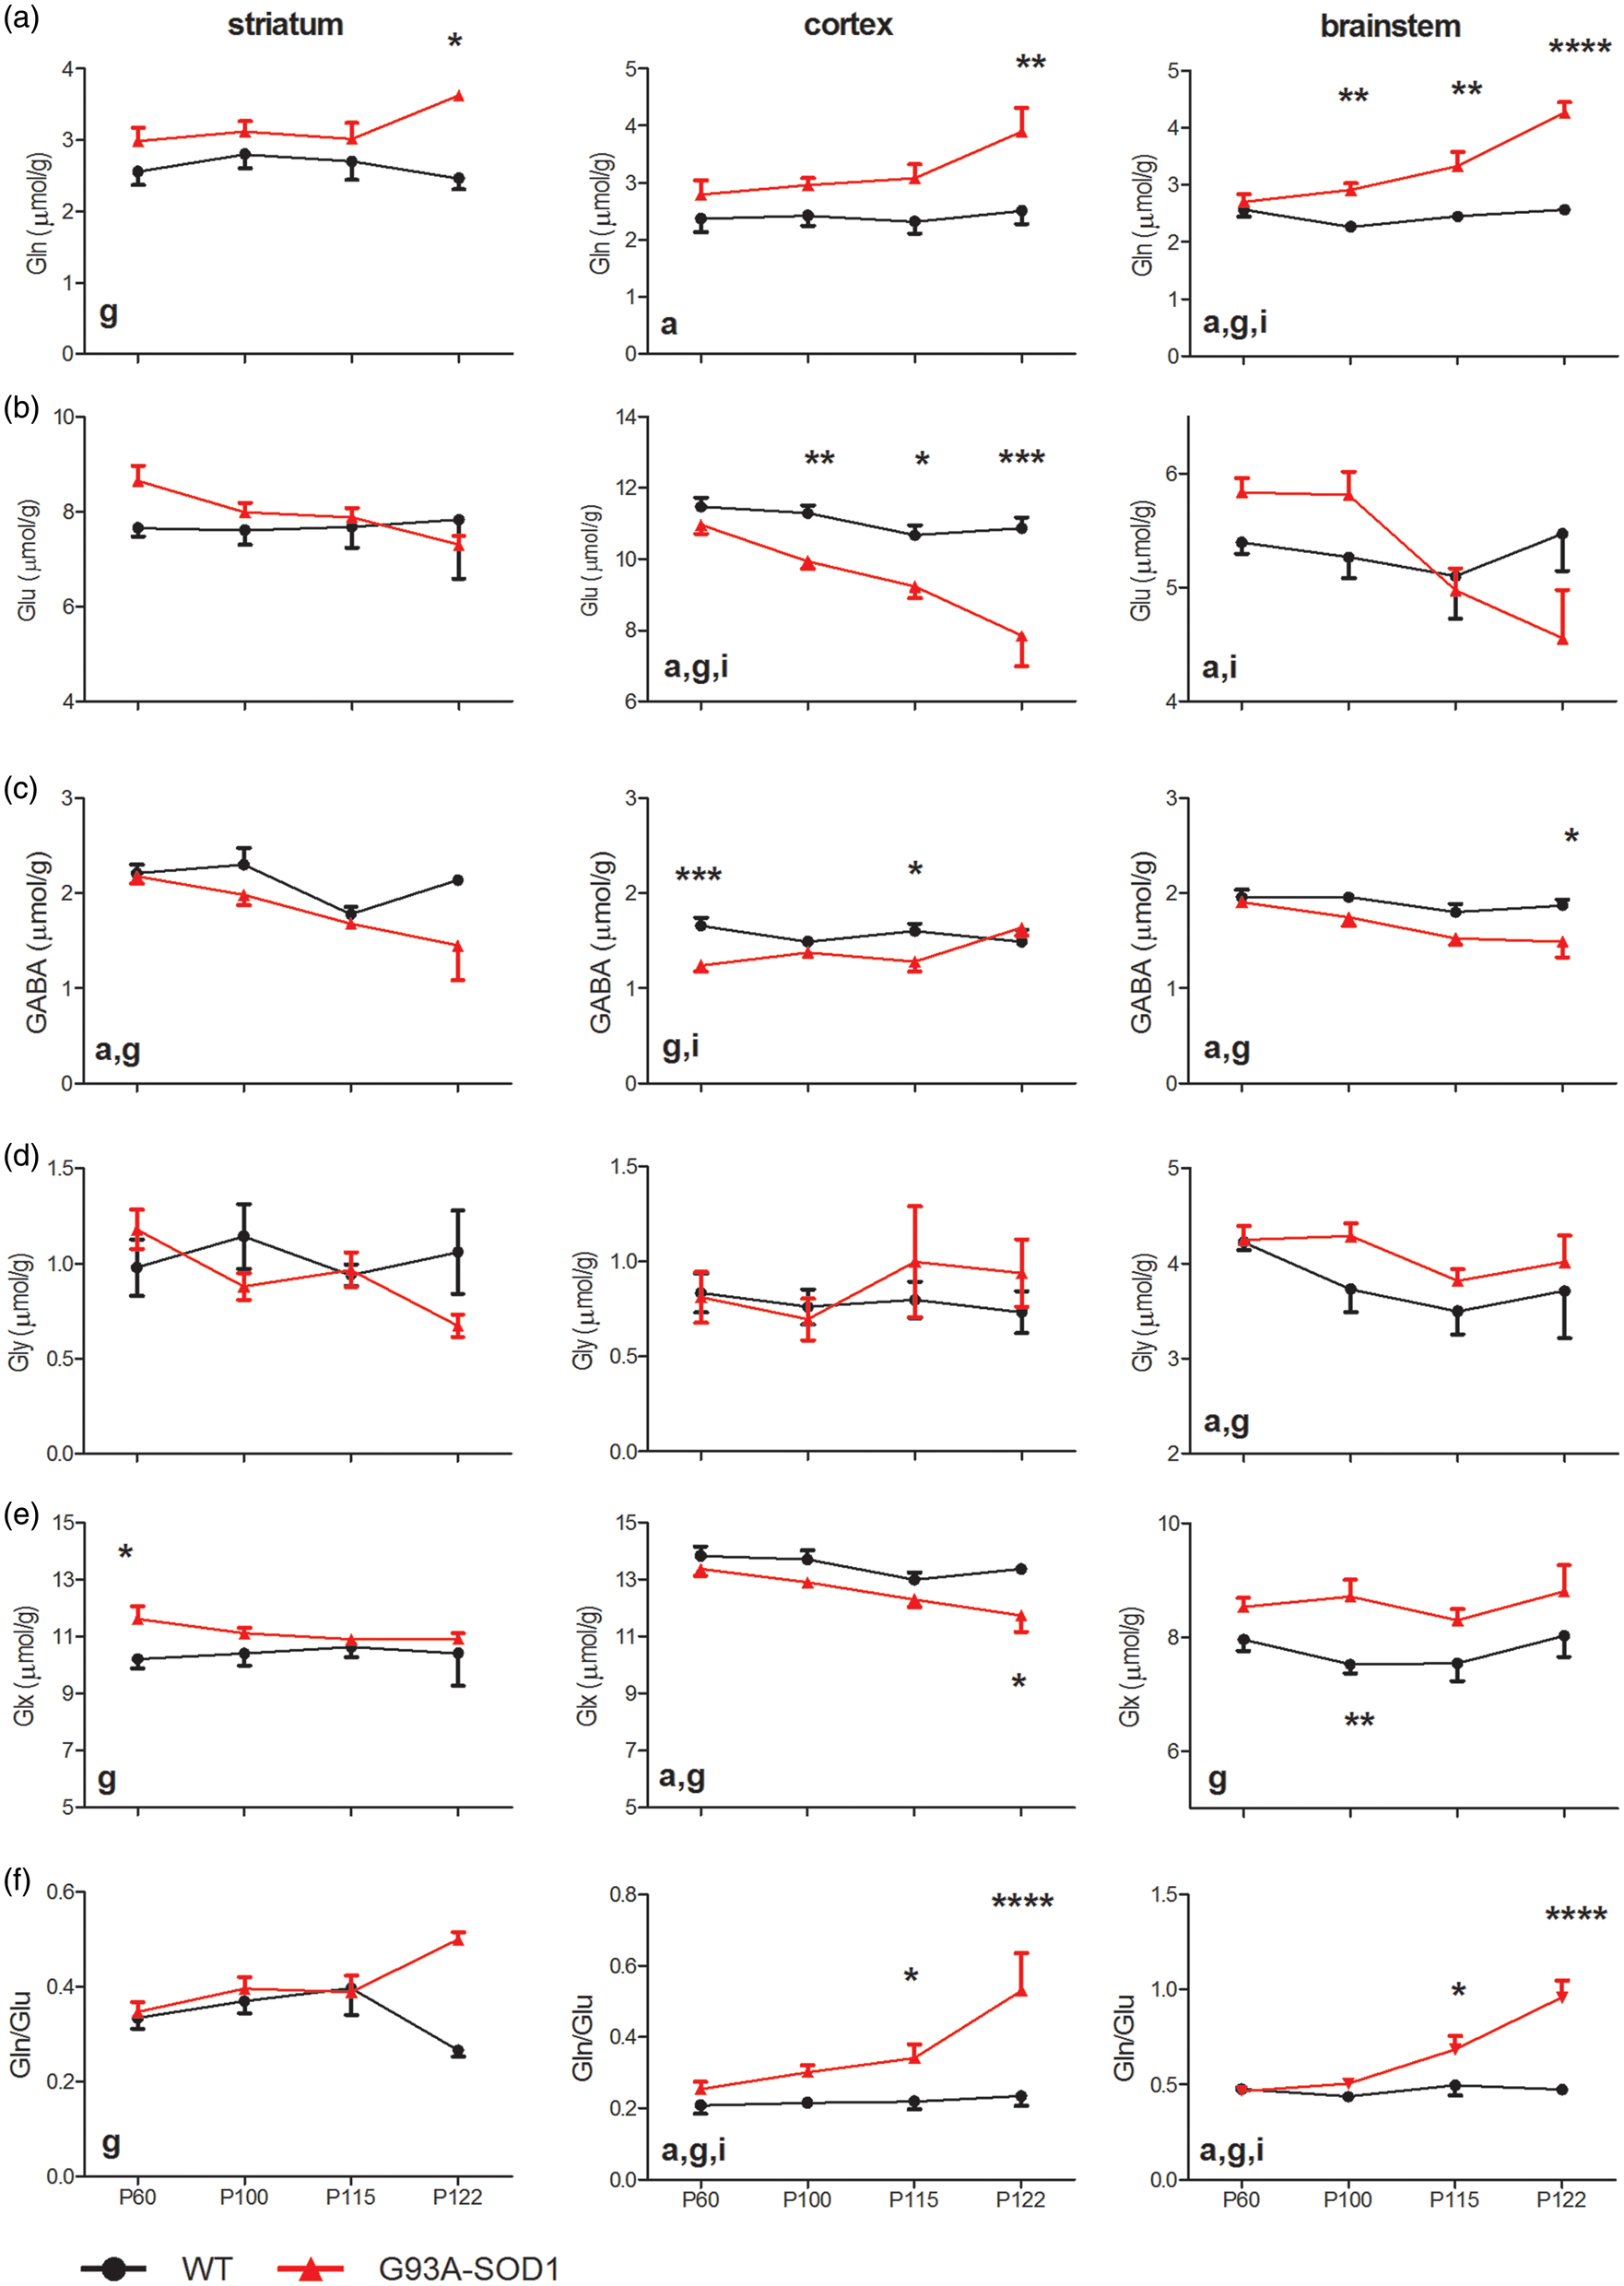
The metabolites associated with excitatory neurotransmission, Gln and Glu in the G93A-SOD1 mice, evolved differently from their controls (Figure 2). For instance, a general trend toward an increase in Gln (Figure 2(a)) and a trend toward a decrease in Glu (Figure 2(b)) were observed in all three brain regions. Despite that, Glu in the striatum and brainstem of SOD1 mice was slightly higher at P60 than Glu at P100 and were close to normal at P115 when compared to age-matched WT controls. Consequently, Gln/Glu ratios increased for all time-points in the motor cortex (genotype factor p < 0.0001, two-way ANOVA, Supplementary Table 2), only after mild symptoms in the brainstem (genotype factor p < 0.0001) and at end-stage in the striatum (genotype factor p < 0.01), of G93A-SOD1 mice versus WT mice. In addition, the sums of Glu and Gln (Glu + Gln, Glx) in the motor cortex of SOD1 mice at all time-points were consistently lower than WT controls, while Glx levels in the striatum (genotype factor p < 0.01) and brainstem (genotype factor p < 0.0001) of G93A-SOD1 mice were above normal levels (Figure 2(e)).
GABA, one inhibitory neurotransmitter, was consistently lower in G93A-SOD1 animals than in WT mice. This observation reached statistical significance in the striatum (genotype factor p < 0.01, two-way ANOVA, Figure 2(c), Supplementary Table 2), motor cortex (genotype factor p < 0.01) and brainstem (genotype factor p < 0.001) between G93A-SOD1 mice and their controls. Gly, another inhibitory neurotransmitter, was however noticeably higher in the brainstem of G93A-SOD1 mice when compared to WT animals (genotype factor p < 0.05, Figure 2(d)).
Time-dependent changes in metabolites linked to energy metabolism were also assessed. Hence, Lac levels remained lowered in all three investigated brain regions of G93A-SOD1 mice throughout disease progression (genotype factor p < 0.0001, two-way ANOVA, Figure 3, Supplementary Table 2), while blood lactate levels were found only to be age-dependent in G93A-SOD1 mice (age factor p < 0.05, Table 2). Cr + PCr tended to increase in the motor cortex (age factor p < 0.05, Figure 3(d), Supplementary Table 2) and brainstem (genotype factor p < 0.001 and age factor < 0.05) of G93A-SOD1 mice. PCr/Cr ratio was slightly elevated in the striatum of G93A-SOD1 mice (genotype factor p < 0.05). In the contrary, a statistically significant reduction of PCr/Cr was seen in the motor cortex of transgenic animals (age factor p < 0.05).
Evolution of glucose (Glc, row a), lactate (Lac, row b), alanine (Ala, row c) and total creatine (Cr + PCr, row d), PCr/Cr (row e) and ascorbate (Asc, row f) of striatum (1st column), motor cortex (2nd column) and brainstem (3rd column). The solid dots were from WT mice and the solid triangles were from G93A-SOD1 mice. Statistical differences were evaluated using two-way ANOVA and marked “g” for genotype factor, “a” for age factor and “i” for the interaction. The increased number of symbols represents the levels of significant differences for the post hoc ANOVA comparisons between genotypes, such as “*”: p < 0.05; “**”: p < 0.01 and “***”: p < 0.001. Error bars are SEMs. Evolution of myo-Ins (row a), NAA (row b), Tau (row c), tCho (row d), aspartate (Asp, row e) and GSH (row f) of WT (solid dots) and G93A-SOD1 (solid triangles) mouse striatum (1st column), motor cortex (2nd column) and brainstem (3rd column). Statistical differences were evaluated using two-way ANOVA and marked “g” for genotype factor, “a” for age factor and “i” for the interaction. The increased number of “*” represents the levels of significant differences, as in Figure 2.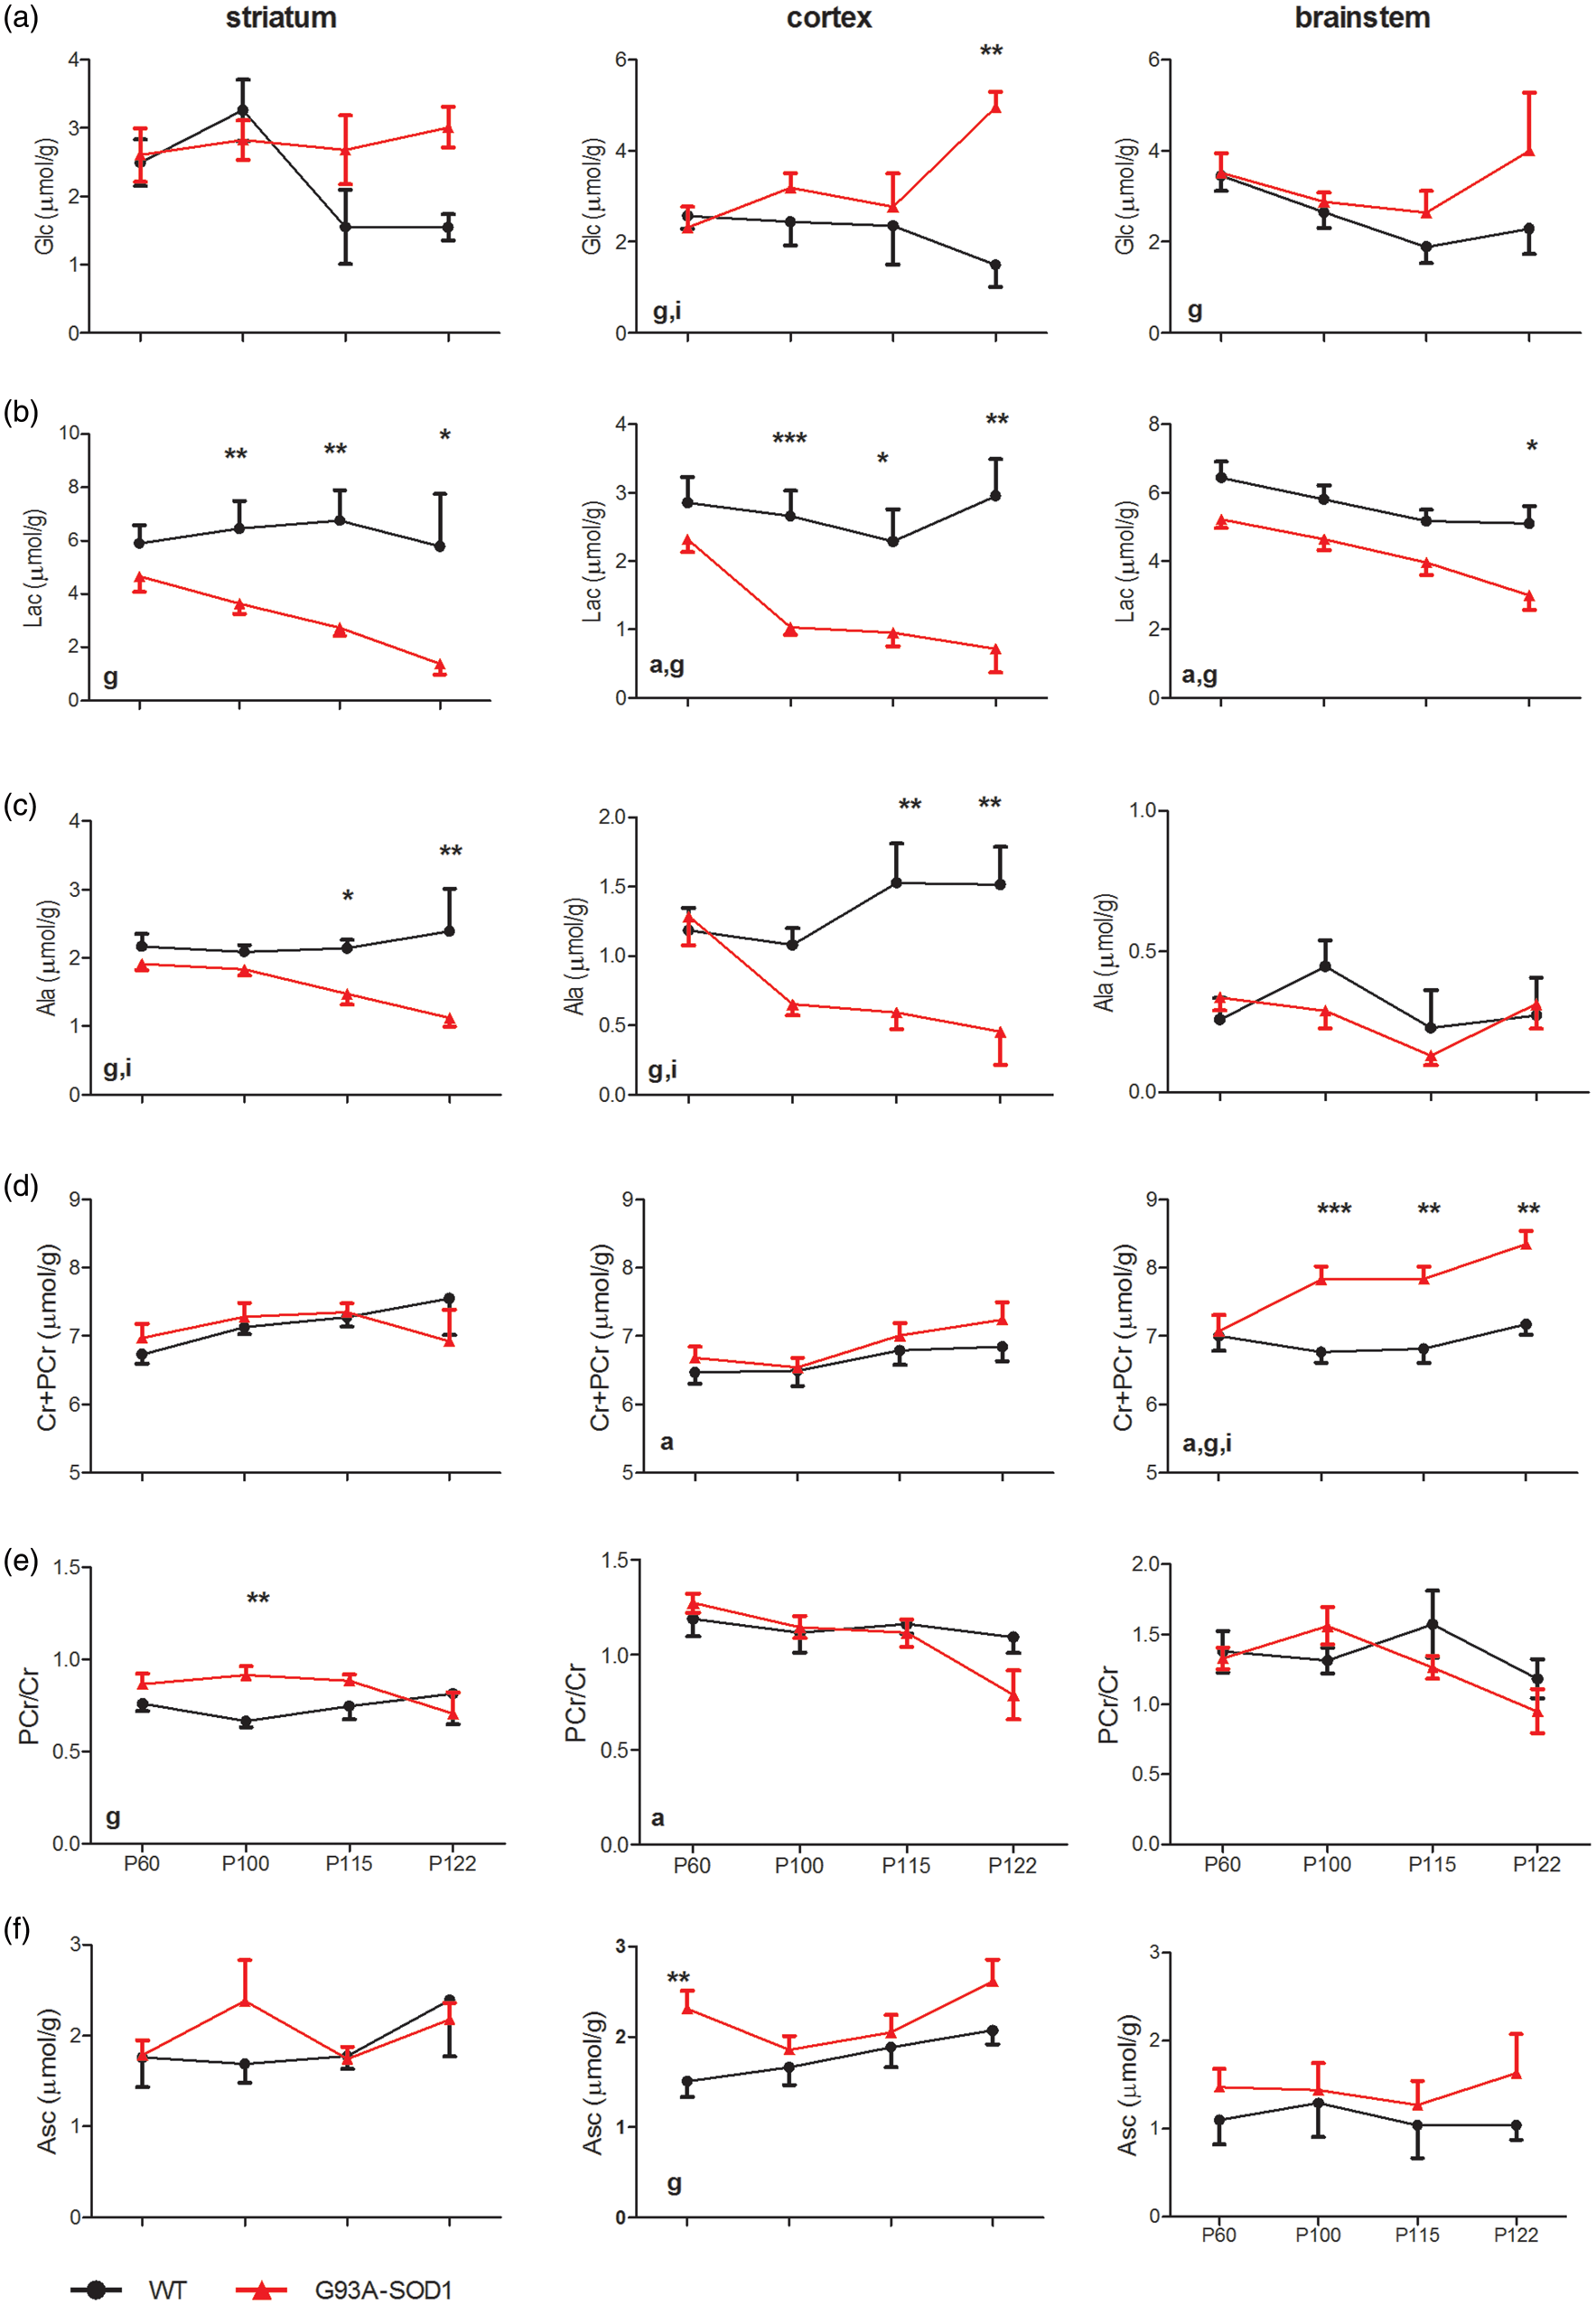
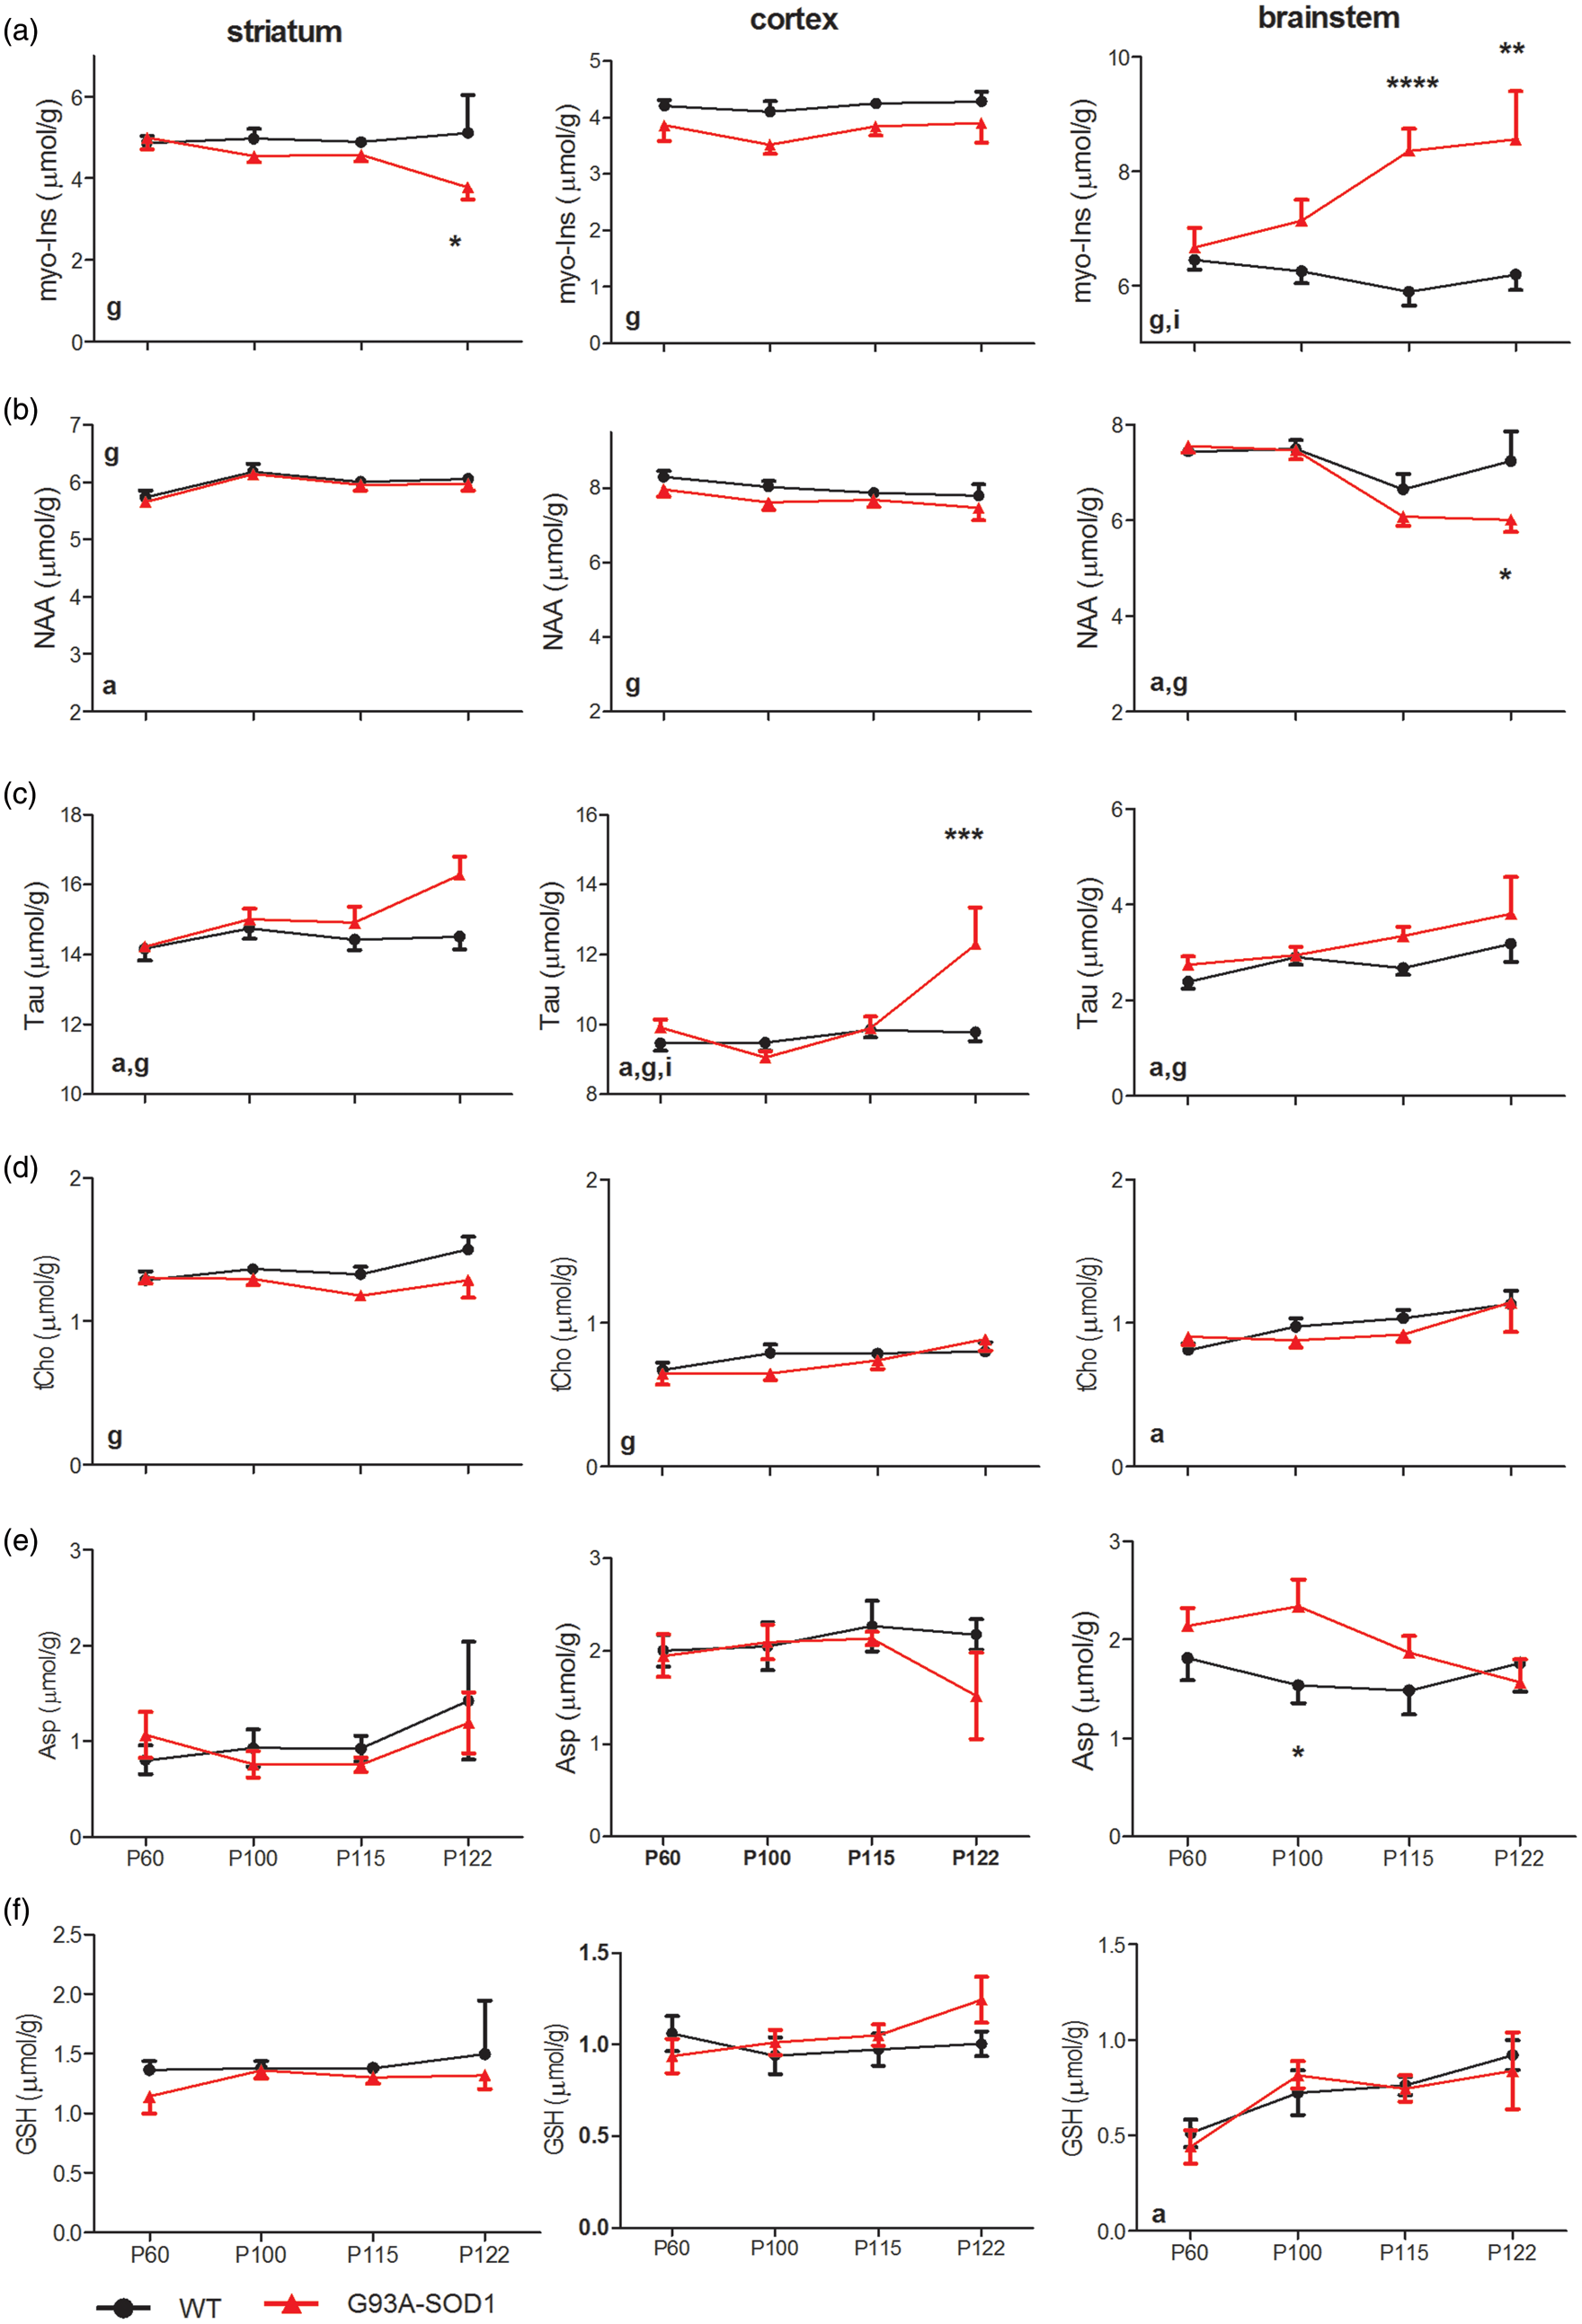
Myo-Ins, a putative glial marker, was highly elevated in the brainstem (genotype factor p < 0.0001, two-way ANOVA, Figure 4(a), Supplementary Table 2) but became lowered in the striatum (genotype factor p < 0.05) and motor cortex (genotype factor p < 0.01) of G93A-SOD1 mice. NAA, a potential neuronal marker, was systematically low in G93A-SOD1 mice and reached statistical significance in the motor cortex and brainstem (genotype factor p < 0.05, Figure 4(b)). Over the entire study period, a trend toward a decrease in NAA became apparent in the symptomatic age groups. Among other metabolites that were quantified, Tau levels globally increased in all analysed regions (genotype factor p < 0.05, age factor < 0.05, Figure 4(c)). Furthermore, significant differences in total choline (tCho) were observed between two groups (Figure 4(d)). In the motor cortex and brainstem of G93A-SOD1 mice, Asc increased slightly (Figure 3(f)), while GSH did not differ from their WT controls (Figure 4(f)).
Identification of biomarkers for early diagnosis
In order to evaluate the overall neurochemical profile of each brain region to be distinct between G93A-SOD1 and WT mice at the asymptomatic stage and thus to provide potential early biomarkers for the ALS disease, we performed PLS-DA for each region at P60. Hence, Figure 5 shows that two principal components (PC1 and PC2) allow differentiating the neurochemical profile of G93A-SOD1 mice from that of WT mice at age prior to symptom onset.
Partial least squares discriminant analysis (PLS-DA) of neurochemical profiles of striatum (row a), motor cortex (row b) and brainstem (row c) of G93A-SOD1 mice and WT mice at P60. The score plots of two components (the left column) (i.e. PC1 and PC2) discriminate regional profiles of G93A-SOD1 mice from those of WT mice at P60. The plots of loading factors (the right column) show the weighting contributions of each metabolite ratio in the principal components.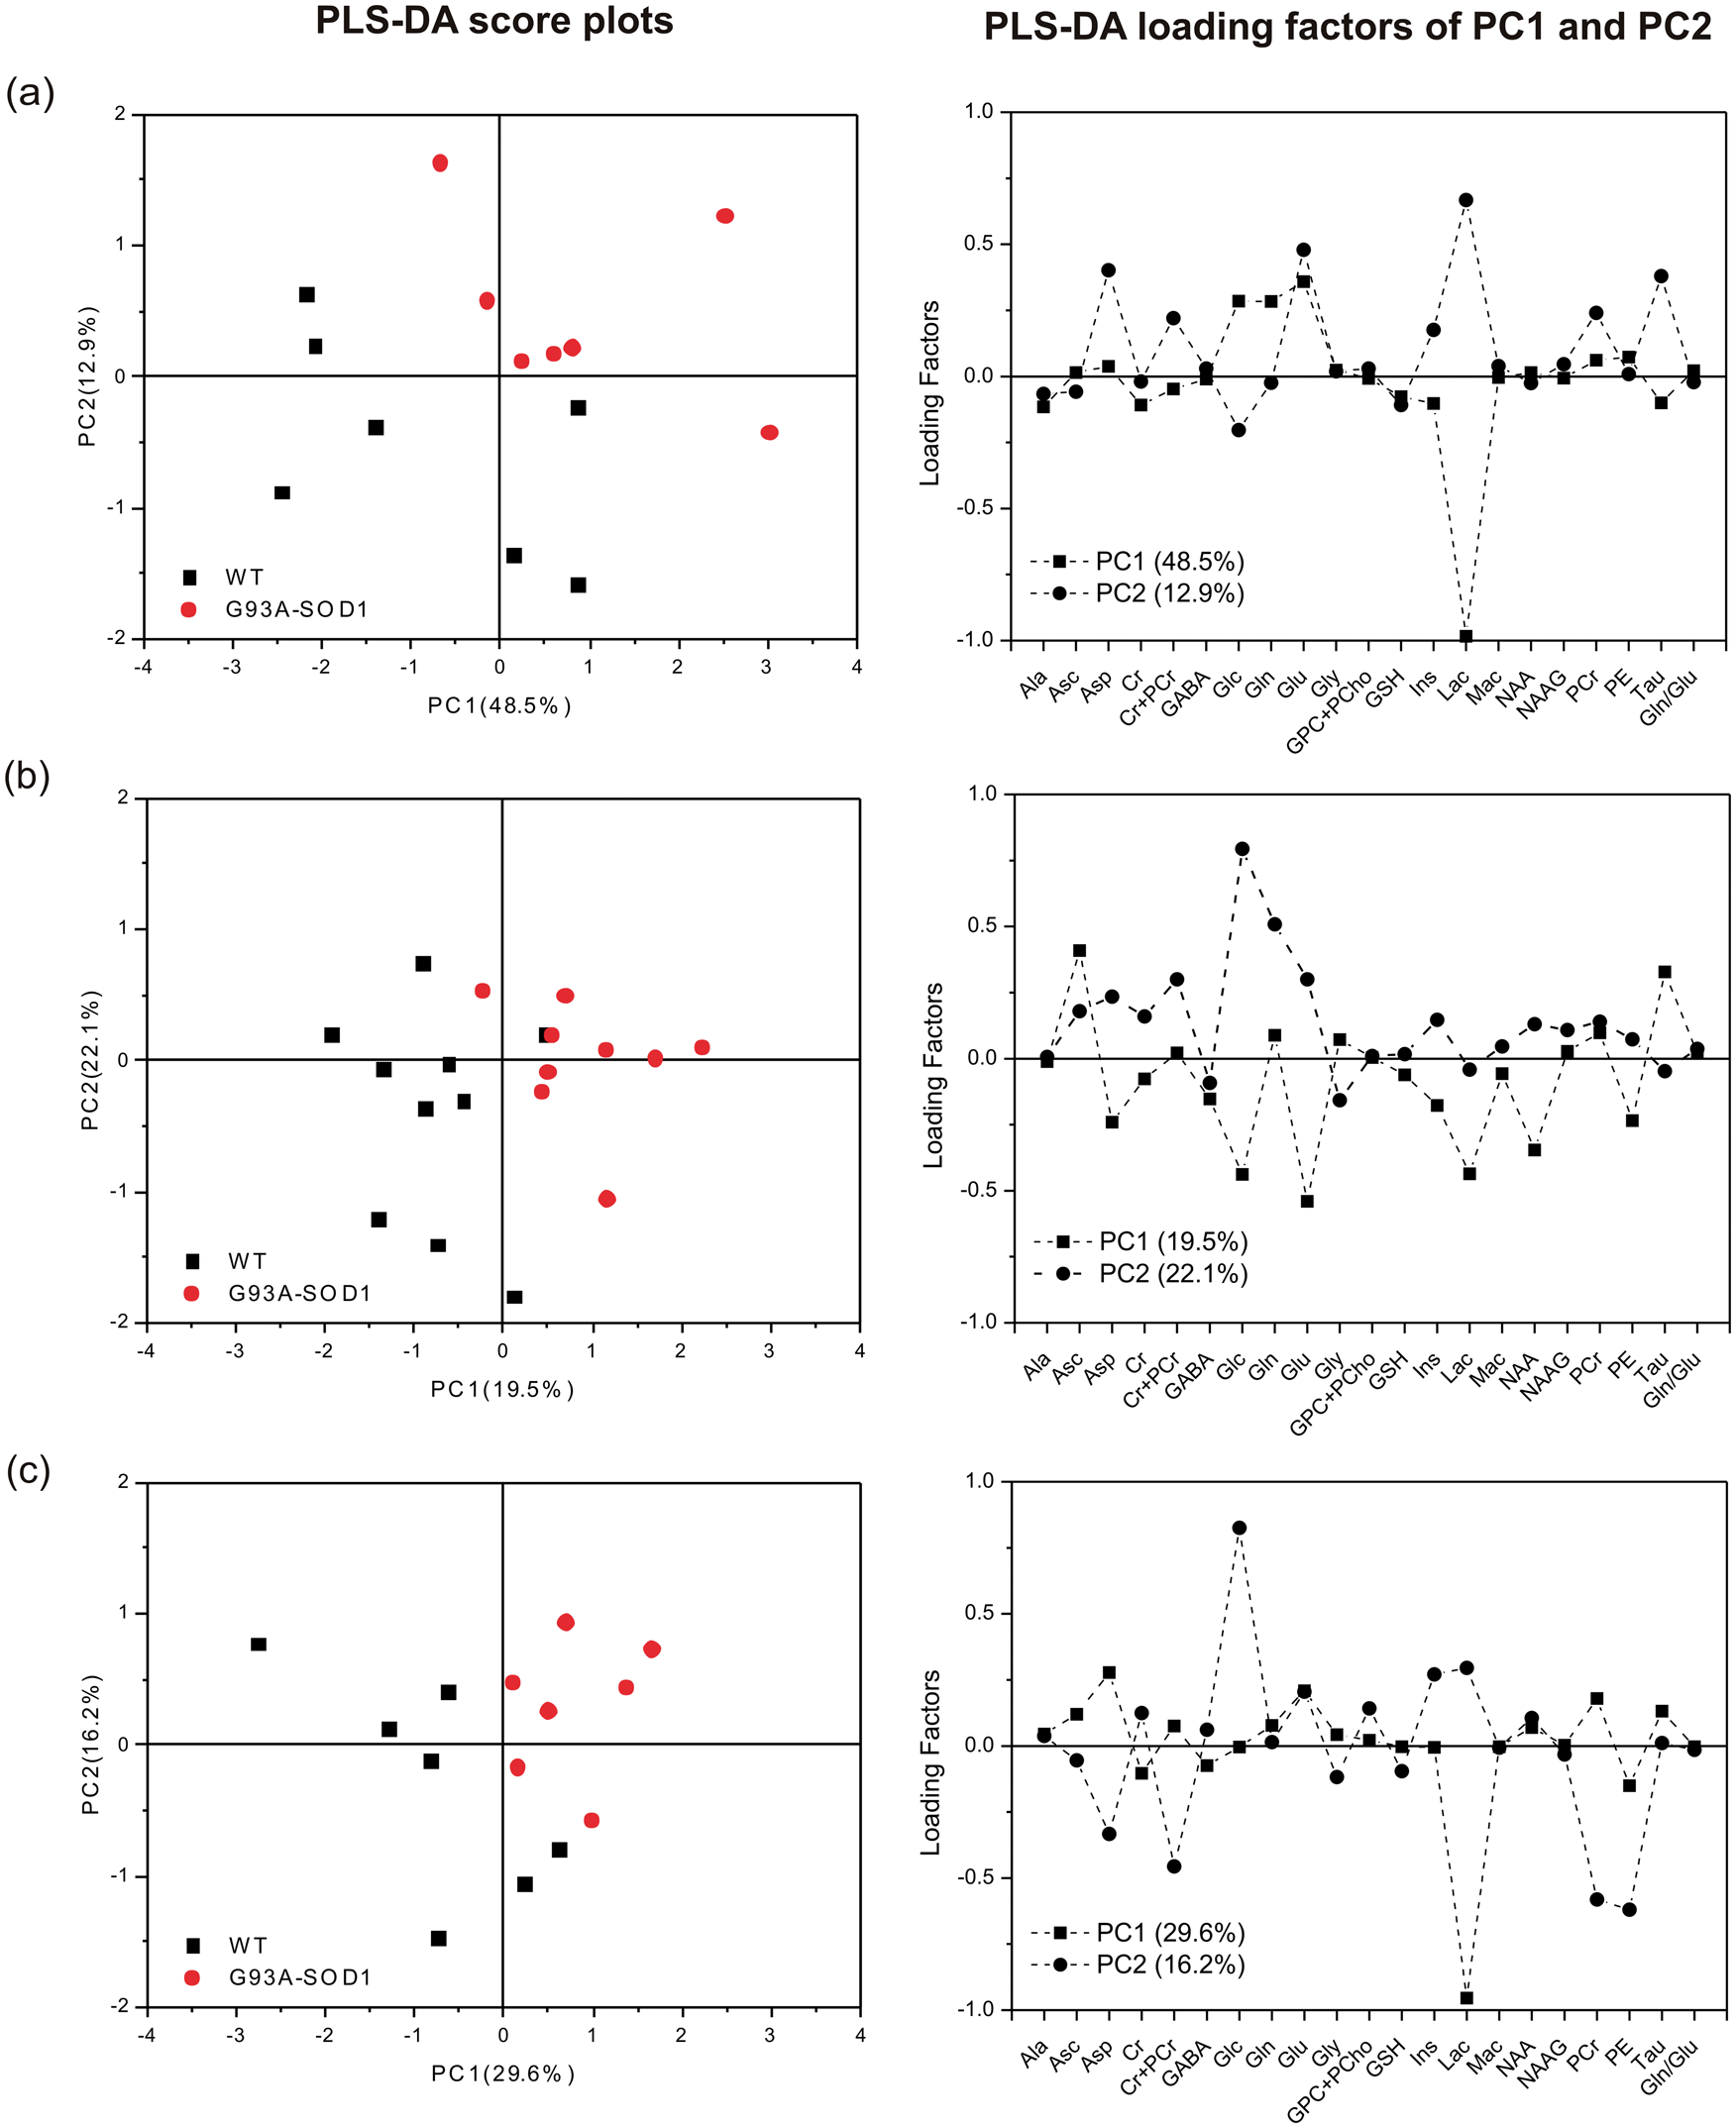
Discussion
Our study showed that non-invasive short-echo 1H-MRS measurements of murine neurochemical profiles of two motor neuron abundant regions (i.e. brainstem and motor cortex) and of one brain region specific to motor controls (i.e. striatum) are feasible at 9.4 T. We used the G93A-SOD1 mice, one animal model with its neuropathology well-characterized and reproducing the pathology observed in ALS patients. This study mainly documented neurochemical changes that occurred in the brainstem and motor cortex, two brain regions that contain abundant motor neurons and primarily affected by ALS. Importantly, neurochemical changes specific to G93A-SOD1 mice were detected in both the motor cortex and brainstem before the onset of motor symptoms. With disease progression, a number of neurochemical alterations further evolved with the appearance of the abnormal motor symptoms in the brainstem, motor cortex and striatum of G93A-SOD1 mice. Overall, our study provides evidence that 1H-MRS-detectable metabolic changes occur before the onset of symptoms. The regional neurochemical profiles of G93A-SOD1 mice are time-dependent, which contribute to the characterization of ALS progression in this animal model and may be used to guide ALS studies in patients to improve diagnosis.
1H-MRS revealed metabolic changes in the brain regions with abundant motor neurons
Most 1H-MRS studies performed in human ALS patients 21 have shown that NAA decreased in the motor cortex and brainstem, which has been attributed to neuronal cell death or dysfunction in these regions. This is consistent with some animal models 10 but remained debatable in G93A-SOD1 mice.38,39 Indeed, changes in the cortex appeared to be less severe and intrinsically more difficult to detect than those in the spinal cord because of its pathology.
In our study, even in the asymptomatic G93A-SOD1 mice, several metabolic changes were observed in all three investigated regions, including two motor neuron abundant regions (i.e. brainstem and motor cortex) and a brain region facilitating voluntary movement (striatum). For instance, Gln was globally elevated in all three regions (Figure 2(a)) and such an increase became more prominent in the brainstem and motor cortex of SOD1 mice at the mild symptomatic stage (Table 1, Supplementary Table 2). Overall, we hypothesise that NAA, Glu and its cycling mechanism could indicate motor neuron dysfunction, since astrocytes sense neuronal activity by taking-up Glu from the synaptic cleft, a process that is known to be dysfunctional in ALS.40,41
A statistically significant drop of NAA in the motor cortex at P60 and, thus, such decrease might indicate a possible trend in motor neuronal dysfunction or neuronal loss at this phase (Table 1, Figure 4). The NAA reduction in the motor cortex of G93A-SOD1 mice is within the precision of MRS measurements (i.e. 10%) and a slight increase of Gln/Glu (Table 1, Figure 2) was consistently detected at this stage, which indicated a possible shift in the Gln/Glu cycle linked to neurotransmission. The 1H-MR spectral profiles and metabolite changes observed at this particular stage were found different from those at the later stage, which mimics disease progression with more pronounced modifications at the later time-points (Table 1).
While no changes were presented in either glucose or lactate levels in the blood (Table 2), the symptomatic changes of energy substrates (Glc and Lac) and intermediates (PCr and Cr) in brain of G93A-SOD1 mice were consistently observed (Figure 3). Such changes in symptomatic transgenic mouse brain might likely reflect impaired energy metabolism, which could possibly be related to the depletion of adenosine triphosphate (ATP) observed in a similar G93A-SOD1 mouse model, 42 the depletion of cortical and subcortical glucose metabolism in ALS patients 43 or plausible hypermetabolism. 44 Biochemically, overexpression of SOD1 would increase the production of ATP in conversion of both Lac and Ala towards pyruvate mainly due to its role of binding copper and zinc ions, which was likely to induce oxidative stress.45,46 Consequently, overexpression of SOD1 might partially contribute to lowered Lac and Ala levels in G93A-SOD1 mice at both asymptomatic and symptomatic stages observed here.
Mitochondrial dysfunction in the motor neurons
It has been shown that either GABAergic inhibition-induced cortical hyperactivities 47 or increased affinity of GABAA receptors 48 could lead to lowered GABA levels, which was noticed in the motor cortex of G93A-SOD1 mice here (Table 1, Figure 2). This might indicate potential alterations in the GABAergic system in the transgenic mice, similar to ALS patients. 49 Apart from these changes, Asp, one of the key components of the malate-aspartate shuttle, was increased in the brainstems of G93A-SOD1 mice (Table 1, Figure 4) and might imply mitochondrial dysfunction, one factor contributing to motor neuron degeneration in ALS.46,50,51 It also has been shown that GABA, Asc and Tau appear to be counter-regulatory responses to oxidative stress (e.g. in Huntington’s disease). 52
In addition, symptomatic Cr + PCr increases in the brainstem of transgenic mice may reinforce the notion that mitochondrial dysfunction has occurred, further supported by the fact that the adenosine triphosphate (ATP) depletion has been reported in G93A-SOD1 mice. 42
It is of interest to note that some neurochemical changes were present in asymptomatic G93A-SOD1 mice but evolved further with disease progression in the striatum, a brain region that is responsible for gating proper initiation of movements and minimally involved in upper motor neuron dysfunction. This is consistent with previous observations of elevated nitrotyrosine-related immunoreactivity (a marker of peroxynitrite) in the lateral septal nucleus of G93A-SOD1 mice. 7
Excitotoxicity: An alternative evolving indicator for motor neuron dysfunction
Over disease progression, a significant increase in Gln was consistently noticeable in both the brainstem and motor cortex of G93A-SOD1 mice (Table 1, Figure 2). The highly increased Glu contents in the brainstem and striatum of G93A-SOD1 mice at P60 (Figure 2(b)) might be due to possible defective Glu uptake related to reduction of astrocytic glutamate transporter 1 (GLT-1) expression and, thus, may lead to excitotoxicity, 53 which could also explain the accumulation of Gln in both striatum and motor cortex observed by the present study (Figure 2). However, in G93A-SOD1 mouse striatum and brainstem, Glu tended to decrease with disease progression, reaching levels similar to those in the controls at P115 and dropped even further at P122 (Figure 2(b)). In the motor cortex of transgenic mice, Glu decreased while Gln on the other hand appeared to increase. Consequently, a significant 40% increase of cortical Gln/Glu ratio (Figure 2) was found when comparing to that of WT mice. This was consistent with the observations in the G93A-SOD1 mice at P60 from the same brain region and indicated possible neuronal dysfunction or loss. 54 The similar pattern of the increased Gln/Glu ratios was observed in both the striatum and brainstem of the G93A-SOD1 mice as well at this stage (Table 1, Figure 2(f), Supplementary Table 2). While overexpressing hSOD1 has minimal effect on liver, 55 such cerebral accumulation of Gln accompanied by changes in Glu (Table 1, Figure 2) may not be due to inefficient ammonia detoxification by the liver. 56 Thus, these Gln/Glu changes are consistent with excitotoxicity and observations in ALS, 57 other neurodegenerative diseases and transient ischemia25,58 and could to some extent explain motor neuron degeneration in ALS. 40
The elevated Glx (Glu + Gln) levels in G93A-SOD1 mice brainstems observed in this study is similar to a previous study, 20 with the exception that Gln and Glu evolve distinctly in the three investigated brain regions (Figure 2). Glx increased in the striatum of SOD1 mice but not in the motor cortex. This implies that differentiating Gln and Glu in specific brain regions using short-echo 1H-MRS at high magnetic fields would reveal early changes relating to excitotoxicity that might remain obscure considering Glx alone.14,20,49,59
Multiple types of brain cells might play roles in motor neuron dysfunction
In addition to excitotoxicity, gliosis has been suggested as a potential indicator for neuronal damage in neurodegenerative diseases, such as ALS. Numerous immunohistochemistry studies of ALS animal models and patients indicated possible astrogliosis and microgliosis.11,58,60–62 A G93A-SOD1 mouse model with a nearly identical lifespan 7 as ours presented with astrogliosis as early as asymptomatic but preceding microgliosis, which significantly increased only when the G93A-SOD1 mice were at the end-stage. In our study, myo-Ins in the G93A-SOD1 mouse brainstem increased slightly at P100 and evolved further at P115 (Figure 4), which are consistent with the observed microgliosis in one ALS murine model with the identical lifespan. 7 Alternatively, microglia activations might not be substantial enough 7 for causing any myo-Ins elevations in the motor cortex and striatum of G93A-SOD1 mice (Figure 4(a)), and support the findings that proliferating microglia might not be the key contributors to ALS disease progression. 63 Thus, the slightly lowered NAA in the motor cortex of G93A-SOD1 mice, at least before P122, might indicate neuronal dysfunction rather than neuronal loss. 7
Since cerebral Gln is only synthesised in astrocytes, 64 the elevated trends of Gln over three regions of the brain are consistent with an involvement of astrocytes in the G93A-SOD1 mouse brain (Figure 2, Table 1), along with additional changes in Glu and GABA. Furthermore, we have not detected any reduction in either Asc (Figure 3(f)) or GSH (Figure 4(f)) in the motor neurons abundant brain regions of transgenic mice. Instead, the elevation of Asc concentration was observed in the motor cortex of G93A-SOD1 mice. Since Asc can be synthesised in mice 65 while GSH did not reduce, such Asc increase may not attribute to any dietary changes. This could be likely associated with oxidative stress and linked to a possible abnormal ascorbic acid flux between astrocytes and neurons after Glu stimulation.66,67 Taken together, in vivo evidence supports the notion that multiple brain cells are involved in disease progression in the G93A-SOD1 mouse brain, even prior to symptom onset.
It is interesting to note that among three investigated brain regions of the WT controls at P60 (Figure 1(b)), brainstem exhibited the lowest anti-oxidant contents, e.g. Asc and GSH (two-way ANOVA analysis on region and metabolite factors, brainstem vs. striatum: region factor p-value = 0.0027 and metabolite factor p-value = 0.015; brainstem vs. motor cortex: region factor p-value = 0.0009 and metabolite factor p-value = 0.07). This may partially explain why the brainstem of G93A-SOD1 mice is more susceptible to oxidative stress and exhibited a slightly different pattern of neurochemical alterations when comparing to another motor neuron abundant brain region with more anti-oxidants reservoirs, i.e. motor cortex, 68 and most likely became one of the most profoundly affected brain regions (Figures 2 to 4, Supplementary Table 2).
Identification of early biomarkers in the G93A-SOD1 mice
The neurochemical changes observed in the present study are consistent with the underlying cellular responses of ALS that evolve with disease progression. Despite the complex disease progression, metabolic changes occurred for a number of metabolites, such as Lac, Gln, Glu, NAA and Tau (Figures 2 to 4, Supplementary Table 2), in the striatum, motor cortex and brainstem of G93A-SOD1 mice. By plotting most of the metabolites over the entire periods, both onset times and region-specific amplitudes of those metabolic changes were noticeably associated with the ALS disease progression (Figures 2 to 4), which need to be explored further in human ALS. The multiple changes observed at asymptomatic and symptomatic ages are of great interest as they profile high magnetic field short-echo spectroscopy as a potential diagnostic tool in ALS.
The estimation of early disease biomarkers was proposed to adapt the ability of the PLS-DA on the large number of metabolites. With significant changes in selected metabolites (Glu, GABA, Lac, NAA and Asc (as listed in Table 1)), a clear separation between mice overexpressed with G93A-SOD1 and their respective controls is shown in three brain regions at P60, the asymptomatic age (Figure 5). When examining the PLS-DA loading factors, other metabolites were noticed to be major contributors in the separation of both G93A-SOD1 mice and WT controls (Figure 5). For instance, Lac was noted to be one major contributor to PC1 in all three regions, and Glc was the other major contributor to PC2 in all three regions (Figure 5). Such results reinforce the notion that overexpression of SOD1 alters energy metabolism and is in line with lowered glycolysis, which was consistent with the observations in lowered Lac and highly elevated Glc at its late stage (Figure 3), and thereafter were confirmed by our preliminary positron-emission tomography (PET) imaging results assessed towards the end-stage of G93A-SOD1 mice (Supplementary Figure 1).
Our results demonstrate that short-echo 1H-MRS at 9.4T allows non-invasive assessment of neurochemical evolutions of the striatum, motor cortex and brainstem of one ALS animal model and provides metabolic biomarkers specific to mice overexpressing G93A-SOD1. Most recently, the development of short-echo 1H-MRS at high magnetic fields for humans 69 could further determine whether the spectroscopic signature observed in this experiment is relevant for ALS patients. Hence, besides providing in vivo insights on ALS pathogenesis, short-echo 1H-MRS has the potential for important applications towards to diagnosis and prognosis of ALS patients.
Conclusion
We conclude that 1H-MRS allows researchers to longitudinally study murine G93A-SOD1 models mimicking human ALS disease, providing region- and time-specific neurochemical profiles and alterations in the striatum, brainstem and motor cortex. Such metabolic alterations preceding symptom-onset in the ALS mouse models can yield additional insights into disease progression, identify early diagnosis biomarkers and ultimately aid in seeking targets for therapy.
Footnotes
Funding
The author(s) disclosed receipt of the following financial support for the research, authorship, and/or publication of this article: This work was supported by the Center for Biomedical Imaging (CIBM) of the University of Lausanne (UNIL), University of Geneva (UNIGE), Hôpitaux Universitaires de Genève (HUG), Centre Hospitalier Universtaire Vaudois (CHUV), Ecole Polytechnique Fédérale de Lausanne (EPFL) and the Leenaards and Jeantet Foundations. ED was supported by a fellowship of the Swiss Foundation for Research on Muscle Diseases (FSRMM).
Declaration of conflicting interests
The author(s) declared no potential conflicts of interest with respect to the research, authorship, and/or publication of this article.
Authors’ contributions
HL, ED, BLS, RG and PA designed study; HL, ED performed 1H MRS experiments and analysed 1H MRS data; CPY, ED performed PET experiments; CPY and HL analysed PET data; HL, ED wrote the manuscript; HL, ED, CPY, BLS, RG and PA revised the manuscript.
References
Supplementary Material
Please find the following supplemental material available below.
For Open Access articles published under a Creative Commons License, all supplemental material carries the same license as the article it is associated with.
For non-Open Access articles published, all supplemental material carries a non-exclusive license, and permission requests for re-use of supplemental material or any part of supplemental material shall be sent directly to the copyright owner as specified in the copyright notice associated with the article.