
Abstract
Early brain injury (EBI) after subarachnoid hemorrhage (SAH) is characterized by a severe, cerebral perfusion pressure (CPP)-independent reduction in cerebral blood flow suggesting alterations on the level of cerebral microvessels. Therefore, we aimed to use
Introduction
Subarachnoid hemorrhage (SAH) is a subtype of stroke with a particularly high morbidity and mortality. In all, 25% of patients die almost immediately after hemorrhage due to arrest of the cerebral circulation caused by acute intracranial hypertension as a consequence of the evolving hematoma (Pobereskin, 2001). Out of the remaining 75% of SAH victims, 15% die with a significant delay of several days (due to delayed cerebral ischemia or cardiopulmonary reasons); however, the remaining 60% of patients die within 48 h of the initial bleeding (Weir et al, 1978; Harrod et al, 2005) due to rebleedings (25%) or a sequence of events summarized by the term “Early Brain Injury” (EBI; 35%) (Pobereskin, 2001). While rebleedings can be prevented by surgical or endovascular procedures and, after years of research, new therapeutic options are emerging for the intriguing phenomenon of delayed cerebral ischemia, no treatment is available for EBI and its underlying mechanisms have only recently started to be understood (Cahill and Zhang, 2009; Pluta et al, 2009).
In patients, EBI usually occurs within the first 2 days after the initial bleed, i.e., well before the presence of macrovasospasm, which usually starts 5 to 8 days after SAH. One of the main characteristics of EBI is a severe reduction in cerebral blood flow (Schubert et al, 2009) and subsequent ischemic brain damage (Adams et al, 1981) under conditions of normal or almost normal cerebral perfusion pressure (CPP). Hence, ischemia has to be caused by the constriction of vessels on the level of the cerebral microcirculation, as previously demonstrated in experimental animals (Herz et al, 1975; Sehba et al, 2007; Sun et al, 2009) and in patients (Uhl et al, 2003; Pennings et al, 2004).
The sequence of events resulting in these early microvascular constrictions has been investigated by a series of elegant experimental studies using histological and imaging techniques and seems to start with an acute vasoconstriction of vessels at the scull base (the internal carotid artery, the anterior cerebral artery, and their A2 branches) as early as 5 minutes after SAH (Bederson et al, 1998; Sehba et al, 1999); this is followed by an acute constriction of intraparenchymal and pial microvessels (10 to 30 μm) up to 24 hours after SAH (Sehba et al, 2007; Sun et al, 2009). So far, however, most of these investigations were performed on fixed tissue (Bederson et al, 1998; Sehba et al, 1999, 2005, 2007) or only acutely (<2 hours) after SAH (Sun et al, 2009). Accordingly, little is known about the long-term spatial and temporal characteristics of post hemorrhagic microvascular constriction in the
Materials and methods
Male C57Bl6 mice (23 to 25 g body weight,
Animal Preparation and Monitoring
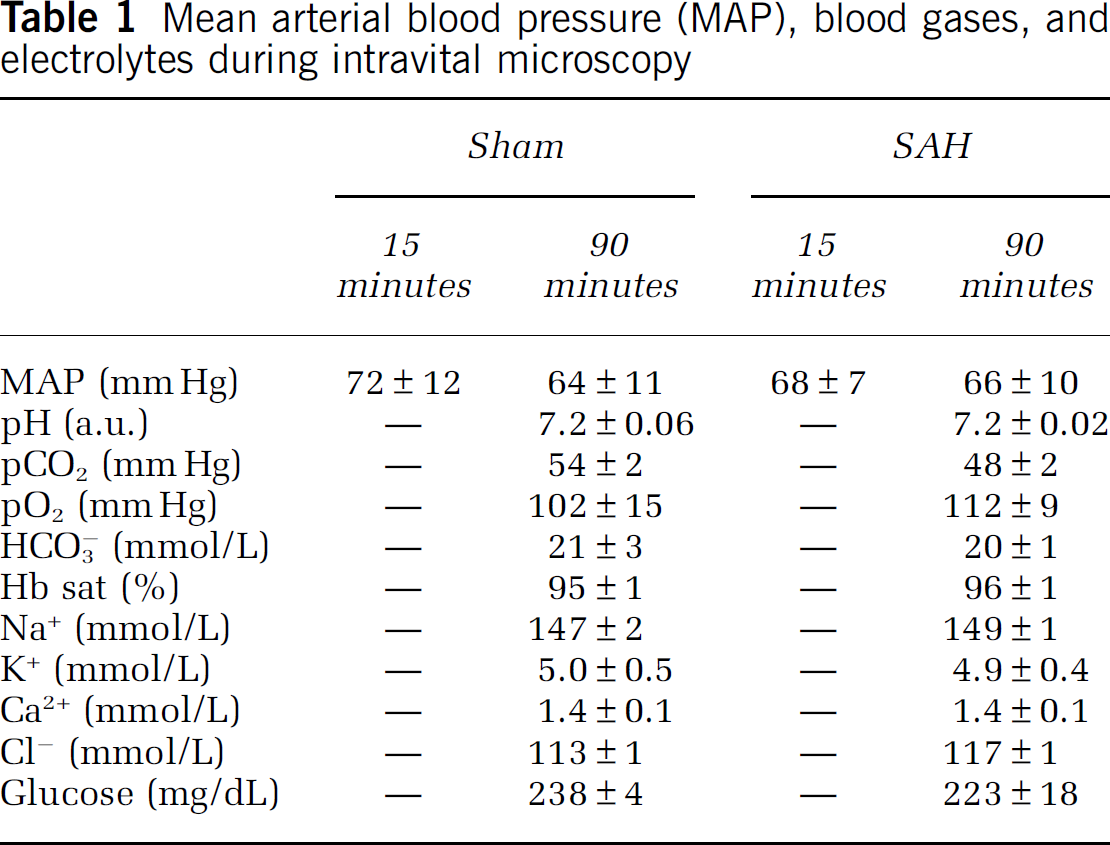
Animals had free access to food and water before surgery. Anesthesia was induced by intraperitoneal injection of midazolam (5 mg/kg; Ratiopharm, Ulm, Germany), fentanyl (0.05 mg/kg; CuraMed, Karlsruhe, Germany), and medetomidine (0.5 mg/kg; Pfizer, Karlsruhe, Germany) and was maintained by hourly injections of one quarter of the initial dose as previously described (Thal and Plesnila, 2007). Mice were oro-trachealy intubated and mechanically ventilated with 35% O2 in room air (Minivent, Hugo Sachs, Hugstetten, Germany). End-tidal pCO2 was measured with a microcapnometer (C1240, Columbus Instruments, Columbus, OH, USA) and kept constant between 35 and 45 mm Hg by respective adjustments of ventilation. A thermostatically regulated, feedback-controlled heating pad (FHC, Bowdoinham, ME, USA) was used to maintain body temperature at 37°C. Intracranial pressure (ICP) was measured in each animal for 15 minutes after SAH using a microchip-based pressure transducer (Johnson & Johnson Medical Limited, Berkshire, UK) to prove successful induction of SAH as recently described in detail (Feiler et al, 2010). Blood gases and electrolytes were determined at the end of each experiment (Table 1).
Mean arterial blood pressure (MAP), blood gases, and electrolytes during intravital microscopy
Induction of Subarachnoid Hemorrhage
Subarachnoid hemorrhage was induced using the endovascular perforation technique as described previously (Feiler et al, 2010; Schöller et al, 2011). Briefly, a 5-0 monofilament was introduced via the left external carotid artery into the internal carotid artery and advanced intracranially. Successful SAH induction was proven by a sudden sharp increase in ICP. Immediately, thereafter the filament was withdrawn and the external carotid artery was ligated. In sham-operated animals, the filament was introduced into the internal carotid artery and advanced intracranially, but no SAH was induced. Anesthesia was terminated by intraperitoneal injection of atipamezole (2.5 mg/kg; Pfizer), naloxone (1.2 mg/kg; Inresa, Freiburg, Germany), and flumazenil (0.5 mg/kg; Hoffmann-La-Roche, Grenzach-Wyhlen, Germany). Thereafter, animals were kept in an incubator at 33°C for up to 24 hours.
Intravital Fluorescence Microscopy
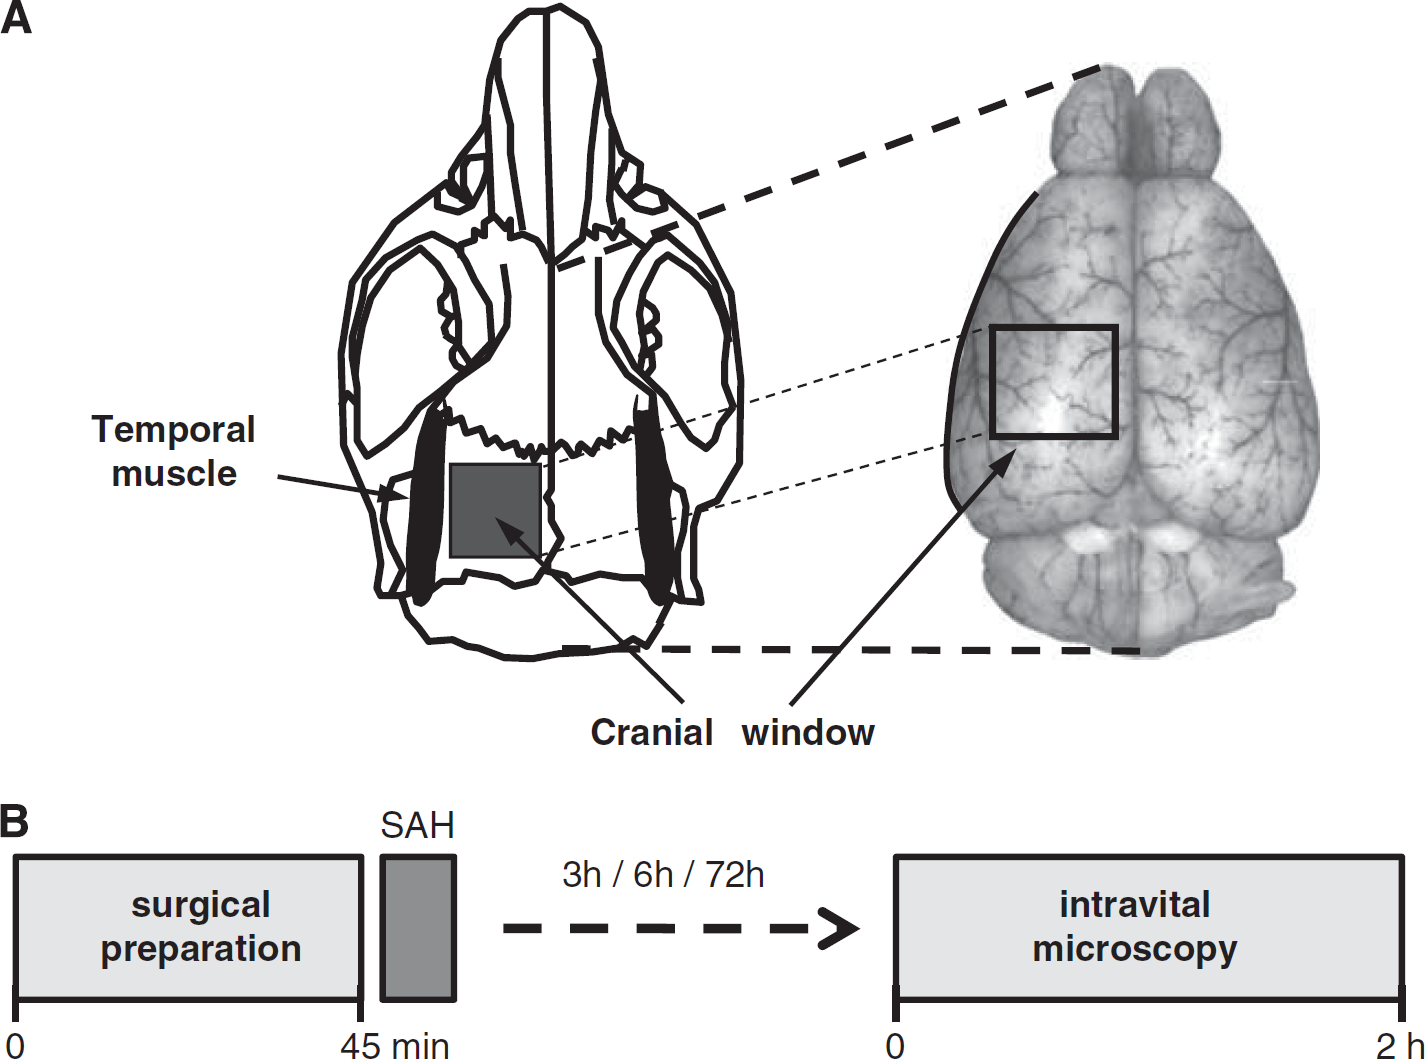
Intravital microscopy was performed as previously described (Kataoka et al, 2004; Schwarzmaier et al, 2010). Briefly, animals were reanesthetized and a cranial window (2 × 2 mm) was drilled above the left hemisphere (Figure 1A). The microcirculation was visualized by intravenous injection of 0.15 ml fluoresceinisothiocyanate [FITC]-dextran (MW 150 kDa; Sigma, Deisenhofen, Germany). The entire vascular tree of the ipsilateral middle cerebral artery (MCA) (vessel diameter: 10 to 80 μm; 12 to 32 vessel segments per mouse) was investigated in each animal. Each segment was evaluated every 15 minutes for 10 seconds. A total of 466 vessel segments (each possibly containing more than one constricted section) were investigated. Images were recorded on videotapes and analyzed offline by a blinded investigator.
(
Analysis of the Pial Microvasculature
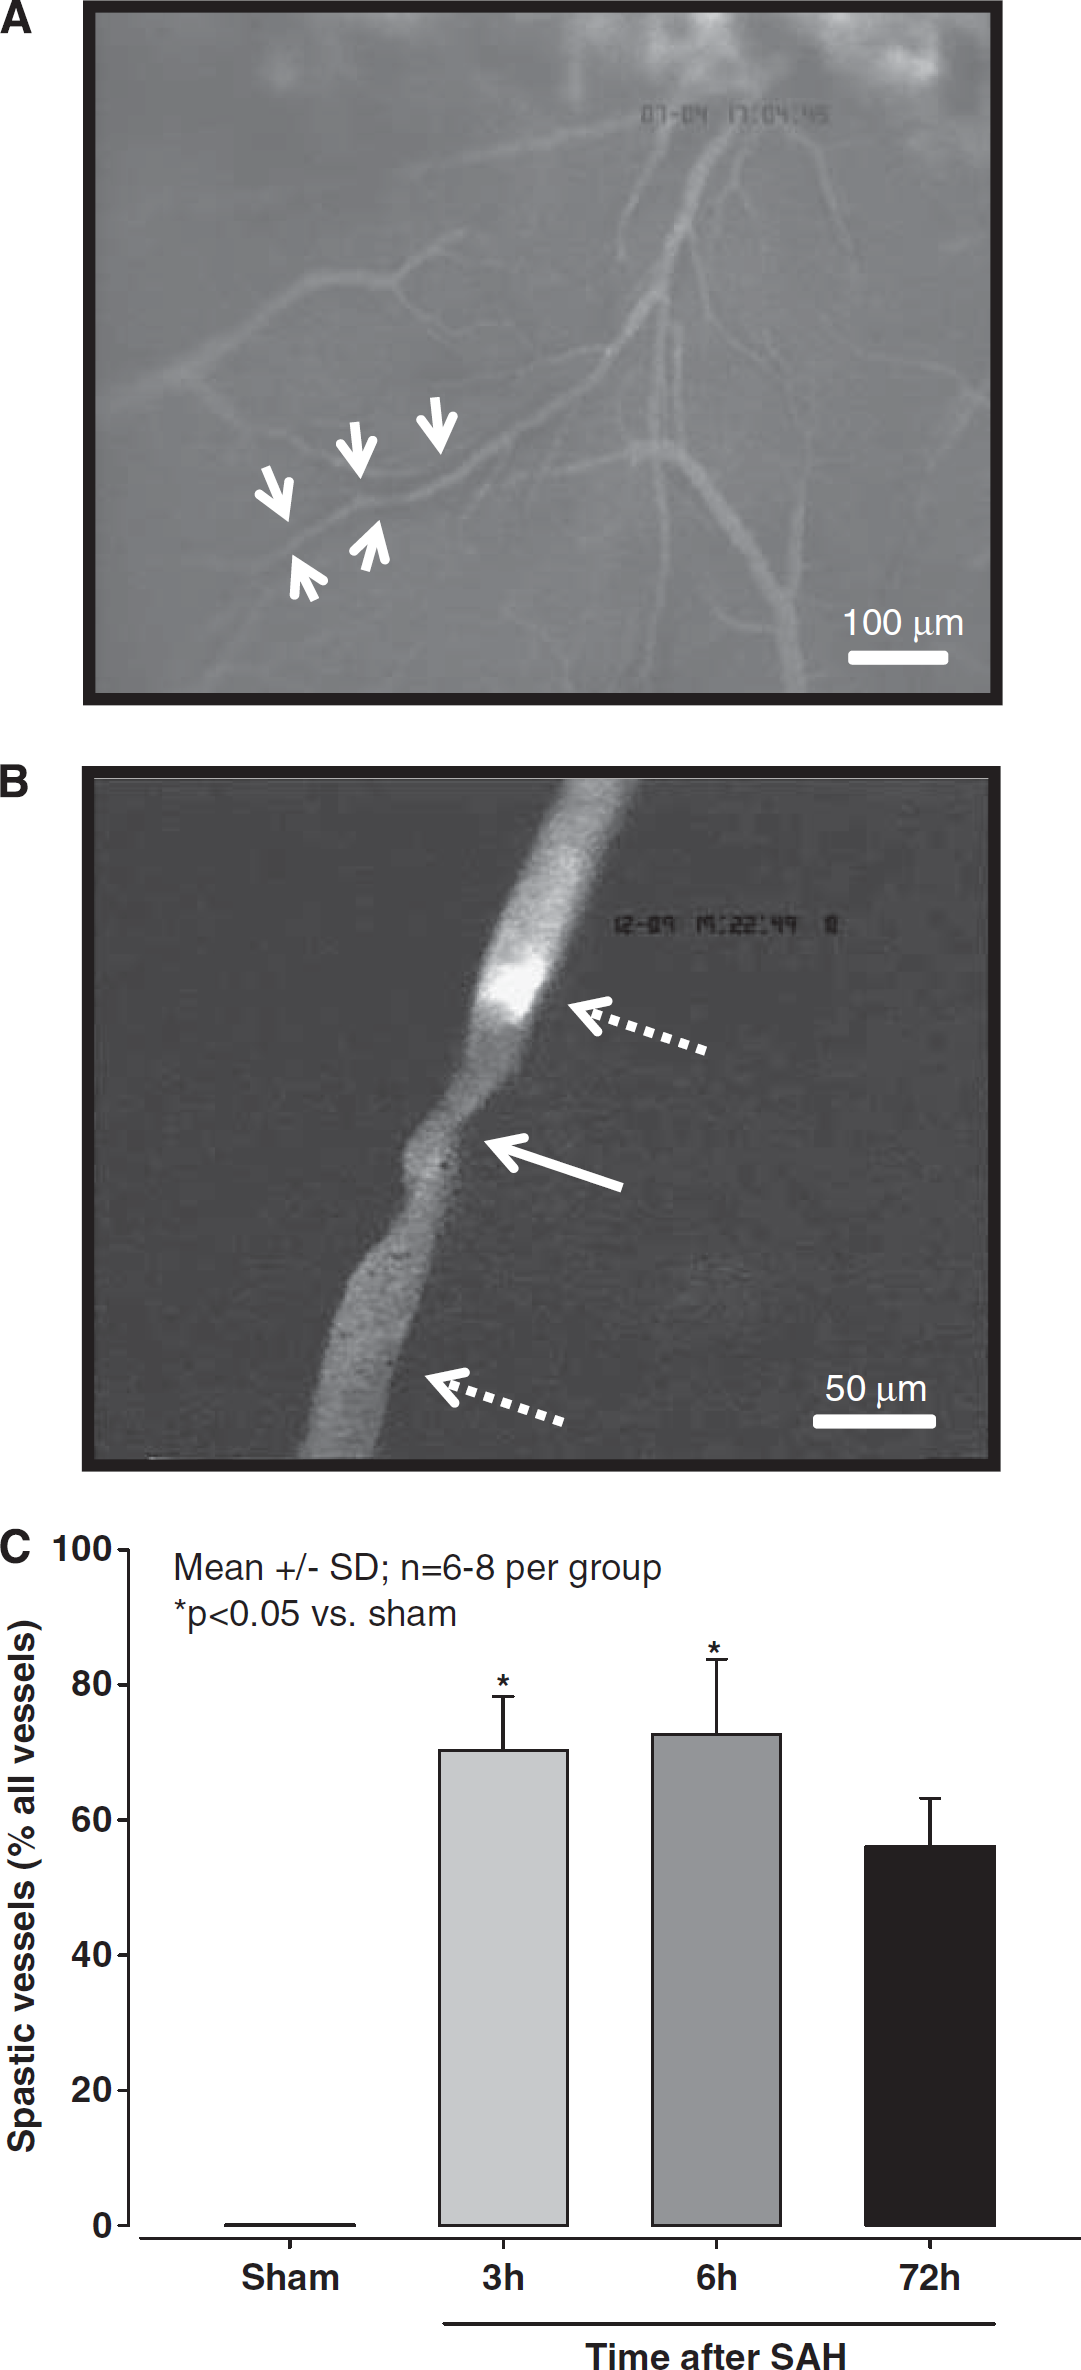
Vessel diameters were quantified with a custom-made image analysis software (CapImage, Heidelberg, Germany) as previously described (Kataoka et al, 2004; Schwarzmaier et al, 2010). Individual vessel constrictions were analyzed by dividing the diameter of the most constricted vessel segment (Figure 2B, white solid arrow) by the diameter of the nearest not constricted vessel segment (Figure 2B, dotted arrow bottom). For graphical and statistical representation, vessels were grouped by their nonconstricted diameters into four categories (<20 μm, 20 to 30 μm, 30 to 40 μm, and 40 to 80 μm). To validate that not constricted appearing vessel segments indeed represented the baseline diameter of this vessel, microvessels were categorized by their degree of branching from the MCA (A1 to A6) (Strahler, 1944) and the mean diameter of each category was calculated and compared between sham-operated mice and mice subjected to SAH. No difference was detected between groups indicating that nonconstricted vessel segments in mice subjected to SAH indeed represented the physiological baseline (data not shown). Microthrombosis was identified by lack of microvascular perfusion together with the massive accumulation of FITC-dextran-stained platelets (Figure 2B, dotted arrow top).
(
Experimental Protocol
Four experimental groups were investigated by intravital microscopy: (1) 3 hours after sham surgery (
Statistical Analysis
Statistical analysis was performed with SigmaStat 3.1 (SPSS Science, Chicago, IL, USA). Data were analyzed with Kruskal—Wallis analysis of variance on ranks followed by Dunn's method as
Results
Monitoring and Mortality
Subarachnoid hemorrhage resulted in an immediate and steep increase in ICP to 60±6 mm Hg (mean±s.e.m.), indicating a comparable severity of SAH in all animals investigated. The overall mortality was 29% (9/31), well in agreement with our previously published results in C57/BL6 mice (Feiler et al, 2010; Schöller et al, 2011).
After intravital microscopy, physiological parameters (mean arterial blood pressure, blood gases, electrolytes, and blood glucose) did not differ between SAH and sham-operated animals, indicating comparable physiological conditions in all investigated animals (Table 1).
Distribution of Blood
After SAH, blood spread within the subarachnoid space at the base of the skull and reached the apical cerebral cortex (Figure 2A). Interestingly, the blood did not spread homogenously but accumulated around vessels as identified by a dark margin ensheathing the vessels in the subarachnoid space (Figure 2A, white arrows). About two thirds of all microvessels deriving from the MCA in SAH-induced mice showed this pattern, similar findings were never observed in sham-operated animals (data not shown).
Microvascular Constriction
Three hours after SAH, numerous constricted microvessels were observed. All observed vessels were arterioles; no change of vessel diameter was observed in venules (data not shown). Surprisingly, arteriolar constrictions were not uniform but showed repetitive constrictions approximately every 50 μm along vessels (Figure 2B). This pattern is very similar to the pearl string-like constrictions observed by Uhl et al (2003) in SAH patients. No microvascular constrictions were observed in sham-operated mice.
Quantification of these observations revealed that, 3 hours after SAH, 70% of all MCA branches (115 out of 164 investigated vessels) showed one or more constrictions (
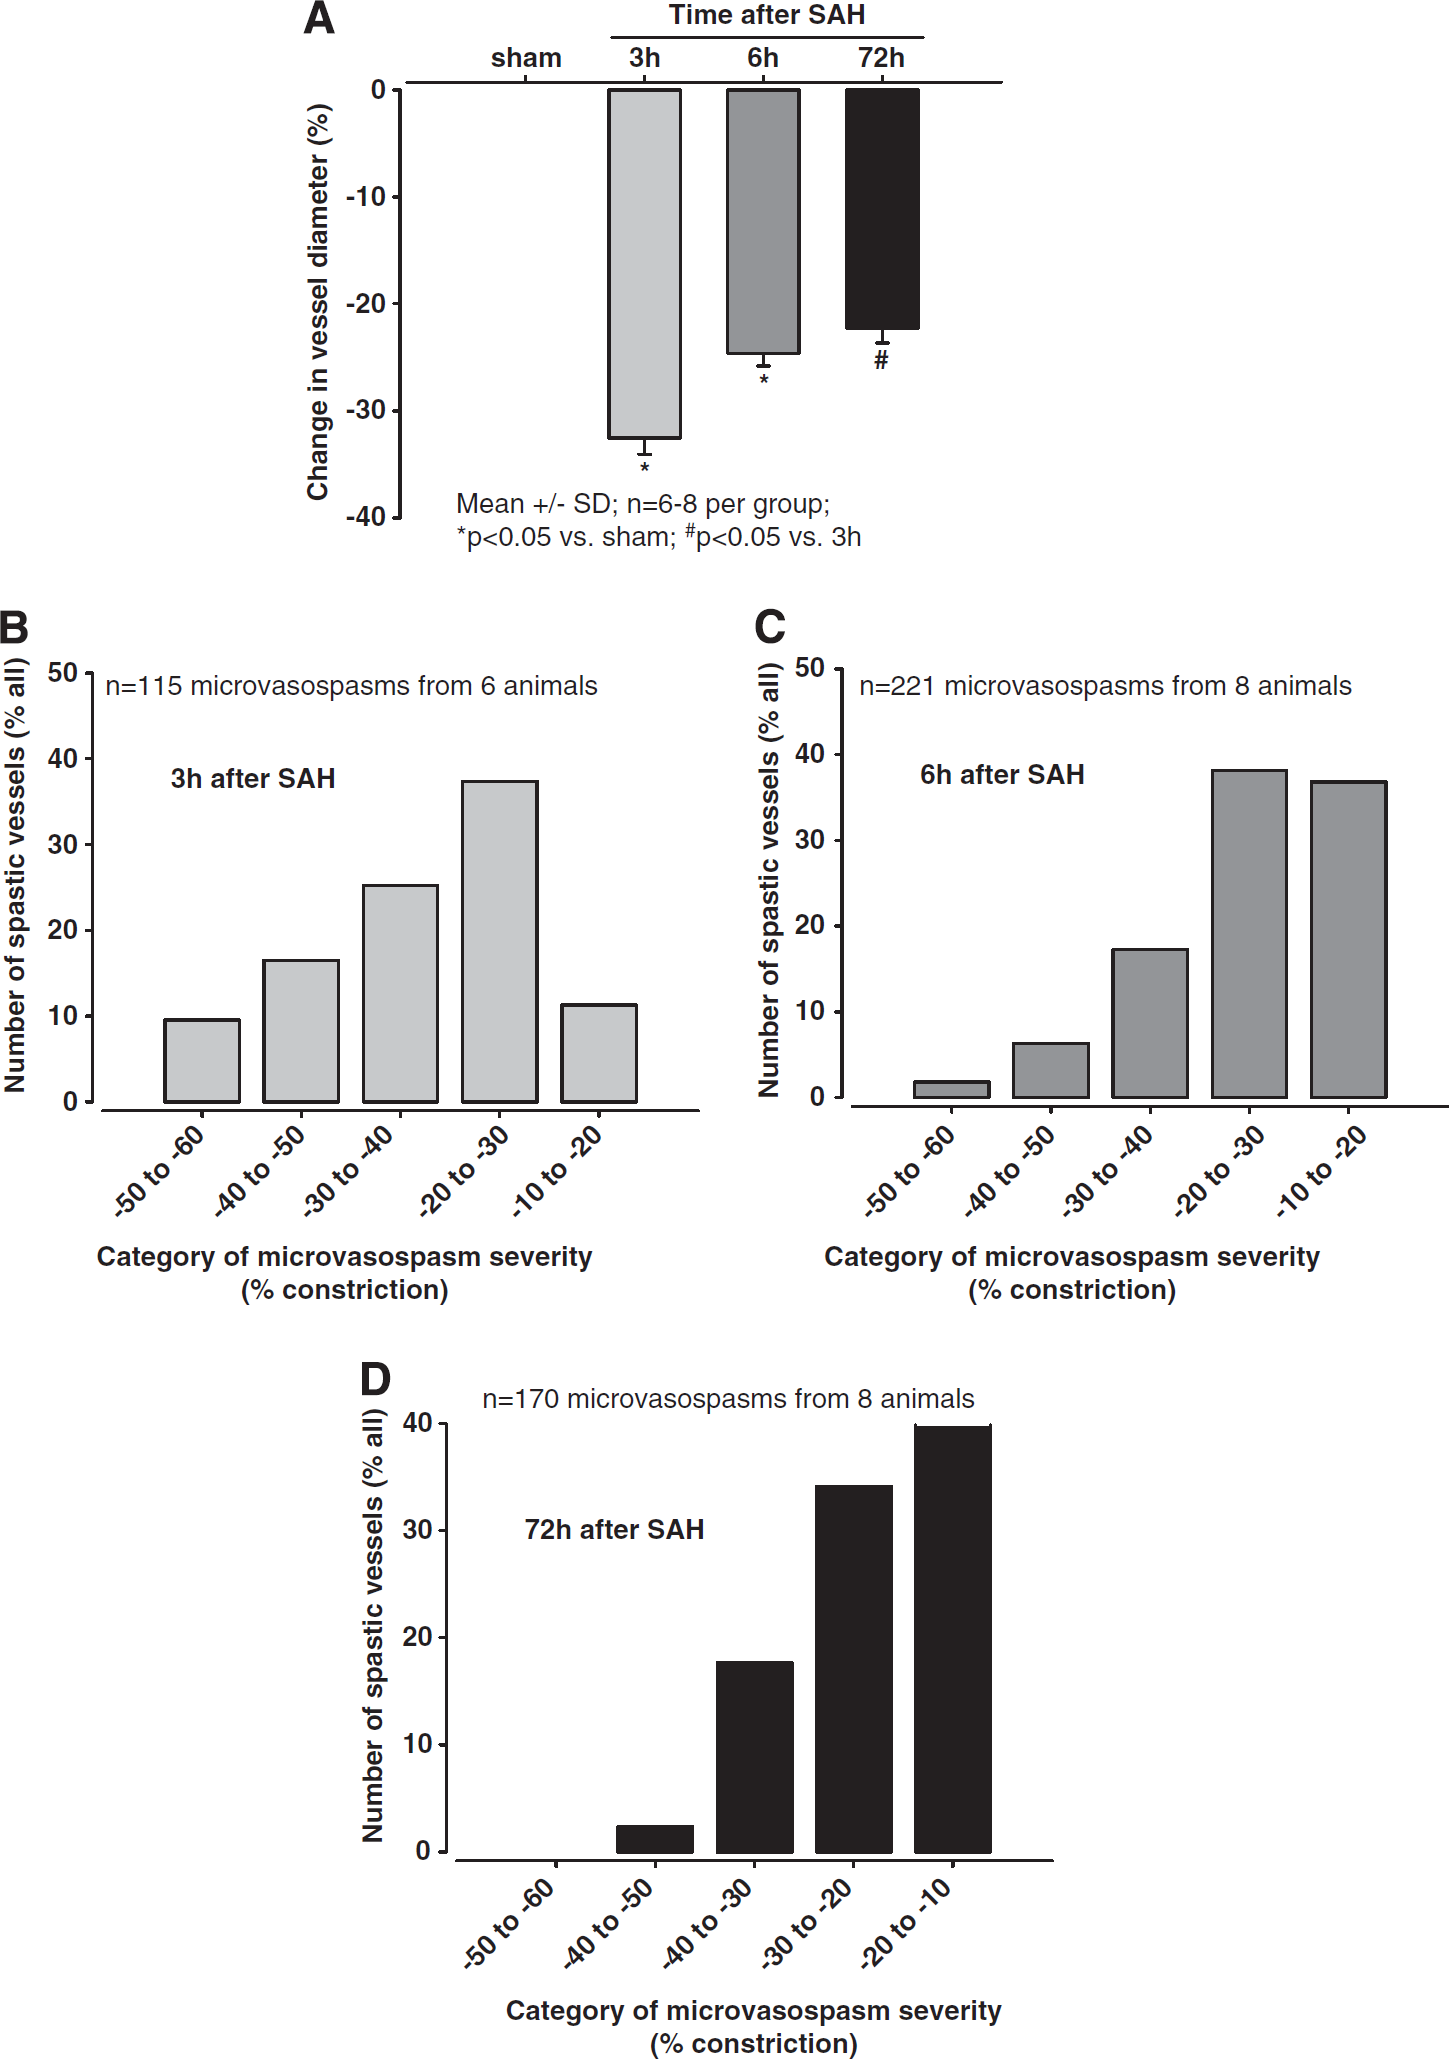
Affected vessel segments constricted by an average of 33±2% 3 hours after SAH (
(
To investigate which size of arterioles was most affected by vasoconstriction, we analyzed the degree of constriction as a function of vessel diameter. Independent of the investigated time point, small arterioles always demonstrated the most severe constriction (Figures 4A—C), e.g., 3 hours after SAH arterioles with a baseline diameter of 10 to 20 μm constricted by 38.2±2.4% of baseline, while arterioles in the 40 to 80-μm category constricted by only 23.2±1.9%, i.e., almost 40% less (
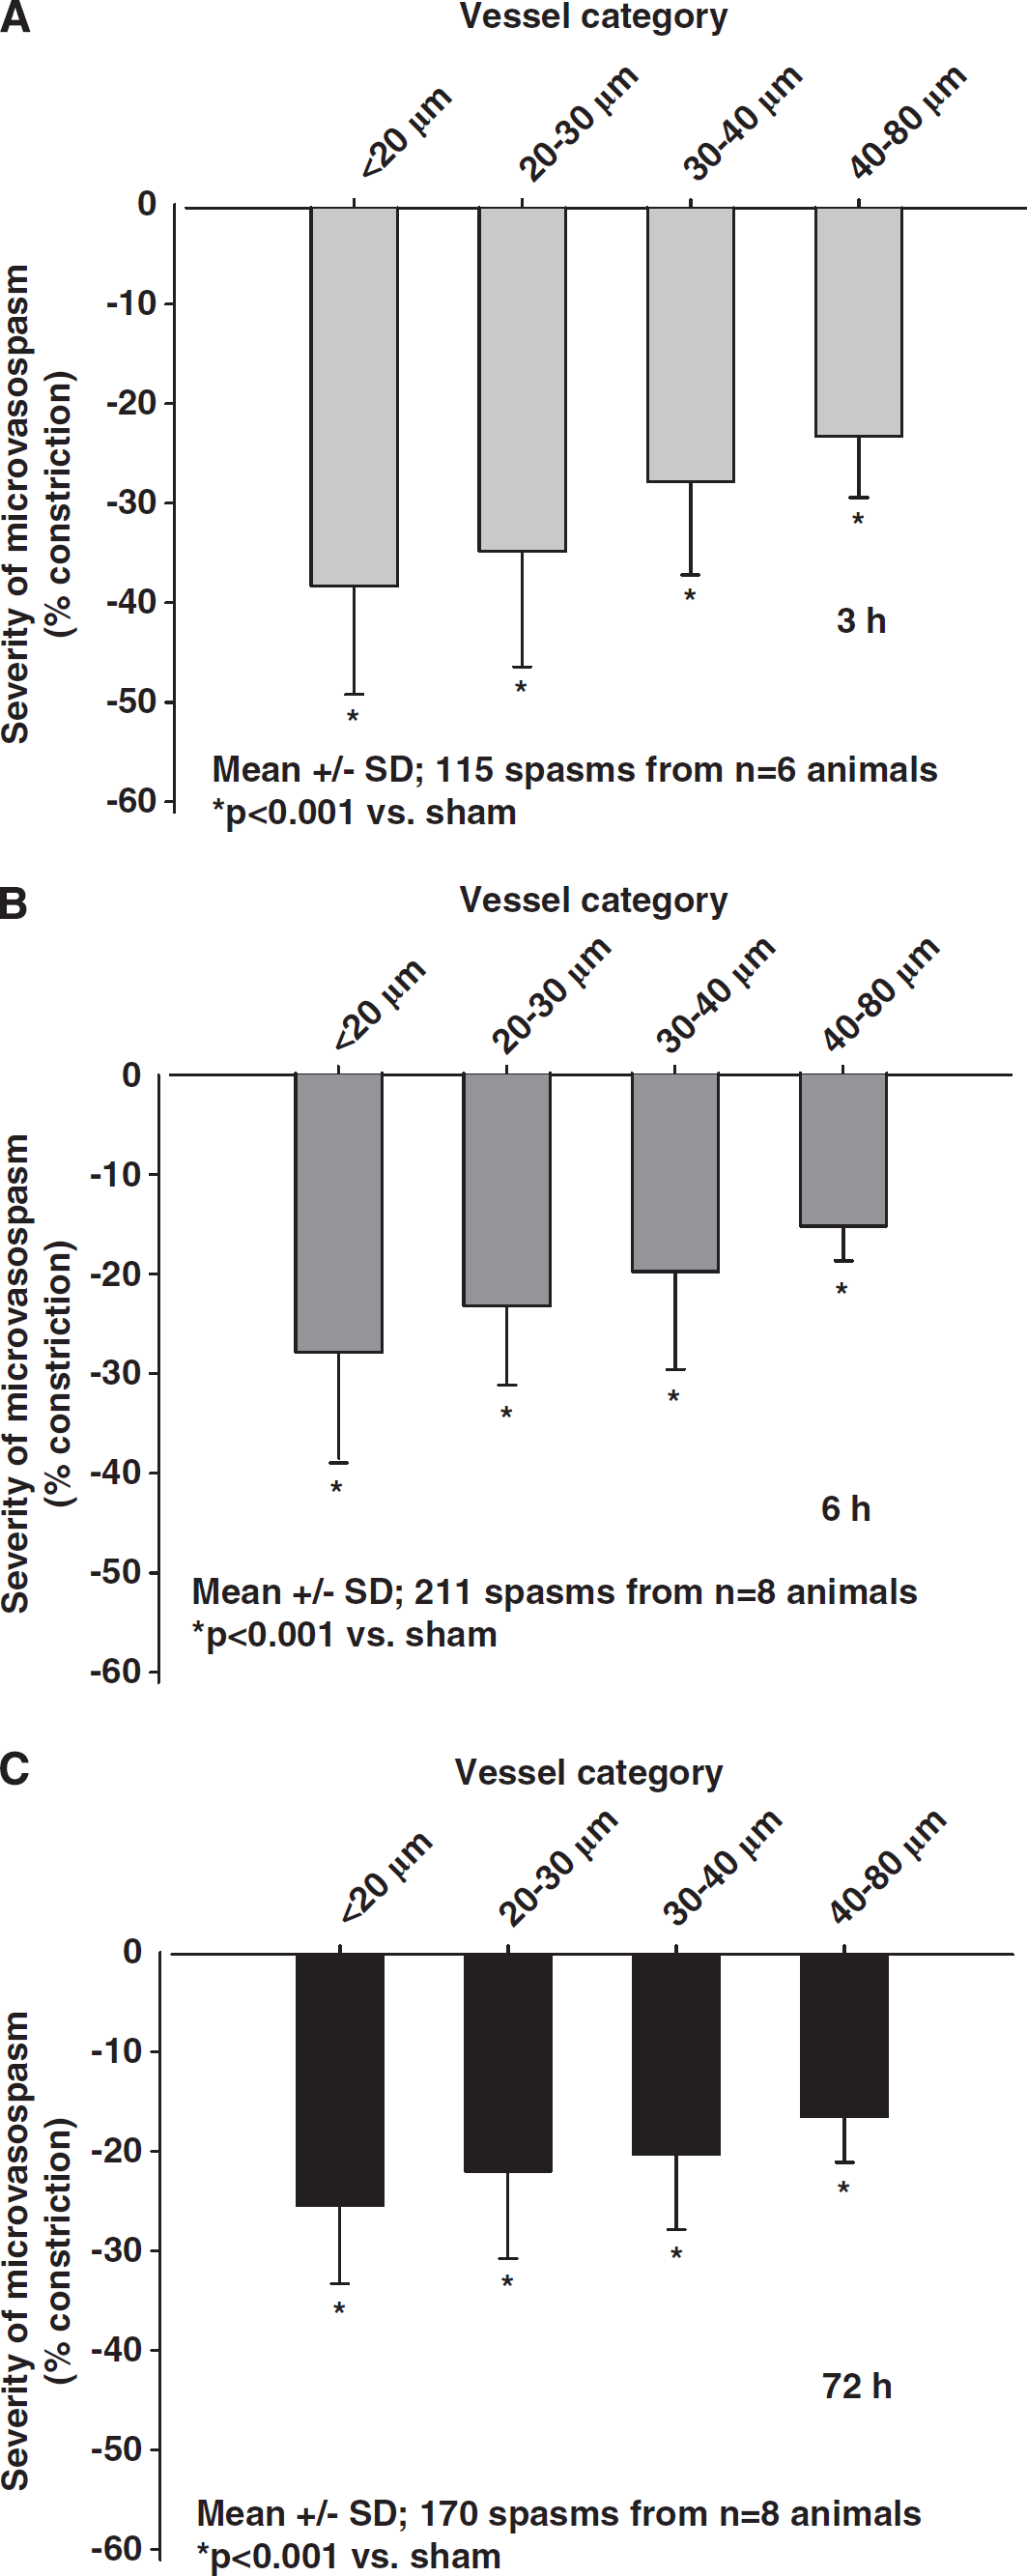
Severity of microarteriolar spasm depending on the baseline diameter of the affected vessels (
Microthrombi
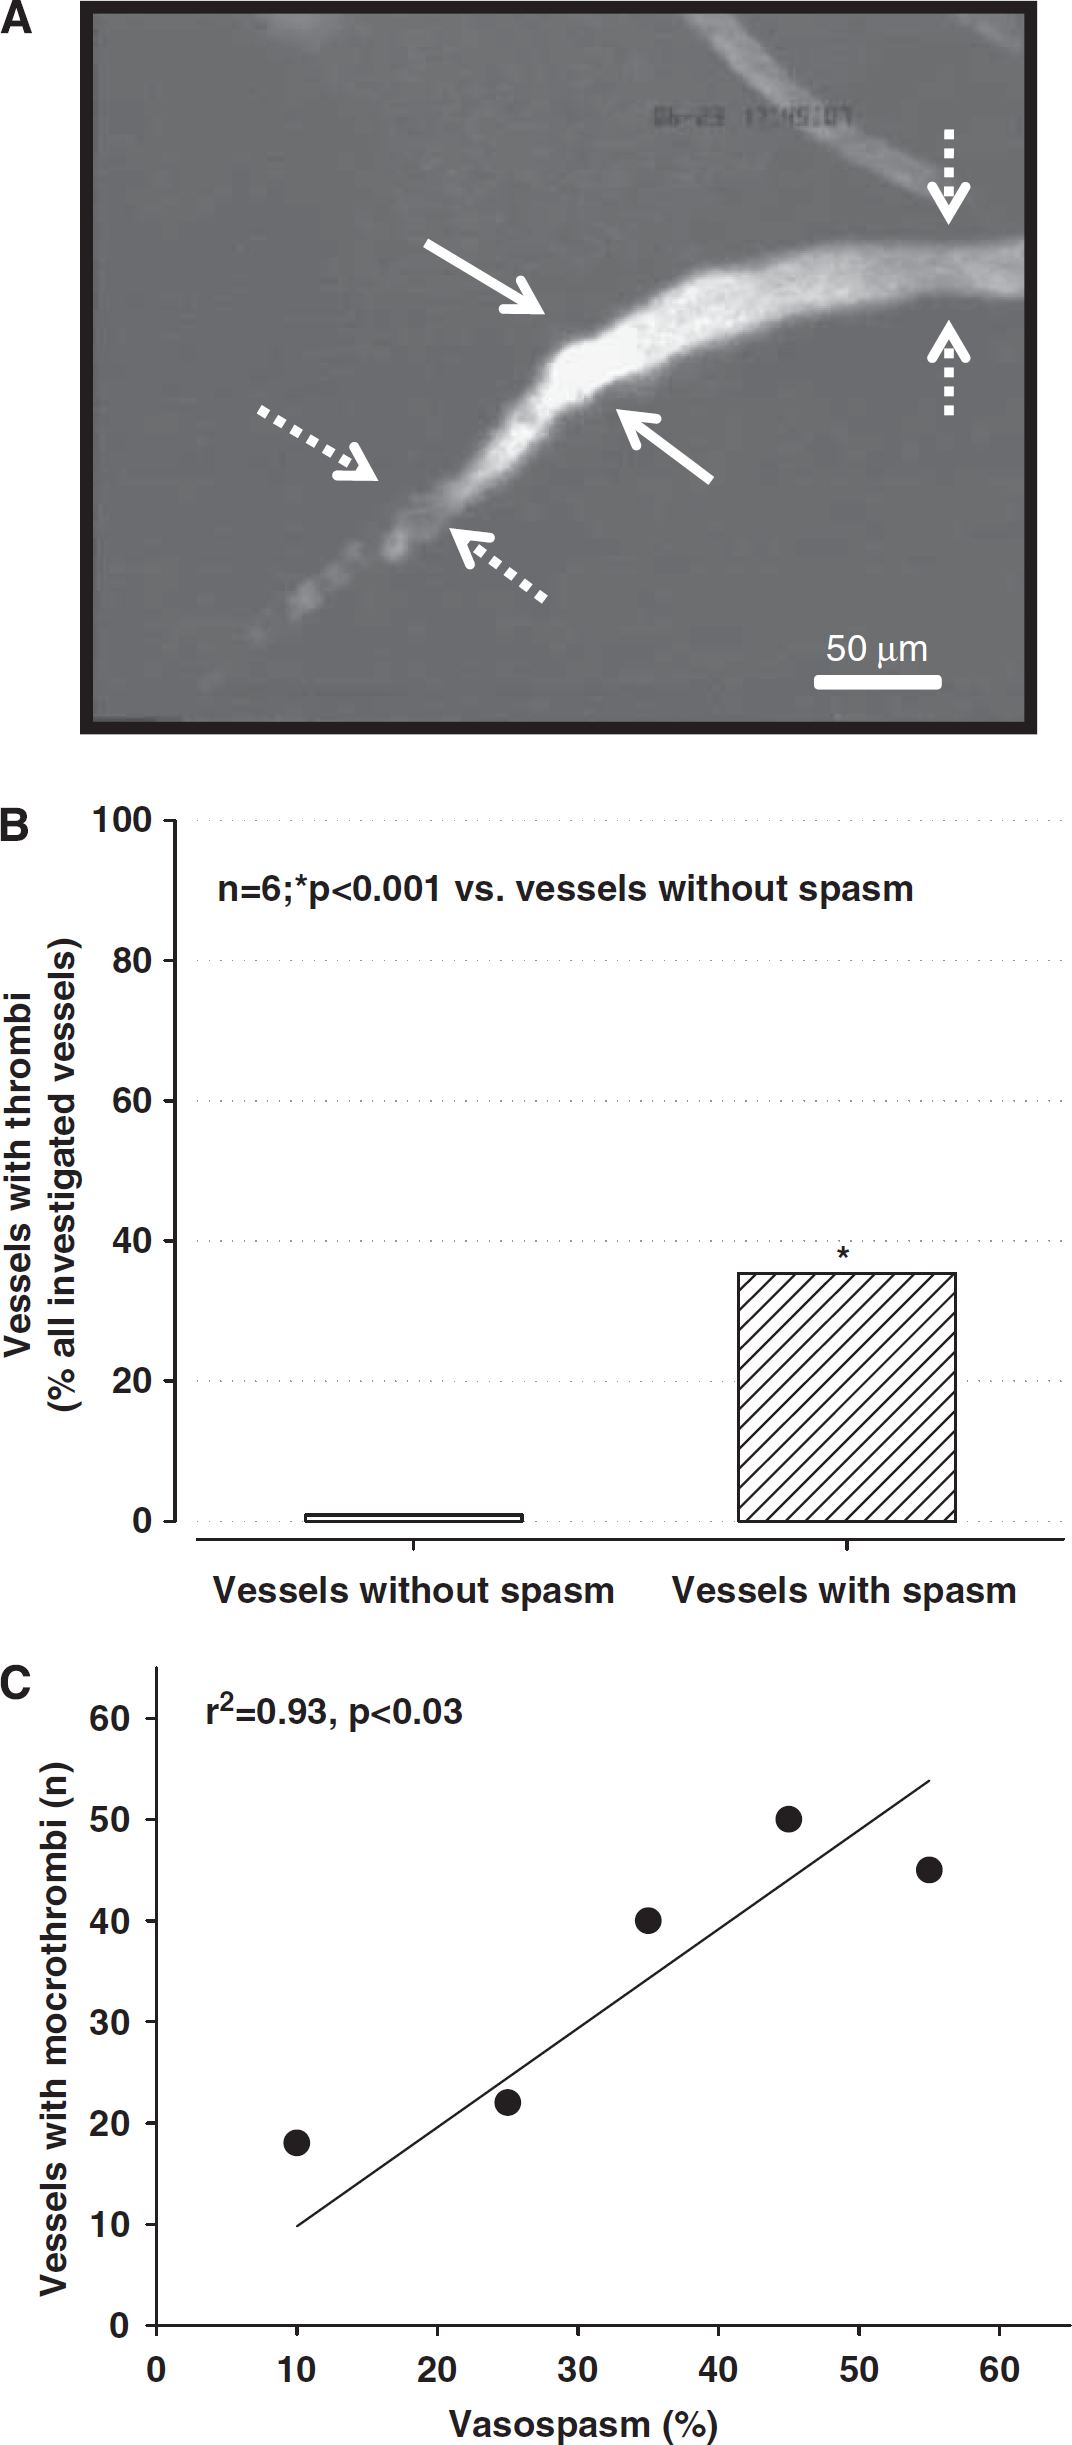
Post hemorrhagic arteriolar constrictions were often associated with severe reductions in microvascular blood flow or even a complete absence of microperfusion. Dynamic imaging of arteriolar constrictions suggests that vessels constrict within seconds thereby causing secondary thrombus formation, i.e., arteriolar constrictions occur first and trigger microthrombosis and not vice versa (Supplementary Video). Complete absence of microvascular flow after SAH was always associated with the formation of thrombi at the proximal end of arteriolar constrictions, as detected by accumulation of FITC-dextran (Figure 5A). Three hours after induction of SAH, 35% of all constricted arterioles carried microthrombi as compared with only <1% in vessels without spasms (
(
Discussion
The aim of the present study was to investigate the long-term spatial and temporal characteristics of acute vasoconstriction after SAH
Subarachnoid hemorrhage patients may already experience cerebral ischemia in the first few days after hemorrhage, when large cerebral vessels do not show any signs of vasospasm (Schubert et al, 2009). Since, in most cases, ICP and CPP are in the normal or near normal range in this early post SAH phase, the perfusion deficit has to be attributed to changes at the level of the cerebral microcirculation—as already pointed out by Bederson et al (1998), based on experimental findings >10 years ago. This hypothesis was proven experimentally in rats by showing that subarachnoid arterioles indeed constrict by ∼40% in the early phase, i.e., 5 minutes to 2 hours after SAH
Despite this obviously important role of arteriolar constrictions, many questions regarding the pathophysiology of this phenomenon still need to be addressed, e.g., how many vessels are affected, what is the temporal profile of vasoconstriction, which microvessels are mostly affected and is the degree of microvasospasm sufficient to explain ischemic brain damage? The current study helps to answer some of these questions due to technical advantages, which were not previously available. The experiments were performed in an animal model, which resembles clinical SAH as closely as possible, i.e., the endovascular perforation model (Bederson et al, 1995; Feiler et al, 2010). In analogy to SAH in humans, the endovascular model produces a vascular lesion at the skull base, which results in an immediate increase in ICP, a decrease in CPP and the self-limiting development of a hematoma due to decreasing cerebral blood flow (Bederson et al, 1995). Another technical advantage of the current study is that it is one of the few to use intravital videomicroscopy for the direct visualization of the post hemorrhagic cerebral microcirculation
A decrease in microvascular perfusion can be caused by constriction of arterioles or plugging of their lumen by microthrombosis. Our current data demonstrate that both mechanisms are present after SAH
Arteriolar constriction occurs in a very high fraction of subarachnoid arterioles (70%) and seems to be severe enough to cause a significant reduction in cerebral blood flow by itself since, according to the Hagen—Poiseuille law, a reduction of vessel diameter by 30% results in a reduction of flow by ∼80%, i.e., down to the ischemic threshold. Considering that half of all investigated microvessels have even stronger spastic segments and that small arterioles (which in most cases are end arteries) are the most severely affected by vasoconstriction, the abundance and the degree of arteriolar vasoconstriction alone may be sufficient to explain at least a large part of post hemorrhagic ischemia.
Our results, however, suggest that arteriolar constrictions induce a much more severe microvascular perfusion deficit, namely microcirculatory stasis. As shown by
Although we concentrated on the description and quantification of microvascular changes after SAH and did not perform any specific experiments addressing the mechanisms underlying post hemorrhagic microvasospasm, our observations suggest that microvasospasms occur only at sites where the microvasculature comes into direct contact with blood. This may suggest that, among others, hemoglobin, which is known to induce vasoconstriction by scavenging nitric oxide could be involved in this process. Future studies addressing microvascular dysfunction after SAH in detail, e.g., by using nitric oxide donors and other experimental tools, may shed new light on the mechanisms of post hemorrhagic microvasospasm.
Despite the obvious advantages of the experimental approach and the interesting results, the current study also has some limitations that need to be taken into consideration when interpreting the data. Conventional one-photon fluorescence videomicroscopy only allows investigation of superficial structures. Accordingly, the current study provides no information on intraparenchymal vessels and it remains unclear how changes observed in subarachnoid/pial vessels may relate to intraparenchymal alterations. Studies using tissue penetrating two-photon microscopy will be needed to address this issue. Another limitation of the current study is that we focused our interest on the microcirculation and did not investigate large cerebral vessels, which may also show spasm early after hemorrhage in rodents (Bederson et al, 1998; Sehba et al, 1999). Therefore, we cannot realize if and how acute macrovasospasms and microvasospasms may be linked to each other. Finally, we used an open cranial window preparation for the current experiments, which is equivalent to a decompression craniectomy. Accordingly, we cannot make any statements on the role of intracranial hypertension in the observed microcirculatory changes after SAH. Future experiments using closed cranial window preparations will be needed to address this important issue in detail.
Taken together, the current study shows that