
Abstract
One of the hallmarks of stroke pathophysiology is the widespread death of many different types of brain cells. As our understanding of the complex disease that is stroke has grown, it is now generally accepted that various different mechanisms can result in cell damage and eventual death. A plethora of techniques is available to identify various pathological features of cell death in stroke; each has its own drawbacks and pitfalls, and most are unable to distinguish between different types of cell death, which partially explains the widespread misuse of many terms. The purpose of this review is to summarize the standard histopathological and immunohistochemical techniques used to identify various pathological features of stroke. We then discuss how these methods should be properly interpreted on the basis of what they are showing, as well as advantages and disadvantages that require consideration. As there is much interest in the visualization of stroke using noninvasive imaging strategies, we also specifically discuss how these techniques can be interpreted within the context of cell death.
Promises and Problems in Visualizing Cell Death in Stroke
Death of brain cells and its prevention is the pivot of stroke pathophysiology and treatment. Cells, in particular neurons and oligodendrocytes, tolerate deprivation of substrate only for a short time before they die owing to a plethora of biochemical and molecular mechanisms (Ferrer and Planas, 2003; Mattson et al, 2000). Once damaged or dead, brain cells may elicit secondary events, which can lead to progression of cell death by mechanisms unrelated to the initial substrate deprivation, such as inflammation. As the regenerative capacity of the brain is limited, it is of major importance to prevent the brain from further damage. To diagnose stroke, to understand the mechanisms by which brain tissue is lost, and to assess the effectiveness of therapeutic strategies in experimental models and patients, we need to be able to visualize cell death in the brain with high specificity.
Before the advent of modern biology and neuroimaging, visualization of cell death after stroke was restricted to the histological investigation of morphological features of postmortem brains. In the twentieth century, neuropathologists systematically investigated features of ischemic cell death. This laid the foundation for our current understanding of stroke pathophysiology by discovering ‘topistic lesions’ (Vogt and Vogt, 1922), ‘selective neuronal necrosis’, ‘pathoklisis’ (Spielmeyer, 1925; Vogt and Vogt, 1922), ‘unvollständige Nekrosen’ (Spatz, 1939), and ‘elektive Parenchymnekrosen’ (Scholz, 1957). When cells die by necrosis, they show pathological signs such as swelling of organelles, increased volume, and disruption of the plasma membrane, the latter leading to release of intracellular content. In 1972, Kerr and colleagues coined the term ‘apoptosis’ to describe cells that were characterized by nuclear dissolution without loss of membrane integrity. These cells display signs of cell shrinkage, nuclear fragmentation, chromatin condensation (pyknosis), and chromosomal DNA fragmentation (karyorrhexis) (Kerr et al, 1972; Kroemer et al, 2009). In experimental stroke, Linnik and colleagues detected endonucleolytic cleavage of cellular DNA using gel electrophoresis (Linnik et al, 1993). Two years later, Li and colleagues could show several morphologic features of apoptosis after stroke using electron microscopy (EM) (Li et al, 1995). These and other studies have led to the dichotomized use of the terms ‘necrosis’ and ‘apoptosis’ in experimental stroke research. The introduction of molecular biology and biochemical markers identified specific molecules that have a role in cell death. With the distinction of apoptosis and necrosis in mind, the scientific community began to assign many of these techniques to a specific type of cell death. We now know that none of these markers can be used to accurately distinguish between apoptosis and necrosis and thus, they cannot be used as synonyms for terms that are only true in a morphological context. In 2009, the NCCD (Nomenclature Committee on Cell Death) published criteria for the definition of cell death to avoid the misuse of words and concepts, as well as guidelines for the interpretation of methods (Kroemer et al, 2009). According to these guidelines, cell death can be classified based on morphological appearance (necrosis, apoptosis, autophagy, and different mixed phenotypes), enzymological criteria (nucleases or proteases), functional aspects (programmed or accidental, physiologic or pathologic), or immunological characteristics (immunogenic or nonimmunogenic). The NCCD proposed that a cell is ‘dead’ if at least one of the following criteria is fulfilled: (1) loss of plasma membrane integrity, (2) complete disintegration of the cell, including its nucleus, or (3) when the cell, or its fragments, have been phagocytosed (Kroemer et al, 2009).
Histological or biochemical methods can identify cell death at a single time point. Noninvasive imaging techniques have enabled repeated measurements of features of cell death at the price of spatial resolution in the same animal. Although none of the characteristics of cell death can be specifically detected with neuroimaging, some have become methods of choice for its detection, particularly magnetic resonance imaging (MRI) (Doyle et al, 1981). In addition, nuclear imaging techniques such as positron emission tomography (PET) (Kuhl et al, 1980) and single photon emission computed tomography (SPECT) (Lassen et al, 1981) provide noninvasive images of specific metabolic and molecular mechanisms related to cell death in the brain.
In this review, we aim to guide researchers in navigating the complexity of invasive and noninvasive cell death detection strategies by providing concise information on what each technique is capable of, focusing on animal models of focal cerebral ischemia (Figure 1). More specifically, the questions we would like to answer for each method are: What are we looking at? How specific is it? What are its strengths and weaknesses?
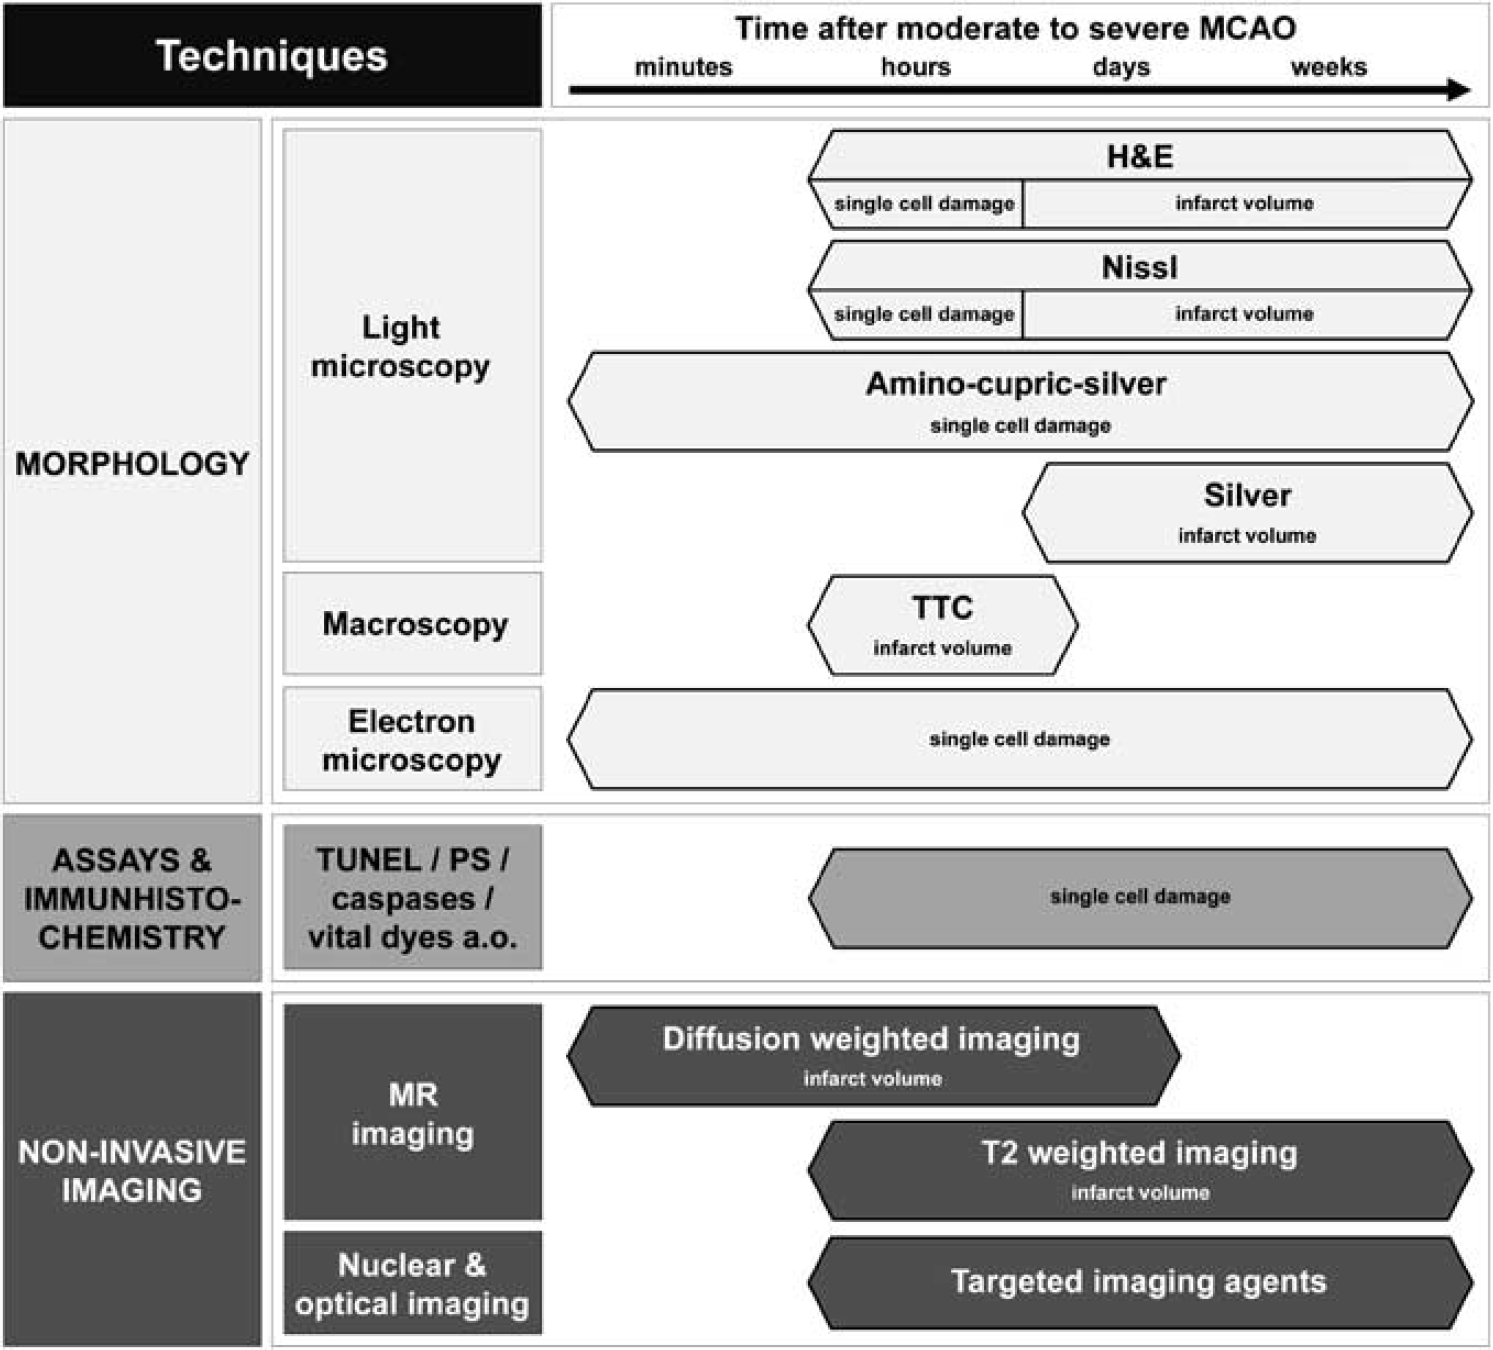
Rough guidelines for the appropriate application of the most common techniques to visualize cell death in the infarct or peri-infarct area in moderate-to-severe MCAO. H&E, hematoxylin and eosin; MCAO, middle cerebral artery occlusion; MR, magnetic resonance; PS, phosphatidylserine; TTC, 2,3,5-triphenyltetrazolium hydrochloride; TUNEL, terminal deoxynucleotidyltransferase-mediated dUTP-biotin nick-end labeling.
Morphology
The investigation of morphology has been traditionally used to identify dead or dying cells. Until today, light microscopy and electron microscopy (EM) are valuable tools in cell death research in stroke. Although the main advantage of light microscopy is the fast and relatively inexpensive detection of cell death and estimation of infarct volumes, EM is elaborative, but the only method to distinguish between apoptosis and necrosis.
Light Microscopy and Macroscopy
Visualization of cell death after ischemic stroke by light microscopy aims to depict and measure the complete area of infarction or to analyze alterations at the single cell level. In the latter case, specific differentiation between apoptotic and necrotic cell death is frequently requested, which is problematic based only on microscopic morphology. This is best illustrated by the longstanding controversy whether postischemic delayed neuronal death of vulnerable hippocampal neurons is apoptotic or necrotic (Deshpande et al, 1992; Muller et al, 2004; Wei et al, 2006). Another major challenge is reliable detection of early ischemic changes. To tackle these problems, some basic staining methods apart from immunohistochemistry are available: routine histology, silver staining, and fluorescence markers. It is important to note that each of the methods has advantages and disadvantages and there is no ‘best’ solution.
The most frequently used routine histological stains, hematoxylin and eosin (H&E) and the various modifications of Nissl stain, have the major advantage that they can be quickly and easily performed on tissue sections. On the basis of the use of these standard protocols, many publications attempted to describe distinct temporal and spatial patterns of postischemic morphological alterations (Back et al, 2004). However, because progression of postischemic changes depends on the severity and duration of ischemia, the pathology observed can only be reliably interpreted under their specific standardized experimental conditions.
In general, there is a loss of Nissl substance in Nissl stains, which is detectable ∼2 to 3 hours after experimental ischemia. In H&E sections (Figures 2A to 2C), the classic appearance of acute neuronal degeneration is ‘eosinophilic neurons’ (also termed ‘red’ or ‘red dead’ neurons), which are characterized by cell body shrinkage, darkly stained pyknotic nuclei, and an intensely stained red eosinophilic cytoplasm. These changes are frequently associated with finely vacuolated adjacent tissue and vacuolar alteration within the cytoplasm that is first detectable ∼2 to 3 hours after severe ischemia (Sun et al, 2009). Whether these changes may be reversible and, if so, how this could be distinguished is a matter of debate (Sun et al, 2006). The infarcted region can be distinguished from the adjacent tissue ∼24 hours with H&E (Hossmann, 2008). Approximately 48 hours after permanent middle cerebral artery occlusion (MCAO) in rats, neurons lose their affinity for hematoxylin and are sometimes referred to as ‘ghost neurons’ (Garcia et al, 1993). The morphological sequelae of neuronal characteristics is similar in humans; however, a study (Love et al, 2000) showed that the rate of progression can vary between different infarcts and within the same infarct.
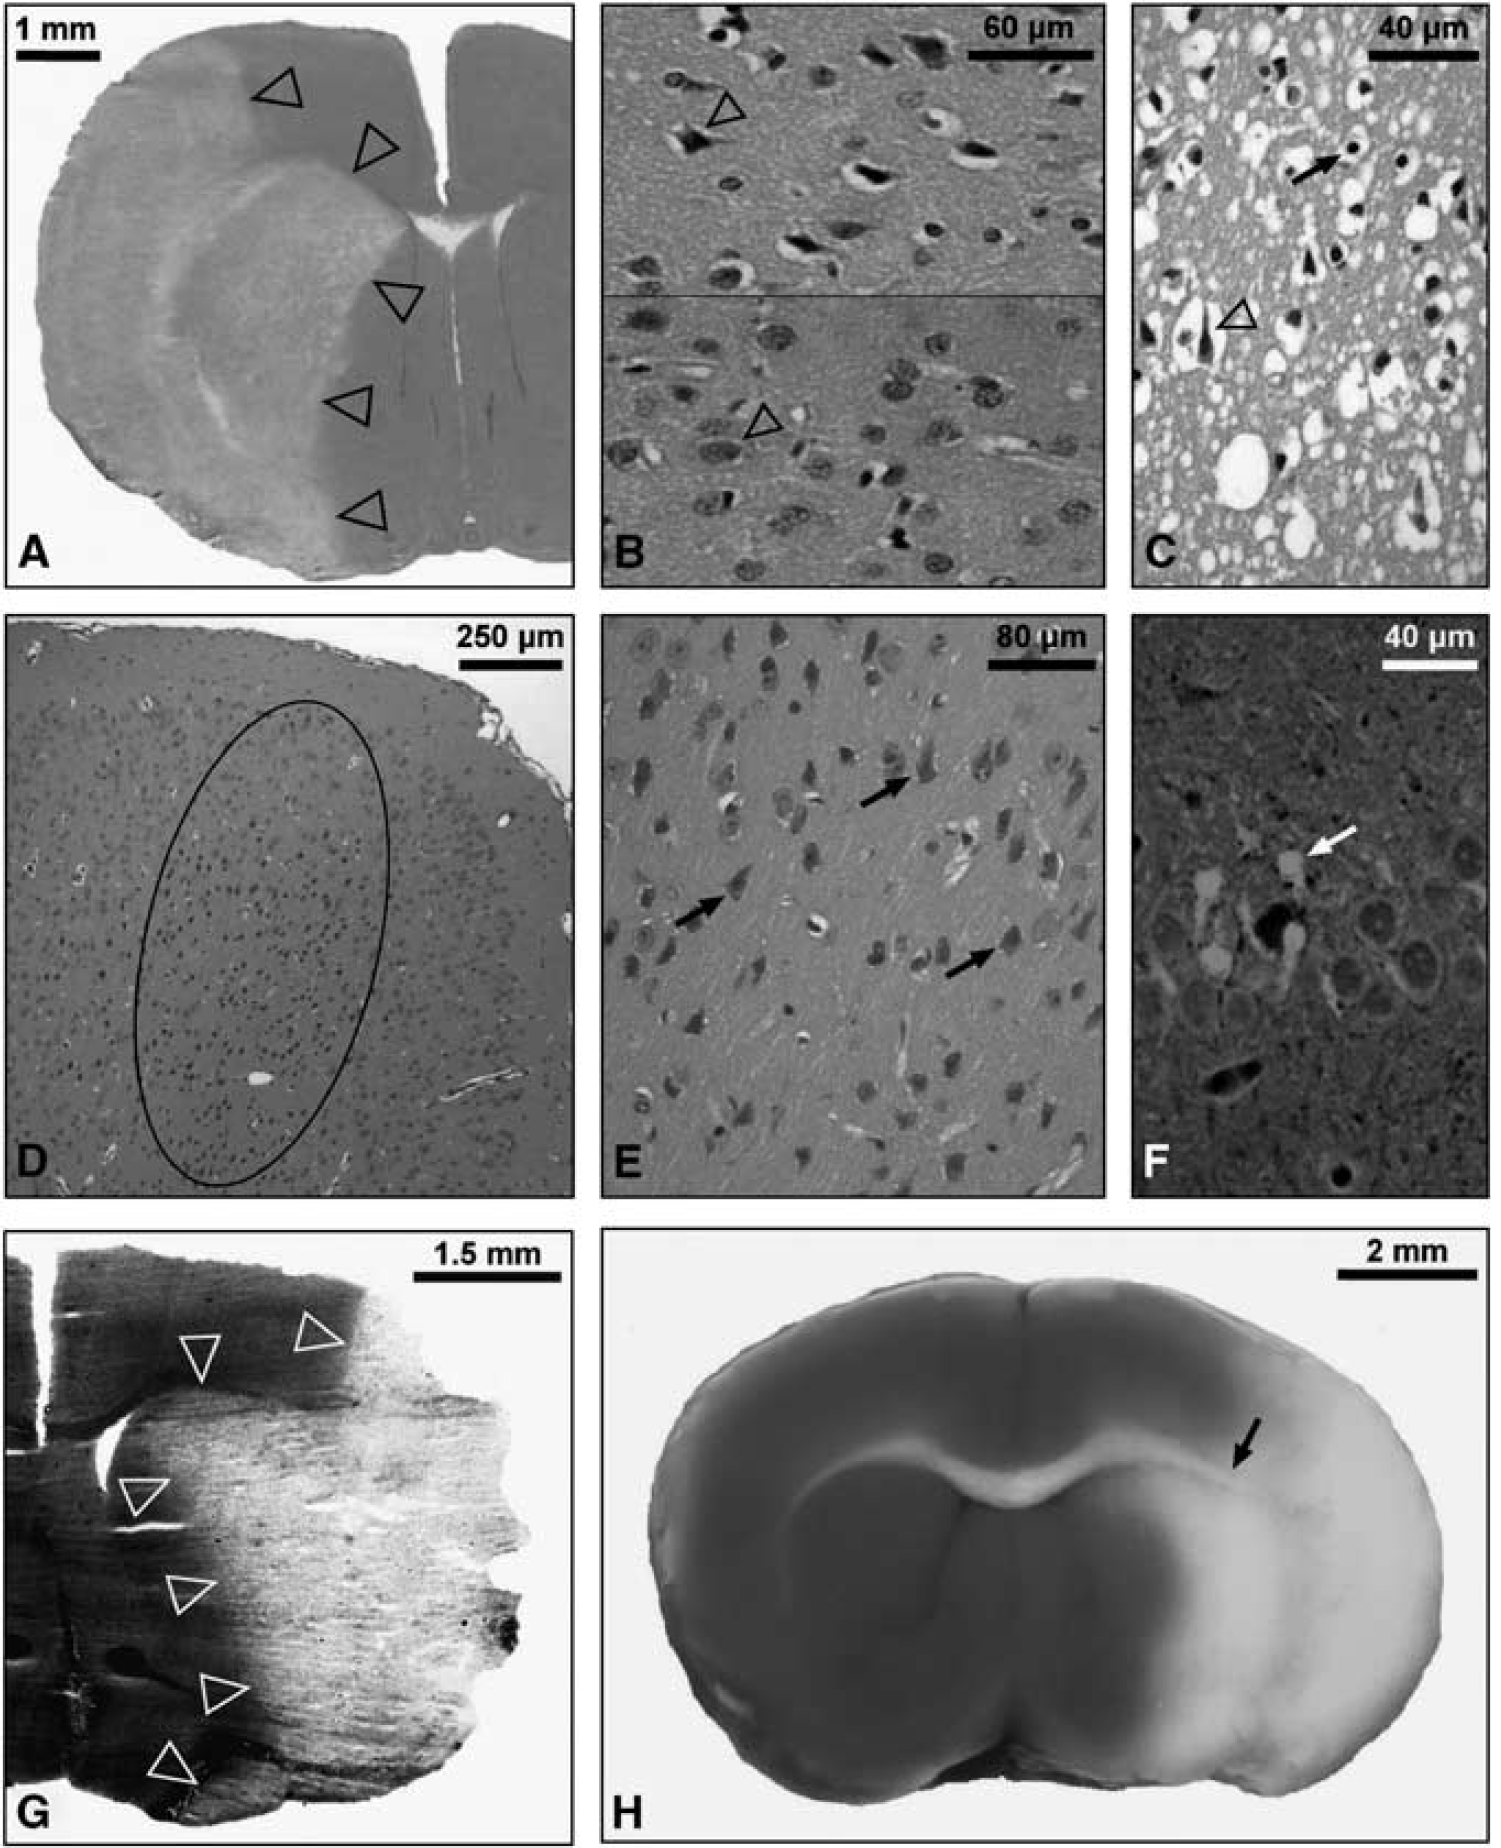
Light microscopy of cell death in ischemic stroke. (
Finally, the phenomenon of the ‘dark neuron’ must be mentioned, which represents an artifact in H&E and Nissl stains and is, even in top journals, sometimes misinterpreted as neuronal death. Also termed ‘basophilic neurons’, these dark neurons possess amphophilic staining characteristics and appear as monomorphic shrunken cells, whereas after ischemia, different stages of degeneration can be detected (Figures 2D and 2E). Furthermore, in Nissl-stained tissues, true degenerating neurons actually appear pale because of the dissociation of ribosomes from the rough endoplasmic reticulum. The first descriptions of dark neurons date to the 1960s (Cammermeyer, 1961), but the significance has since been forgotten, prompting a recent review (Jortner, 2006). Whether the dark appearance is the result of cytoskeletal protein contraction (actin) is still a source of debate. Some authors have postulated that this is a pressure-derived mechanical artifact of the unfixed brain (Cammermeyer, 1978; Ooigawa et al, 2006); others prevented it by blocking glutamate receptors, thus suggesting that dark neurons are induced by depolarization, glutamate release, and receptor activation (Kherani and Auer, 2008). Furthermore, since after cessation of the insult, many contracted ‘dark’ neurons revert to normal, it is advisable to be cautious about equating a darkly stained neuron with cell death (Auer et al, 1985). Ultimately, one should be aware of the misleading term ‘argyrophilic dark neurons’ for true degenerating neurons.
The limitations of routine staining procedures, in particular the verification of early cell damage or detection of scattered single cells in remote areas, can be overcome by the use of either suppressed silver stains or fluorescence-based techniques, respectively. Current silver impregnation procedures are mainly based on modifications of the amino-cupric-silver technique and are helpful to detect neurons with acute degenerative processes as early as 15 minutes after ischemia reperfusion, a time span during which eosinophilic cytoplasmic alteration has not yet developed (de Olmos et al, 1994). Another modified and well-established silver staining protocol allows reliable differentiation between infarcted and normal tissues as early as 2 hours after ischemia in a permanent MCAO rat model (Vogel et al, 1999). This technique also allows computer-assisted analysis of infarct volume owing to the enhanced contrast between infarcted and adjacent tissues (Figure 2G) (Liesz et al, 2009). However, a disadvantage of silver stains is that they require cryostat material.
The various Fluoro-Jade stains, which can also be used for paraffin-embedded material, are also easy to apply. One basic prerequisite is perfused tissue, otherwise erythrocytes will also be highlighted and interfere with signals from degenerating cells. Fluoro-Jade B is an anionic dye reportedly specific for soma and neurites of degenerating neurons under various pathologic conditions, including ischemia (Schmued and Hopkins, 2000), although there are reports that describe labeling of microglia and astrocytes under certain conditions (Damjanac et al, 2007; Saganova et al, 2006). Owing to the high sensitivity of Fluoro-Jade B, detection of degenerating neurons as early as 1.5 hours after a 90-minute MCAO in mice is possible (Liu et al, 2009). Moreover, it can be used to detect single scattered degenerating neurons in remote areas (Figure 2F) (Zhang et al, 2010b). Fluoro-Jade C shows the greatest affinity for degenerating neurons and, consecutively, the highest resolution and contrast of all Fluoro-Jade dyes (Schmued et al, 2005). Degenerating neurons have been shown as early as 30 minutes after a 60-minute MCAO in rats (Chen et al, 2009).
When focusing on early reliable detection of the infarct, in particular volumetry, macroscopic inspection using the 2,3,5-triphenyltetrazolium hydrochloride (TTC) stain is a well-established methodological option (Bederson et al, 1986). Strictly speaking, TTC is a marker of functioning mitochondria, which reduce TTC to a red-colored, lipid-soluble formazan. Therefore, the infarcted tissue without viable mitochondria remains unstained. This method is quite easy to apply and the results are immediately available, revealing a high contrast between normal and infarcted tissues (Figure 2H). However, TTC staining can falsely detect infarction, e.g., when dehydrogenase activity is transiently impaired or when tissue viability is below a certain threshold (Benedek et al, 2006). In addition, demarcation of the infarct can be problematic if the border or the distinction between white matter and infarcted tissue are not clear. Another limiting factor of TTC staining is the narrow time window. Although in the case of severe ischemia, TTC staining has repeatedly been described to delineate infarcts as early as 2 to 3 hours after reperfusion (Liszczak et al, 1984; Popp et al, 2009), reliable detection after milder ischemia requires ∼24 hours (Popp et al, 2009). However, because infiltrating inflammatory cells harbor intact mitochondria, TTC should not be used for time points beyond 24 hours (Liszczak et al, 1984).
Many of these techniques are used to estimate infarct volume as a direct correlate of cell death. In general, several sections are selected, photographed, and the infarcted region manually delineated. Infarct volume can then be calculated and expressed as an absolute value or as a relative fraction of the ipsilateral or contralateral hemisphere. Depending on the method of tissue processing, absolute values may be artifactually increased (cryostat material) or decreased (paraffin embedding). Infarct volumes can be corrected for edema (Swanson et al, 1990): (area of contralateral hemisphere−(area of total ipsilateral hemisphere−infarct area)), given as percentage of the contralateral area, particularly if the measurement is performed within 3 days of ischemia (Overgaard and Meden, 2000). Most protocols do not only measure the gray matter in each hemisphere but also include the white matter (Liesz et al, 2009). As mentioned previously, each technique is most useful within a specific time frame, and although damage can be detected early, most techniques are most reliable within the first 24 hours (Figure 1). This represents a disadvantage because experimenters must choose their time point of analysis carefully. Acutely, damage might be missed and at later time points, owing to the complex dynamics of scar formation and phagocytosis, infarct size and tissue loss do not always match (Muller et al, 2008; Shanina et al, 2005).
Electron Microscopy
EM enables researchers to visualize ultrastructural detail in the ischemic brain tissue. Invented in the 1930s, this method has not changed fundamentally up to now. Beams of electrons are used for illumination of the specimen and for creation of a magnified image. Electrons have a wavelength 100,000 times shorter than visible light; therefore, magnifications of up to × 2,000,000 can be achieved; this is three orders of magnitude higher than that of any light microscope and highlights the level of ultrastructural detail that can be obtained (Colliex and Mory, 1994). EM is particularly advantageous for the identification of specific features associated with different types of cell death (Figure 3). Only EM can unequivocally differentiate between necrosis and apoptosis, and several morphologic characteristics have been accepted as reliable criterion (Galluzzi et al, 2009; Zeng and Xu, 2000).
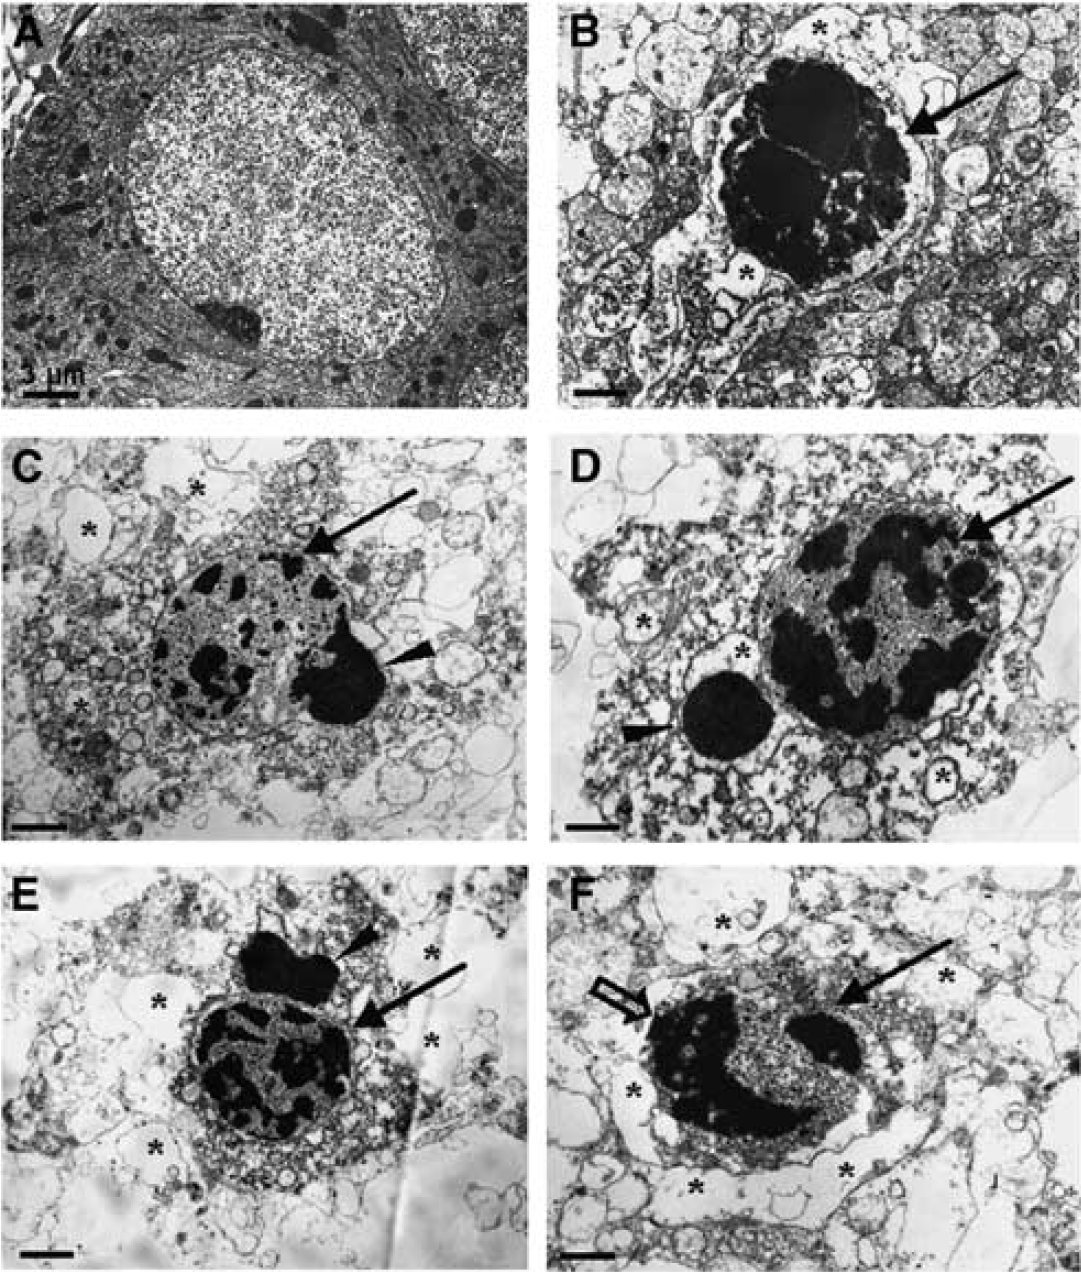
Electron microscopy of cell death in ischemic stroke. Ultrastructural changes in damaged neurons in the ischemic cortex of rats. EM showed cellular and subcellular alterations of damaged neurons in the ischemic region. (
Ultrastructural data have had a major impact on shaping the view regarding which forms of cell death occur after cerebral ischemia. In 1995, Li and coworkers published results that led the authors to the conclusion that apoptosis occurs after transient (2 hours) MCAO (Li et al, 1995). Only 1 year later, contradictory results were published in a model of permanent MCAO (van Lookeren Campagne and Gill, 1996). It appeared that the two models lead to different forms of cell death. However, 2 years later, in a transient rat model of focal ischemia, both cell death mechanisms were reported to occur in parallel, with necrotic regions in the core and apoptotic ‘penumbral’ regions (Aggoun-Zouaoui et al, 1998). More recently, both signs for cell death mechanisms were shown to occur in the same cell in rat models of both transient and permanent focal ischemia (Figure 3) (Wei et al, 2006).
Taken together, it can be concluded that most cells that exhibit apoptotic morphologies are localized at the inner boundary of the infarcted tissue in the ‘penumbra’, whereas cells displaying necrotic cell death are mostly located in the ischemic core (Aggoun-Zouaoui et al, 1998); for review see Charriaut-Marlangue et al, 1998. Furthermore, the longer the period of reduced blood flow, the higher the chance to observe necrosis rather than apoptosis. This is obvious because the duration of interrupted blood flow directly affects energy supply, and apoptosis is a highly regulated process that requires energy (Pagnussat et al, 2007). In addition, cells may initiate apoptosis, but if energy levels further decrease, or blood flow is not restored, they can switch to necrosis (Mattson et al, 2000; Saraste and Pulkki, 2000), and therefore, results in a mixture of apoptotic and necrotic features (Wei et al, 2006).
EM can provide an impressive amount of ultrastructural information and is irreplaceable in the analysis of cell death mechanisms. Conversely, it cannot be used for high-throughput screening, because the magnifications achieved do not allow for an overview, but rather for a detailed view into the cells (for review see Love, 2003; Mattson et al, 2000; and Saraste and Pulkki, 2000). Thus, to avoid focusing investigations on rare events, visual inspection of EM data needs to be complemented by a robust quantitative standard microscopic approach (Galluzzi et al, 2009).
Assays and Immunohistochemical Markers of Cell Death
Standard light and fluorescence microscopy are still the most common methods for evaluation and quantification of damaged or dead cells in experimental stroke. An increasing number of biological markers can be combined to detect molecules at a subcellular level. The following section focuses on the most common assays and immunohistochemical markers for evaluation of cellular damage or death in, but not limited to, tissue sections after focal cerebral ischemia. We do not intend to specify a certain type of cell death for the markers reviewed here because there is no clear-cut definition as to the specificity of each marker for a certain type of cell death.
Terminal Deoxynucleotidyltransferase-Mediated dUTP-Biotin Nick-End Labeling
As mentioned previously, chromatin aggregation is an early feature of apoptosis; this is followed by endogenous endonuclease activity which leads to breaks in the DNA strands. The resulting DNA fragments are mono- (180 bp) and oligo-nucleosomal (multiples of 180 bp) and can be detected using electrophoresis. However, during necrosis, DNA is hydrolyzed and appears as a smear in the gel (Galluzzi et al, 2009). With the development of the terminal deoxynucleotidyltransferase-mediated dUTP-biotin nick-end labeling (TUNEL) stain in 1992 by Gavrieli and coworkers, it is possible to detect DNA fragments on a single cell basis in tissue sections using light microscopy (Gavrieli et al, 1992). TUNEL is based on the addition of biotinylated nucleotide triphosphates to the free 3′-OH termini of single- or double-stranded DNA by terminal deoxynucleotidyltransferase. Despite its broad use and acceptance (>20,000 publications), it has been debated whether TUNEL staining leads to false-positive or false-negative results. There are various methodological pitfalls that can contribute to this, as well as to decreased sensitivity, e.g., fixation (to avoid loss of DNA from cells) and the proteolytic step in the pretreatment of the tissue (for paraffin-embedded tissue). However, most of the technical problems of the original method have been solved in the meantime (Grasl-Kraupp et al, 1995; Labat-Moleur et al, 1998; Negoescu et al, 1996; Stahelin et al, 1998). Despite methodological improvements, it is still not possible to use TUNEL staining to distinguish between apoptotic and necrotic cell death. Cells that show key morphological features of apoptosis do not always show DNA fragmentation (Cohen et al, 1992) and cells that have been identified as necrotic may be TUNEL positive (Charriaut-Marlangue and Ben-Ari, 1995).
In focal cerebral ischemia, TUNEL has been widely used, often as the only measurement to assess apoptosis after stroke (Figure 4). After MCAO in mice or rats, TUNEL-positive cells can be found already 1 hour after occlusion (Linnik et al, 1995), reach their peak by 24 hours (Li et al, 2010), but are still detected after 28 days (Zhang et al, 2010a). Despite the uncertainty regarding the specific type of cell death, TUNEL is still the method of choice for identification of DNA fragmentation.
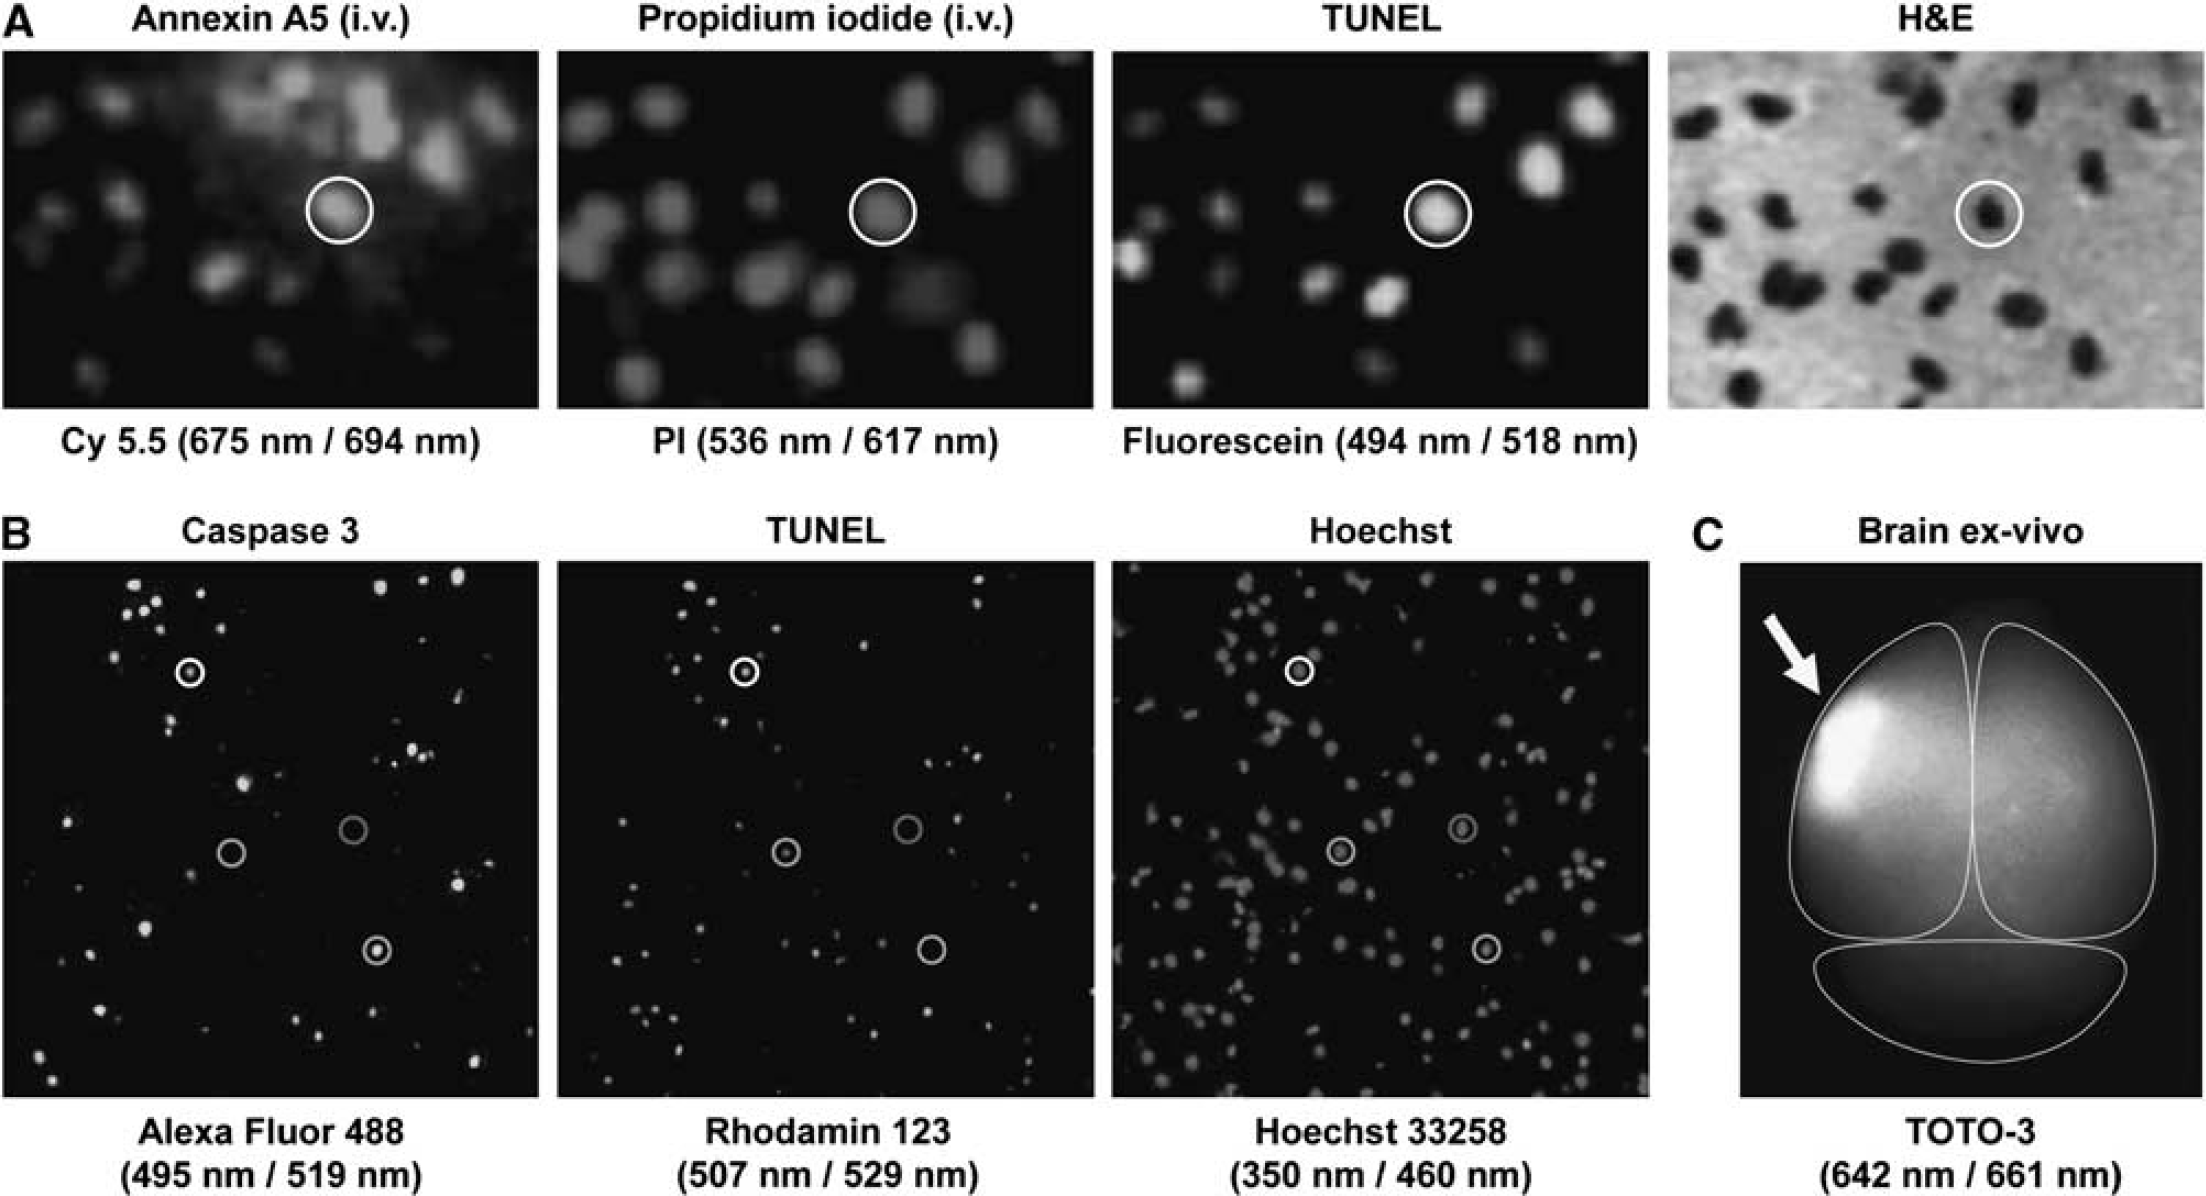
Assays and immunohistochemical markers of cell death in ischemic stroke. (
Markers of Mitochondrial Damage
Early after focal cerebral ischemia, excitotoxicity causes calcium influx into the cell. When exposed to high levels of calcium, mitochondrial permeability transition pores form in the membrane and further facilitate depolarization of the cell, which contributes to a plethora of cell death-inducing processes. Although mitochondrial permeability transition pores cannot be visualized in fixed tissues, their existence can be shown in single cell suspensions by flow cytometry using a combination of calcein and CoCl2 (Kowaltowski et al, 2000).
As a direct consequence of the impairment of the mitochondrial membrane potential, adenosine-5′-triphosphate (ATP) production is reduced, aggravating the energy crisis (Schinder et al, 1996; Stavrovskaya and Kristal, 2005). ATP levels can be investigated by bioluminescence based on the luciferin—luciferase reaction (Galluzzi et al, 2009).
Another critical aspect of damaged mitochondria is the release of high amounts of reactive oxygen species, like the superoxide anion, which leads to oxidative damage in proteins, lipids, and DNA. Many reactive oxygen species-sensitive dyes are available (e.g., MitoSOX Red for superoxide) that can be visualized by microscopy, spectroscopy, and flow cytometry.
Although, high amounts of reactive oxygen species are associated with membrane disruption leading to further depolarization (Fiskum, 2000), there is no proof for a direct functional connection to the release of cytochrome c. However, both events seem to be temporally connected (Shibata et al, 2002). Cytosolic cytochrome c can be measured directly as a marker for mitochondrial damage by immunoblotting or high-performance liquid chromatography. Furthermore, its release results in activation of caspase 9, a member of the caspase superfamily.
Caspases
When cells are dying, enzymes of the caspase family are activated. Caspases are cysteine proteases that cleave aspartic residues. They can be subdivided into initiators (caspase 2, 8, 9, and 10) and effectors (caspase 3, 6, and 7) (Alam et al, 1999). The former activates the latter by cleaving their inactive proforms, and then, the effectors cleave cellular proteins that regulate signal transduction and survival (Earnshaw et al, 1999). A key player in cell death is caspase 3, onto which two major pathways converge (Levkau et al, 1998).
Despite the wide acceptance of the importance of caspases in contributing to cell death, several forms have recently been shown to be activated in the context of nonlethal processes and differentiation pathways (Galluzzi et al, 2008; Garrido and Kroemer, 2004). For example, caspase 3 has been shown to be transiently activated during early antigen-driven expansion of CD8+ T cells in vivo without any cell death occurring (McComb et al, 2010). Furthermore, cell death cannot always be prevented by inhibiting caspase 3, possibly because of the fact that mitochondrial damage is not reversible, but also several broad-spectrum caspase inhibitors (such as Z-VAD-fmk) also inhibit cathepsins and calpains. Z-VAD-fmk in particular has shown to bind to cysteines on proteins rather than to cysteine proteases (Vandenabeele et al, 2006). Thus, cells may still die by shifting to caspase-independent processes, which is often accompanied by changes in morphology. For a review on caspase-independent cell death, see Chipuk and Green, 2005 as well as Kroemer and Martin, 2005.
Caspase 3 has been described to have a crucial role in focal cerebral ischemia (Prunell et al, 2005) and can be detected in the ischemic tissue using immunoblotting and immunohistochemistry with antibodies against procaspase 3 and the activated (cleaved) form of caspase 3 (Figure 4). Caspase 3 activity was found as early as 8 hours after 50 minutes of transient MCAO in rats, with a peak at 24 hours after reperfusion, and was still present 14 days later (Xu et al, 2006). In another study, after 180 minutes of transient MCAO in rats, an increase in the active form of caspase 3 could be detected as early as 1 hour after MCAO and for 3 days after reperfusion (Chaitanya and Babu, 2008). Furthermore, caspase 3-deficient mice exhibited significantly smaller infarcts 48 hours after 2 hours of occlusion of the MCA (Le et al, 2002). In a great number of original articles, a decrease in caspase 3 activity has been suggested to be evidence of ‘neuroprotective’ or ‘anti-apoptotic’ effects at a certain time point after cerebral ischemia (typically 24 hours), often as the single outcome parameter measured. However, it is still under debate whether a reduction in the number of caspase 3-positive cells results in improved outcome after cerebral stroke.
Calpains and Cathepsins
Calpains and cathepsins belong to the papain superfamily of cysteine proteases. Cathepsins are localized predominantly in the lysosomes with cathepsin L and B having a role in the central nervous system (Yamashima, 2000). The two calpain forms, μ- and m-calpain (also called calpains I and II, respectively) are believed to be regulated by calcium and the endogenous inhibitor calpastatin. They have been proposed to have a role in the regulation of kinases, transcription factors, and receptors, as well as the turnover of cytoskeletal proteins (reviewed in Goll et al, 2003). Both calpains and cathepsins can be detected using immunoblotting and immunohistochemistry with antibodies or by fluorometric assays. They have been shown to be involved in cell death, although studies using some of the available ‘calpain inhibitors’ should be interpreted cautiously because they do not distinguish between calpains, cathepsins, and unrelated proteasome activity.
During focal cerebral ischemia, cathepsins have been shown to be released from damaged lysosomes into the cytoplasm. After 2 hours of MCAO in rats, cathepsin B enzymatic activity was shown to be increased at 2, 8, and 48, but not at 24 hours, after reperfusion (Seyfried et al, 1997). The same group showed reduced infarction when administering an inhibitor selective for cathepsins, but not for caspases and calpains (Seyfried et al, 2001). Calpain inhibitors have been shown to reduce infarct size and prevent cell death in neurons after MCAO (Bartus et al, 1994; Koumura et al, 2008). In another study after 180 minutes of transient MCAO in rats, an increase in calpain and cathepsin B levels could be detected immediately and up to 3 days after reperfusion (Chaitanya and Babu, 2008).
Phosphatidylserine Exposure
Early during cell death, phosphatidylserine (PS) becomes exposed on the surface of the cell and stays there, whereas it is usually located on the inner leaflet of the plasma membrane. The Ca2+-dependent binding protein annexin A5 (also known as annexin V) with a molecular mass of ∼36 kDa has a high affinity and specificity for PS and other anionic phospholipids. Therefore, annexin A5 has been suggested to be a marker of cell death by detection of extracellular PS. In focal cerebral ischemia, annexin A5 binding could be detected as early as 3 hours after 90 minutes of MCAO in rats with a gradual increase until 48 hours after reperfusion (Zhang et al, 2010c). In another study using a less severe MCAO (50 minutes occlusion time) in rats, cells positive for annexin A5 could be detected as early as 8 hours, with a peak at 3 days, and up to 14 days after MCAO (Xu et al, 2006).
However, caution is urged when interpreting the presence of annexin A5 in a cell as unequivocal evidence of cell death. Annexin A5 can also bind to intracellular PS when the plasma membrane is permeabilized, as it is the case with both necrosis and later in apoptosis (Galluzzi et al, 2009; Kroemer et al, 2009). This is particularly problematic in tissue sections because tissue preparation (cutting and treatment with detergents) generates a high rate of false positives. Furthermore, PS externalization may not always be associated with cell death; it has been shown in living endothelial cells of tumor vasculature (Ran and Thorpe, 2002). PS externalization has been shown to be reversible in granulocytes and monocytes (Yang et al, 2002) and in cardiomyocytes subjected to brief episodes of ischemia (Kenis et al, 2010). Therefore, it is difficult to be sure that a cell will eventually die when it expresses PS. Moreover, annexin A5 binding to PS does not allow distinguishing the specific type of cell death - apoptosis and necrosis - as suggested by many of the commercially available kits using a combination of annexin A5 and propidium iodide (PI).
Vital Dyes
As proposed by the NCCD, one of the criteria to classify a cell as dead is the loss of plasma membrane integrity (Kroemer et al, 2009). This is often assessed using vital dyes, which cannot penetrate intact membranes and thus only stain cells with compromised plasma membrane integrity (Moore et al, 1998). One of the most commonly used dyes is PI, which has a molecular mass of 668.4 kDa and an excitation of 535 nm and an emission of 617 nm. If a cell has lost membrane integrity, PI can intercalate into the DNA and enhance fluorescence 20- to 30-fold. PI can be detected using fluorescence plate readers, fluorescence microscopes, or flow cytometry. PI staining is widely used in vitro, but can also be used in vivo by administering it intravenously before tissue processing and subsequent immunohistochemical stainings, although tissue preparation can generate a high number of false-positive cells. Nevertheless, PI staining correlates well with annexin A5 and TUNEL staining at 48 hours after 60 minutes of transient MCAO in the mouse (Figure 4) (Bahmani et al, 2011). Another group has reported that there are few PI-positive cells at early time points (6 hours) after 30 minutes of transient MCAO and much more by 72 hours. Furthermore, there were more PI-positive cells present in the ischemic tissue in a permanent than in a transient occlusion model (Unal Cevik and Dalkara, 2003). As PI positivity only reflects loss of membrane integrity, it does not allow the distinction between necrotic and apoptotic cells to be made. However, it has been suggested to be capable of this distinction in flow cytometry. This is based on a combination of scatter signal and the fluorescence intensity of the incorporated PI, which increases with time. As membrane integrity in primary necrosis is lost early, more PI can be incorporated compared with cells that are losing their membrane integrity later. The latter are considered to be apoptotic cells that undergo secondary necrosis, which is associated with cell swelling and lysis (Vitale et al, 1993).
Aside from PI, a number of other dyes are available, which differ in their excitation and emission characteristics, such as Nuclear yellow, ethidium homodimer-1, and TOTO-3 (Figure 4). However, to our knowledge, no publication is available on these dyes regarding experimental stroke.
Poly(ADP-ribose) Polymerase
Poly(ADP-ribose) polymerase (PARP)-1, also known as poly(ADP-ribose) synthetase or poly(ADP-ribose) transferase, is an abundant nuclear enzyme of 116 kDA that serves as a ‘nick sensor’ by binding to damaged DNA. As it is also involved in DNA repair, it has a key role in genomic stability under normal conditions (Dantzer et al, 2006). After having bound to single- or double-stranded DNA breaks, PARP-1 activity is accelerated up to 500-fold. It hydrolyses β-nicotinamide adenine dinucleotide to ADP ribose and nicotinamide. Rapid activation of PARP-1 results in depletion of β-nicotinamide adenine dinucleotide, leading to a deceleration of glycolysis and eventually ATP production, the final result of which is cell dysfunction or cell death (Szabo and Dawson, 1998). Both PARP-1 expression and cleavage can be measured with immunohistochemistry and immunoblotting. Recently, PARP-1 has been described to be activated through an alternative pathway that is independent of DNA damage. In this study, Cohen-Armon and coworkers found that PARP-1 acts within the extracellular signal-regulated kinase (ERK) pathway in neuronal cultures in vitro. The ERK signaling cascade is presumed to be involved in cell growth, differentiation, and proliferation. However, phospho-ERK-2-induced PARP-1 activation was completely blocked in the presence of DNA breaks (Cohen-Armon et al, 2007). Nevertheless, the role of PARP-1 in cell death remains under debate. PARP-1 has recently been suggested to have a role in a caspase-independent cell death mechanism (van Wijk and Hageman, 2005), but caspases have also been shown to inhibit PARP-1 in a CD95-mediated pathway (Los et al, 2002).
In focal cerebral ischemia, it has been shown that damage in the DNA that is caused by reactive oxygen species hyperactivates PARP-1 (Strosznajder et al, 2010) and depletes β-nicotinamide adenine dinucleotide and ATP. In a recent study, Egi and coworkers could show a reduction in infarct sizes after MCAO using a PARP-1 inhibitor (Egi et al, 2011).
Despite the intrinsic limitations of all biochemical markers mentioned in this review, there are some more general pitfalls one should be aware of. Tissue or cells may have to be pretreated, i.e., fixed, permeabilized, embedded, and cut before the marker can be applied or assessed, in case they have to be applied before tissue preparation. Although one marker may require a certain pretreatment, another marker may not work at all under this condition. Therefore, especially for combinations of markers, compatibility of all techniques has to be tested carefully. A second challenge is the quantification of cells that are positive for a marker. On the one hand, it is nearly impossible, and undesirable, to count all cells in all sections containing the region of interest. Conversely, it has to be assured that the result is as representative and unbiased as possible. A gold standard for these requirements is represented by design-based stereological counting methods, which, among others, offer the tools to obtain absolute cell numbers in a three-dimensional structure from two-dimensional tissue slides (for review see West, 1999).
Noninvasive Imaging Techniques
The primary advantage of noninvasive imaging is that it can be performed repetitively in the same subjects over time at the price of spatial resolution. However, histologic techniques and biochemical assays, which can only be performed once, provide a more precise estimate of different parameters that are directly applicable to cell death. Consequently, specificity of the noninvasive imaging signals has to be carefully evaluated and should correlate well with histologic measures of actual cell death.
Magnetic Resonance Imaging
Standard MRI uses magnetic fields and radio frequency energy to manipulate the protons in hydrogen atoms (1H), i.e., most MRI sequences are sensitive to different properties of water. As such, signal intensity changes in MR images do not depict cell death per se. Nevertheless, it is generally accepted that certain MRI phenomena represent specific pathologic tissue water changes. This will be discussed in the context of diffusion-weighted imaging (DWI) and T2-weighted imaging in reference to their ability to predict histologic infarct volume, which has long been used as a correlate of cell death.
DWI became popular in the early 1990s (Moseley et al, 1990; Warach et al, 1992) and is now generally considered the best method to detect cerebral ischemia in its acute stage. DWI uses opposing magnetic field gradients to make the sequence extremely sensitive to Brownian (random) water motion; regions with restricted diffusion appear hyperintense. As failure of ion homeostasis during acute ischemia was well known to produce intracellular water accumulation, the hyperintense diffusion signal was quickly attributed to cytotoxic edema (Fisher et al, 1992). Early animal studies using MCAO models have shown that the region of DW-hyperintensity grew within the first few hours, consistent with the concept of the ischemic penumbra, and the overall size of this area beyond 4 hours generally correlated well with histologic measurements of infarct size using either TTC or H&E staining (Gill et al, 1995; Kohno et al, 1995; Minematsu et al, 1992).
The standard DWI sequence can be modified to obtain a quantitative measure of the degree of water restriction in tissue using the unit mm2/sec; this is called the apparent diffusion coefficient (ADC). Several groups tried to establish which quantitative values could be used to best predict the regions of tissue that would exhibit signs of cell death, although the typical terminology used was infarct core. Early reports indicated that regions with ADC values below 0.55 × 10⁻³ mm2/sec (ADC values of a normal rat brain are ∼0.80 × 10⁻³ mm2/sec) correlated well with a lack of TTC stain at 2 hours after MCAO (Dardzinski et al, 1993), as did an 80% decrease in ADC when compared with the contralateral hemisphere at 7 hours after MCAO (Hoehn-Berlage et al, 1995). Subsequent efforts sought to refine the identification of pathology associated with specific ADC decreases. In the caudate, values of 0.45 × 10⁻³ mm2/sec correlated with 50% neuronal necrosis in tissue sections (Li et al, 2000). A reduction in ADC to 77% and 86% of the contralateral hemisphere was highly correlated with reduced ATP and tissue acidosis (pH), respectively (Olah et al, 2001). However, these findings proved to be reliable only in models of permanent focal ischemia. If reperfusion occurred, the region of ADC abnormality returned to near normal values and subsequently expanded again in the subacute stages (Neumann-Haefelin et al, 2000; van Lookeren Campagne et al, 1999). As such, the ADC value becomes more limited in terms of its ability to predict cell death. One study that observed ADC normalization upon reperfusion did report a loss of microtubule-associated protein 2 (a neuronal marker) immunoreactivity in tissue sections 5 hours later; however, astrocytes (glial fibrillary acidic protein-positive cells) exhibited a normal appearance, prompting speculation that the transient changes in DWI were attributable primarily to the temporary swelling of glial cells rather than cell death per se (Ringer et al, 2001).
As is the case with transient animal models, there are instances in which ADC values either partially or completely reverse in the clinic, irrespective of thrombolysis (Loh et al, 2005). Despite several suggestions, there is no agreed-upon standard ADC value that can be used to predict tissue at risk or final infarct size. Indeed, an evidence-based systematic review of the clinical literature revealed that there is a low level of evidence that DWI represents the infarct core (Kranz and Eastwood, 2009). A similar review of the experimental literature indicated that few studies reported sufficient information to make any useful conclusions regarding the utility of DWI to predict tissue fate (Rivers et al, 2006).
By the time DWI became popular for acute stroke imaging, T2-weighted imaging had already been around for quite some time and was generally accepted as a reliable technique to observe an ischemic lesion beyond the acute stages. As this sequence is sensitive to intraparenchymal water accumulation, increases in T2 will become apparent within several hours of the initial insult and reach maximal intensity in a few days as vasogenic edema peaks; early studies specifically reported that T2 hyperintensity was strongly correlated with histologic measures of hemispheric swelling and the area of infarction in TTC- and H&E-stained sections (Barone et al, 1991). A subsequent experiment concluded that T2-weighted hyperintensity ∼7 hours after occlusion represented tissue destined for final infarction, and that any subsequent expansion of the signal was caused by edematous swelling (Loubinoux et al, 1997).
In general, T2 signal intensity should not decline with time (Virley et al, 2000) because cerebral spinal fluid also seems hyperintense and it is the constituent that replaces dead tissue removed by phagocytosis. For this reason, T2-weighted imaging has been suggested to be a good indicator of final infarct volume. However, considering the source of the signal change is vasogenic edema, equating T2 unequivocally with final infarct size may not be appropriate. For example, in some cases in which the insult was small with a primarily subcortical distribution, T2 hyperintensity partially and completely resolved at 2 and 5 weeks, respectively, despite evidence of selective neuronal death, astrocytic reactivity, and inflammatory cell infiltration in the tissue sections at comparable time points (Wegener et al, 2006). Indeed, the term ‘final infarct size’ is generally used in the preclinical literature at time points that reflect either the initiation or the peak of the edematous response (i.e., within 48 hours). Looking beyond this time point clearly reveals dramatic changes in both the size of the hyperintense T2 region and a more heterogeneous pattern of T2 values within the lesioned area (Figure 5). One study suggested that different combinations of MRI signatures should be used to provide more information about histopathology, e.g., compromised tissue might have a low ADC but normal T2, and the T2 value will increase as the tissue becomes more necrotic (Jiang et al, 1997).
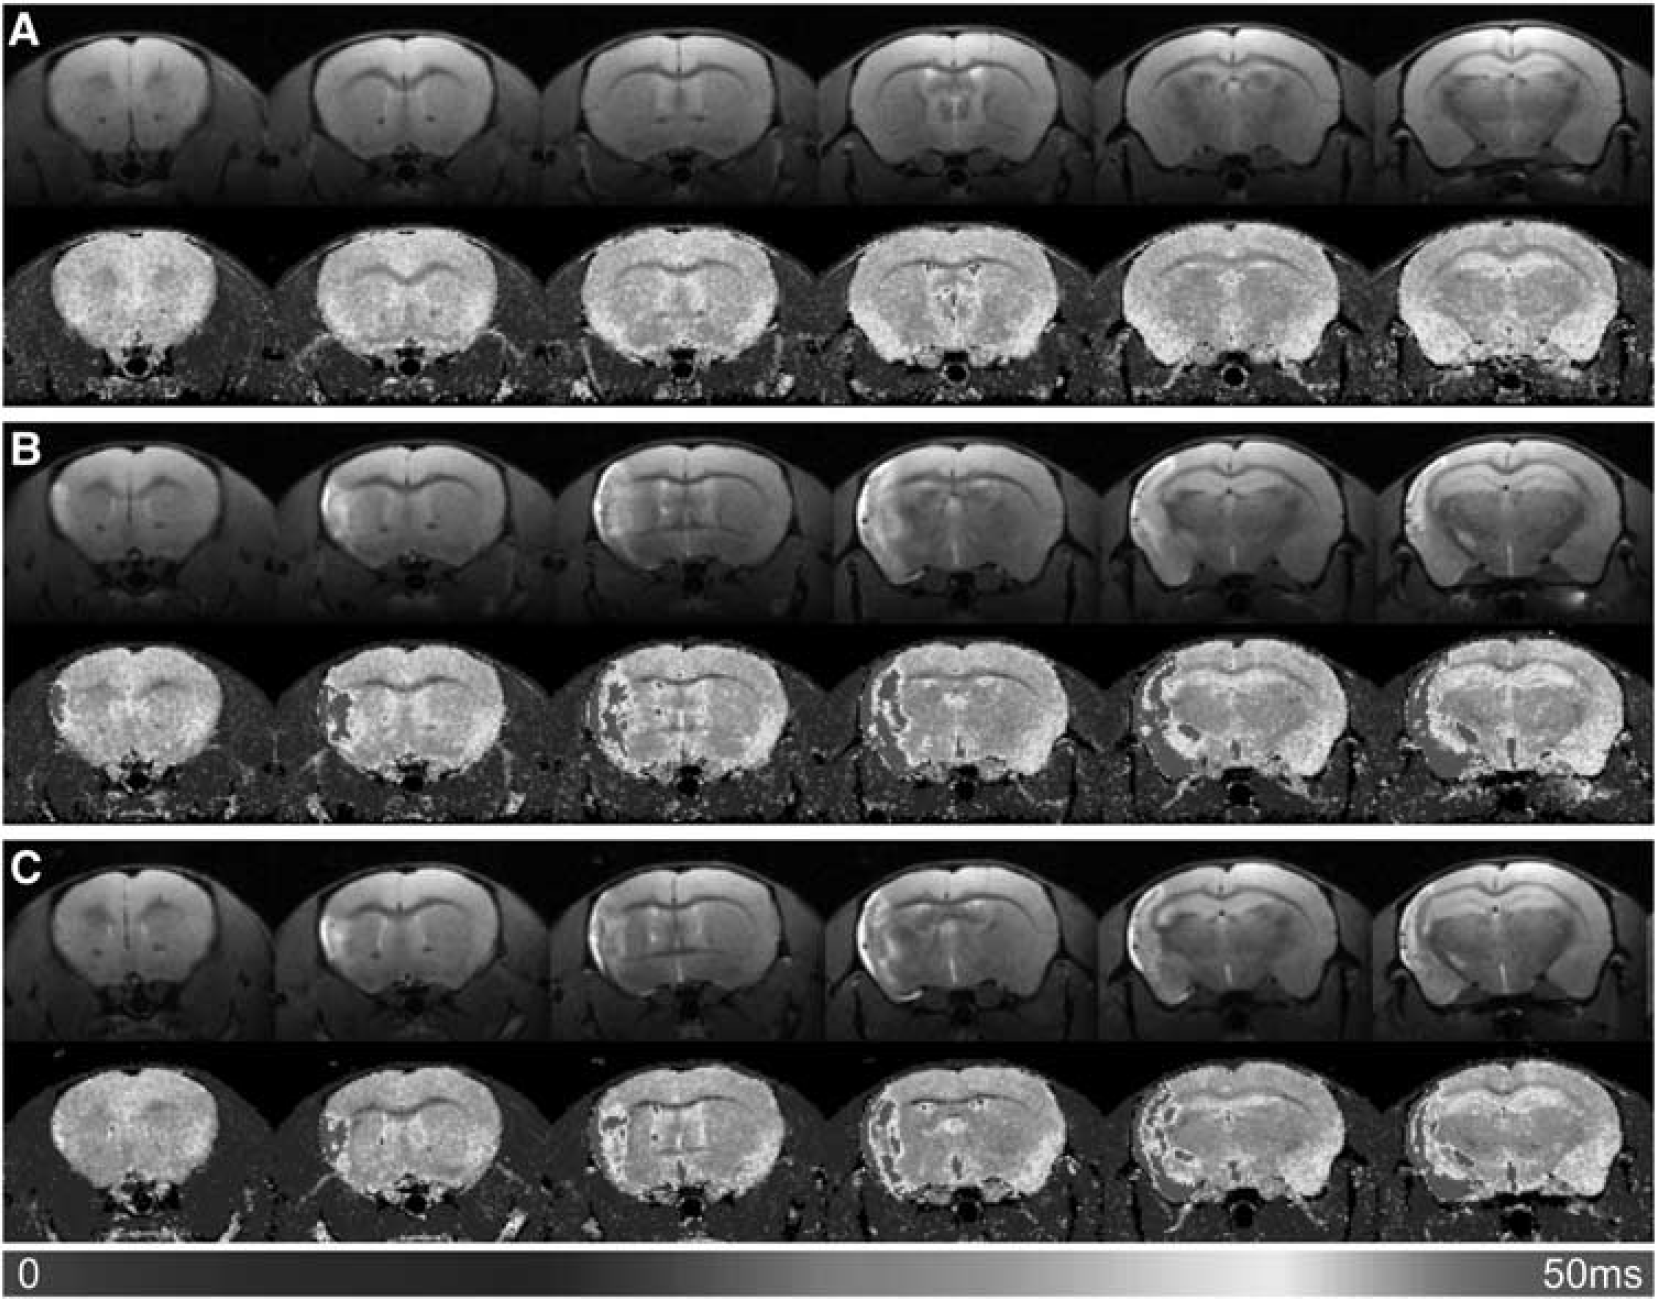
Magnetic resonance imaging of damage in ischemic stroke. MR images indicate temporal differences in estimations of lesion volume in mice with MCAO. T2-weighted images (10 milliseconds) and corresponding T2 maps of a mouse (
In the future, consideration must be given during the design of experimental MR studies, towards what different imaging sequences are indeed revealing. Nevertheless, despite the fact that diffusion- and T2-weighted lesion volumes reflect different patterns of edematous activity rather than a quantifiable measure of cell death, one thing that is clear is that infarct size estimations with both imaging techniques are strongly correlated with similar measures from tissue sections and infarct volume continues to have a major role as an outcome measure in both experimental and clinical research settings.
Nuclear and Noninvasive Fluorescence Imaging
Compared with MRI, nuclear imaging techniques such as PET or SPECT are by far less prevalent in experimental stroke research (Hsia et al, 2010; Martin et al, 2010; Rueger et al, 2010; Seo et al, 2007; Tang et al, 2007; Yui et al, 2011). The literature on the use of noninvasive fluorescence imaging (NFI) is also rare, primarily because of the depth limit of the method. Nevertheless, there have been a few papers published applying NFI in animal models of stroke (Abulrob et al, 2008; Bahmani et al, 2011; Klohs et al, 2008, 2009a, 2009b). The strongest advantages of these techniques when compared with MRI are that they can be orders of magnitude more sensitive, and molecules and/or proteins specifically associated with cell death can be labeled with radioactive or fluorescent compounds enabling a direct visualization of cell death after stroke.
To detect a signal in PET or SPECT imaging, a radiopharmacon must be injected; the same is true with a fluorochrome for NFI. After injection, the distribution of these compounds is determined using a scanner. In PET and SPECT imaging, emitted γ-rays are registered using a detector that consists of scintillators and photomultipliers. In NFI, different fluorochromes, mainly dyes that absorb and emit in the near infrared range are used. The Fluorescence is detected using a highly sensitive charge-coupled device camera. It is important to consider the spatial resolution of the imaging system, because smaller structures might not be resolved.
Up to now, there is no clinically approved technique that enables visualization of cell damage in stroke using an imaging agent specifically targeting dead or lethally damaged cells (Heckl, 2007; Heiss, 2010; Merino and Warach, 2010). Only a few compounds have been suggested as markers for the noninvasive visualization of cell death. Among those are compounds targeting caspase 3 by labeled enzyme substrates or synthetic caspase inhibitors, and annexin A5 targeting PS. These imaging agents have been tested under various pathologic conditions including cancer, myocardial infarction, atherosclerosis, or autoimmune diseases (for a review, see Faust et al, 2009). In our opinion, so far, only annexin A5 has provided evidence for specific binding to dead or damaged cells after stroke. Annexin A5 can be labeled with nanoparticles for MRI (Schellenberger et al, 2002; van Tilborg et al, 2010), radioisotopes for SPECT or PET imaging (Blankenberg, 2008), and near-infrared fluorochromes for NFI (Bahmani et al, 2011).
The first report on the use of annexin A5 as an imaging agent targeting cell death in stroke was published in 2006 (Blankenberg et al, 2006). 99mTc-labeled annexin A5 was intravenously injected into two patients with acute ischemic stroke. Single photon emission computed tomography imaging showed tracer uptake at sites of ischemic injury. In the same study, annexin A5 was used as an imaging agent to monitor the effects of antiapoptotic treatment in rats with 2 hours of MCAO. After 6 days of treatment, infarct size (cresyl violet staining) and tracer uptake were decreased by 75% and 80%, respectively, compared with untreated animals. Tracer uptake in both treated and untreated animals linearly correlated with infarct size and the number of TUNEL-positive cells (Blankenberg et al, 2006). In the same year, Lorberboym and coworkers also reported that, after intravenous injection, 99mTc-labeled annexin A5 can be detected in regions of ischemic injury in patients with stroke (Lorberboym et al, 2006). One year later, Tang and colleagues showed that SPECT imaging 1 hour after intravenous injection of 99mTc-labeled annexin A5 can be used to monitor the effects of minocycline treatment in a mouse model of focal cerebral ischemia. Tracer uptake in the ischemic hemispheres was decreased two to threefold in the treatment group, which also had smaller infarcts. Infarct volumes, as detected by cresyl violet and H&E staining, correlated with annexin A5 uptake (Tang et al, 2007).
In a recent study, we evaluated fluorescently labeled annexin A5 in a mouse model of transient (60 minutes) focal cerebral ischemia. Noninvasive fluorescence imaging, ex vivo imaging, fluorescence microscopy, and TUNEL staining were performed 4 and 8 hours after intravenous injection of either active or inactive annexin A5 and PI at day 2 after MCAO (Bahmani et al, 2011). We showed that cell death induced by cerebral ischemia can be specifically visualized in a mouse model of stroke using noninvasive techniques (Figures 4a and 6).
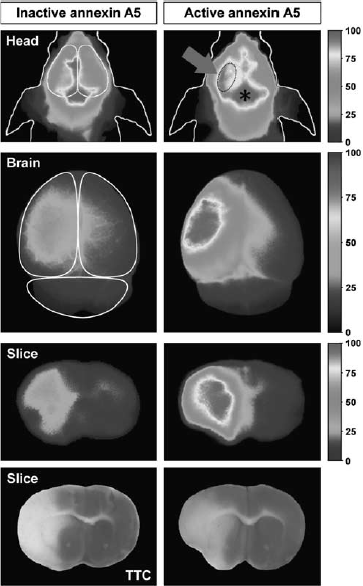
Noninvasive fluorescence imaging of cell death in ischemic stroke. Noninvasive fluorescence images of the heads of ischemic mice, corresponding ex vivo images of the brains, and of brain sections at 48 hours after MCAO (left hemisphere) and 4 hours after injection of either active (binds to PS) or inactive (no affinity for PS) annexin A5 labeled with the near-infrared fluorochrome Cy5.5. The noninvasive images of the heads show that after injection of both compounds, strong fluorescence from vessels, especially from the sinus confluens (indicated by the asterisk), were detected. Strong fluorescence signals were only seen over the stroke area of mice injected with active annexin A5 (see dotted line, arrow). Ex vivo images of the brains and the brain slices show that after injection of inactive annexin A5, only slightly higher fluorescence intensities were detected over the ischemic hemisphere compared with the contralateral side, which is attributed to the disruption of the blood—brain barrier (BBB). After injection of active annexin A5, considerably higher fluorescence intensities were observed over the ischemic hemisphere than over the contralateral side. Areas of higher fluorescence intensities corresponded closely with areas of the infarction appearing as pale in TTC-stained slices. Images adapted with permission from Bahmani et al, 2011. MCAO, middle cerebral artery occlusion; PS, phosphatidylserine; TTC, 2,3,5-triphenyltetrazolium hydrochloride.
Concluding Remarks
Stroke pathophysiology is highly complex, only partially understood, and investigated by numerous groups worldwide. There are various techniques that visualize different aspects of postischemic cell death (Table 1). Even seasoned scientists may not be aware of the limitations and specific sensitivities of the techniques they are using. Consequently, terms like ‘apoptosis’ and ‘necrosis’ are often used inappropriately, confounding the interpretation of the results. Most probably, the mechanisms by which cells die are even more complicated than what we believe today. Thus, to categorize any marker into the necrosis/apoptosis concept will be of no help for future research. In line with the guidelines proposed by the NCCD (Galluzzi et al, 2009), we suggest that, when reporting cell death in experimental stroke studies, the use of specific terms for subtypes of cell death should be replaced by a more descriptive nomenclature based on the actual marker that has been investigated (e.g., TUNEL-positive cells). In addition, because each of the methods described in this review has intrinsic limitations, we recommend using more than one marker or technique to study cellular damage and death.
Methods applied to cell death research in experimental focal cerebral ischemia
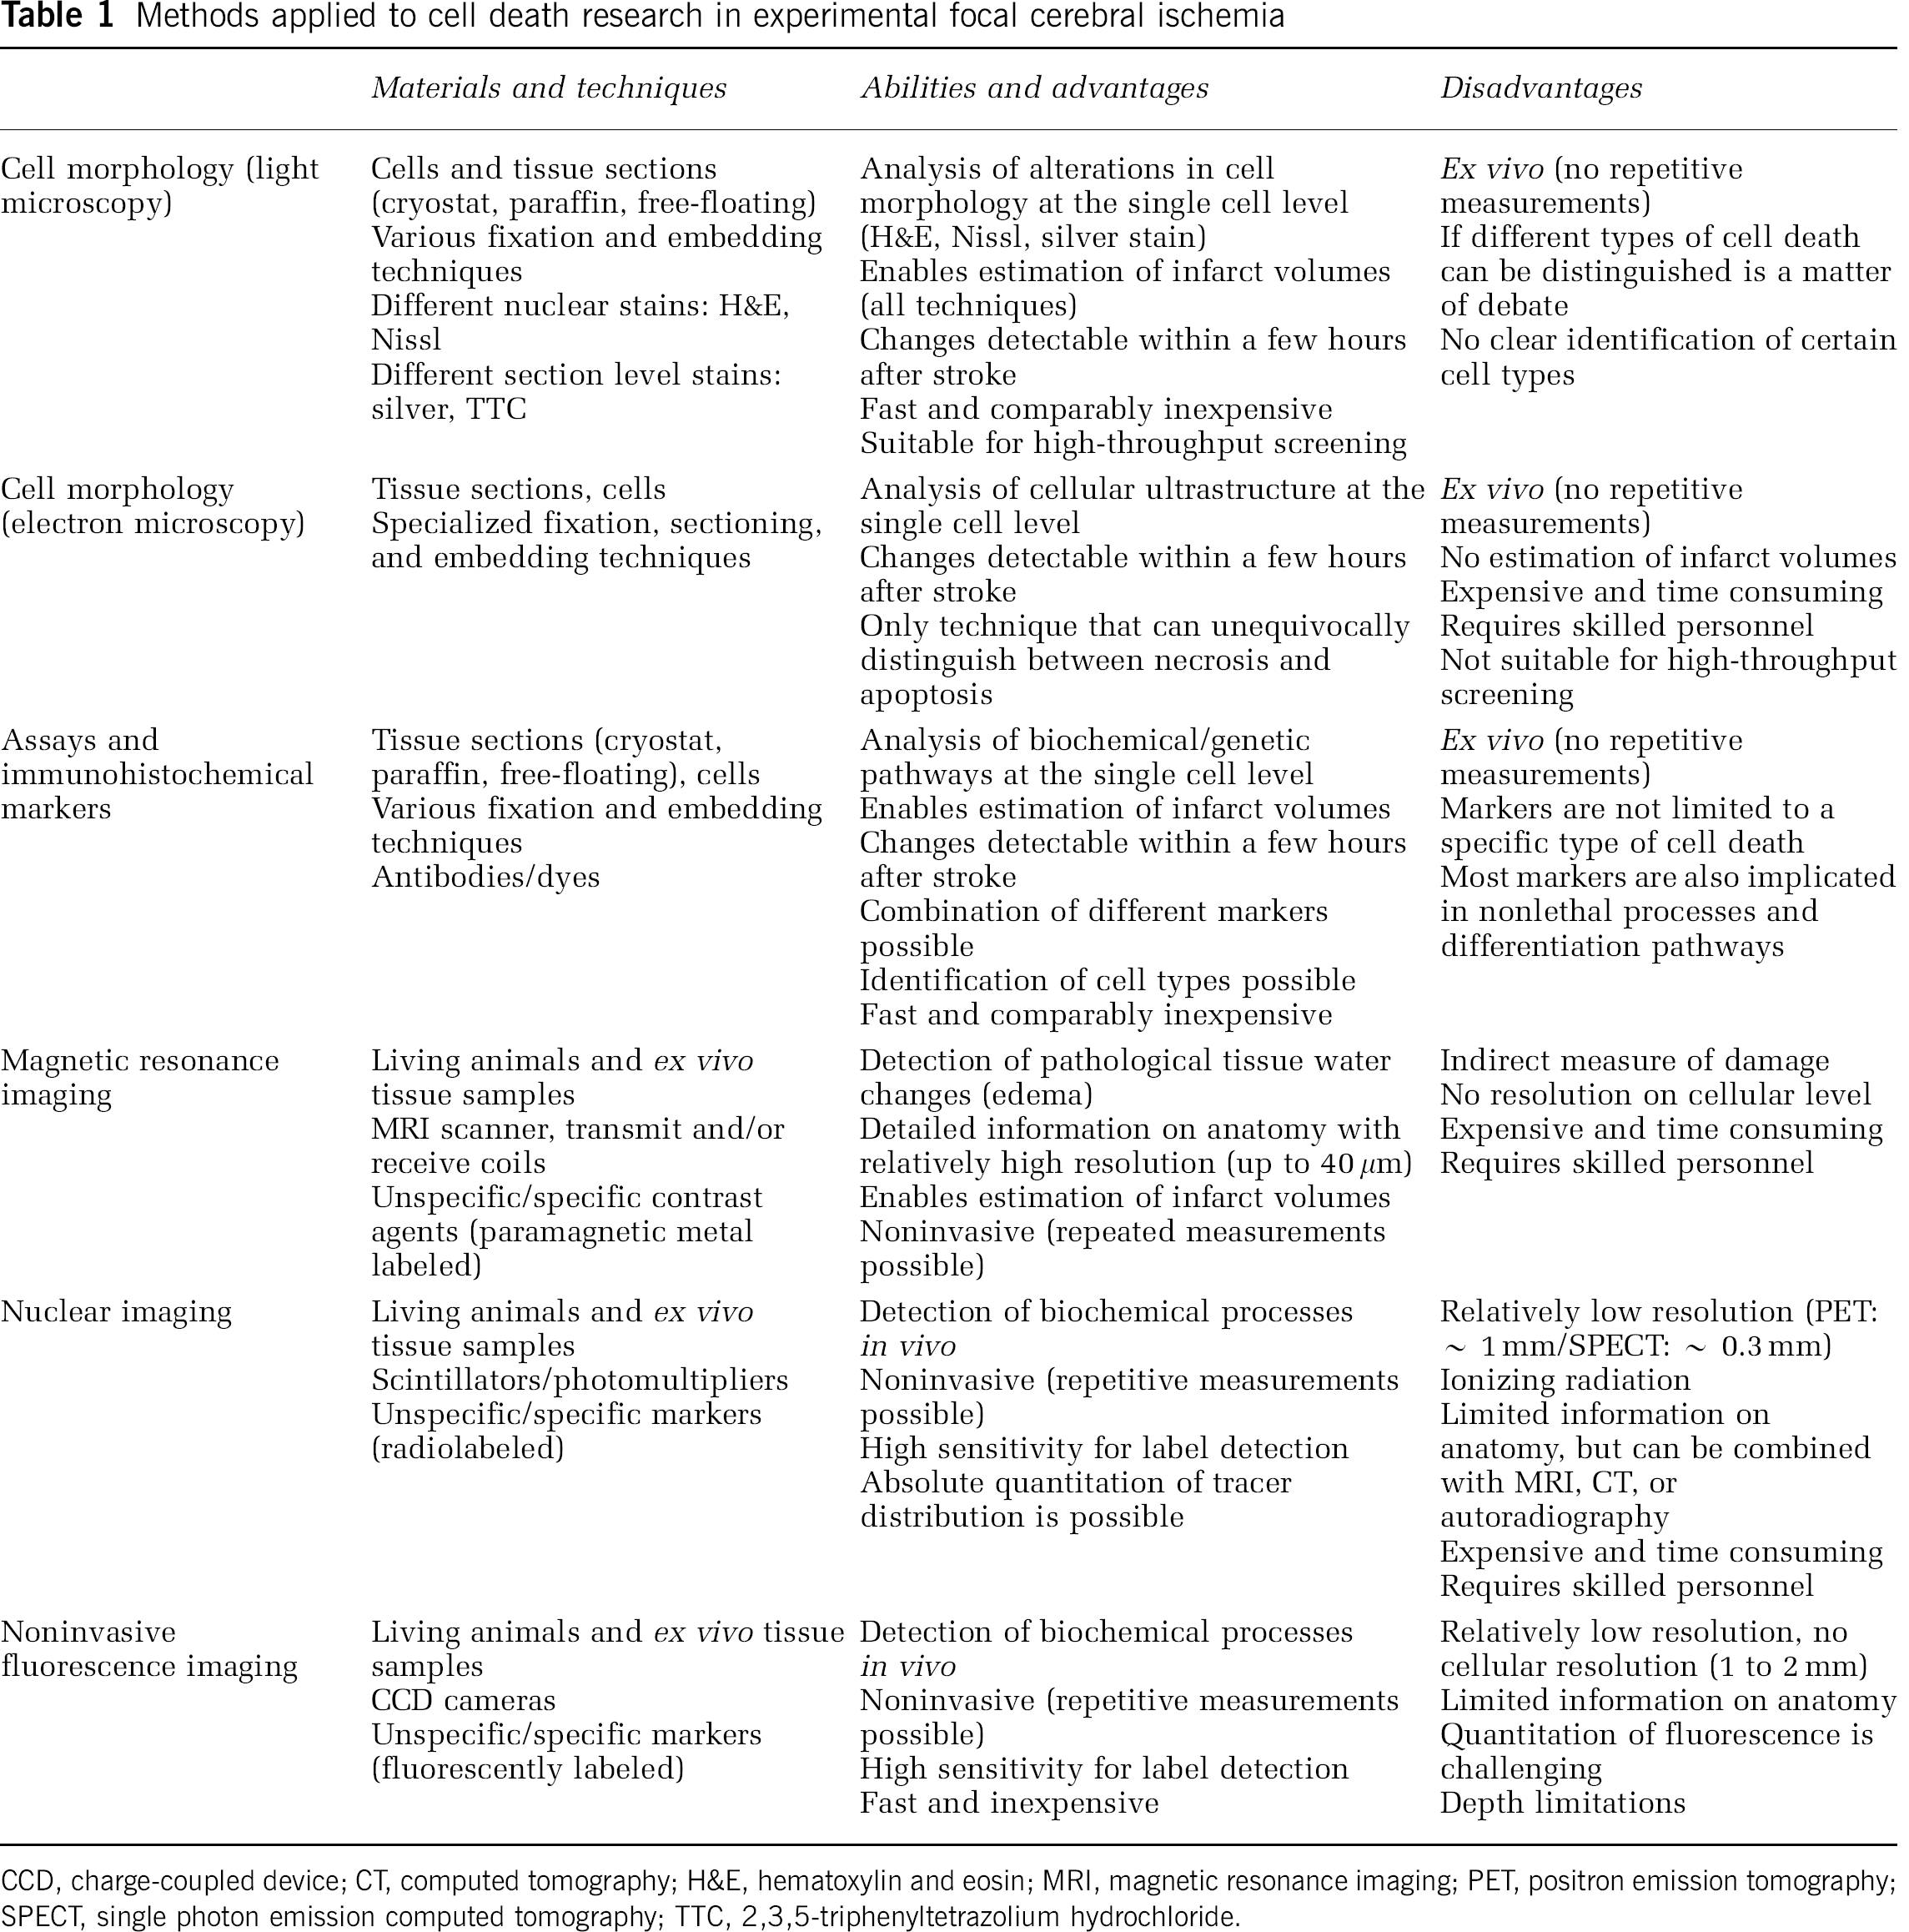
CCD, charge-coupled device; CT, computed tomography; H&E, hematoxylin and eosin; MRI, magnetic resonance imaging; PET, positron emission tomography; SPECT, single photon emission computed tomography; TTC, 2,3,5-triphenyltetrazolium hydrochloride.
In the future, it would be desirable to direct cell death research in stroke away from the apoptosis/necrosis concept towards identifying ‘points-of-no-return’, which are the first irreversible steps in a molecular cascade that will determine whether a cell will eventually die. Unfortunately, a ‘point-of-no-return’ could so far not be elucidated. The continuous identification of cell death-unrelated roles of key players involved in cell death suggests that the identification of the ‘point-of-no-return’ will be challenging, and certainly the black-and-white view that a marker can only promote or inhibit cell death should also be reassessed.
In conclusion, we hope that this review will assist scientists and researchers to select the techniques most suitable for their question and will spur the development of new markers for the visualization of cell death under various pathophysiological conditions.
Footnotes
Acknowledgements
The help of Henrike Bauer, Dr Katrin Frauenknecht and Dr Robert Kelm (Department of Neuropathology and Clinic of Anesthesiology, University Medical Center of the Johannes Gutenberg University, Mainz, Germany) with the figure is kindly acknowledged. We like to thank Prof Dr Tatjyana Pivneva (Bogomoletz Institute of Physiology, Kiev, Ukraine) for carefully proofreading the manuscript and for helpful discussions.
The authors declare no conflict of interest.