
Abstract
In this study, we aimed to assess the detection of crossed cerebellar diaschisis (CCD) following stroke by perfusion-weighted magnetic resonance imaging (PW-MRI) in comparison with positron emission tomography (PET). Both PW-MRI and 15O-water-PET were performed in acute and subacute hemispheric stroke patients. The degree of CCD was defined by regions of interest placed in the cerebellar hemispheres ipsilateral (I) and contralateral (C) to the supratentorial lesion. An asymmetry index (AI = C/I) was calculated for PET-cerebral blood flow (CBF) and MRI-based maps of CBF, cerebral blood volume (CBV), mean transit time (MTT), and time to peak (TTP). The resulting AI values were compared by Bland-Altman (BA) plots and receiver operating characteristic analysis to detect the degree and presence of CCD. A total of 26 imaging procedures were performed (median age 57 years, 20/26 imaged within 48 hours after stroke). In BA plots, all four PW-MRI maps could not reliably reflect the degree of CCD. In receiver operating characteristic analysis for detection of CCD, PW-CBF performed poorly (accuracy 0.61), whereas CBV, MTT, and TTP failed (accuracy < 0.60). On the basis of our findings, PW-MRI at 1.5 T is not suited to depict CCD after stroke.
Keywords
Introduction
Crossed cerebellar diaschisis (CCD) is characterized by a reduction in cerebral blood flow (CBF) and metabolism in the cerebellar hemisphere contralateral to a supratentorial lesion (Baron et al, 1981; Feeney and Baron, 1986). This is attributed to a disruption of the cortico-ponto-cerebellar pathways with consecutive cerebellar functional inactivation (Gold and Lauritzen, 2002). Crossed cerebellar diaschisis is consistently reported as a result of sudden circuit inactivation, such as stroke (Infeld et al, 1995; Sobesky et al, 2005a), but it is also found in chronic diseases, such as brain tumors (Kajimoto et al, 2007). In the initial hours after stroke, diaschisis is potentially reversible in case of supratentorial reperfusion (Hung et al, 2010; Sobesky et al, 2005a); however, persistent CCD (>24 hours) is associated with irreversible supratentorial tissue damage and poor clinical outcome (Sobesky et al, 2005a). Positron emission tomography (PET), single photon emission computed tomography, and xenon computed tomography are used as reference methods for perfusion imaging and thus for detection of CCD, but are not available in routine clinical care. Perfusion-weighted magnetic resonance imaging (PW-MRI), in contrast, is widely available and yields a surrogate of CBF using the bolus-tracking technique. Preliminary results suggest that PW-MRI may show CCD after stroke (Lin et al, 2009; Yamada et al, 1999), but the findings were not validated against a reference method, e.g., PET. In our study, we aimed to assess the detection of CCD after supratentorial stroke by PW-MRI at 1.5T in comparison with PET.
Materials and methods
In a retrospective analysis of a prospective imaging study (Zaro-Weber et al, 2009, 2010), we included patients who received comparative imaging by MR and PET after acute or subacute hemispheric stroke. We excluded patients with (1) incomplete coverage of the posterior fossa in PET or MRI imaging, (2) supratentorial hyperperfusion, (3) lesions restricted to the white matter, (4) thrombolysis, (5) a change in their NIHSS (National Institute of Health Stroke Scale) of >2 points during the imaging procedure, and (6) abnormalities in the posterior fossa on T1, T2, and diffusion-weighted MR images. The NIHSS was assessed at inclusion into the study, before both MRI and PET imaging. An experienced stroke neurologist supervised the patients during imaging under permanent monitoring according to stroke unit standards. All patients gave their informed consent. This study was approved by the local ethics board.
Magnetic Resonance Imaging
Magnetic resonance imaging was performed on a 1.5 T whole-body scanner (Philips Intera Master, Philips, Best, The Netherlands). Perfusion-weighted images were acquired in axial directions (20 slices, 6-mm slice thickness, 0.6-mm interslice gap, field of view 23 cm) and multishot three-dimensional T2*-weighted gradient echo-planar imaging sequences (PRESTO; effective echo time 25 milliseconds, flip angle 9°, echo-planar imaging factor 17, matrix 64 × 51, resulting voxel size 3.6 × 3.6 × 6 mm3) were used. The perfusion-weighted imaging (PWI) protocol included 60 measurements at intervals of 1.3 seconds after a standardized intravenous injection of 20 mL gadolinium-DTPA (diethylenetriamine pentaacetic acid Magnevist®, Schering AG, Berlin, Germany; 10 mL/sec, followed by rapid infusion of 20 mL saline).
Positron Emission Tomography
Positron emission tomography was performed in a resting state on an ECAT EXACT or EXACT HR scanner (Siemens/CTI, Knoxville, TN, USA). Cerebral blood flow was acquired with 15O-water according to the intravenous bolus method in a two-dimensional data acquisition mode providing 47 contiguous 3-mm slices of 5 mm full-width at half-maximum in plane-reconstructed resolution. The scan duration was 90 seconds with 60 mCi (= 2.2 GBq). Continuous arterial blood sampling (radial artery) was used to calculate absolute CBF values (Raichle et al, 1983).
Data Postprocessing and Image Analysis
Image analysis was performed blinded to clinical data, and postprocessing of PW images was performed using STROKETOOL (Digital Image Solutions, Frechen, Germany), Version 2.3 (Seitz et al, 2005; Wittsack et al, 2002) as described in detail in the study by Zaro-Weber et al (2009). Volumetric and region of interest (ROI)-based analyses were performed using VINCI (Max Planck Institute for Neurological Research, Cologne, Germany), Version 2.59 (Cízek et al, 2004). Supratentorial lesion volume was defined on diffusion-weighted images by all voxels with a signal intensity > 120% of the reference value, i.e., the mean value of a ROI covering the unaffected middle cerebral artery territory on a transaxial slice through the basal ganglia (Heiss et al, 2004). Supratentorial hypoperfusion volume was defined on PET-CBF images by all voxels with CBF values <20 mL/100 g per min. To avoid inclusion of the white matter, hypoperfusion volume was analyzed on an individual T1-based brain mask, which excluded the ventricles and most parts of the white matter.
Positron emission tomography images were resized to the MR images in the z axis and then realigned by an automated observer-independent algorithm. To assess the degree of CCD, circular ROIs, measuring 33 mm in diameter, were placed in the cerebellar hemispheres ipsilateral (I) and contralateral (C) to the hemispheric stroke. The degree of CCD was measured on one axial cut representing the highest cerebellar asymmetry and was expressed as an asymmetry index (AI = C/I) for PET-CBF and on a corresponding slide for MRI-based maps of CBF, cerebral blood volume (CBV), mean transit time (MTT), and time to peak (TTP) (Figure 1).
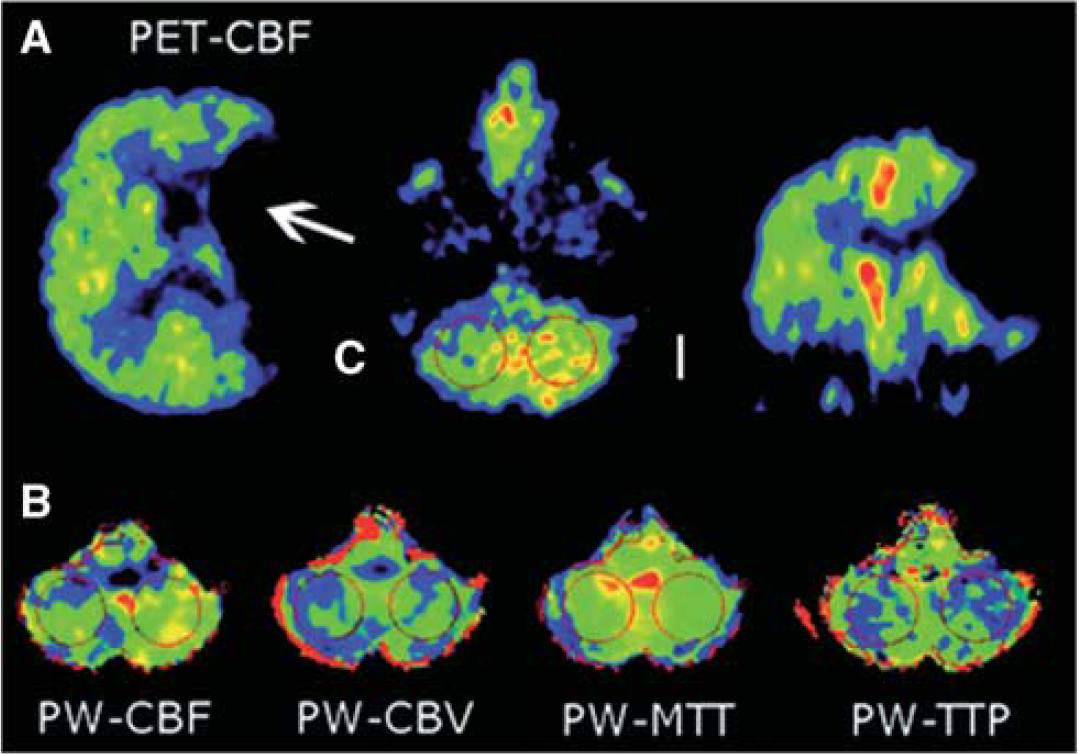
Assessment of CCD by regions of interest (ROIs) in the cerebellar hemispheres ipsilateral (I) and contralateral (C) to the supratentorial lesion (arrow). Asymmetry indices (C/I) were calculated for (A) PET-CBF images and for (B) perfusion-weighted maps of CBF, CBV, MTT, and TTP. CBF, cerebral blood flow; CBV, cerebral blood volume; CCD, crossed cerebellar diaschisis; MTT, mean transit time; TTP, time to peak.
Statistical Analysis
Owing to skewed distribution of most study variables, results were presented as median and interquartile range (IQR), if not indicated otherwise. For correlation analysis, Spearman's rank correlation was used. The ability of PW-MRI to show the degree of CCD was compared with PET by Bland-Altman (BA) plots of the respective PW-MRI and PET-CBF AIs. Logarithmic BA plots were used, when measurement errors seemed to be proportional to the mean.
Positron emission tomography-CBF data obtained from 10 volunteers without any history of a neurologic or psychiatric disease and with normal MRI served as a reference group to determine AI values representing significant CCD in PET imaging. However, PET is highly sensitive to subtle perfusion asymmetries, which might be statistically significant but not clinically relevant. Hence, for receiver operating characteristic curve analysis of sensitivity, specificity, and positive and negative predictive values of MRI-based AIs to detect CCD, we used a predefined threshold of 0.90 to group patients as CCD + (AI <0.90) or CCD- (AI ≥0.90).
Results
Of 25 patients (12 women, median age 57 years, IQR 53 to 66), 1 received comparative imaging twice after stroke, resulting in 26 imaging procedures. Overall, 20 comparative imaging procedures were performed within 48 hours after stroke (median 13 hours, IQR 7 to 26) and 6 beyond 48 hours (median 330 hours, IQR 245 to 640). The median time delay between MRI and PET was 68 minutes (IQR 52 to 135). The median supratentorial diffusion-weighted image-lesion volume was 31.4 mL (IQR 18.4 to 159.2), and the median supratentorial hypoperfusion volume was 57.9 mL (IQR 21.9 to 118.8). Detailed patient data are shown in Table 1. The median AI values for PET-CBF, PW-CBF, PW-CBV, PW-MTT and PW-TTP were 0.85, 0.84, 0.88, 1.00, and 1.01, respectively (Table 1). In the reference group of healthy volunteers, a mean PET-CBF AI value of 0.98 (s.d. ±0.01) was found. Therefore, CCD was found to be statistically significant in AI values below 0.96, which represents values <2 s.d. of the mean of the reference group. Crossed cerebellar diaschisis was found in 22 of 26 PET imaging procedures (85%).
Clinical data, volumetric data, individual asymmetry indices for PET-CBF, and MRI-based maps of CBF, CBV, MTT, and TTP
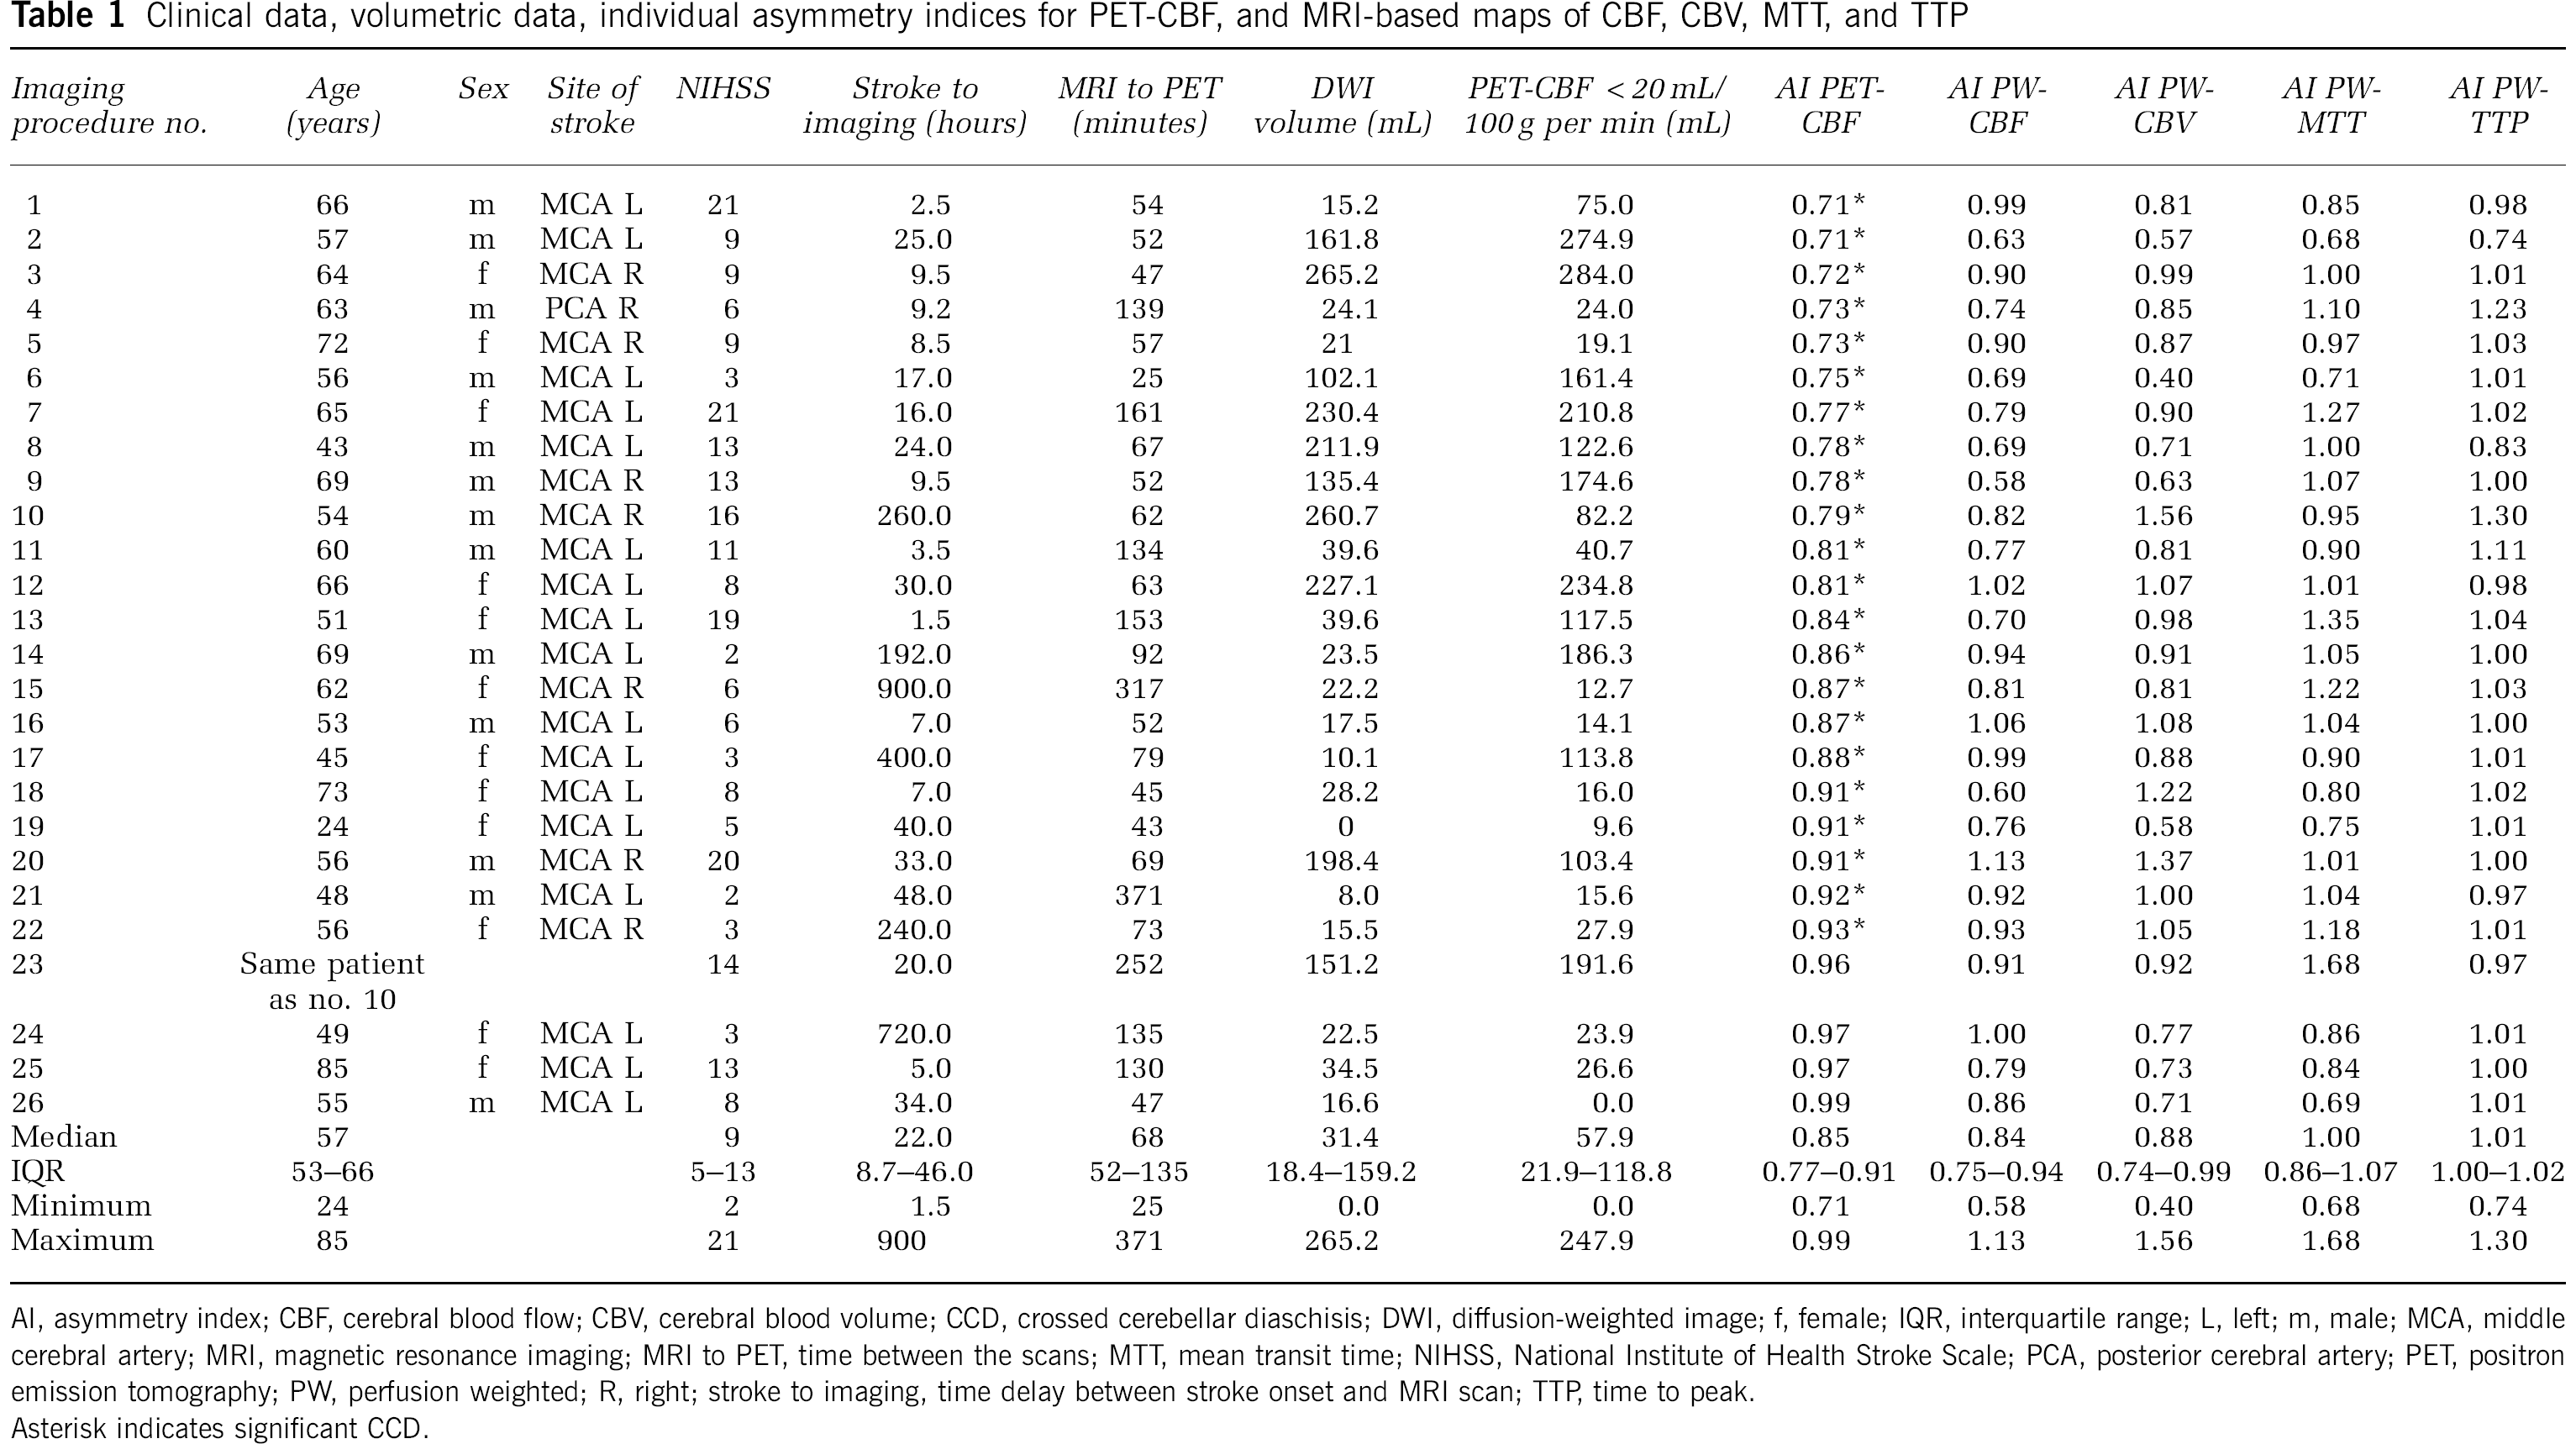
AI, asymmetry index; CBF, cerebral blood flow; CBV, cerebral blood volume; CCD, crossed cerebellar diaschisis; DWI, diffusion-weighted image; f, female; IQR, interquartile range; L, left; m, male; MCA, middle cerebral artery; MRI, magnetic resonance imaging; MRI to PET, time between the scans; MTT, mean transit time; NIHSS, National Institute of Health Stroke Scale; PCA, posterior cerebral artery; PET, positron emission tomography; PW, perfusion weighted; R, right; stroke to imaging, time delay between stroke onset and MRI scan; TTP, time to peak.
Asterisk indicates significant CCD.
For all patients, the correlation of PWI-based AI values with the corresponding PET-CBF AI values was weak (Spearman's rho: PW-CBF 0.37; PW-CBV 0.26; PW-MTT 0.12; PW-TTP 0.04). Bland-Altman analysis revealed a high to very-high spread of absolute differences of PET-CBF and PW-MRI map AIs from ± 0.3 for PW-CBF, up to ± 0.8 for PW-CBV and PW-MTT, and high, exclusively negative differences with a maximum of −0.5 for PW-TTP (Figure 2). Owing to this magnitude of spreading in all tested maps, PW-MRI must be considered unsuitable to reliably depict the degree of CCD. All four plots were suggestive of an error proportional to the mean, which would allow for postmeasurement correction (Figure 2 and explanation). However, logarithmic transformation of AI values did not alter the shape of the BA plots considerably, proving the observed distribution in the BA plots to be a result of random errors rather than proportional errors (data not shown) (Bland and Altman, 1996).
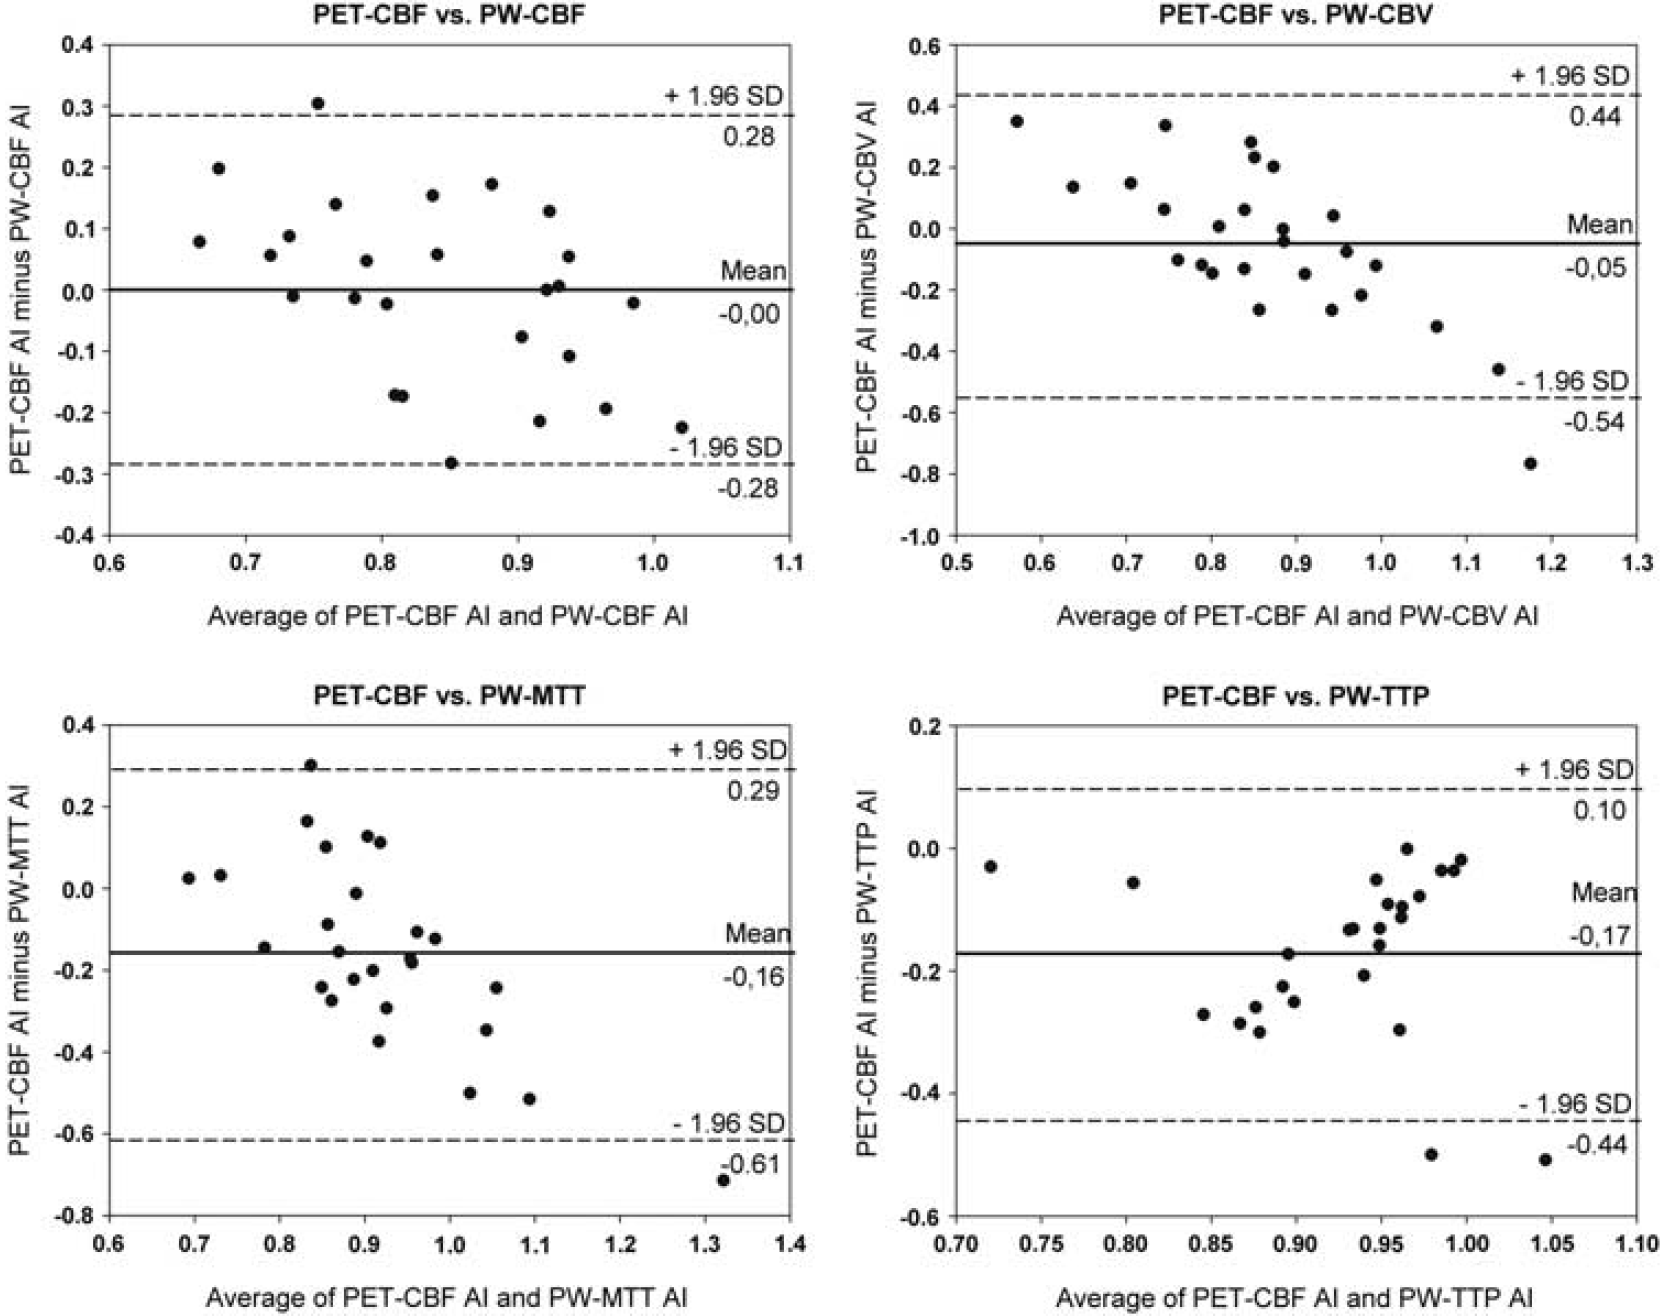
BA plots comparing asymmetry indices (AIs) of PET and MR imaging. All four plots suggested a proportional error, with negative differences at high AI values and positive differences at low AI values in case of PW-CBF, PW-CBV, and PW-MTT. For TTP, negative differences increasing with lower AI values were found. However, logarithmic transformation did not alter the plots considerably, meaning that the observed distribution was a result of random and not proportional errors (data not shown). BA, Bland-Altman; CBF, cerebral blood flow; CBV, cerebral blood volume; MR, magnetic resonance; MTT, mean transit time; PET, positron emission tomography; PW, perfusion weighted; TTP, time to peak.
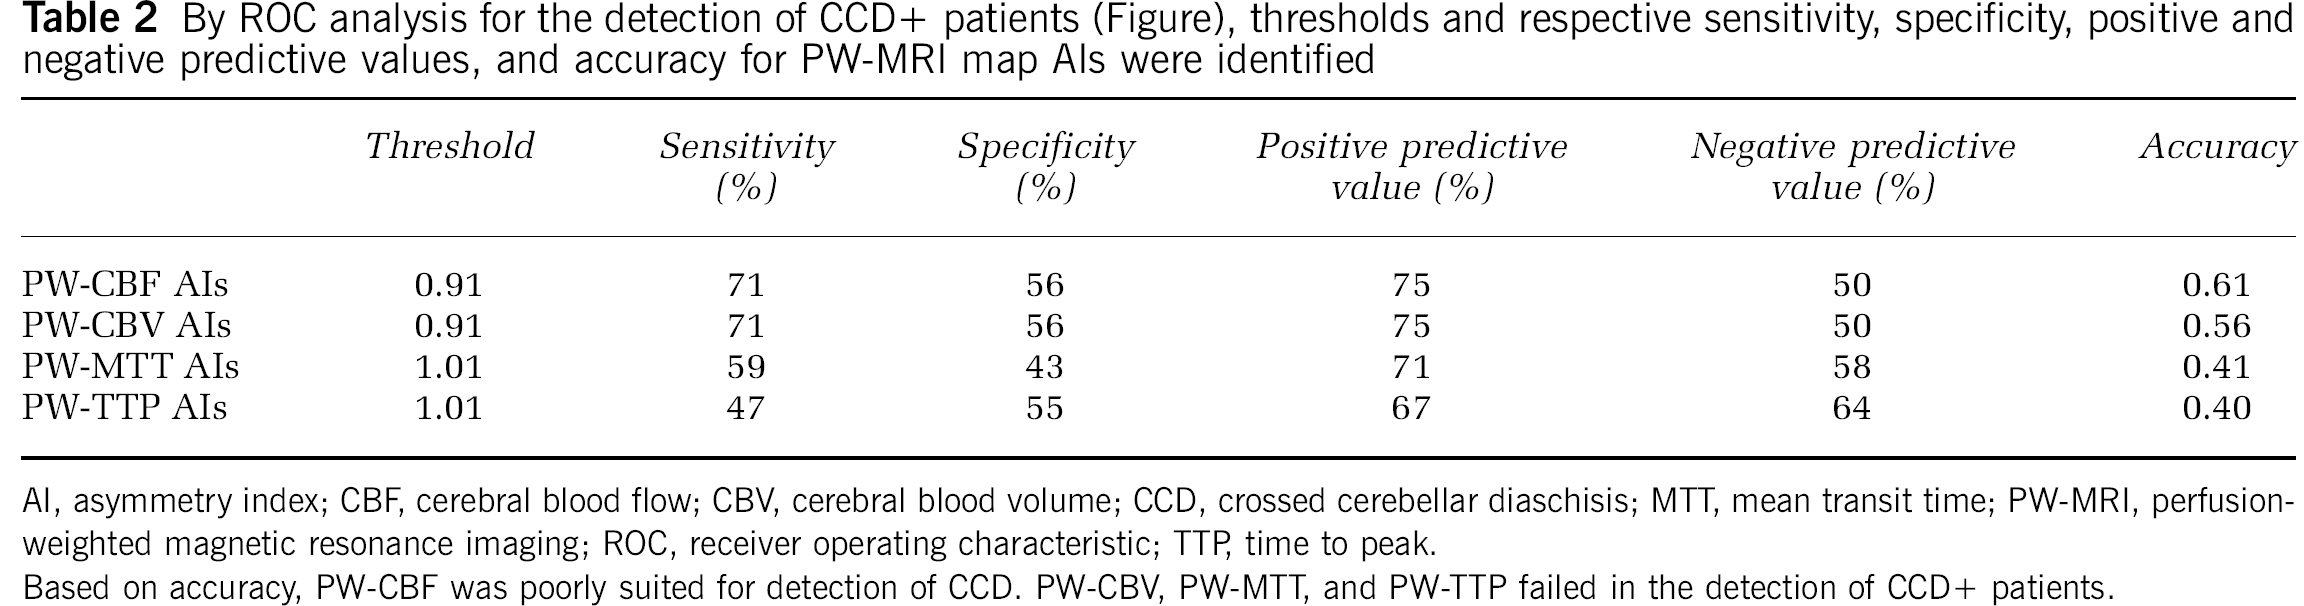
Receiver operating characteristic analysis for the detection of CCD + patients (Figure 3) identified the thresholds and respective sensitivity, specificity, positive and negative predictive values, and accuracy for PW-MRI map AIs (Table 2). On the basis of accuracy, PW-CBF was poorly suited for detection of CCD, whereas PW-CBV, PW-MTT, and PW-TTP failed to detect CCD.
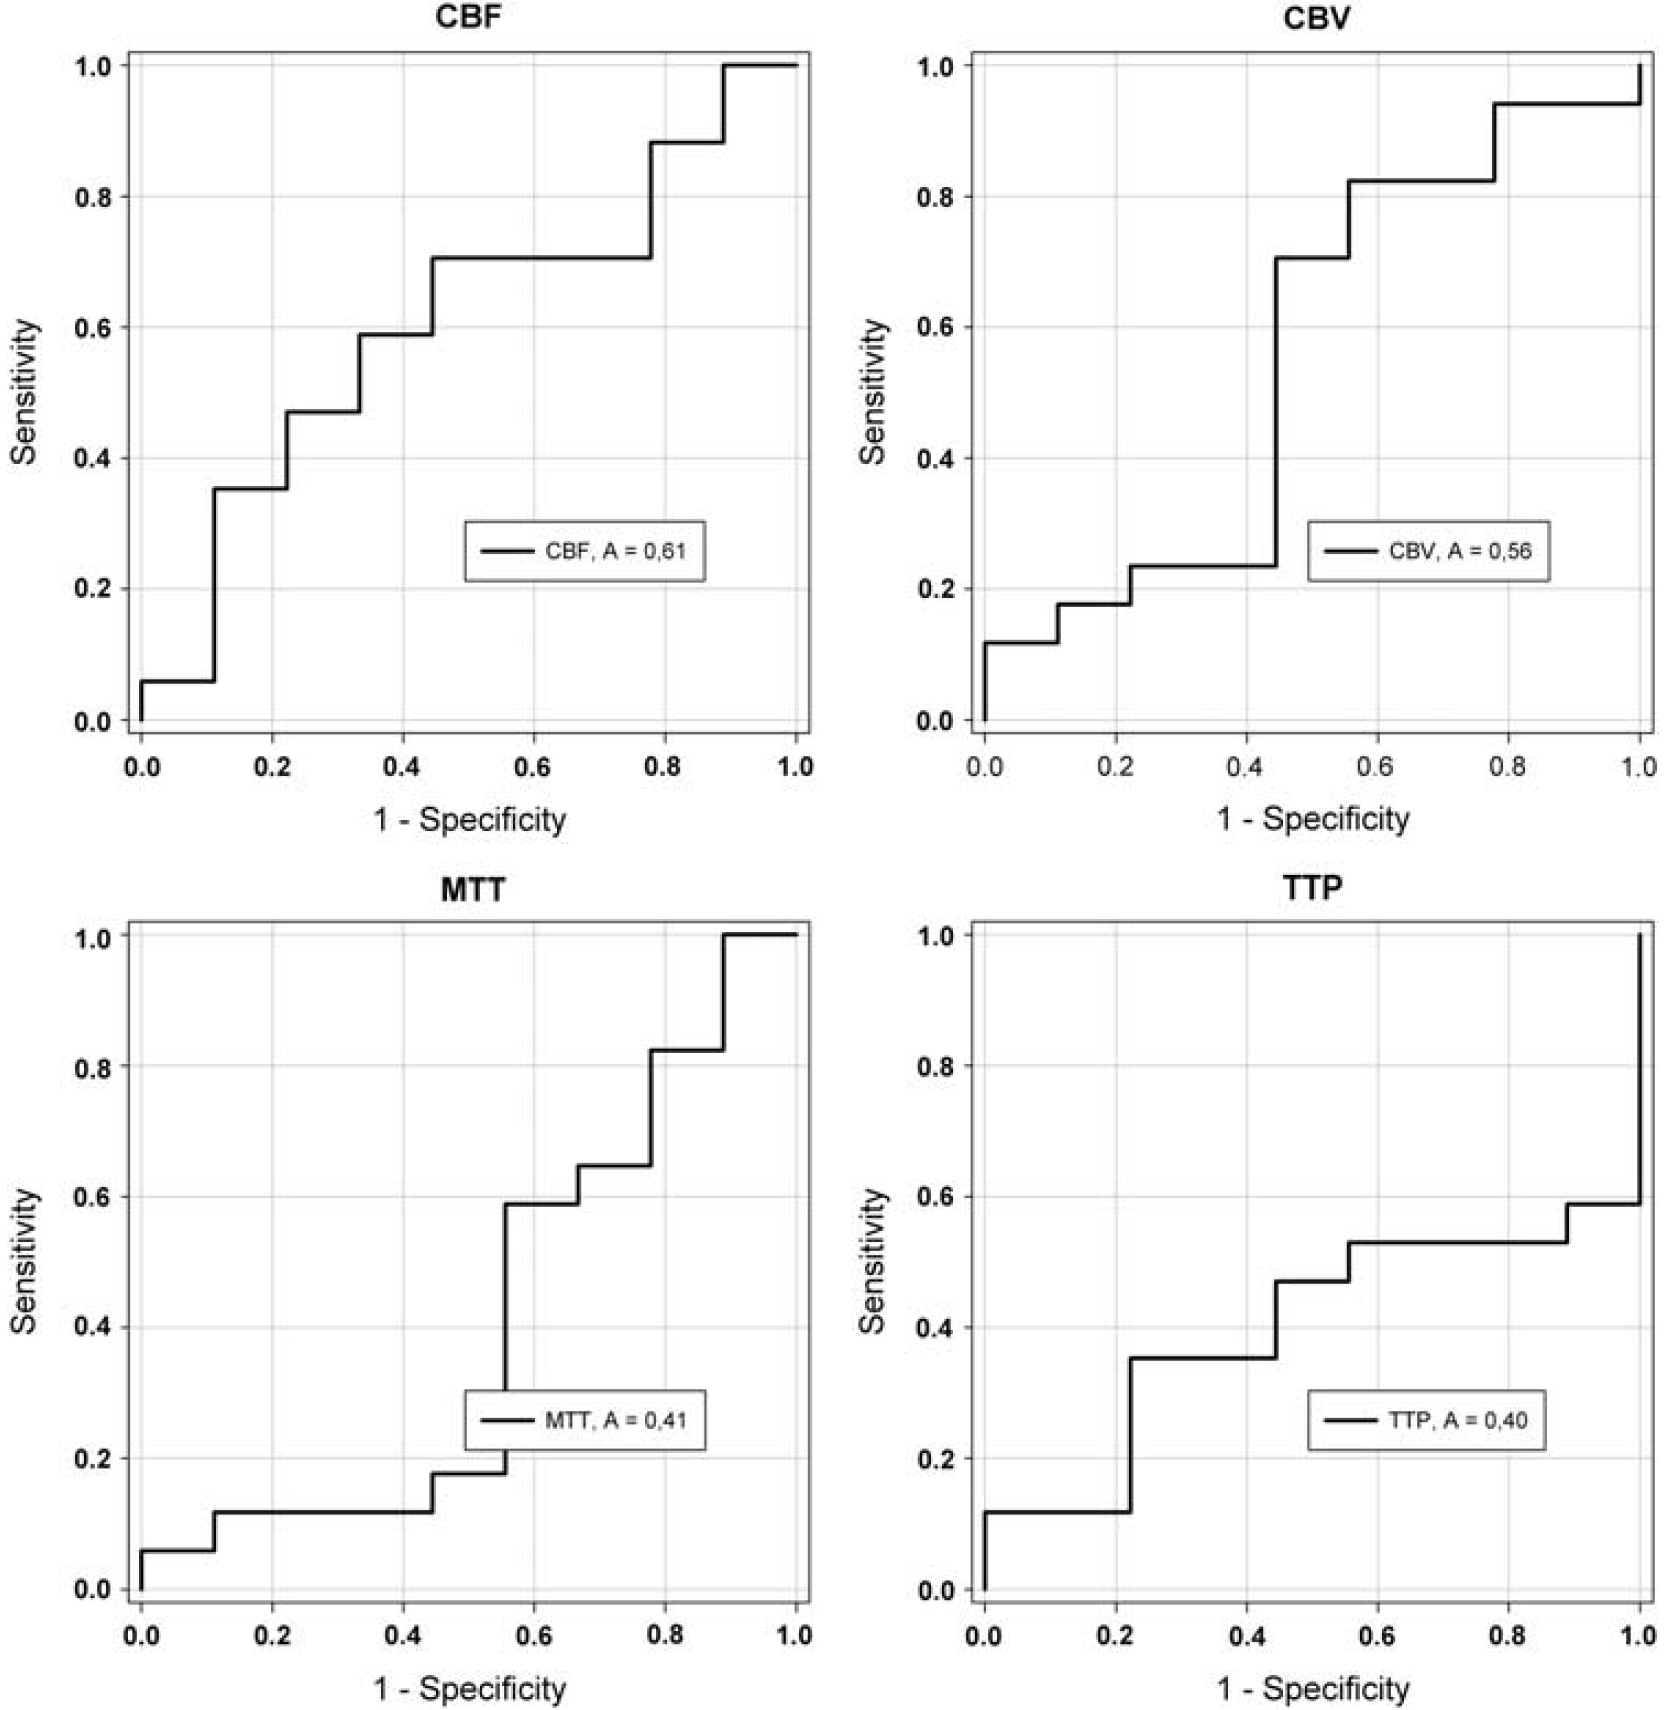
Receiver operating characteristics (ROC) analysis of PW-CBF, PW-CBV, PW-MTT, and PW-TTP asymmetry indices (AIs) for the detection of CCD + (AI < 0.9) patients. On the basis of the area under the curve (A), CBF (0.61) performed poorly, whereas CBV (0.56), MTT (0.41), and TTP (0.40) failed to detect CCD. CBF, cerebral blood flow; CBV, cerebral blood volume; CCD, crossed cerebellar diaschisis; MTT, mean transit time; TTP, time to peak.
By ROC analysis for the detection of CCD+ patients (Figure), thresholds and respective sensitivity, specificity, positive and negative predictive values, and accuracy for PW-MRI map AIs were identified
AI, asymmetry index; CBF, cerebral blood flow; CBV, cerebral blood volume; CCD, crossed cerebellar diaschisis; MTT, mean transit time; PW-MRI, perfusion-weighted magnetic resonance imaging; ROC, receiver operating characteristic; TTP, time to peak.
Based on accuracy, PW-CBF was poorly suited for detection of CCD. PW-CBV, PW-MTT, and PW-TTP failed in the detection of CCD+ patients.
Discussion
We report on a direct comparison of PWI at 1.5 T with 15O-water-PET-based CCD measurement. In a unique patient sample of acute and subacute human stroke, patients received comparative imaging within a narrow timeframe. We found that the quality of MRI-based assessment of CCD differed between PW-MRI maps. However, even PW-CBF as the best-performing map could not reliably depict the degree of CCD and performed poorly in the detection of CCD-positive patients.
Positron emission tomography-based measurement of brain perfusion differs from the MRI-based bolus-tracking technique. 15O-water, as used in PET, is a highly diffusible tracer. Regional perfusion is calculated by summing up the counts of several measurements over a predefined time, resulting in a time-voxel-count curve. Conversely, in PW-MRI, a paramagnetic contrast agent is used, which is strictly confined to the intravascular compartment provided the blood-brain barrier is intact. Perfusion is measured by repetitive imaging during the first brain passage of the contrast agent bolus, resulting in a time-voxel-intensity curve. Despite these methodological differences, direct comparison with PET (next to xenon computed tomography) is still considered the best available in vivo validation of PWI measurements. Several studies have described the validation of PWI-based measurement of supratentorial hypoperfusion (Sobesky et al, 2005b; Takasawa et al, 2008; Zaro-Weber et al, 2010). Only few data are available on PWI in the posterior fossa focusing exclusively on stroke in the posterior circulation (Förster et al, 2010; Kim et al, 2010). In this context, our study is the first validation of PWI against PET in a condition of functional hypoperfusion as seen in CCD in the posterior fossa.
In PW stroke imaging, in which the tracer arrival is delayed owing to vessel occlusion, both nondeconvoluted and deconvoluted parameter maps are generated from the time-intensity curve. TTP, a composite correlate of hemodynamic parameters such as arrival time of the contrast bolus, transit time through the tissue, and arterial dispersion, has proven to be a useful nondeconvoluted parameter (Christensen et al, 2009; Zaro-Weber et al, 2010). However, MTT, CBV, and CBF maps are generated by deconvolution, which is believed to uncouple the hemodynamic information into different maps reflecting distinct hemodynamic parameters. These maps have formerly been considered to be superior to nondeconvoluted maps to identify penumbral hypoperfusion. This notion has been questioned recently (Christensen et al, 2009; Zaro-Weber et al, 2010). However, in case of CCD, a pathophysiological condition with distinct hemodynamic changes is investigated. In this study, cerebellar vessels are patent and CBF is reduced because of functional inactivation. This reduction in CBF is usually less pronounced than in areas of stroke. In consequence, depiction of the more subtle perfusion changes in CCD requires higher sensitivity from the imaging method. It is known that PWI has methodical limitations in the posterior fossa, e.g., sinus artifacts and susceptibility artifacts attributed to the skull. Such limitations are less pronounced in PET-based perfusion measurements. This difference may explain why PW-MRI failed to detect CCD in comparison with the gold standard PET.
Method comparison by the BA plot can be considered the statistical gold standard overcoming limitations of a mere correlation analysis (Bland and Altman, 1986). When measurement differences in the plot are intolerably high, the compared methods are not exchangeable.
In this study, a 4% perfusion asymmetry between the cerebellar hemispheres in PET-CBF was already significant and a 10% difference was defined as clinically relevant. However, differences in the BA plots between PET-CBF and PW maps were between 30% and 80%, clearly indicating that the methods are not exchangeable. This explains why in the following receiver operating characteristic analysis, even the best-performing MRI map, i.e., PW-CBF, was only poorly suited to detect CCD-positive patients. However, in these analyses, exclusively individual values were compared. Assuming a random scattering of the error, the median AI values should in theory reflect the correct AI value of the whole group. This is probably true in our case. First, the median AI value of PW-CBF (0.84) was almost equal to the median AI value of PET-CBF (0.85). Second, the asymmetry shown by PW-CBV values and the lack of asymmetry shown by PW-MTT values are in good accordance with previous data. In a multitracer PET study, the authors found significantly correlated asymmetries of CBF and CBV, whereas plasma MTT showed no hemispheric difference (Yamauchi et al, 1999). Therefore, our congruent results may support the pathophysiological model, after which CBF and CBV are both decreased in deafferentation in contrast to ischemia, in which CBF is reduced, but CBV is increased.
Using nuclear medicine methods, usually a CCD incidence of >50% is found. With 85%, the occurrence of significant CCD after stroke in our study is quite high, but still in line with the literature. For example, PET-based studies reported incidence of CCD in 67% (Yamauchi et al, 1992) and 89% of patients (Miura et al, 1994). Two previous studies dealt with MRI-based detection of CCD: Yamada et al (1999) found an incidence of 80%, whereas Lin et al (2009) reported CCD in only 16% of patients. How could these differences in the incidence of CCD in MRI studies be explained?
In the study by Lin et al, the assessment of CCD was based on visual inspection of TTP maps. In 16% (47 patients), TTP showed asymmetry. However, we found TTP to perform worst of all tested maps to depict CCD. This might explain the low incidence with use of TTP maps and highlights the importance of comparison with reference methods, especially in conditions resulting from less well-understood pathophysiological mechanisms, such as CCD.
In their small study of 10 patients, Yamada et al based their assessment of CCD on CBV maps, which we found to perform better than TTP maps, but still failed in the detection of CCD. This might be explained by methodological differences. Changes in hemodynamic parameters as a result of functional activity are not only regulated by astrocytes on the level of arterioles. Recruitment of capillaries may have an even more important role (Paulson et al, 2010). In our study, gradient echo-based echo-planar imaging sequences were used for PWI. These sequences also include supplying and draining macrovessels, i.e., total blood volume, in the maps of CBV. This results in a decreased sensitivity to show regional changes of capillary blood volume (Boxerman et al, 1995). However, Yamada et al used a spin echo-based PWI sequence. In contrast to gradient echo sequences, these sequences are more sensitive to show capillary blood volume changes (Boxerman et al, 1995). This may be a reason why CBV seemed to be a viable surrogate of CCD in spin echo-based PW imaging, but not in our study.
Other methodological differences might also account for the differing results. Yamada et al used no arterial input function to calculate CBV maps. Lin et al used an automated arterial input function, whereas in our study, arterial input function was calculated by manually defining voxels in the middle cerebral artery. In the study by Yamada et al, the patient sample consisted of patients in subacute to chronic stages (6 to 120 days), and in the study by Lin et al, only acute and subacute patients (up to 5 days after stroke) were included, whereas we examined a patient sample with mixed stages after stroke (1.5 hours to 38 days).
Our study has some limitations. First, this was a retrospective study with the largest sample of comparative MRI and PET imaging available. However, it still had a modest sample size. Second, perfusion changes between the imaging procedures cannot be ruled out, although the time between MRI and PET in our study is one of the shortest available in the literature (median 68 minutes), and changes in the clinical presentation of patients were monitored. Third, ROI-based approaches as in our study may be less accurate than voxel-based comparisons. However, we chose the ROI-based approach because of known spatial distortion of echo-planar imaging-PW images, which makes coregistration on a voxel level difficult, especially in the posterior fossa. Fourth, only PWI at 1.5-T field strength was compared with PET in this study. Although susceptibility artifacts tend to increase with higher field strengths, advantages of PWI at 3 T over 1.5 T have been shown to date (Kosior et al, 2007).
In conclusion, PWI at 1.5 T is not suited to show CCD after stroke. However, the MRI-based detection of CCD needs further investigation. The possibility of (serial) imaging of CCD without radiation exposure could lead to a better understanding of functional flow changes after stroke, which are important epiphenomena following focal ischemia. Further studies should focus on the validation of PWI at higher field strengths (3 or 7 T) or alternative MR-perfusion measurement techniques, such as arterial spin labeling.
Footnotes
Acknowledgements
The authors express their gratitude to the members of the Neurocritical Care Unit (Department of Neurology, University of Cologne), to the staff of the MRI facility (Department of Neuroradiology, University of Cologne), and especially to the staff of the PET Unit (Max-Planck-Institute for Neurological Research, Cologne) for helpful cooperation in this multimodal imaging study. The authors also express their gratitude to Dr H-J Wittsack (Department of Radiology, University of Düsseldorf) for providing STROKETOOL, which was used to calculate perfusion-weighted images. Furthermore, the authors thank Dr Uwe Malzahn, Center for Stroke Research Berlin, for help with the statistical analysis.
The authors declare no conflict of interest.