
Abstract
Cortical spreading depression (CSD) is associated with severe hypoperfusion in mice. Using minimally invasive multimodal optical imaging, we show that severe flow reductions during and after spreading depression are associated with a steep decline in cerebral metabolic rate of oxygen. Concurrent severe hemoglobin desaturation suggests that the oxygen metabolism becomes at least in part supply limited, and the decrease in cortical blood volume implicates vasoconstriction as the mechanism. In support of oxygen supply-demand mismatch, cortical nicotinamide adenine dinucleotide (NADH) fluorescence increases during spreading depression for at least 5 minutes, particularly away from parenchymal arterioles. However, modeling of tissue oxygen delivery shows that cerebral metabolic rate of oxygen drops more than predicted by a purely supply-limited model, raising the possibility of a concurrent reduction in oxygen demand during spreading depression. Importantly, a subsequent spreading depression triggered within 15 minutes evokes a monophasic flow increase superimposed on the oligemic baseline, which markedly differs from the response to the preceding spreading depression triggered in naive cortex. Altogether, these data suggest that CSD is associated with long-lasting oxygen supply-demand mismatch linked to severe vasoconstriction in mice.
Keywords
Introduction
Cortical spreading depression (CSD) is a wave of neuronal and glial depolarization characterized by transient loss of transmembrane ionic gradients (Leao, 1944). The massive rise in extracellular K+ and glutamate concentrations, usually lasting less than a minute, is believed to be critical for the contiguous spread in gray matter at a rate of ∼3 mm/min. A large body of evidence suggests that CSD is the electrophysiological substrate of migraine aura, and may trigger headache as well (Ayata, 2010). Underscoring the pathophysiological importance of CSD in diverse neurologic disorders, CSD-like depolarization waves have been detected with high frequency in ischemic stroke, trauma and intracranial hemorrhage, and aggravate tissue injury (Dohmen et al, 2008; Dreier et al, 2006; Hashemi et al, 2009; Strong et al, 2007).
In most species, CSD evokes a large hyperemic response coupled to a marked stimulation of oxidative metabolism. In mice, however, CSD causes severe vasoconstriction, during which cerebral blood flow (
Notably, most studies have utilized invasive techniques and instrumentation, such as cranial windows and implanted electrodes for
Materials and methods
The care and handling of the animals and experimental protocols were in accordance with the National Institutes of Health guidelines and approved by the institutional animal care and use committee.
Multispectral Reflectance and Laser Speckle Imaging
General surgical preparation
Wild-type (C57BL/6J,
Imaging system
The multimodal optical imaging system provides simultaneous laser speckle flowmetry and multispectral reflectance imaging as previously described (Ayata et al, 2004a; Dunn et al, 2003; Jones et al, 2008). Laser speckle imaging of
Image analysis
Absolute values of parenchymal
Experimental protocol
After surgical preparation, multimodal optical imaging was started and continued uninterrupted for a total of 30 minutes. After baseline imaging for 2 minutes, a CSD was induced by briefly touching a 1-mm diameter cotton ball soaked in 300 mmol/L KCl solution on the prefrontal cortex through the burr hole, immediately followed by careful saline wash. Fifteen minutes later, this procedure was repeated to trigger a second CSD.
Two-Photon Fluorescence Imaging
For cranial window preparation, mice (C57BL/6J,
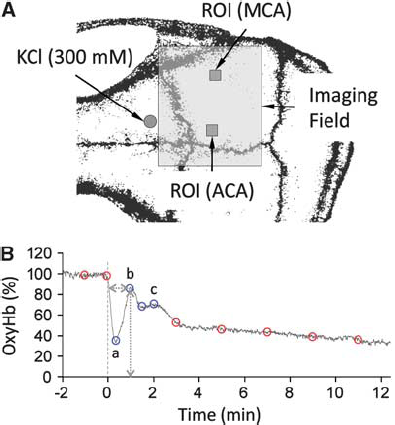
Experimental design. (
Two-photon imaging was performed after intravenous injection of fluorescein isothiocyanate (FITC)-conjugated dextran using a commercial four-channel two-photon microscope (Prairie Technologies, Middleton, WI, USA). A × 20 objective (Olympus XLUMPLFL20XW/IR-SP, 0.95 NA, 2 mm working distance, Center Valley, PA, USA) was used. Images consisting of 512 × 512 pixels were acquired over a field of view of either 466 × 466 μm2 or 233 × 233 μm2 during passage of the CSD. The estimated thickness of the image plane was a few microns. The frame rate was 0.74 frames/s. The laser (Spectra Physics Mai Tai HP, Irvine, CA, USA) wavelength was set to 740 nm to excite both NADH and FITC-conjugated dextran. NADH was detected using a filter with a 460-nm center wavelength and a bandwidth of 50 nm. FITC-dextran was detected using a filter with a 525-nm center wavelength and a bandwidth of 50 nm.
The imaging plane was within 50 μm of the cortical surface, and placed within the MCA—ACA watershed zone. The large diameter of cranial window allowed the imaging field to be placed on either hemisphere. Because CSD never propagates into the contralateral cortex (Eikermann-Haerter et al, 2011), we studied one CSD in each hemisphere in succession. In a subset of mice with normal systemic physiology after the completion of imaging in the second hemisphere, we returned to the first hemisphere and repeated the protocol one more time, always allowing >1 hour between the two CSDs in the same hemisphere.
NADH signal changes were quantified in the capillary bed (ROI at least 50 μm away from large vessels) and in the vicinity of parenchymal penetrating arterioles (ROI within 50 μm of the vessel wall). Relative NADH signal time courses were computed by normalizing the integrated signal at each time point within the ROI to the integrated signal within the ROI averaged over all images before CSD arrival. Both capillary and periarteriolar ROIs avoided any shadows casted by large vessels above the imaging plane, as well as the occasional cortical regions with sharply demarcated high baseline NADH signal; CSD-induced NADH changes in the latter were also measured using separate ROIs. When present in the imaging field, changes in arteriolar diameter were also measured and temporally coregistered with NADH changes. Before display, images were averaged spatially by convolution with a two-dimensional Gaussian kernel with a standard deviation of ∼2.5 μm. Temporal averaging of three consecutive images was used for all movies. For figures (Figures 5 and 6) in the main text, temporal averaging was performed as indicated. For overlaying vasculature on NADH images, a transparency mask was constructed at each time point based on the FITC-dextran fluorescence images. Relative NADH signal change images were obtained by normalizing each NADH image to the average of all images before CSD arrival. Absence of significant brain movement in or out of the imaging plane was confirmed by observing the capillaries.
Statistical Analysis
One- or two-way repeated measures analysis of variance was used to compare the time course of each measured parameter within and between groups. Data are presented as mean±standard error.
Results
Epidural application of KCl onto the frontal cortex triggered a CSD in all mice that propagated throughout the ipsilateral cortex, but never spread to the contralateral hemisphere. In the MCA territory, all measured parameters showed a multiphasic response to CSD (Figures 2 and 3; Supplementary Movies 1 and 2), which started with an abrupt and profound decrease in
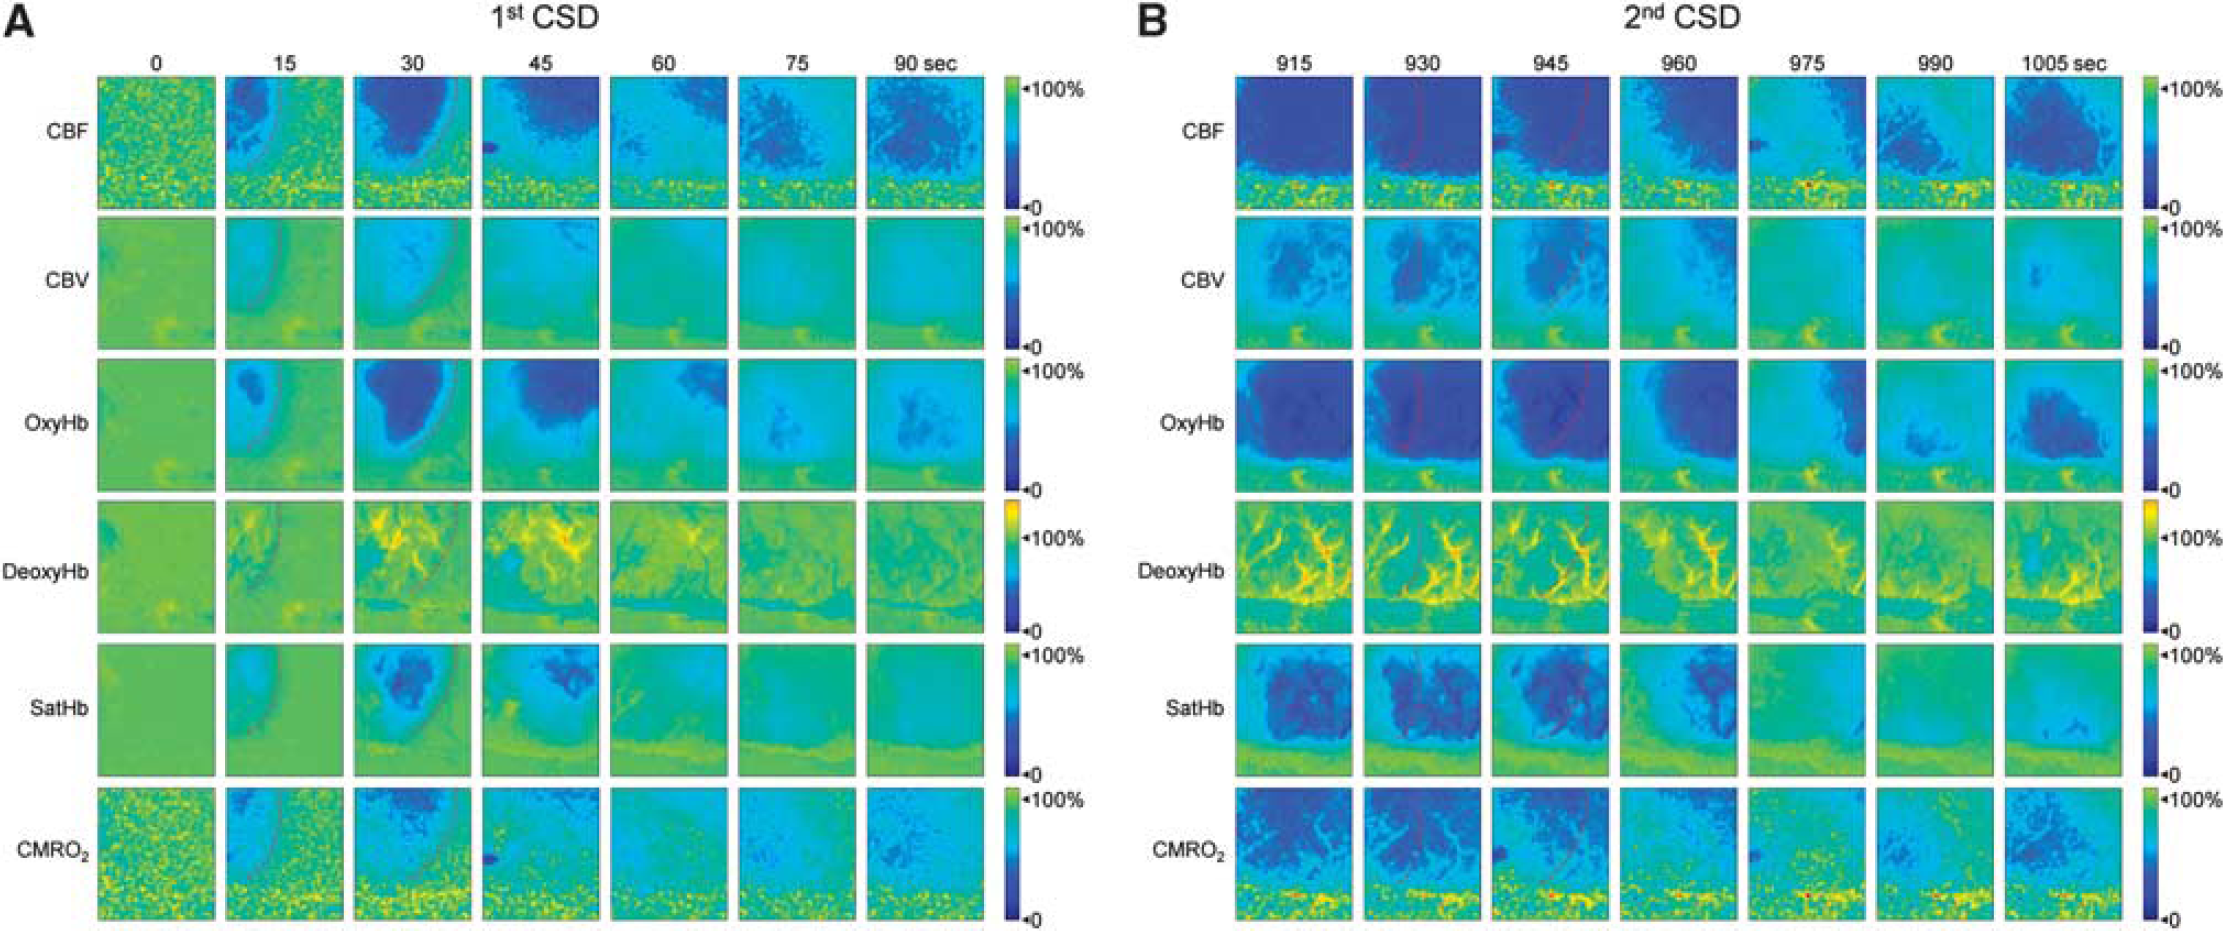
Time-lapse images of hemodynamic and metabolic changes during cortical spreading depression (CSD). Representative images from a female mouse show changes in six measured parameters during two consecutive CSDs 15 minutes apart propagating in anteroposterior direction across the imaging field. The first CSD was associated with multiphasic changes (
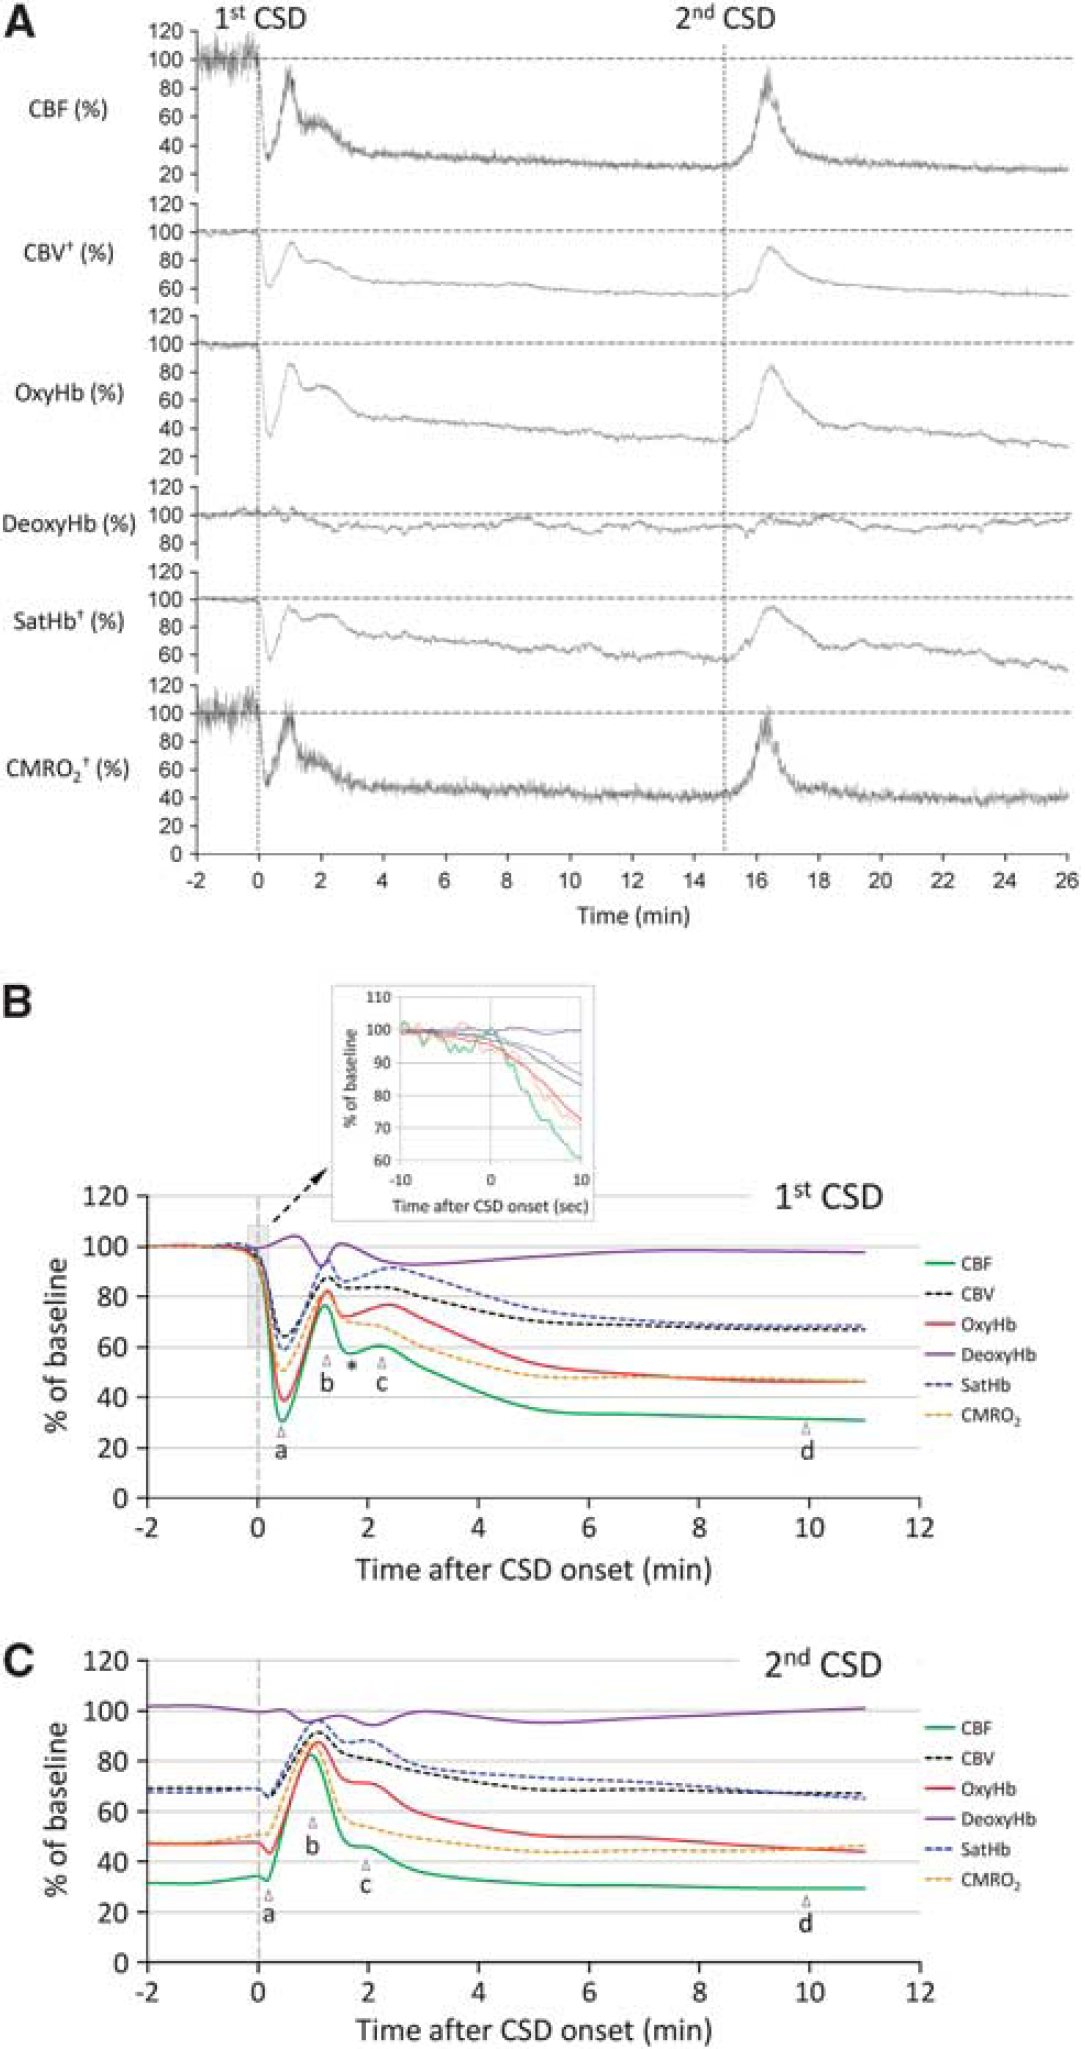
Time course of hemodynamic and metabolic changes during cortical spreading depression (CSD). (
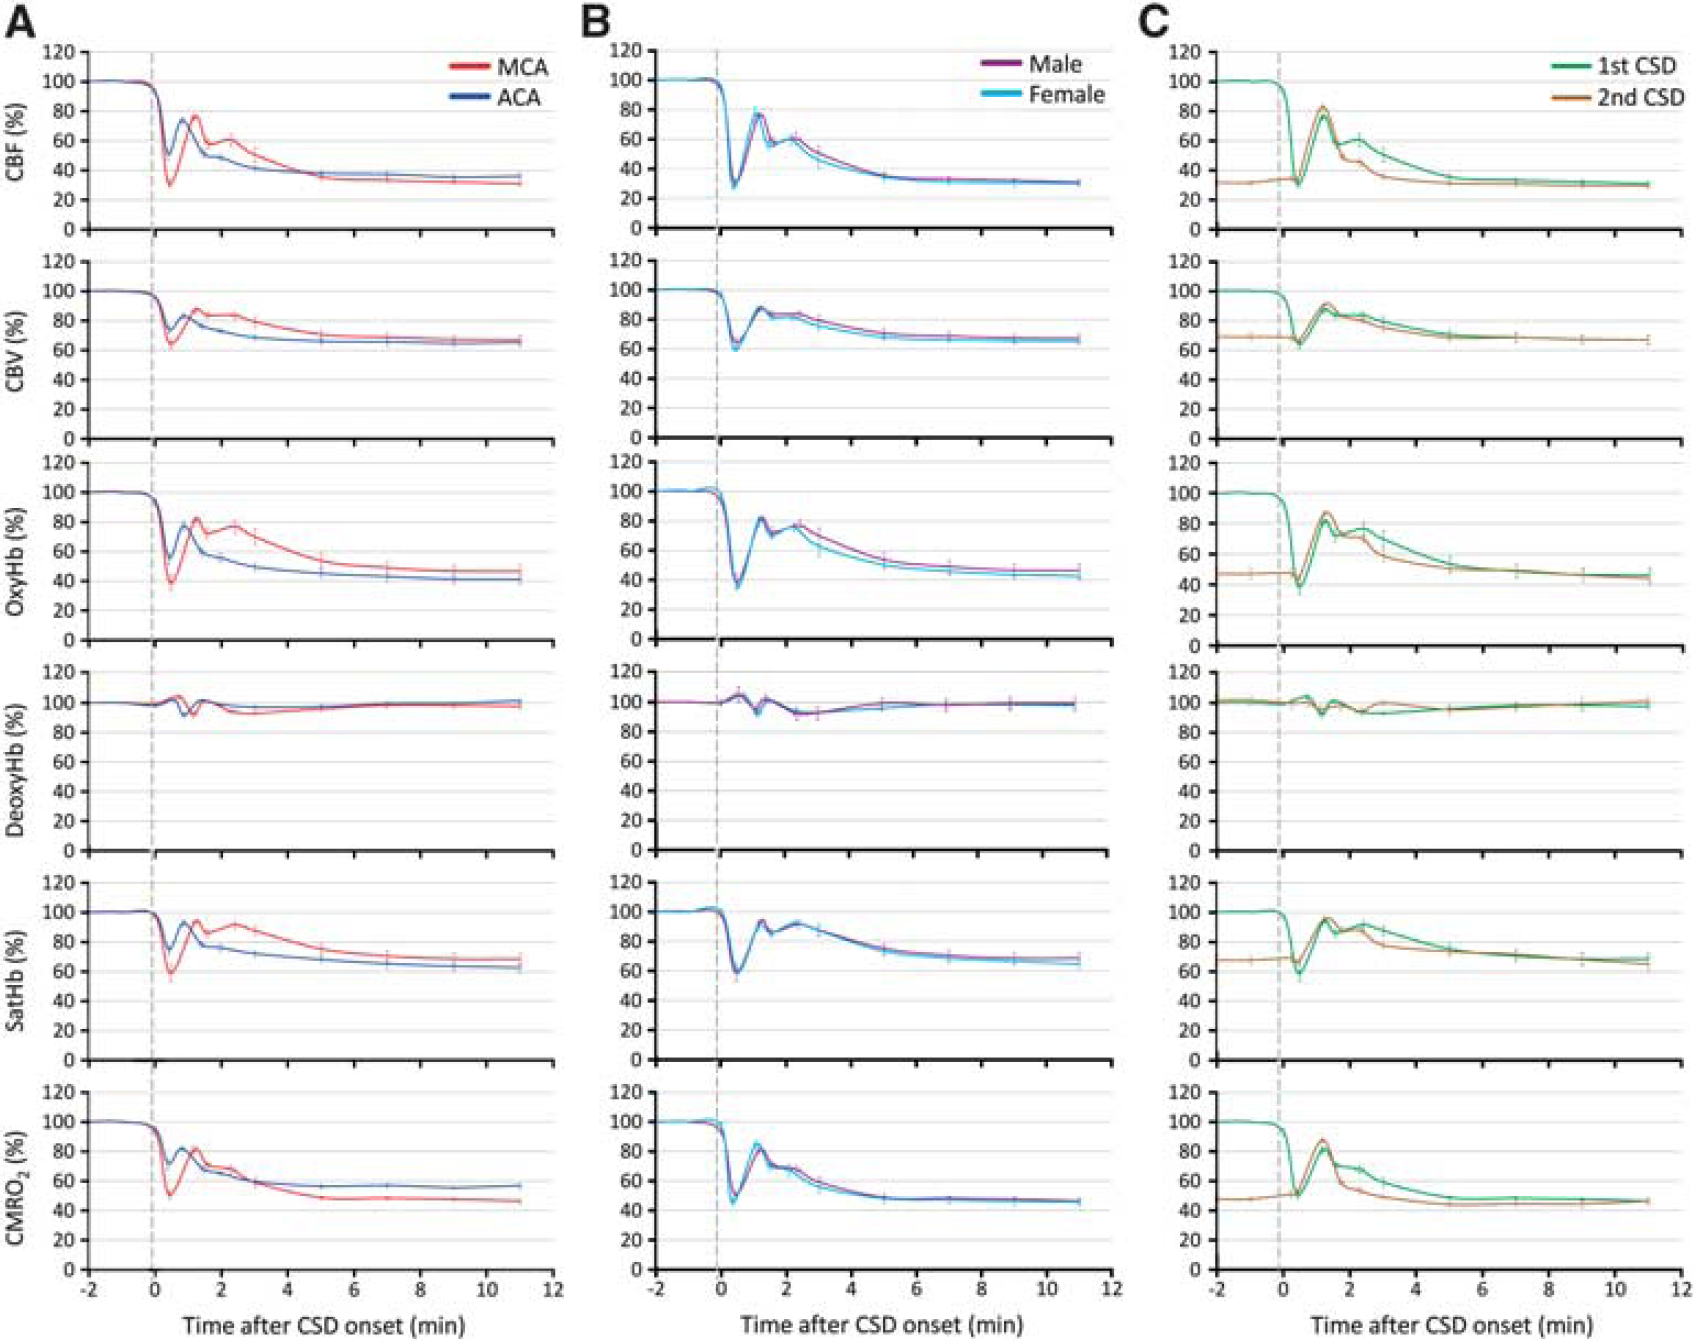
The hemodynamic and metabolic changes during cortical spreading depression (CSD) in different arterial territories, in male and female mice, and in response to a second consecutive CSD. (
The hemodynamic and metabolic response to a second CSD evoked 15 minutes after the first one differed radically from the response to the first CSD, presumably because the response to the second CSD was superimposed on the oligemic phase after the first CSD (Figures 3C and 4C; Supplementary Movies 1 and 2). During the second CSD, all measured parameters except
To obtain further insight into tissue metabolism and oxygenation, we performed cortical NADH fluorescence imaging using two-photon microscopy (Figure 5). The NADH response to CSD differed between the capillary bed and periarteriolar tissue. In the capillary bed, NADH fluorescence abruptly increased to a peak (13%±1% increase), often preceded by an initial small dip (
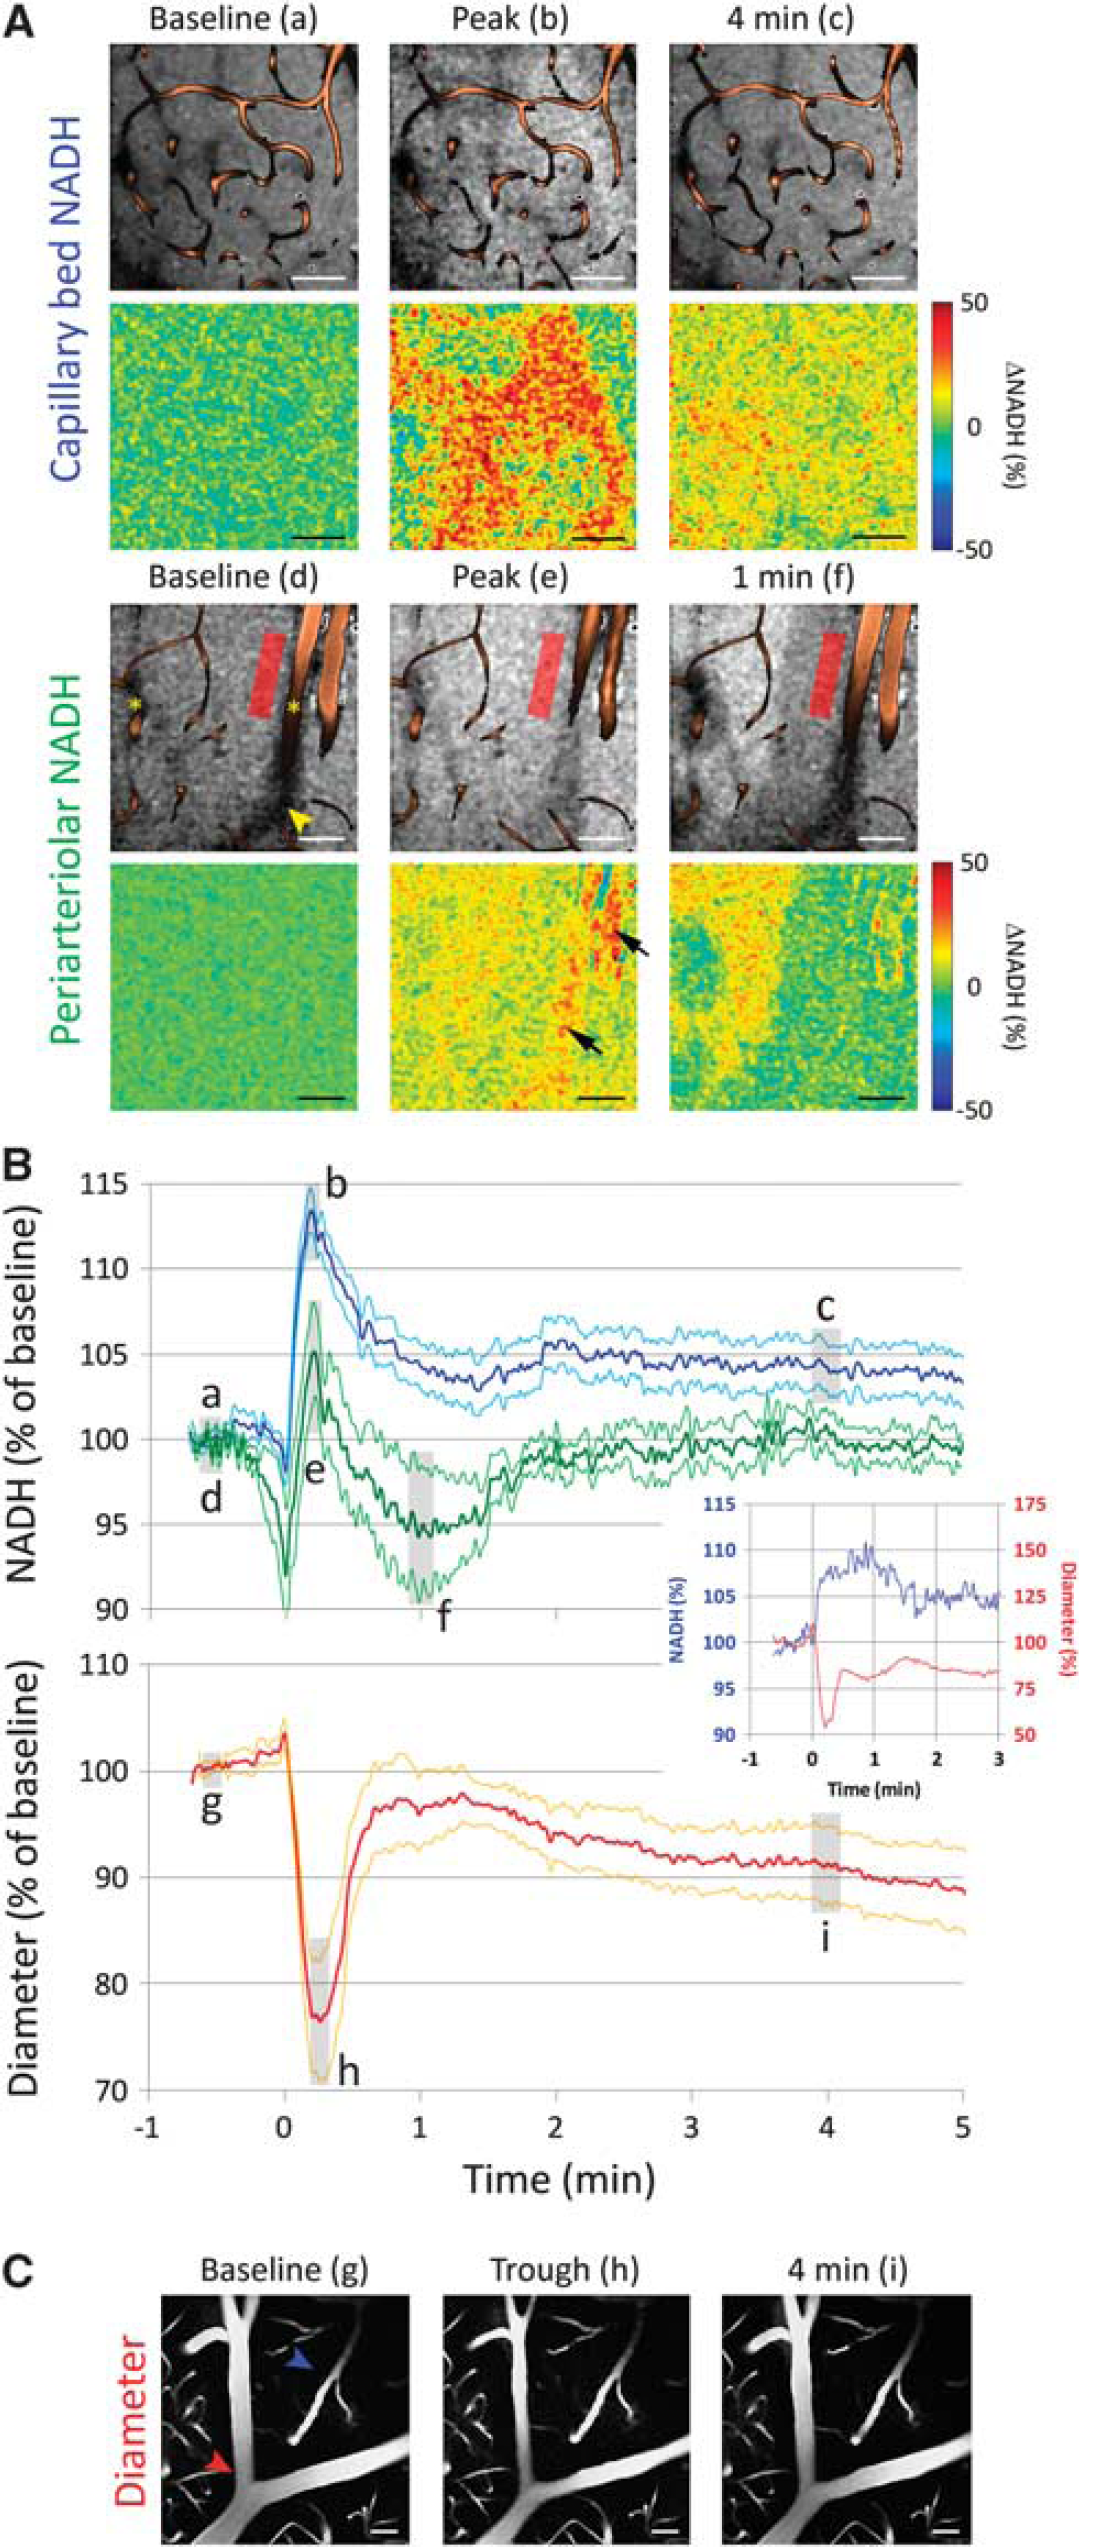
Time course of nicotinamide adenine dinucleotide (NADH) fluorescence and arteriolar diameter changes during cortical spreading depression (CSD) measured by two-photon imaging. (
Of note, we encountered sharply demarcated ‘islets’ of elevated NADH fluorescence at baseline that varied between 50 and 250 μm in longest diameter and showed 33%±9% higher NADH signal than surrounding cortex (Figure 6). These islets resembled the recently described cortical NADH patterns (Kasischke et al, 2010); however, they were present in only 30% of all fields of view studied, and did not show a consistent spatial relationship to nearby arterioles, venules, or capillaries. The predominant response to CSD within these islets was an overall decrease in NADH signal, although the initial dip and subsequent peak were still recognizable (
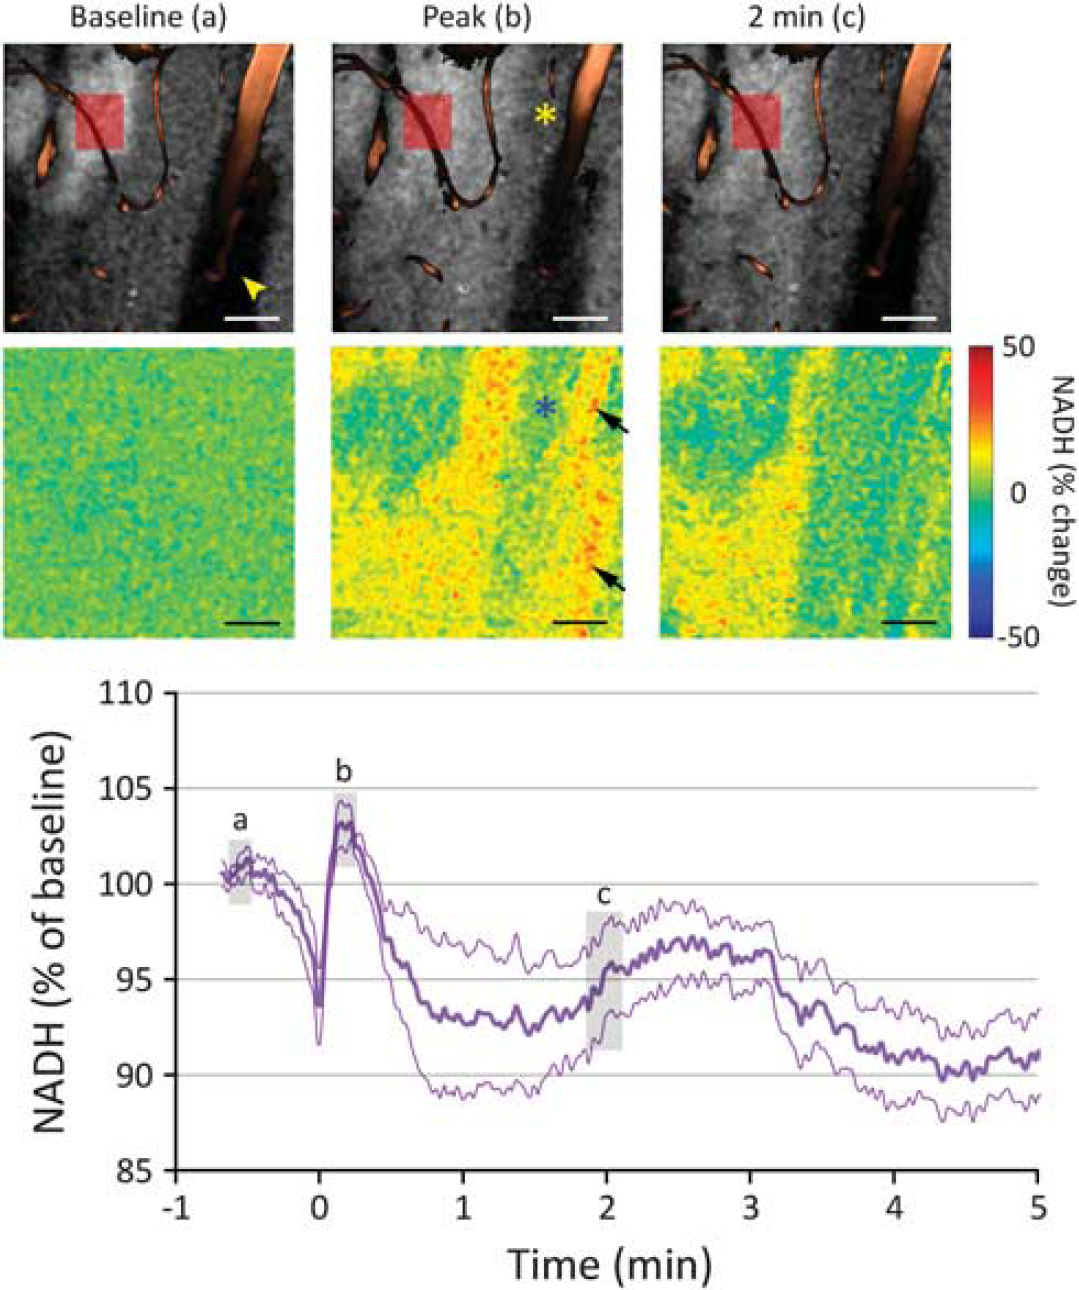
Cortical regions with elevated baseline nicotinamide adenine dinucleotide (NADH) fluorescence. Representative raw NADH images (upper row) show a sharply demarcated ‘islet’ with high baseline fluorescence signal in the vicinity of a cortical arteriole (upper left corner), observed in ∼30% of the cortical fields studied. Arrowhead indicates the shadow of the large vessel above the imaging plane. Relative images (lower row) show that NADH did not significantly increase in these islets during cortical spreading depression (CSD), and the response in periarteriolar tissue (asterisks) was once again muted. The averaged NADH response in these islets with high baseline NADH was triphasic, followed by a persistent decrease in NADH signal after CSD (
Discussion
The profound hypoperfusion response to CSD is characteristic in the mouse and predicts severe tissue hypoxia (Ayata et al, 2004b; Chang et al, 2010). Using simultaneous laser speckle and multispectral reflectance imaging minimally invasively through intact skull, we found an abrupt reduction in
The multispectral data further suggest, however, that the
In most studies, CSD was associated with a transient reduction in
Two-photon excited NADH fluorescence imaging has been used previously as an indicator of cellular redox state (Kasischke et al, 2004). However, the profound cellular and vascular changes occurring during spreading depression, if not properly accounted for, may confound the interpretation of the detected fluorescence signal. First, intracellular organelle swelling and dendritic beading increase tissue scattering during spreading depression (Somjen, 2001). Scattering reduces two-photon excitation at the focal plane (Theer and Denk, 2006), thereby decreasing the amount of detected fluorescence. For this reason, we confined our measurements to within 50 μm of the cortical surface. Nevertheless, we cannot rule out the possibility that the observed initial dip in the NADH response is caused by increased scattering of excitation light accompanying the wave of cell depolarization. Since the duration of cell depolarization is typically <1 minute, we do not expect the relative NADH signal levels minutes after CSD to be confounded by scattering changes. Second, vasoconstriction during CSD reduces both intravascular scattering of excitation light and intravascular absorption of emission light, thereby increasing the amount of detected fluorescence. For this reason, we carefully positioned our imaging planes and ROIs to avoid large vessel shadows. Third, photobleaching and detector noise are possible factors, which may contribute to underestimation of relative changes. For these reasons, we set both the laser power and the detector gain to minimize these effects, and we checked the imaging field of view for possible evidence of bleaching after each CSD. Lastly, while NADH fluorescence changes are generally assumed to reflect mitochondrial NADH dynamics in neurons (Shuttleworth, 2009), we note that NADH fluorescence can represent contributions from multiple species in different cellular compartments with different lifetimes (Chia et al, 2008).
Using
The advantage of the multimodal optical imaging system is the complete temporal and spatial overlap of all measured hemodynamic and metabolic parameters. Previous studies, including the multiparametric electrode/optode assemblies, relied upon multiple single-site measurements presumed to reflect spatiotemporally matched phases of a complex phenomenon. Moreover, the impact of craniectomy and electrode insertion on cortical physiology is of particular concern in mice. This is because mouse cortex is highly susceptible to CSD, making it likely to mechanically evoke accidental CSDs during the craniectomy procedure and electrode insertions. The hemodynamic and metabolic response to the first CSD in naive cortex dramatically differs from the response to subsequent CSDs (Figure 2), in part because subsequent CSDs occur on a background of severe post-CSD oligemia (
In summary, a unique vasoconstrictive response creates a marked O2 supply-demand mismatch during and in the wake of CSD in mice, severely limiting O2 availability for consumption. More work is needed to ascertain whether there is a concurrent reduction in mitochondrial O2 demand during intense neuronal depolarization. The striking differences between mice and other species in the hemodynamic and metabolic response to CSD have pathophysiological implications for the interpretation and extrapolation of data obtained from mice in disease states where CSD-like injury depolarizations occur with high frequency and impact the outcome.
Footnotes
References
Supplementary Material
Please find the following supplemental material available below.
For Open Access articles published under a Creative Commons License, all supplemental material carries the same license as the article it is associated with.
For non-Open Access articles published, all supplemental material carries a non-exclusive license, and permission requests for re-use of supplemental material or any part of supplemental material shall be sent directly to the copyright owner as specified in the copyright notice associated with the article.