
Abstract
Manganese-Enhanced Magnetic Resonance Imaging (MEMRI), 1H and 13C High-Resolution-Magic Angle Spinning (HR-MAS) Spectroscopy, and genomic approaches were used to compare cerebral activation and neuronal and glial oxidative metabolism in ad libitum fed C57BL6/J leptin-deficient, genetically obese ob/ob mice. T1-weighted Magnetic Resonance Images across the hypothalamic Arcuate and the Ventromedial nuclei were acquired kinetically after manganese infusion. Neuroglial compartmentation was investigated in hypothalamic biopsies after intraperitoneal injections of [1-13C]glucose or [2-13C]acetate. Total RNA was extracted to determine the effects of leptin deficiency in the expression of representative genes coding for regulatory enzymes of hypothalamic energy pathways and glutamatergic neurotransmission. Manganese-Enhanced Magnetic Resonance Imaging revealed enhanced cerebral activation in the hypothalamic Arcuate and Ventromedial nuclei of the ob/ob mice. 13C HR-MAS analysis showed increased 13C accumulation in the hypothalamic glutamate and glutamine carbons of ob/ob mice after the administration of [1-13C]glucose, a primarily neuronal substrate. Hypothalamic expression of the genes coding for glucokinase, phosphofructokinase, pyruvate dehydrogenase, and glutamine synthase was not significantly altered while pyruvate kinase expression was slightly upregulated. In conclusion, leptin deficiency associated with obesity led to increased cerebral activation in the hypothalamic Arcuate and Ventromedial nuclei, concomitant with significant increases in neuronal oxidative metabolism and glutamatergic neurotransmission.
Introduction
Obesity is a pandemic syndrome associated with the most prevalent and morbid pathologies in developed countries including heart disease, atherosclerosis, diabetes, and cancer (Das, 2010). The syndrome is thought to arise from disturbances in the highly elaborated mechanisms controlling food intake and energy expenditure involving both systemic and cerebral signalling systems. Body adiposity is currently believed to be regulated systemically through an endocrine ‘adiposity’-negative feedback loop, mainly through the hormones insulin and leptin (Morton et al, 2006). After a meal, increased circulating leptin levels induce an anorexigenic response consisting of a reduction in food intake and an increase in energy expenditure, whereas in fasting periods, decreased plasma levels of leptin promote increased food intake and decreased energy consumption (Coll et al, 2007). Disruptions in the leptin signalling systems are often associated with obesity. For example, obese humans normally present ‘leptin resistance’, a state of reduced responsiveness to plasma leptin, hampering the inhibition of food intake (Lee et al, 2001). Likewise, the leptin-null ob/ob mice exhibit decreased energy expenditure, hyperphagia, and obesity. The administration of exogenous leptin is known to correct the above-mentioned defects in the ob/ob mouse (Pelleymounter et al, 1995).
Abundant evidence indicates that the Central Nervous System is the site for leptin's antiobesity activity, the hypothalamus being the primary cerebral structure supporting leptin performance (Luquet and Magman, 2009). Leptin receptors are expressed at high levels in several hypothalamic regions, mainly in the Arcuate and Ventromedial nuclei both in neurons and in astrocytes (Hakansson et al, 1998; Hsuchou et al, 2009). Indeed by rescuing leptin receptors in the hypothalamus of mice otherwise lacking them, blood glucose and insulin levels are normalized (Coppari et al, 2005). In addition, mice with hypothalamic lesions are resistant to leptin treatment (Koyama et al, 1998). After a meal, leptin released from adipose tissue binds to leptin receptors in the hypothalamus. On leptin binding, the orexigenic neurons releasing neuropeptide Y (NPY) and agouti-related peptide (AgRP) are inhibited and the activity of the anorexigenic neurons expressing pro-opiomelanocortin and the cocaine–amphetamine-regulated transcript is increased (Elmquist et al, 2005). Both orexigenic and anorexigenic neurons project to the Paraventricular nuclei and other hypothalamic sites, to modulate the activity of the melanocortin pathway controlling food intake and energy expenditure (Ghamari-Langroudi et al, 2011).
In addition to the production of orexigenic or anorexigenic neuropeptides, hypothalamic neurons release excitatory and inhibitory amino-acid neurotransmitters as glutamate and gamma-aminobutyric acid (GABA) from glutamate–glutamine and GABA transcellular cycles. However, the neuroglial interactions underlying hypothalamic leptin-dependent activation remain poorly understood. Recently, it was shown that the anorexigenic pro-opiomelanocortin and the orexigenic NPY/AgRP neurons in the Arcuate nucleus of hypothalamus display GABAergic activity (Hentges et al, 2004) whereas other studies indicated that key neurons involved in the regulation of energy balance are glutamatergic and/or densely innervated by glutamatergic nerve terminals (Collin et al, 2003).
A variety of Magnetic Resonance Imaging (MRI) and Magnetic Resonance Spectroscopy methods have been shown recently to provide comprehensive information on cerebral activation and the underlying metabolic coupling mechanisms operating between neurons and glial cells. In particular, Manganese-Enhanced MRI (MEMRI) approaches have revealed the activation of individual hypothalamic nuclei through the localized increased intensity of T1-weighted MRI (Kuo et al, 2007). Similarly, 13C Nuclear Magnetic Resonance investigations of the cerebral metabolism of [1-13C]glucose or [2-13C]acetate contributed comprehensive information on the operation of the neuronal and glial tricarboxylic acid (TCA) cycles and the transcellular exchanges of glutamate–glutamine or GABA between neurons and glia of the whole brain (Gruetter et al, 2002; Garcia-Espinosa et al, 2004). More recently, we showed that it is possible to improve the spatial resolution and investigate directly hypothalamic metabolism using 13C High-Resolution-Magic Angle Spinning (HR-MAS), a novel technique yielding high quality spectra from very small hypothalamic biopsies (Violante et al, 2009).
On these grounds, we investigate here the substrate dependence and neuroglial compartmentation underlying hypothalamic function in control and leptin-deficient, genetically obese ob/ob mice, combining the use of MEMRI and 13C HR-MAS. Our results show that leptin deficiency is associated with an increased cerebral activation in the hypothalamic Arcuate and Ventromedial nuclei, as well as with enhanced hypothalamic neuronal oxidative capacity and glutamatergic neurotransmission. These changes do not appear to involve pleiotropic effects of leptin deficiency on gene expression of regulatory enzymes from energy metabolism or glutamatergic neurotransmission, reflecting mainly a relatively enhanced activity of NPY/AgRP hypothalamic pathway in leptin-deficient animals.
Materials and methods
Animals and Research Design
Experimental design and protocols were approved by the Institutional Animal Care and Use Committee and met the guidelines of the appropriate government agency. Male control C57BL6/J and leptin-deficient B6.V-Lep ob /J ob/ob mice (8- to 12-weeks old) were obtained from the Jackson Laboratories (Bar Harbor, ME, USA). Animals were housed under constant temperature (22°C to 25°C) and maintained on a 12-hour light/dark cycle with ad libitum access to standard chow food and water.
In the morning of the study, blood glucose levels were assessed using a standard glucometer. Plasma insulin or leptin levels were determined using commercially available ELISA kits (Millipore Corporation, Billerica, MA, USA or LINCO Research, St Charles, MO, USA). Brain volumes were determined in each animal from quantitative volumetry studies of T1-weighted MRI sections as described below.
The effects of leptin deficiency on hypothalamic function were assessed noninvasively, after the hypothalamic uptake of infused manganese (II) chloride (MnCl2) (Sigma-Aldrich, St Louis, MO, USA) by T1-weighted MRI in control (n=6) and ob/ob (n=5) mice fed ad libitum. Anesthesia was induced with a mixture of oxygen/isofluorane (96/4%) and maintained by administering oxygen/isofluorane (99/1%). Anesthetized animals received a 30-minute constant (0.2 mL/h) infusion of 0.033 mmol/kg body weight of MnCl2 in the tail vein, a nontoxic dose (Silva et al, 2004). Manganese (Mn2+) infusion was started after two initial baseline acquisitions, after manganese accumulation in the hypothalamus by successive T1-weighted MRI acquisitions for a total experimental time ∼2 hours.
13C HR-MAS studies were performed in a parallel cohort of animals. In these experiments, control (n=10) and ob/ob (n=9) mice, fed ad libitum, received either an intraperitoneal saline injection of [1-13C]glucose (20 μmol/g body weight, 99.9% 13C, Cambridge Isotope Laboratories, Andover, MA, USA) or [2-13C]acetate (60 μmol/g body weight, 99% 13C, Cambridge Isotope Laboratories). Fifteen minutes after, cerebral metabolism in animals under terminal anesthetic was arrested within 0.8 seconds using a high-power (5 kW) microwave fixation system (TMW-6402C, Muromachi Kikai Co. Ltd., Tokyo, Japan). The hypothalamic region was dissected from the fixed brains and kept frozen at −80°C until 1H and 13C HR-MAS spectroscopy analysis.
Finally, to investigate the genetic basis of the observed effects we prepared biopsies from the hypothalamus of ad libitum fed control (n=4) and ob/ob (n=5) mice and determined the expression of genes involved in the regulation of the glycolysis or TCA and glutamate–glutamine cycles.
Magnetic Resonance Imaging
We used T1-weighted MRI to monitor kinetically Mn2+ accumulation under high-spatial resolution conditions and T2-weighted MRI to determine total cerebral volume in vivo. Magnetic Resonance Imaging was performed using a 7.0-T horizontal-bore (160 mm) superconducting magnet (PharmaScan, Bruker BioSpin Gmbh, Ettlingen, Germany) equipped with a 1H selective birdcage resonator of 38 mm. Spin-echo multi-slice T1-weighted imaging of sagittal sections across the mouse brain (field of view 22 mm, 256 × 256 matrix size, 1 mm slice thickness, 5 slices, 85 μ2 in plane resolution) was acquired successively using repetition time=500 ms, echo time=11.8 ms and three averages, resulting in a total acquisition time of 6 minutes 24 seconds for each scan. In each scan, regions of interest corresponding to the hypothalamic Arcuate and Ventromedial nuclei, and the fourth ventricle were selected and analyzed, after alignment and regionalization with a standard mouse brain atlas (Paxinos and Franklin, 2001). Signal intensity changes, were assessed using a standard image-processing software (NIH ImageJ 1.37v, http://rsbweb.nih.gov/ij/index.html), normalizing the values of each animal to those obtained before Mn2+ infusion. T2-weighted MRI axial images were acquired under identical resolution conditions with repetition time=3,000 ms, echo time=60 ms and three averages. T2 sections swept the entire mouse brain and cerebral areas in each slice were quantified by using the freely accessible Image-processing software (NIH ImageJ 1.37v). The brain volume of each slice was obtained by multiplying the MRI determined brain area by the slice thickness, the sum of all slices providing the brain volume.
1H and 13C High-Resolution-Magic Angle Spinning Magnetic Resonance Spectroscopy
1H and 13C HR-MAS spectra were acquired at 11.7 T with a Bruker AVANCE wide bore spectrometer equipped with a magic angle spinning accessory (Bruker Biospin, Rheinstetten, Germany). Biopsies from the hypothalamus were placed in 50 μL HR-MAS Zirconium Oxide rotors, transferred to the HR-MAS probe and spun at 4 kHz (277 K). 1H-decoupled 13C HR-MAS spectra were acquired using a pulse-acquire sequence with WALTZ-16 1H decoupling applied during the acquisition and relaxation delay periods. Conditions were π/4 pulse width, 64 k data points acquired in 8 k scans with 5 seconds recycle delay with a total acquisition time ∼16 hours. The chemical shifts of the 13C resonances were referred to those of the lactate C3 peak (21.9 parts per million (p.p.m.)) in the glucose infusion experiments or to the acetate C2 peak (24.5 p.p.m.) in the acetate infusion experiments. Spectral deconvolution was performed using a PC-based Nuclear Magnetic Resonance analysis program, NUTS (Acorn, Freemont, CA, USA). 1H HR-MAS spectra were acquired at the beginning and after the overnight 13C acquisition for quantification of total metabolite concentrations and verification of sample stability. Acquisition parameters for the 1H HR-MAS sequence were 5 seconds water presaturation, echo time=144 ms, τ=1 ms, n=100, 10 kHz spectral width, 32 k data points, and 128 scans. Total metabolite concentrations were quantified by using a modified version of the LCModel processing software programme (Linear Combination of Model Spectra, http://s-provencher.com/pages/schtm; Provencher, 1993) with a customized set of spectra from cerebral metabolites (Righi et al, 2009).
Gene Expression Assays
Total RNA was prepared from hypothalamic biopsies using the RNAspin Mini RNA Isolation kit (Amersham Biosciences, GE Healthcare, Piscataway, NJ, USA) and retrotranscribed to cDNA using the high capacity cDNA reverse transcription kit (Applied Biosystems, Foster City, CA, USA). The expression of the genes for the main enzymes regulating glycolysis, TCA cycle, and glutamate–glutamine cycling was assayed by Real-Time PCR (RT-PCR) assays using the individual probes for each gene commercialized as TaqMan1 (Applied Biosystems). The following genes (gene symbol, TaqMan1 probe) were investigated: GCK, Glucokinase (mCG21380, Mn00439129_m1); PFK, Phosphofructokinase (mCG8414, Mm00445461_m1); PDH, Pyruvate Dehydrogenase (mCG14551, Mm00468675_m1); PK, Pyruvate Kinase (mCG17567, Mm00443090_m1); and GS, Glutamate-ammonia Ligase or Glutamine Synthetase (mCG20133, Mm00725701_s1).
Statistical Analysis
Results are shown as mean±s.e.m. and unpaired Student's t-test or two-way analysis of variance was used to compare control and ob/ob mice. Comparisons with P<0.05 were considered statistically significant.
Results
Physiological and Endocrine Variables
Ob/ob mice are obese when compared with control animals (53±1 versus 26±1 g, P<0.01). As expected, in the fed state, ob/ob mice glycemia was slightly lower than in controls (9.7±0.6 versus 12.5±0.8 mmol/L, P<0.05) (probably reflecting the hyperinsulinemia observed, 7.7±1.6 versus 0.6±0.2 ng/mL, P<0.01, in agreement with previous results; Hinoi et al, 2008). Elevated blood glucose levels detected in either ob/ob or control mice reflect the fact that animals were under heavy anesthesia. After overnight feeding, leptin secretion was virtually undetectable in ob/ob mice relative to control animals (0.1±0.1 versus 2.5±1.0 ng/mL, P<0.05). Analysis of T2-weighted MRI scans (data not shown) revealed that the cerebral volume was significantly reduced in the ob/ob mice relative to their counterpart controls (428±18 versus 475±7 mm3, P<0.05), in agreement with a recent report where obesity was associated with detectable brain volume deficits in cognitively normal elderly subjects (Raji et al, 2009).
Manganese-Enhanced Magnetic Resonance Imaging of Leptin Deficiency
Figure 1 shows a representative T1-weighted image of the mouse brain after Mn2+ uptake (upper panel) and the time course of normalized signal intensity changes in the hypothalamic Arcuate and Ventromedial nuclei as well as in the fourth ventricle of control and ob/ob mice during Mn2+ infusion (lower panel), localized as described in Materials and methods. The enhancement of signal intensity in the forth ventricle (V4) was similar in both groups of animals. However, normalized signal intensities in the hypothalamic Arcuate (Arc) and Ventromedial (VMH) nuclei during Mn2+ infusion were consistently higher in the ob/ob mice than in the controls. The average five-fold increase in MEMRI signal observed in the nuclei of leptin-deficient animals is consistent with significantly enhanced hypothalamic activation.
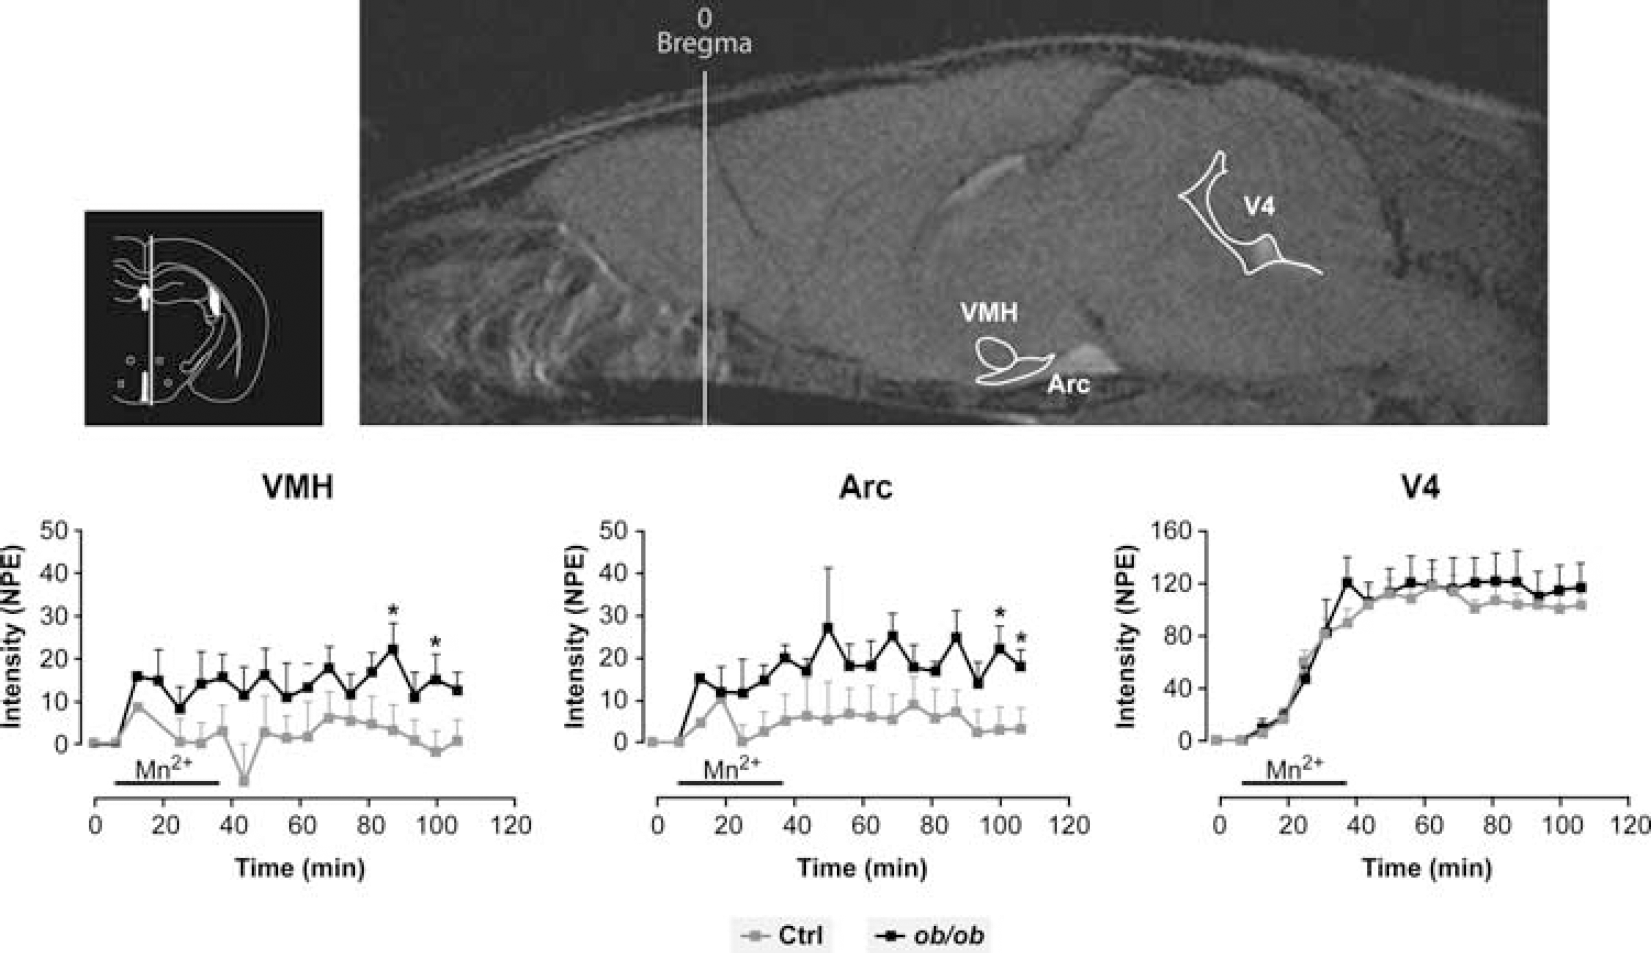
Representative T1-weighted image of the mouse brain (sagittal section) after intravenous infusion of Manganese (Mn2+) in a control mouse (upper panel). A coronal section of the area of interest is also represented in the upper left insert. The change in normalized signal intensities with time is shown in the lower panels for the hypothalamic Arcuate nucleus (Arc), hypothalamic Ventromedial nucleus (VMH) and the forth ventricle (V4) in ob/ob mice, n=5 (black squares) and in control animals, n=6 (gray squares). Data are shown as average±s.e.m., ∗P<0.05 relative to controls.
Glutamatergic and GABAergic Neurotransmission Under Leptin Deficiency
1H HR-MAS spectra from representative hypothalamic tissue biopsies after [1-13C]glucose or [2-13C]acetate administration are illustrated in Figures 2A and 2B, respectively. Comparisons between the 1H spectra acquired before and after each 13C spectrum (not shown) showed that samples did not suffer significant degradation during the ∼16-hour acquisition period necessary to obtain the 13C HR-MAS spectra (Violante et al, 2009). Hypothalamic metabolite concentrations for control and ob/ob mice (relative to N-acetyl aspartate), after the administration either of [1-13C]glucose or of [2-13C]acetate are presented in Figure 3. After the administration of [1-13C]glucose, ob//ob mice showed reduced hypothalamic glucose concentrations relative to control animals whereas the relative concentrations of GABA, glutamate, and glutamine were similar in both groups. After the intraperitoneal injection of [2-13C]acetate, no significant differences were observed between hypothalamic metabolite concentrations of control and ob/ob mice. However, in control animals the hypothalamic myo-inositol concentrations were lower than those determined in the animals receiving [1-13C]glucose infusions and did not change appreciably after the [2-13C]acetate infusion.
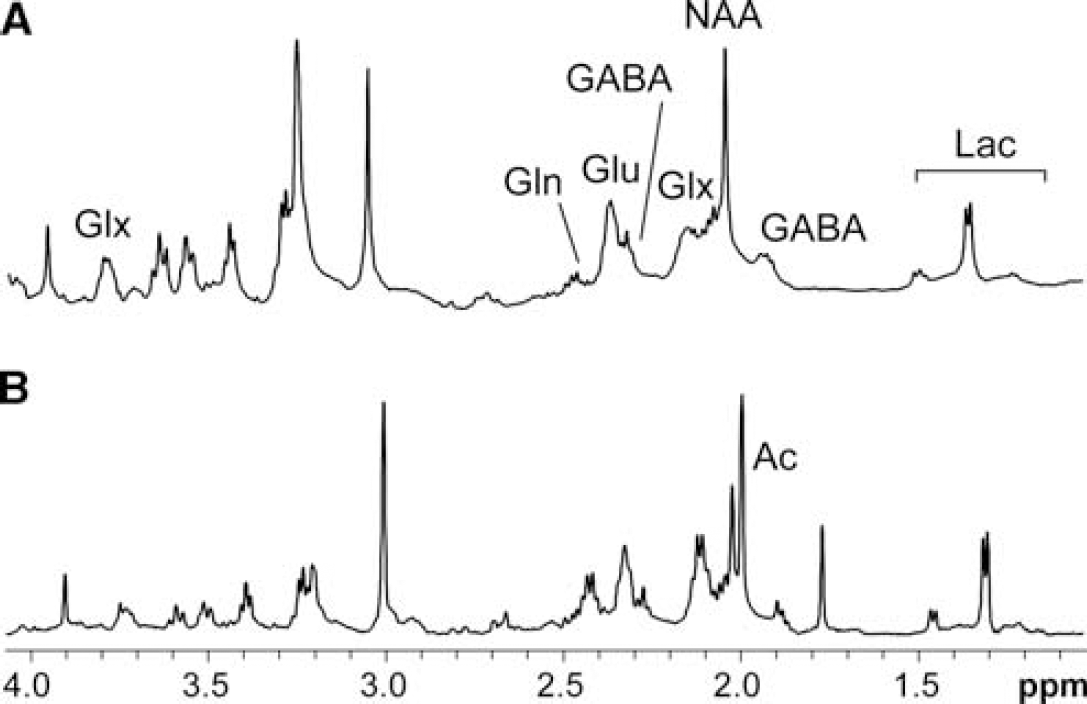
1H High-Resolution-Magic Angle Spinning (HR-MAS) spectra (500 MHz, 277 K, 4 KHz) from representative hypothalamic tissue biopsies of a control mouse after (
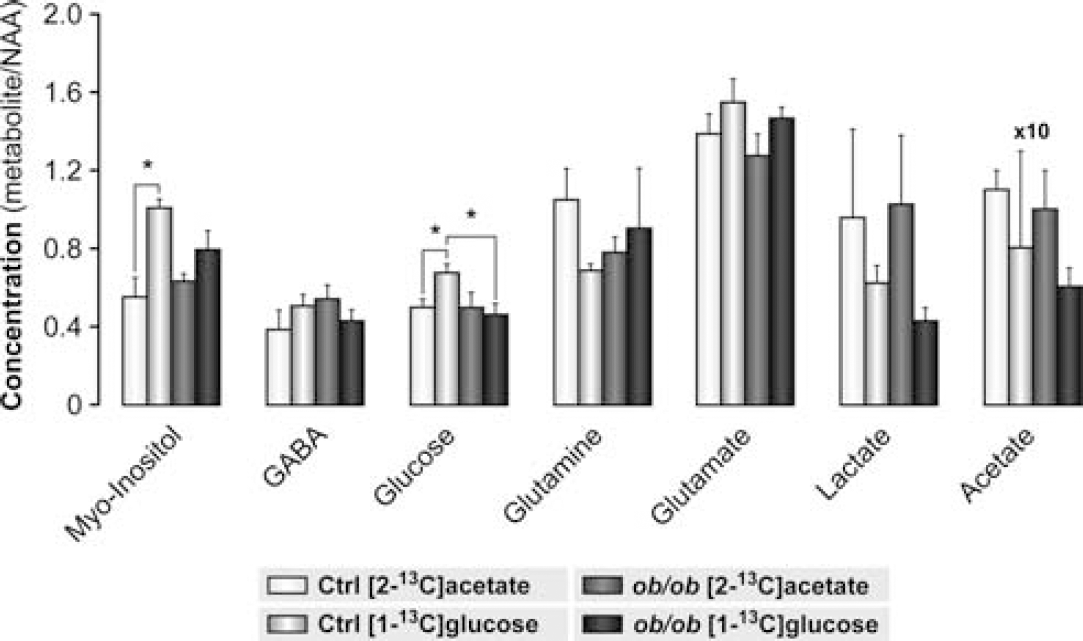
Relative concentrations of acetate, gamma-aminobutyric acid (GABA), glucose, glutamine, glutamate, lactate, and myo-inositol with respect to N-acetyl aspartate (NAA) in the hypothalamus of control and ob/ob mice after the administration of either [1-13C]glucose or [2-13C]acetate. Data are represented as average±s.e.m., ∗P<0.05 is indicated. White columns correspond to controls infused with [2-13C]acetate (n=5), light gray columns to controls infused with [1-13C]glucose (n=5), gray columns to ob/ob mice infused with [2-13C]acetate (n=4), and finally dark gray columns to ob/ob mice infused with [1-13C]glucose (n=5). Acetate/NAA ratios are shown multiplied by 10.
Representative 13C HR-MAS spectra from hypothalamic biopsies after [1-13C]glucose or [2-13C]acetate administration are depicted in Figures 4A and 4B, respectively. In the experiments with [1-13C] glucose, the areas of 13C HR-MAS resonances were normalized to the area of the myo-inositol (mI) C1, C3 (73.2 p.p.m.) resonance (Cerdán et al, 1985). The incorporation of 13C from the labelled precursor in the different 13C HR-MAS detectable carbons revealed that [1-13C]glucose and [2-13C]acetate were efficiently used as energy substrates in the hypothalamus of both types of animals. Moreover, the different labelling patterns observed in the hypothalamus parallel those previously described in the whole brain, with higher 13C labelling obtained after the [1-13C]glucose infusions (Cerdán et al, 1990; Chapa et al, 2000). The lower incorporation detected after [2-13C]acetate administration reflects the smaller incorporation of 13C label from labelled acetate into hypothalamic metabolites, suggesting a relatively lower contribution of oxidative glial metabolism to hypothalamic labelling.
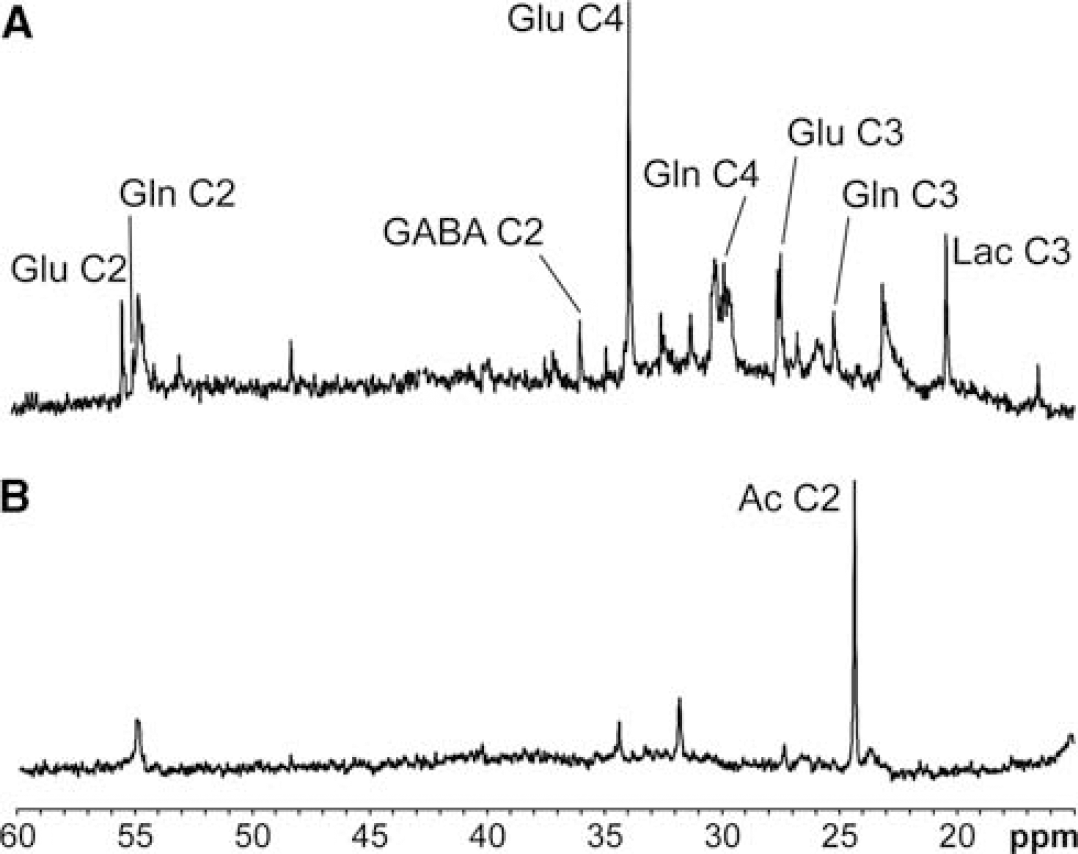
13C High-Resolution-Magic Angle Spinning (HR-MAS) spectra (125 MHz, 277 K, 4 KHz rotation) from representative hypothalamic biopsies of a control mouse after (
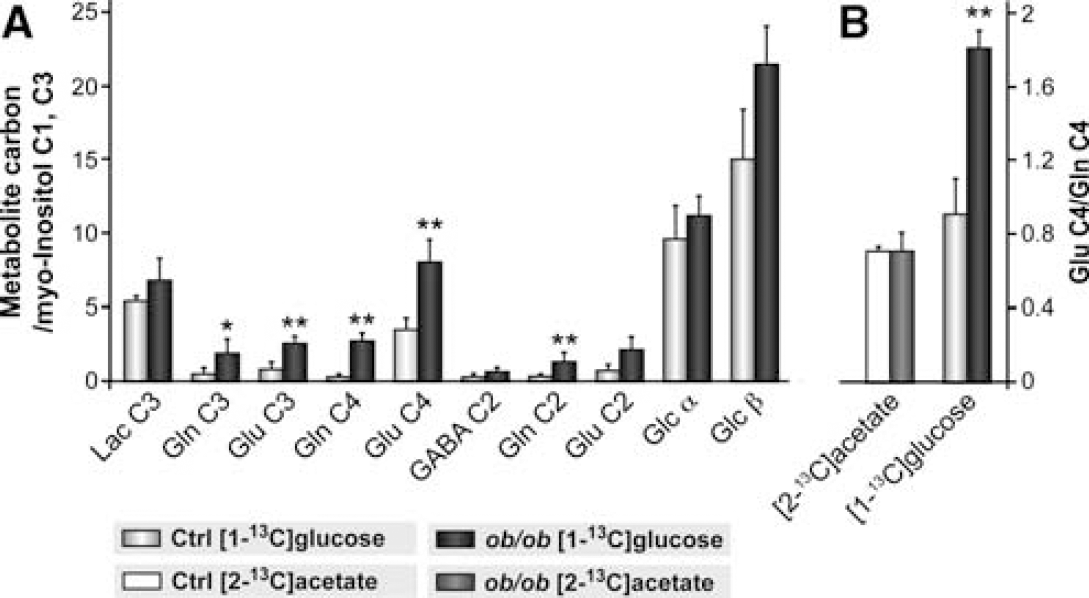
Figure 5 compares 13C incorporation from [1-13C]glucose or [2-13C]acetate in individual carbons of metabolites from the hypothalamus of control and ob/ob mice. In Figure 5A, the administration of [1-13C]glucose resulted in significantly increased 13C incorporation (ca. three-fold) in glutamate and glutamine carbons of ob/ob mice without a concomitant increase in the total concentration of these metabolites (see Figure 3). This suggests that the leptin-null ob/ob mice depict net increases in neuronal oxidative capacity and glutamatergic neurotransmission together with elevated glutamate–glutamine cycling. Since the cerebral glucose concentration decreases slightly in ob/ob animals (Figure 3) and its 13C content increases (Figure 5A), the large increases in neuronal oxidative capacity and glutamine cycling reported here, may include a small contribution derived from increased 13C enrichment in the cerebral glucose precursor. With labelled acetate, the smaller concentrations of myo-inositol in control and ob/ob mice (Figure 3), made the natural abundance myo-inositol C1,C3 13C resonances not detectable in these animals, precluding their absolute quantification. As described for the whole brain, the glutamate/glutamine labelling ratio was higher with [1-13C]glucose as substrate and smaller with [2-13C]acetate as substrate (Figure 5B), a similar metabolic compartmentation effect to that described in the whole brain (Cerdán et al, 1990; Chapa et al, 2000). No significant difference in the glutamate C4/glutamine C4 ratio of control and ob/ob mice infused with [2-13C]acetate was measured while a significant increase in the glutamate C4/glutamine C4 ratio was detected, as expected, in the [1-13C]glucose-infused animals. These findings suggest that glial oxidative metabolism and the glutamine cycle are not significantly modified during leptin-dependent hypothalamic appetite regulation in the [2-13C]acetate-infused animals. Taken together, our results disclose a significantly increased neuronal oxidative capacity and glutamate–glutamine cycling in the hypothalamus of ob/ob mice.
(
Gene Expression Studies in Control and ob/ob Mice Hypothalamus
To investigate if the metabolic and glutamate–glutamine cycling differences observed between control and ob/ob mice were due to genetic determinants, we investigated the expression of the genes coding for the main regulatory enzymes of energy metabolism including glycolysis, the TCA cycle, and glutamateric neurotransmission in ob/ob mice relative to controls. In particular, we assayed the expression of GCK, PFK, PDH, PK, and GS (Figure 6).
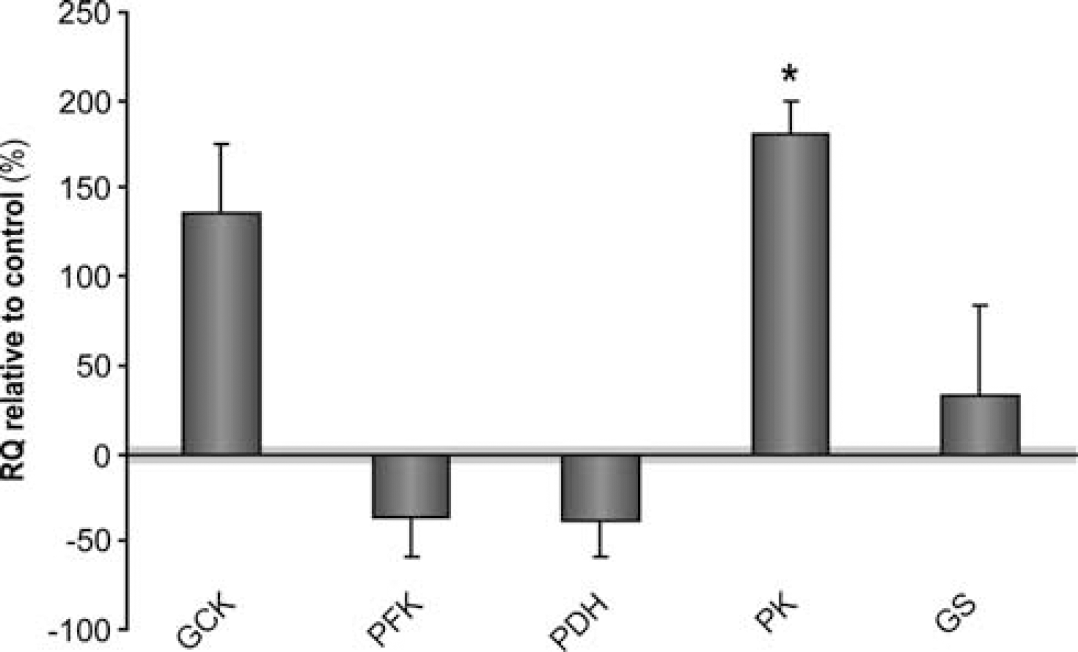
Relative expression of the genes coding for the main regulatory enzymes of glycolysis, tricarboxylic acid (TCA) cycle metabolism, and glutamate–glutamine cycling, in ob/ob mice (n=5) (dark gray columns) relative to controls (n=4). Data are represented as average±s.e.m. and ∗P<0.05 is indicated. GCK, glucokinase; PFK, phosphofructokinase; PDH, pyruvate dehydrogenase; PK, pyruvate kinase; and GS, glutamate-ammonia ligase (glutamine synthetase).
No significant differences were observed in the bulk expression of the main regulatory enzymes of glycolysis (GCK and PFK) and glutamate–glutamine cycle (GS). However, gene expression of PK was significantly upregulated in the ob/ob mice hypothalamus.
Discussion
In the fed state, leptin is secreted from adipose tissue and binds to the hypothalamic leptin receptor inhibiting appetite. In the leptin-deficient ob/ob mice, hypothalamic leptin signalling is drastically reduced and hyperphagia develops leading to obesity. In this study, MEMRI was used to compare hypothalamic activation in ad libitum fed control and in the obese leptin-deficient ob/ob mice. It is a valuable tool for assessing noninvasively regions of cerebral activity since it combines two important properties of manganese: (1) as an indicator of calcium (Ca2+) influx entering the neurons during activation and (2) as a paramagnetic label, its intracellular accumulation yielding positive MRI contrast in activated areas (Silva et al, 2004). Calcium is an essential second messenger necessary for brain function as neuronal depolarization leads to a rise in intracellular Ca2+ levels derived from increased transport across the plasma membrane through ligand-gated or voltage-gated Ca2+ channels. Intracellular Ca2+ rise is essential for neurotransmitter release involved in neuronal signal transduction (Nicholls et al, 1992). Since Mn2+ competes effectively with Ca2+ transport, the MEMRI signal detected is thought to reflect increased Ca2+ uptake during cerebral activation and can be used to interrogate whole-brain neuronal tracts (Chuang and Koretsky, 2006). Indeed, MEMRI was previously used successfully to investigate alterations of cerebral activity in key appetite-regulatory regions of the hypothalamus after peripheral injection of orexigenic or anorexigenic peptides in healthy control mice (Kuo et al, 2007). Our results show increased Mn2+ accumulation concomitant with enhanced cerebral activity in the hypothalamic Arcuate and Ventromedial nuclei of the leptin-null obese ob/ob mice as compared with controls. It is well known that homeostatic levels of leptin inhibit the orexigenic NPY/AgRP neurons and stimulate the anorexigenic neurons expressing pro-opiomelanocortin and cocaine–amphetamine-regulated transcript in the hypothalamic Arcuate nucleus (Elmquist et al, 2005). On fasting, reduced circulating leptin levels release the inhibition of the NPY/AgRP neurons, resulting in increased orexigenic activity (Takahashi and Cone, 2005). In the leptin-deficient ob/ob mice, the inhibition of NPY/AgRP neurons is almost completely eliminated, driving the orexigenic response even higher. This is supported by previous results where a higher excitatory tone onto NPY neurons and a marked net increase in inhibitory tone onto the pro-opiomelanocortin neurons was observed in hypothalamic Arcuate nucleus slices of the ob/ob mice (Pinto et al, 2004). In contrast with the hypothalamic Arcuate nucleus, the hypothalamic Ventromedial nucleus does not produce large amounts of orexigenic or anorexigenic neuropeptides. However, a vesicular glutamate transporter protein, a marker for glutamatergic neurons, is expressed in the vast majority of these neurons suggesting that glutamate, most probably through glutamate/glutamine neuroglial cycling, may have an important role integrating the metabolic information in the hypothalamic Ventromedial nucleus (Collin et al, 2003). Early studies on the regulation of appetite and obesity emphasized the role of peptide hormones, neuropeptides, and monoamines acting on membrane receptors to trigger intracellular signalling cascades, with relatively little attention dedicated to the role of amino-acid neurotransmission and associated neuroglial interactions (Morton et al, 2006). The view that amino-acid neurotransmitters are present in key hypothalamic neurons that regulate appetite and energy status modified this perception (Meister, 2007). In vivo and in vitro1H and 13C Nuclear Magnetic Resonance approaches have been successfully used in the study of neurotransmitter metabolism and the associated neuroglial interactions during sensory or motor activation (Sappery-Marinier et al, 1992; Hyder et al, 1996). However, the relatively large voxel size used in the acquisition of in vivo13C Magnetic Resonance spectra precludes its use for studying the relatively small appetite-controlling hypothalamic area of small rodents. Likewise, the relatively large amounts of cerebral tissue needed to prepare brain extracts for high-resolution 13C Nuclear Magnetic Resonance constituted an important limitation. Recently, a new methodology combining 13C labelled substrates with 13C HR-MAS Spectroscopy was proposed to provide further insights into hypothalamic neurotransmitter metabolism (Violante et al, 2009). 13C HR-MAS Spectroscopy offers the advantage of providing information on cerebral metabolic pathways by allowing for the use of high-resolution spectroscopy in smaller tissue biopsies.
13C HR-MAS Spectroscopy analysis indicates that the leptin-dependent hypothalamic activation involves mainly increases in neuronal oxidation and glutamatergic neurotransmission. Indeed, it has been previously reported that the injection of glutamate in the hypothalamus rapidly elicits an intense feeding response in satiated healthy rats (Stanley et al, 1993). In contrast with other cerebral activation paradigms (e.g., motor and sensorial) where increased glycolytic responses are observed as lactate increases (Ueki et al, 1988), the neuronal oxidative response appears to be predominant in leptin-dependent appetite regulation. Increased neuronal oxidative metabolism in ob/ob mice involves necessarily increased neuronal pyruvate availability, consistent with the bulk PK gene upregulation as measured by RT-PCR. Hypothalamic PK expression appears to be associated with the prandial state as in fasting (low leptin levels). PK is overexpressed relative to the fed state (high leptin) (Poplawski et al, 2010). In this sense, leptin deficiency may further account for the overexpression of the hypothalamic PK gene in the ob/ob mice as detected in the present study. This finding appears to contrast with the modelling comments by Jolivet et al (2010) where neurons are proposed to be unable to upregulate glycolytic flux. However, this discrepancy may only be apparent. Our gene expression assays measure the net balance in hypothalamic gene expression, making the results compatible with opposite changes in the neuronal or glial compartments. In this sense, it is possible that the net increase in hypothalamic PK expression reflects the balance between a more marked increase in astrocytic PK expression and a decreased neuronal PK expression. In any case, the increased PK expression found did not result in increased lactate levels, suggesting that the ultimate metabolic impact of hypothalamic PK upregulation may be limited by posttranslational events. It should be mentioned in this respect here, however, that independent work reported also that neurons are able to increase their oxidative metabolism in parallel with an increase in pyruvate availability as generated by neuronal glycolysis during sustained checkerboard stimulation of human visual cortex in vivo (Gjedde and Marrett, 2001).
The elevated incorporation of 13C from [1-13C]glucose into hypothalamic glutamine in ob/ob mice reveals increased glutamine and glutamate cycling as associated with increased glutamatergic activity (Sibson et al, 1997), providing also additional information on the origin of increased neuronal pyruvate. Our results reveal that the increased [4-13C]glutamine labelling is produced in ob/ob mice under conditions where glial oxidative metabolism, as monitored by the oxidation of [2-13C]acetate, is not significantly enhanced. This suggests that the ATP required for augmented glutamine synthesis, may be mainly derived from astrocytic anaerobic glycolysis, supporting a glial origin for the additional pyruvate required to fuel the increased neuronal oxidation detected. Notably, we found no significant change in the lactate 1H or 13C HR-MAS resonances in ob/ob mice, implying that the increased lactate produced to support the augmented glutamine synthesis, is eventually consumed, most probably as pyruvate to fuel the neuronal cycle. Furthermore, since leptin deficiency stimulates NPY/AgRP neurons and inhibits POMPCT/cocaine–amphetamine-regulated transcript neurons, it is most probable that the increased oxidative activity and glutamatergic neurotransmission detected by 13C HR-MAS reflect these circumstances, as visualized by the corresponding increases in MEMRI signal intensities in the hypothalamic Arcuate and Ventromedial nuclei. It should be mentioned, however, that these results do not exclude the operation of additional signalling molecules and mechanisms regulating appetite and obesity, including ghrelin, peptide YY, fatty acids, insulin, and glucose itself (Morton et al, 2006). To the best of our knowledge, this is the first time that a positive correlation is established between increased cerebral oxidative activity and glutamatergic neurotransmission and the elevated MEMRI signal observed during cerebral activation. These concepts are summarized in Figures 7A and 7B in the frame of previous neuroendocrine concepts (Morton et al, 2006; Coll et al, 2007).
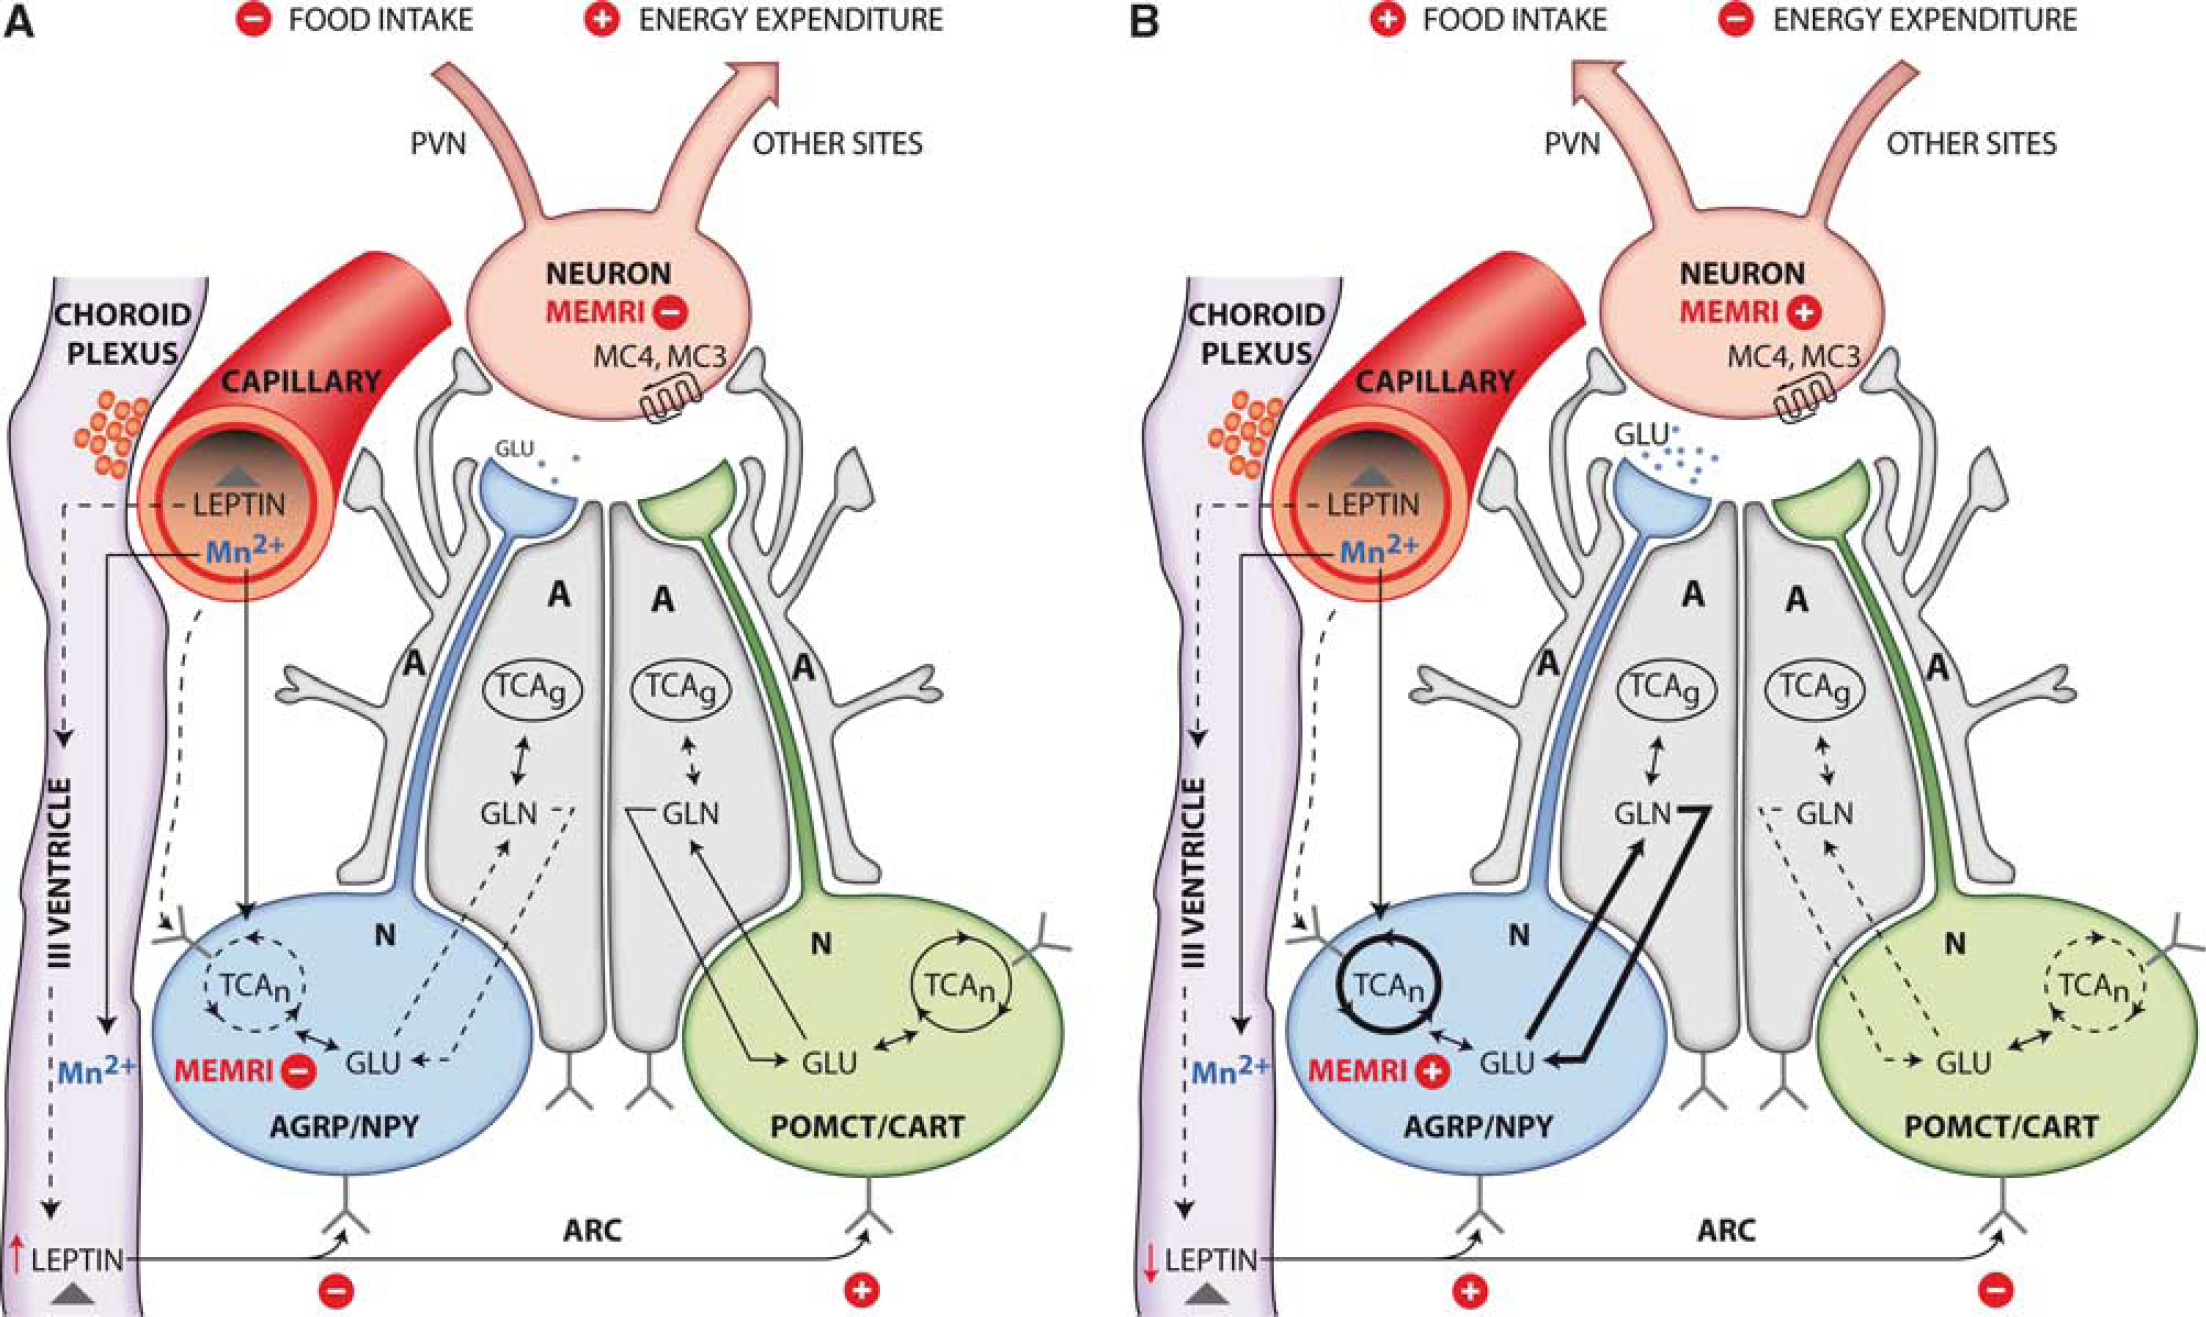
Summary of the effects of leptin in the hypothalamus of control (
In conclusion, the data presented in this work show that leptin deficiency associated with obesity leads to increased cerebral activation in the hypothalamic Arcuate and Ventromedial nuclei. These changes involve enhanced neuronal oxidative capacity and glutamatergic neurotransmission whereas pleiotropic effects of leptin deficiency in gene expression appear to be much less pronounced under these conditions.
The possibility to visualize noninvasively hypothalamic leptin activity by MEMRI and evaluate the underlying neuroglial interactions by 13C HR-MAS opens a new avenue in the molecular imaging of signalling cascades and may become instrumental for the development of novel therapeutic strategies for obesity and other feeding disorders.
Footnotes
Acknowledgements
The authors are indebted to Mr Javier Pérez CSIC for careful drafting of the illustrations. The authors would also like to acknowledge Santiago Canals CSIC for helpful discussion regarding MEMRI experimental protocols and Jesús Pacheco-Torres CSIC for insights of the LC-Model software program.
The authors declare no conflict of interest.