
Abstract
There is little experimental
Keywords
INTRODUCTION
Among the many pathophysiologic abnormalities found in epilepsy and the region of seizure onset, metabolic dysfunction is common. Although it is known that seizures themselves impose significant demand on bioenergetics and can cause such metabolic injury, whether and how this dysfunctional metabolism has a role in epileptogenesis remains an area of work. Metabolic and mitochondrial dysfunction has many consequences that can result in hyperexcitability,1–3 including decreased neuronal ATP that fails to maintain ionic homeostasis and membrane potential, reactive oxygen species that injure membrane lipids and proteins resulting in aberrant excitability, aberrant function of glutamine (Gln) synthetase that can potentially distort levels of glutamate (Glu), Gln, or neurotransmitter cycling, or aberrant calcium handling that results in abnormal synaptic activity. As shown by several groups,4,5 it has been suggested that 1H magnetic resonance (MR) spectroscopy and imaging (MRI) may be informative for studying these processes.
In this report, we assessed the variability of metabolic injury in experimental status epilepticus (SE) in the poststatus early epileptogenesis time period using magnetic resonance studies. The nature of this variability is of interest, as understanding the effect of a variable initial insult can give some insight on the SE injury process and the initiation of epileptogenesis. This is also of pertinence given the epidemiologic studies of human febrile seizures, finding that complexity of seizure (generalized versus focal onset), duration, or multiple events, which (while not clear enough for clinical prognostication in human patient groups) influences the probability of subsequent development of epilepsy. 6 To this end, we used the multiple low-dose intraperitoneal kainate model of temporal lobe epilepsy. 7 This SE protocol has been studied with continuous EEG monitoring 8 finding the presence of nonconvulsive seizures within 9 days (8.3 ± 0.9 days) after status, and onset of motor seizures at a more variable 18.3 ± 10.2 days. We thus used this model because of these well-defined features in addition to its known hippocampal degeneration, gliosis, axonal sprouting, and comparatively low mortality.
With the intraperitoneal dosing protocol, the kainate chemoconvulsant model exhibits variability, which is believed to be due in part to bioavailability of the kainate. 9 For example, Kondratyev and Gale 10 found that the nature of DNA fragmentation depended on the latency to status onset. As a result of this variability, it should be noted that the observed data are effectively cross-sectional in nature, i.e., there is an anticipated spread in the group measurements resulting from interanimal differences in temporal onset of seizures. Analysis of such cross-sectional data commonly uses group and correlation testing to identify and classify how measured parameters, e.g., neuronal versus glial metabolic parameters synchronously respond to the SE insult. Thus, in the present data, we anticipate measuring a correlated spread of metabolic parameters that are most likely components of neuronal and astrocytic processes. To further widen the variability in this model with a view toward understanding how lesser versus greater seizure injury affects metabolism in the poststatus period (and ultimately epileptogenesis), we tested this model using 1.5-and 3-hour periods of SE. Three days later, we acquired short and moderate echo (TE 10 ms, 40 ms, respectively) single-voxel 1H MR spectroscopy of the CA3 and CA1 region of the dorsal hippocampus. In subsets of these animals, we also performed quantitative T2 relaxometry over the hippocampal slice and evaluated the extent of histologic injury with NeuN (Neuronal nuclei) and Fluoro-Jade B (both stains, Millipore, Temecula, CA, USA) staining in the hilus.
For the interpretation of spectroscopic data, the detected metabolites have reasonably well-understood functions.
As is commonly used in clinical MRI, T2-weighted contrast is used in brain imaging to assess for edema, neuronal injury, and gliosis seen in traumatic brain injury, ischemia, and seizures. The T2 or transverse relaxation time is a biophysical parameter that characterizes the time constant by which the transverse MR signal decays. The value of the water T2 is a consequence of molecular tumbling and is influenced by many factors in living tissue, such as osmolality and interactions with the surrounding environment.18,19 T2-weighted brain MR images are bright in cerebrospinal fluid-filled spaces, gray matter to a larger extent than white matter, bright in areas of edema, and in many types of pathologic assessment since many of these tissue states have highly mobile water molecules and exhibit long T2 values. In both clinical and experimental epilepsy, T2-weighted imaging and relaxometry have been shown related to seizure injury and possibly to epileptogenesis.4,20 In this study, we used T2 relaxometry to correlate with metabolic profiles as well as histopathologic changes after kainate-induced seizure.
MATERIALS AND METHODS
Model
Male 6- to 7-week-old, 180–200g Sprague Dawley rats (Charles River, Wilmington, MA, USA) were used throughout. Animals were housed in standard rectangular single cages throughout with 12-hour light/dark cycle. After a 2-day post-arrival acclimation period, animals were handled daily until model preparation. At this point, rats weighed on average 190 ± 20 g. As per the incremented kainate model (8), animals were injected hourly with 5 mg/kg kainate (prepared in sterile saline) until a stage (Racine 21 ) 3/4/5 seizure was elicited. The timing of SE started after this first stage 3/4/5 seizure and ended 1.5 or 3 hours after this first seizure. The number of seizures in the previous hour determined the dose kainate received in the following hour: if the rat had 0 to 5 seizures, a full dose of 5 mg/kg was administered; if it had > 5 seizures, a half dose of 2.5 mg/kg was administered. If the rat was observed to be rapidly jumping in place (popcorning) or circling the cage, the dose for that hour was skipped as these behaviors usually precede death. For a 3-hour status rat, the typical duration of the entire process was 7 to 8 hours, requiring 2 to 3 hours before the start of the status period. Figure 1H shows the total doses of kainate for each group. Control rats were equivalently treated with sterile saline. Seizures were terminated with subcutaneous 10 mg/kg diazepam, which eliminated all behavioral seizures for both the 1.5- and 3 hour animals and resulted in apparent sedation. Rats were then given 5mL warmed subcutaneous lactated Ringer's solution (Henry Schein, Melville, NY, USA), and returned to their home cage. After SE, rats were weighed daily and given 5 mL warmed lactated Ringer's solution, and moistened rat chow to facilitate recovery. Up to the completion of imaging, we experienced a mortality rate of 7%, which is below the anticipated 15% projected for this model. 7 ARRIVE (Animal Research: Reporting of In Vivo Experiments) guidelines were used throughout this project.
(
Three days after SE, animals underwent the imaging study, with all studies performed between 0800 to 1500 hours, with the delay needed for transfer between the home cage and imaging facility being < 3 minutes. Rats were briefly anesthetized with isoflurane, intubated, and secured in a cradle for MRI. Anesthesia was maintained by adjusting isoflurane to 2%, N2O at 50 mL/min and O2 at 200 mL/min. A rectal thermal probe was used to monitor temperature, which was linked with feedback control to a warmed air source to maintain a body temperature of 37°C. After imaging rats were perfused transcardially with 4% buffered paraformaldehyde, pH 7.4, and the brains were harvested for histologic staining with cryoprotectant storage at −20°C.
A subset of animals (
All animal experiments were approved by the Institutional Animal Care and Use Committee at the University of Pittsburgh (PHS Assurance A3187–01) and Carnegie Mellon University, and were conducted in accordance with the US Public Health Service's Policy on Humane Care and Use of Laboratory Animals. No adverse events were noted during this study.
Spectroscopy
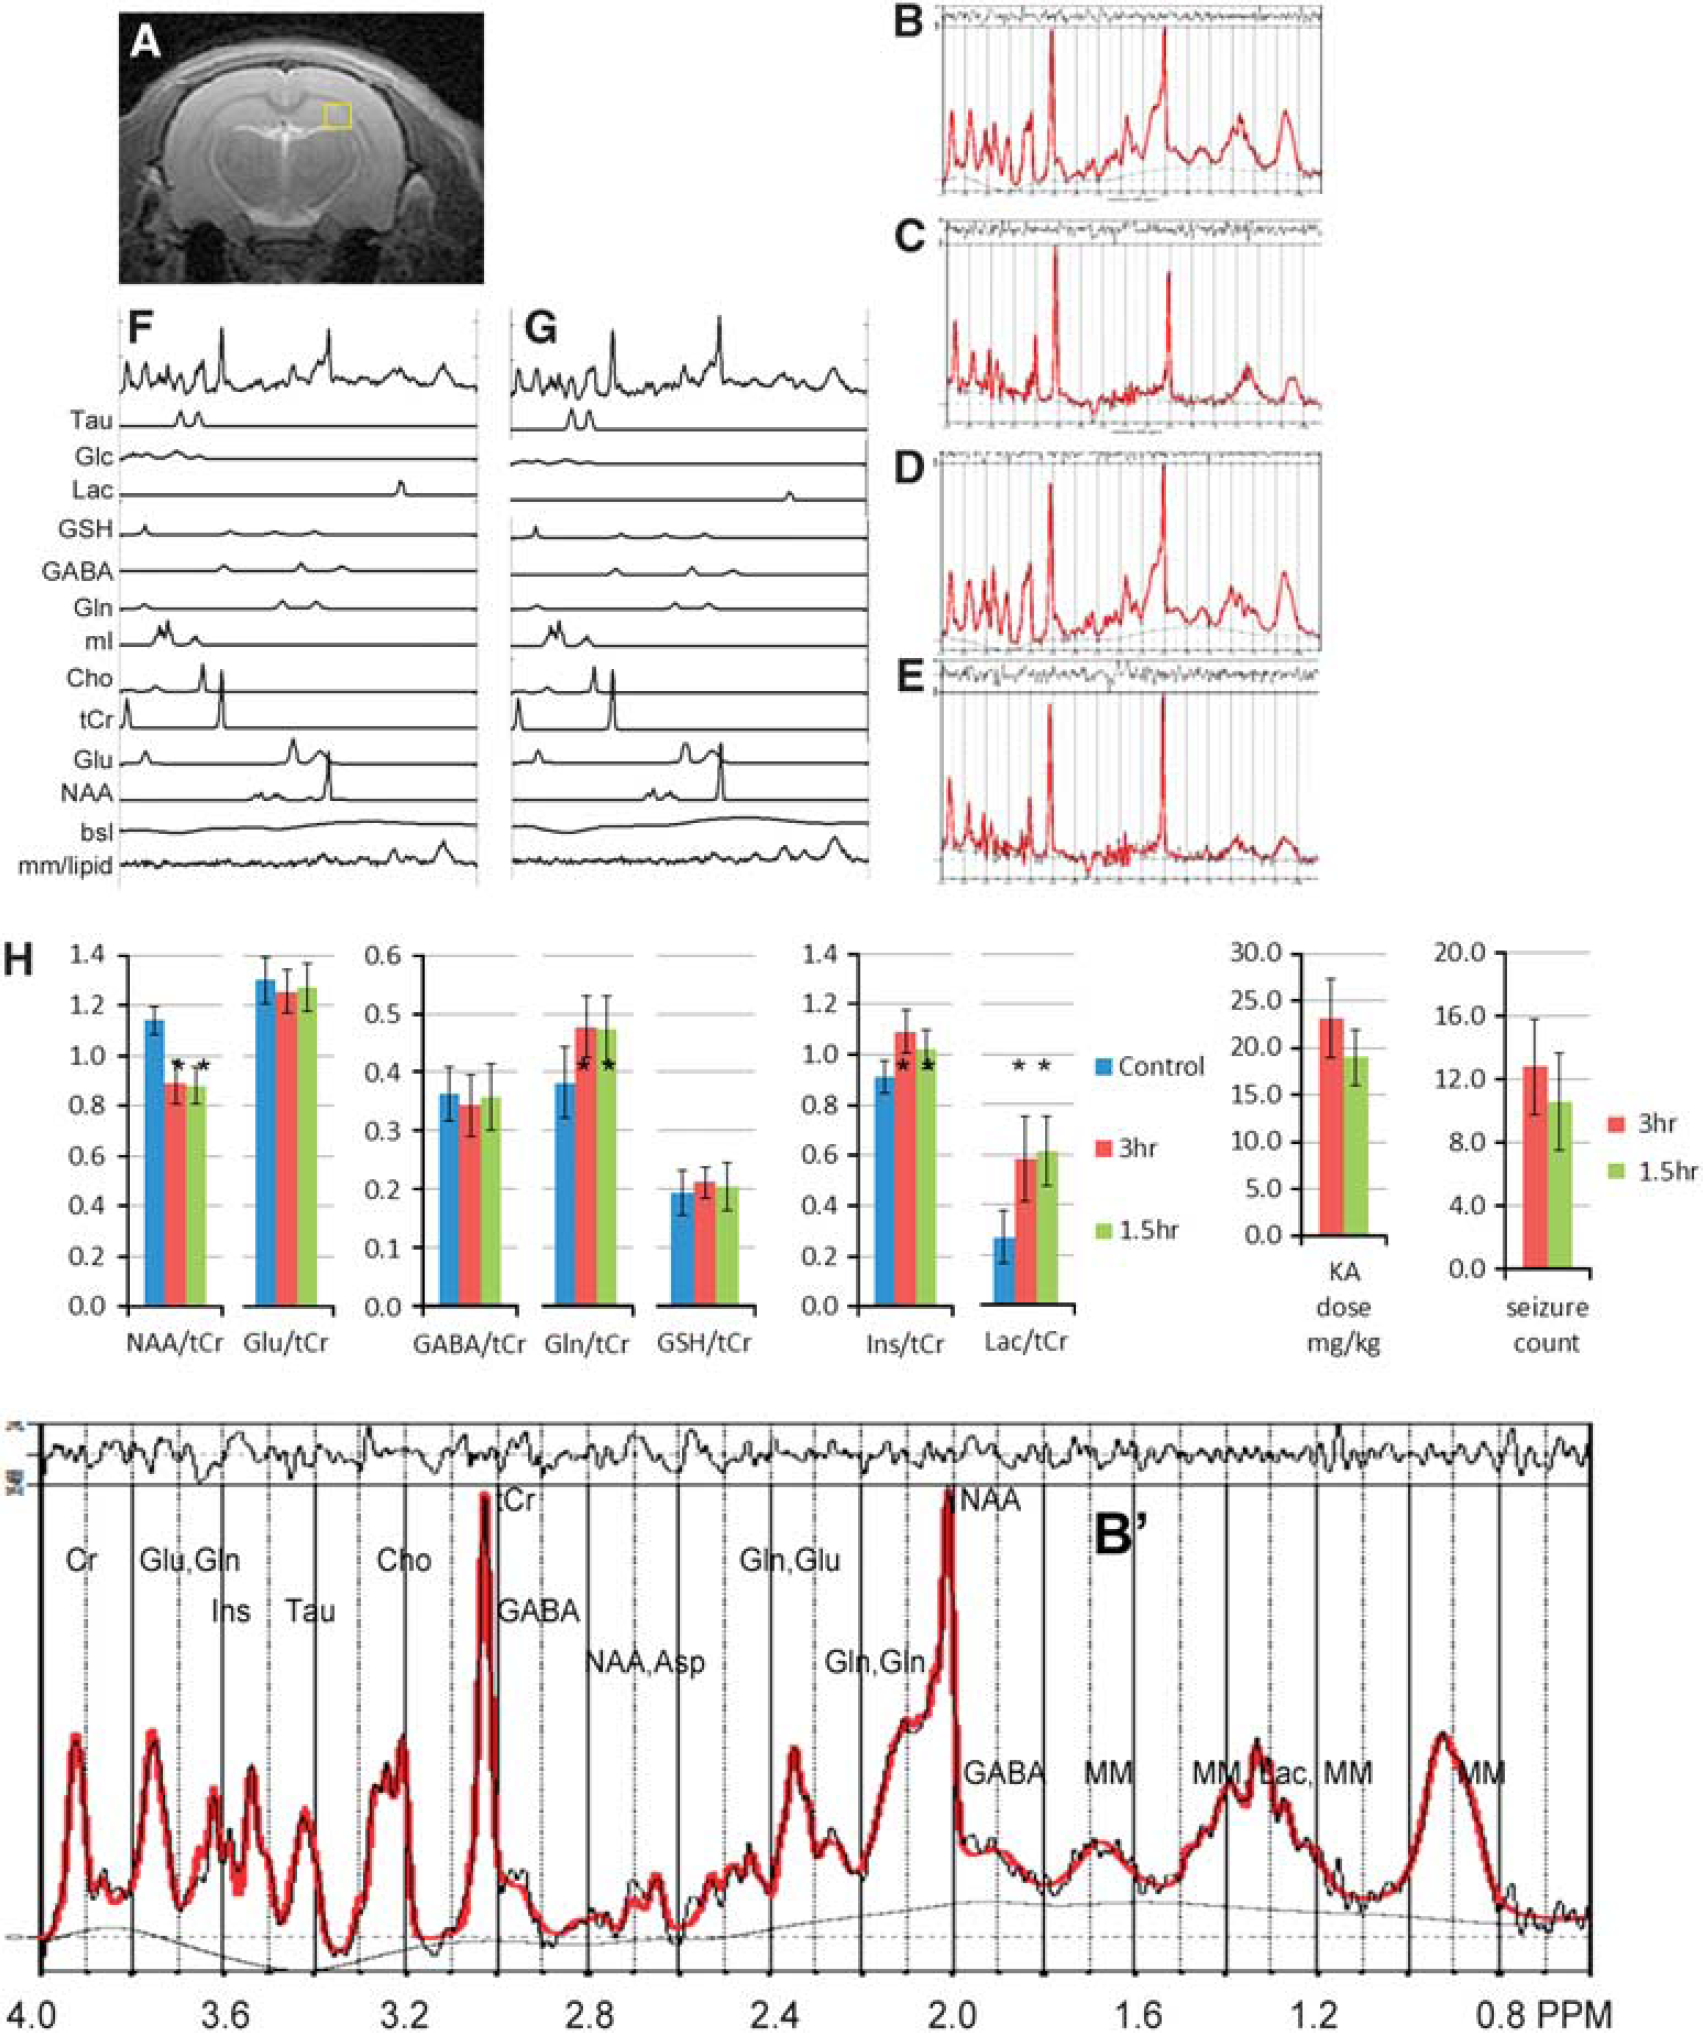
A Bruker Biospec 7-T 40-cm horizontal MR system (Billerica, MA, USA) was used throughout with a 72-mm volume transmit coil and two-element receiver array. After initial three-direction (Tripilot) localizer acquisitions, T2-weighted RARE (rapid acquisition with relaxation enhancement multiple spin echo) acquisitions were acquired for optimal placement to position the slice of interest in the hippocampus as shown in Figure 1A. Static field homogeneity shimming was performed using Bolero,
24
a noniterative field map calculation that optimized first- and second-degree shim values. As performed over the hippocampal slice (Figure 1), the typical s.d. of the B0 field was 6.2 ± 1.7 Hz (10 animals). With the available transmit strength of 1500 Hz, single-voxel PRESS spectroscopic 8 mm
3
(typically, 2 × 2 × 2 or 2 × 1.8 × 2.2 mm) acquisitions (17 minutes per acquisition) at TE 10 ms and 40 ms were performed separately over the left and right hippocampus. Water suppression was performed using a VAPOR prespin echo sequence. LCM (http://s-provencher.com/pages/lcmodel.shtml)
25
analysis was performed for determination of the metabolite profiles and taken as a ratio to total creatine. Analyses were performed without identification as to animal grouping and metabolites with a Cramer–Rao bound > 10% were omitted from further analysis. At a TE of 10 ms, the metabolite ratios are minimally affected by transverse relaxation values (for a typical T2 of 130 ms, this is 8%) but are affected by T1 and should largely be compared between control and experimental groups. Figure 1 shows example spectra from a control and 3-hour SE animal. In the MR spectroscopy data, a total of
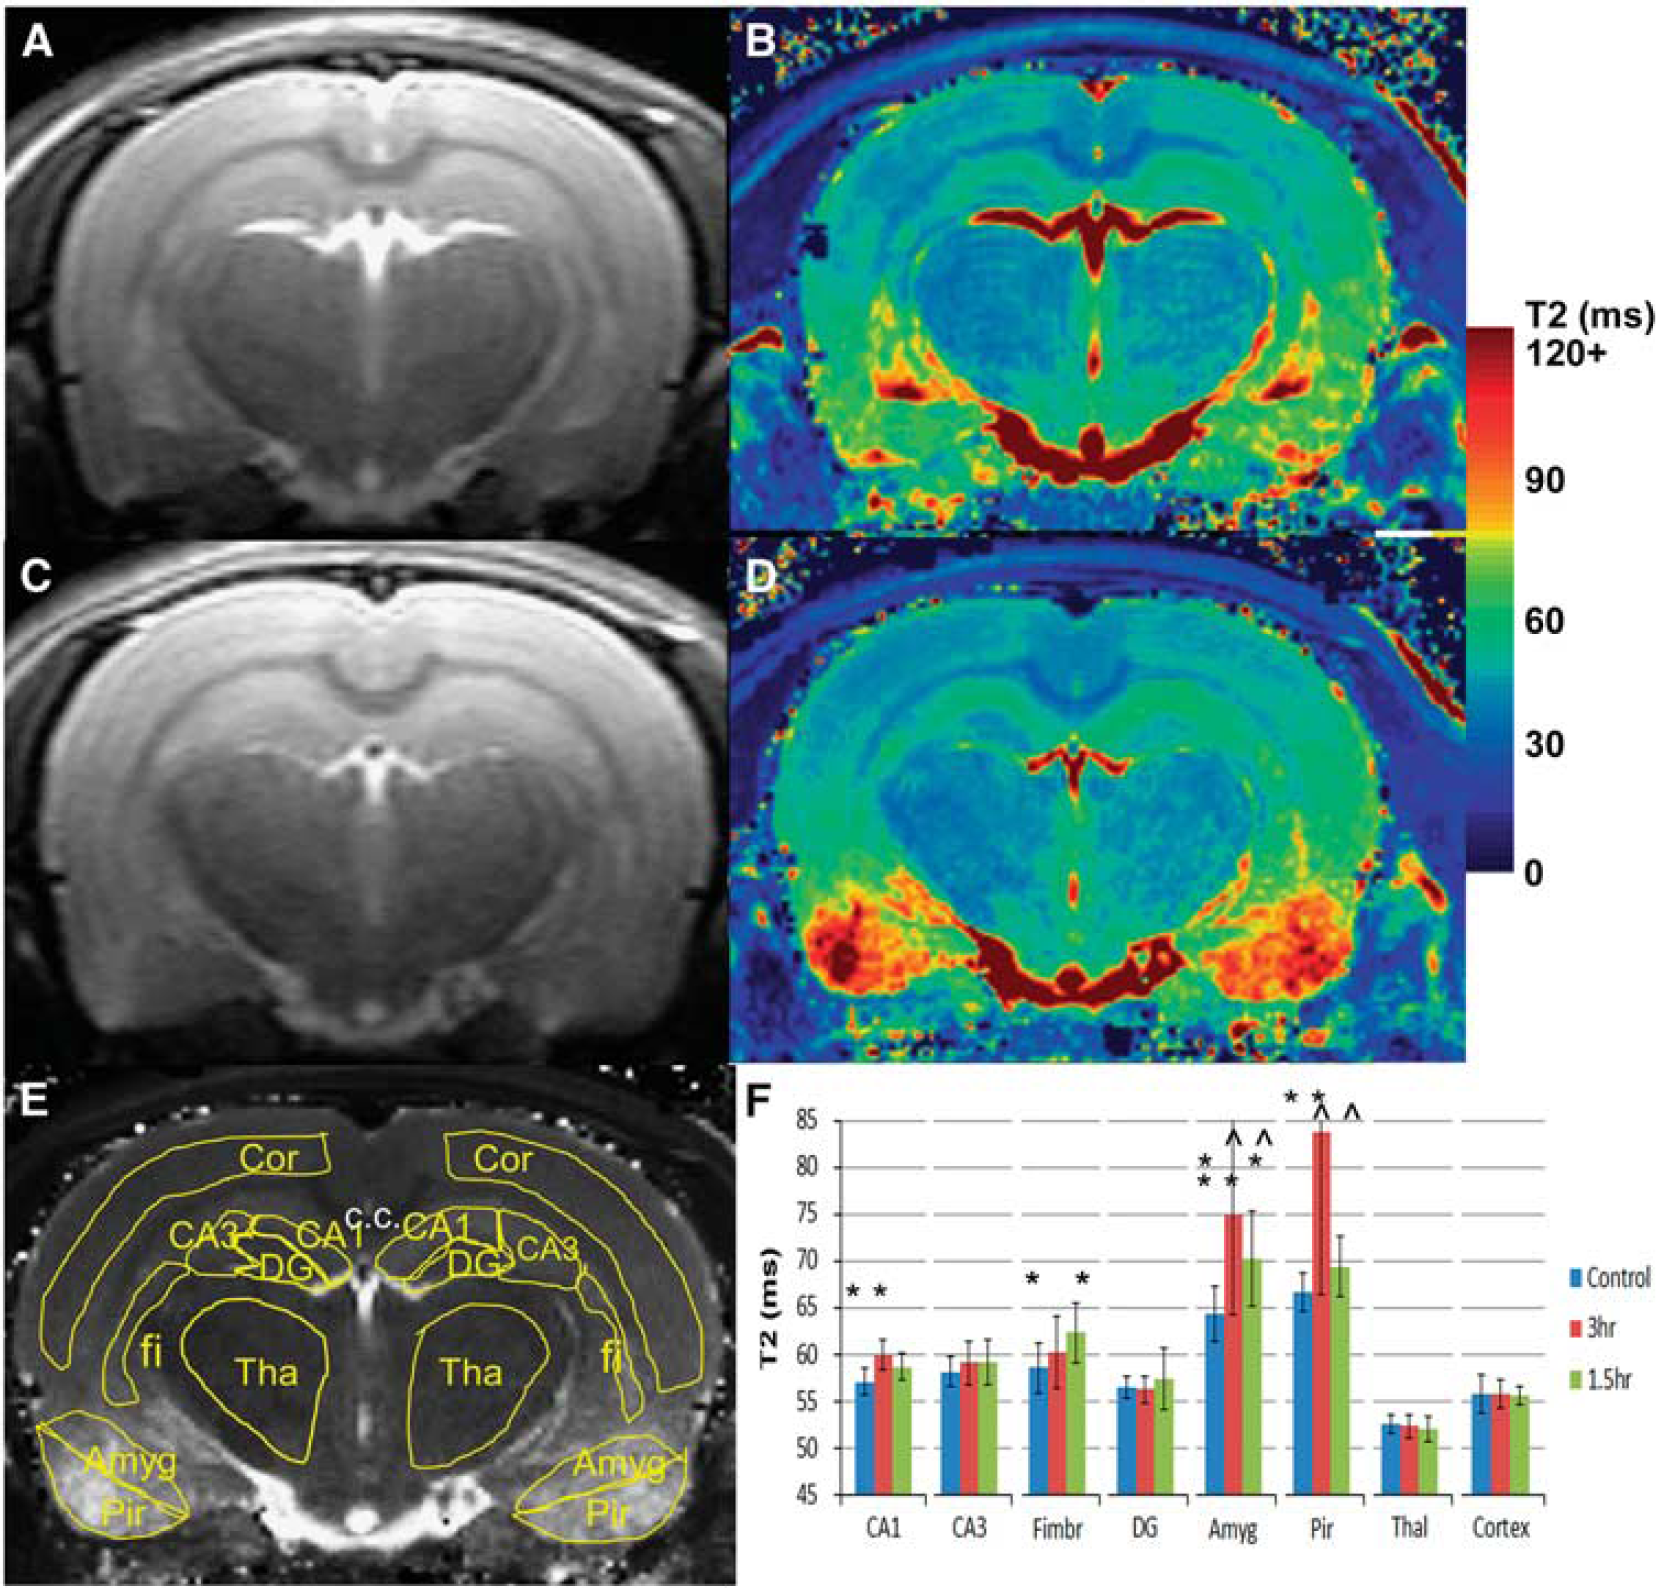
T2 relaxometry data from a control (
Statistical analyses were performed using two-tailed
Pearson's correlation values between metabolites, 1.5- and 3-hour groups
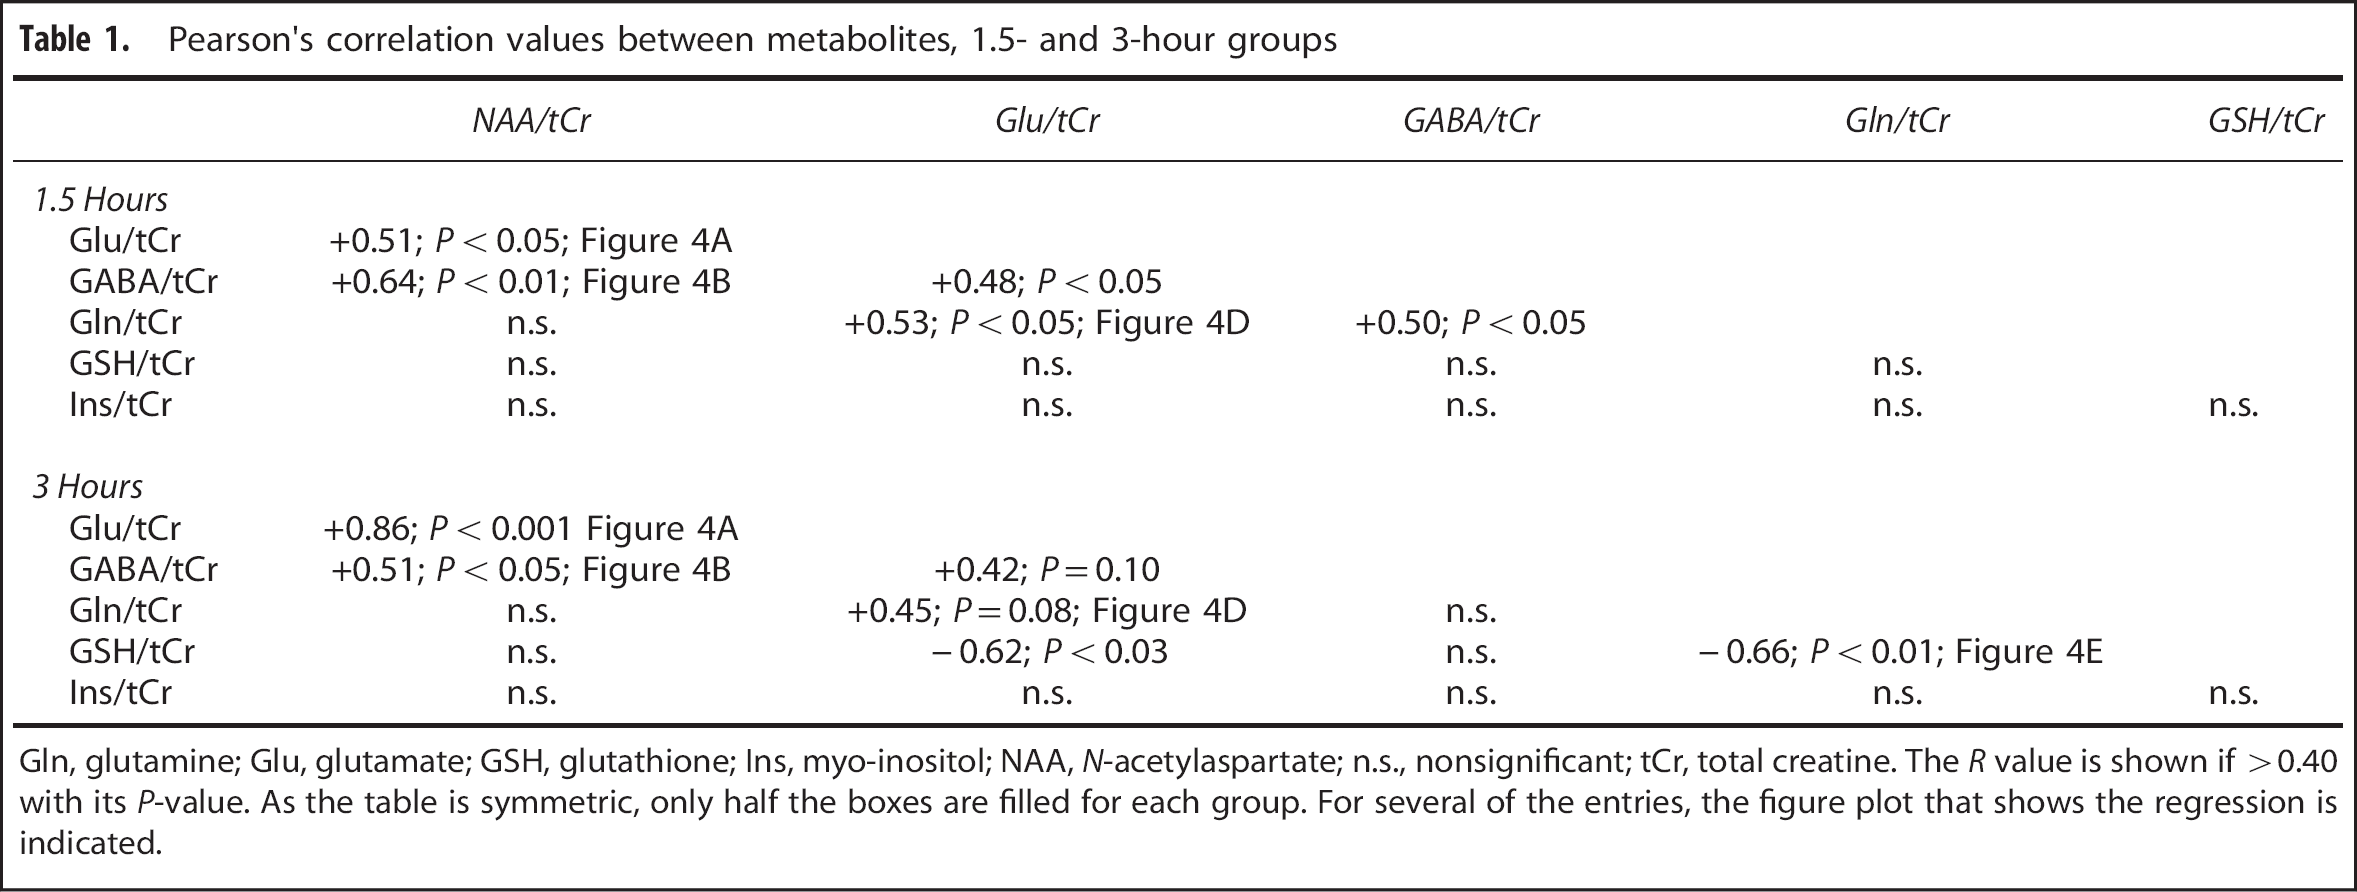
Gln, glutamine; Glu, glutamate; GSH, glutathione; Ins, myo-inositol; NAA,
NeuN (
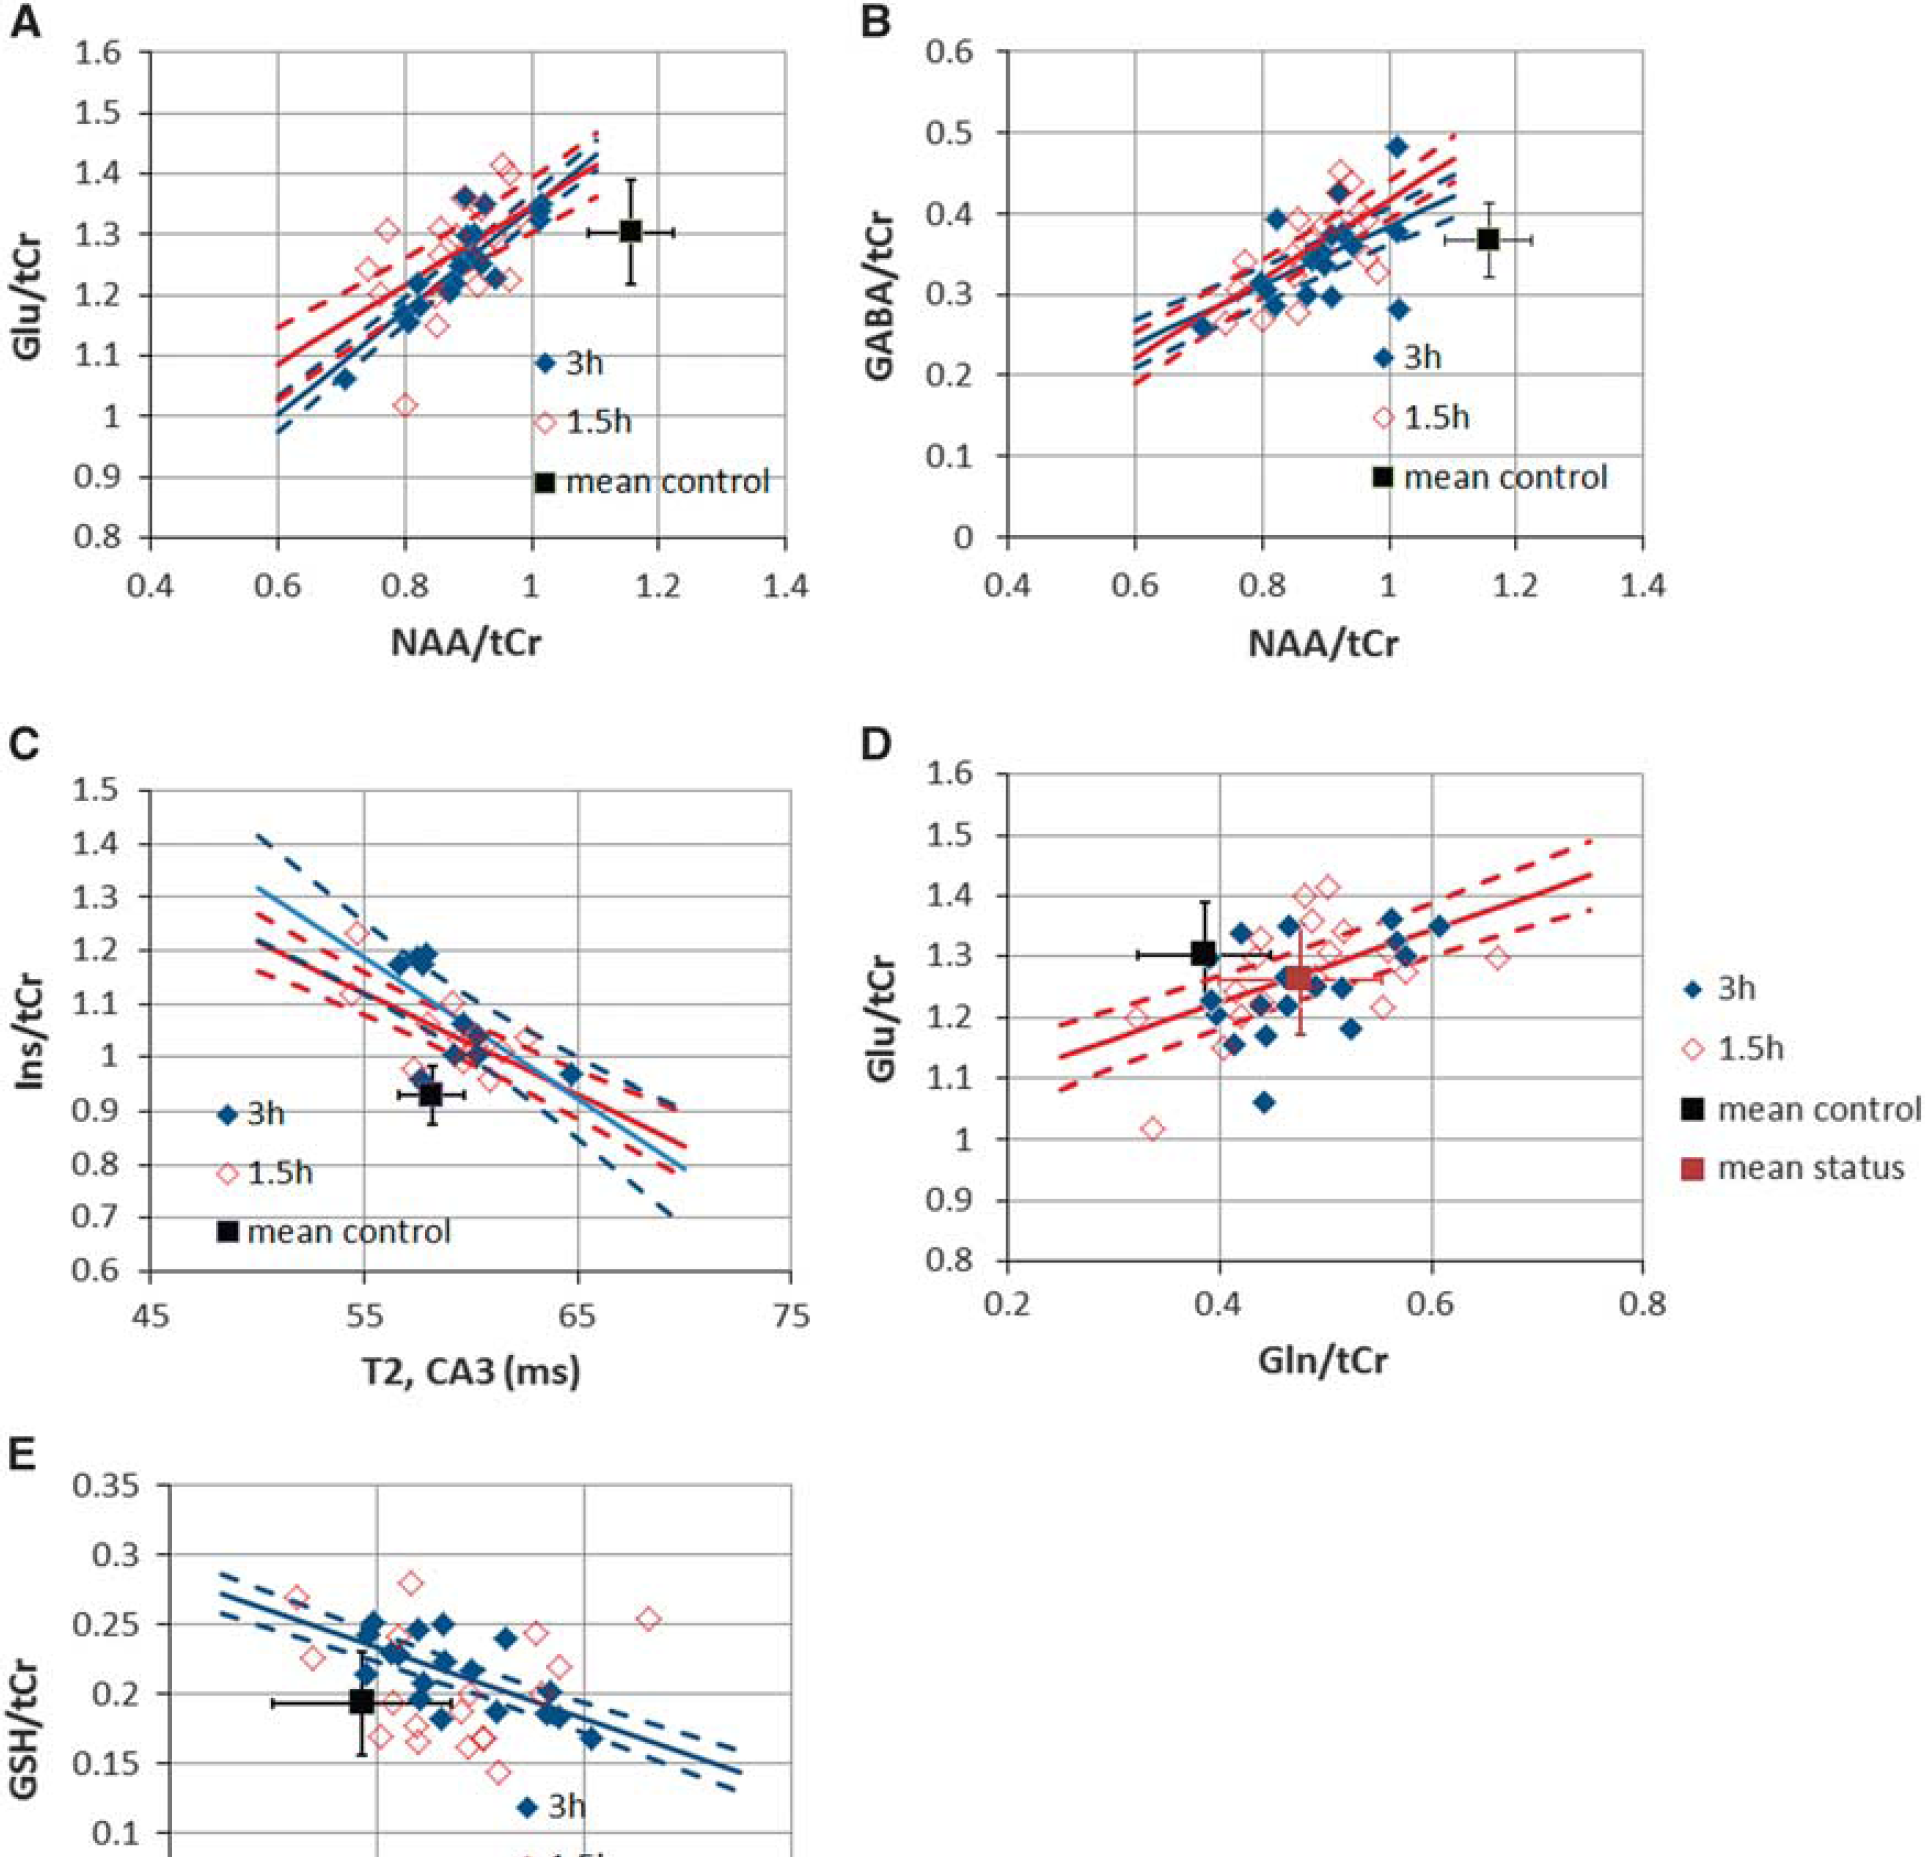
Scatterplots of metabolite parameters with control data are shown. For all plots, the indicated regression line (solid) and 95% confidence intervals (dashed) for the means are shown if significant. Data plotted in red are from 1.5 hours (also, open symbols), plotted in blue are 3-hour data (also, filled symbols). Control data mean and s.d. are plotted; none of the control data showed any significant regression values. (
RESULTS
Group Results
The 1.5- and 3-hour model animals differed slightly in terms of total kainate dosing, with the 1.5-hour group using a mean kainate dose of 19.4 ± 2.7 mg/kg and the 3-hours group 23.1 ± 4.2 mg/kg. This 19% difference was of borderline significance (
T2 relaxometry data are shown in Figure 2, including definition of the regions of interest. Showing the consistency of the measurement and the relatively well-controlled SE of the model (thus not inducing whole brain damage), there was no change in the T2 of cortex (55.8 ± 1.0 ms,
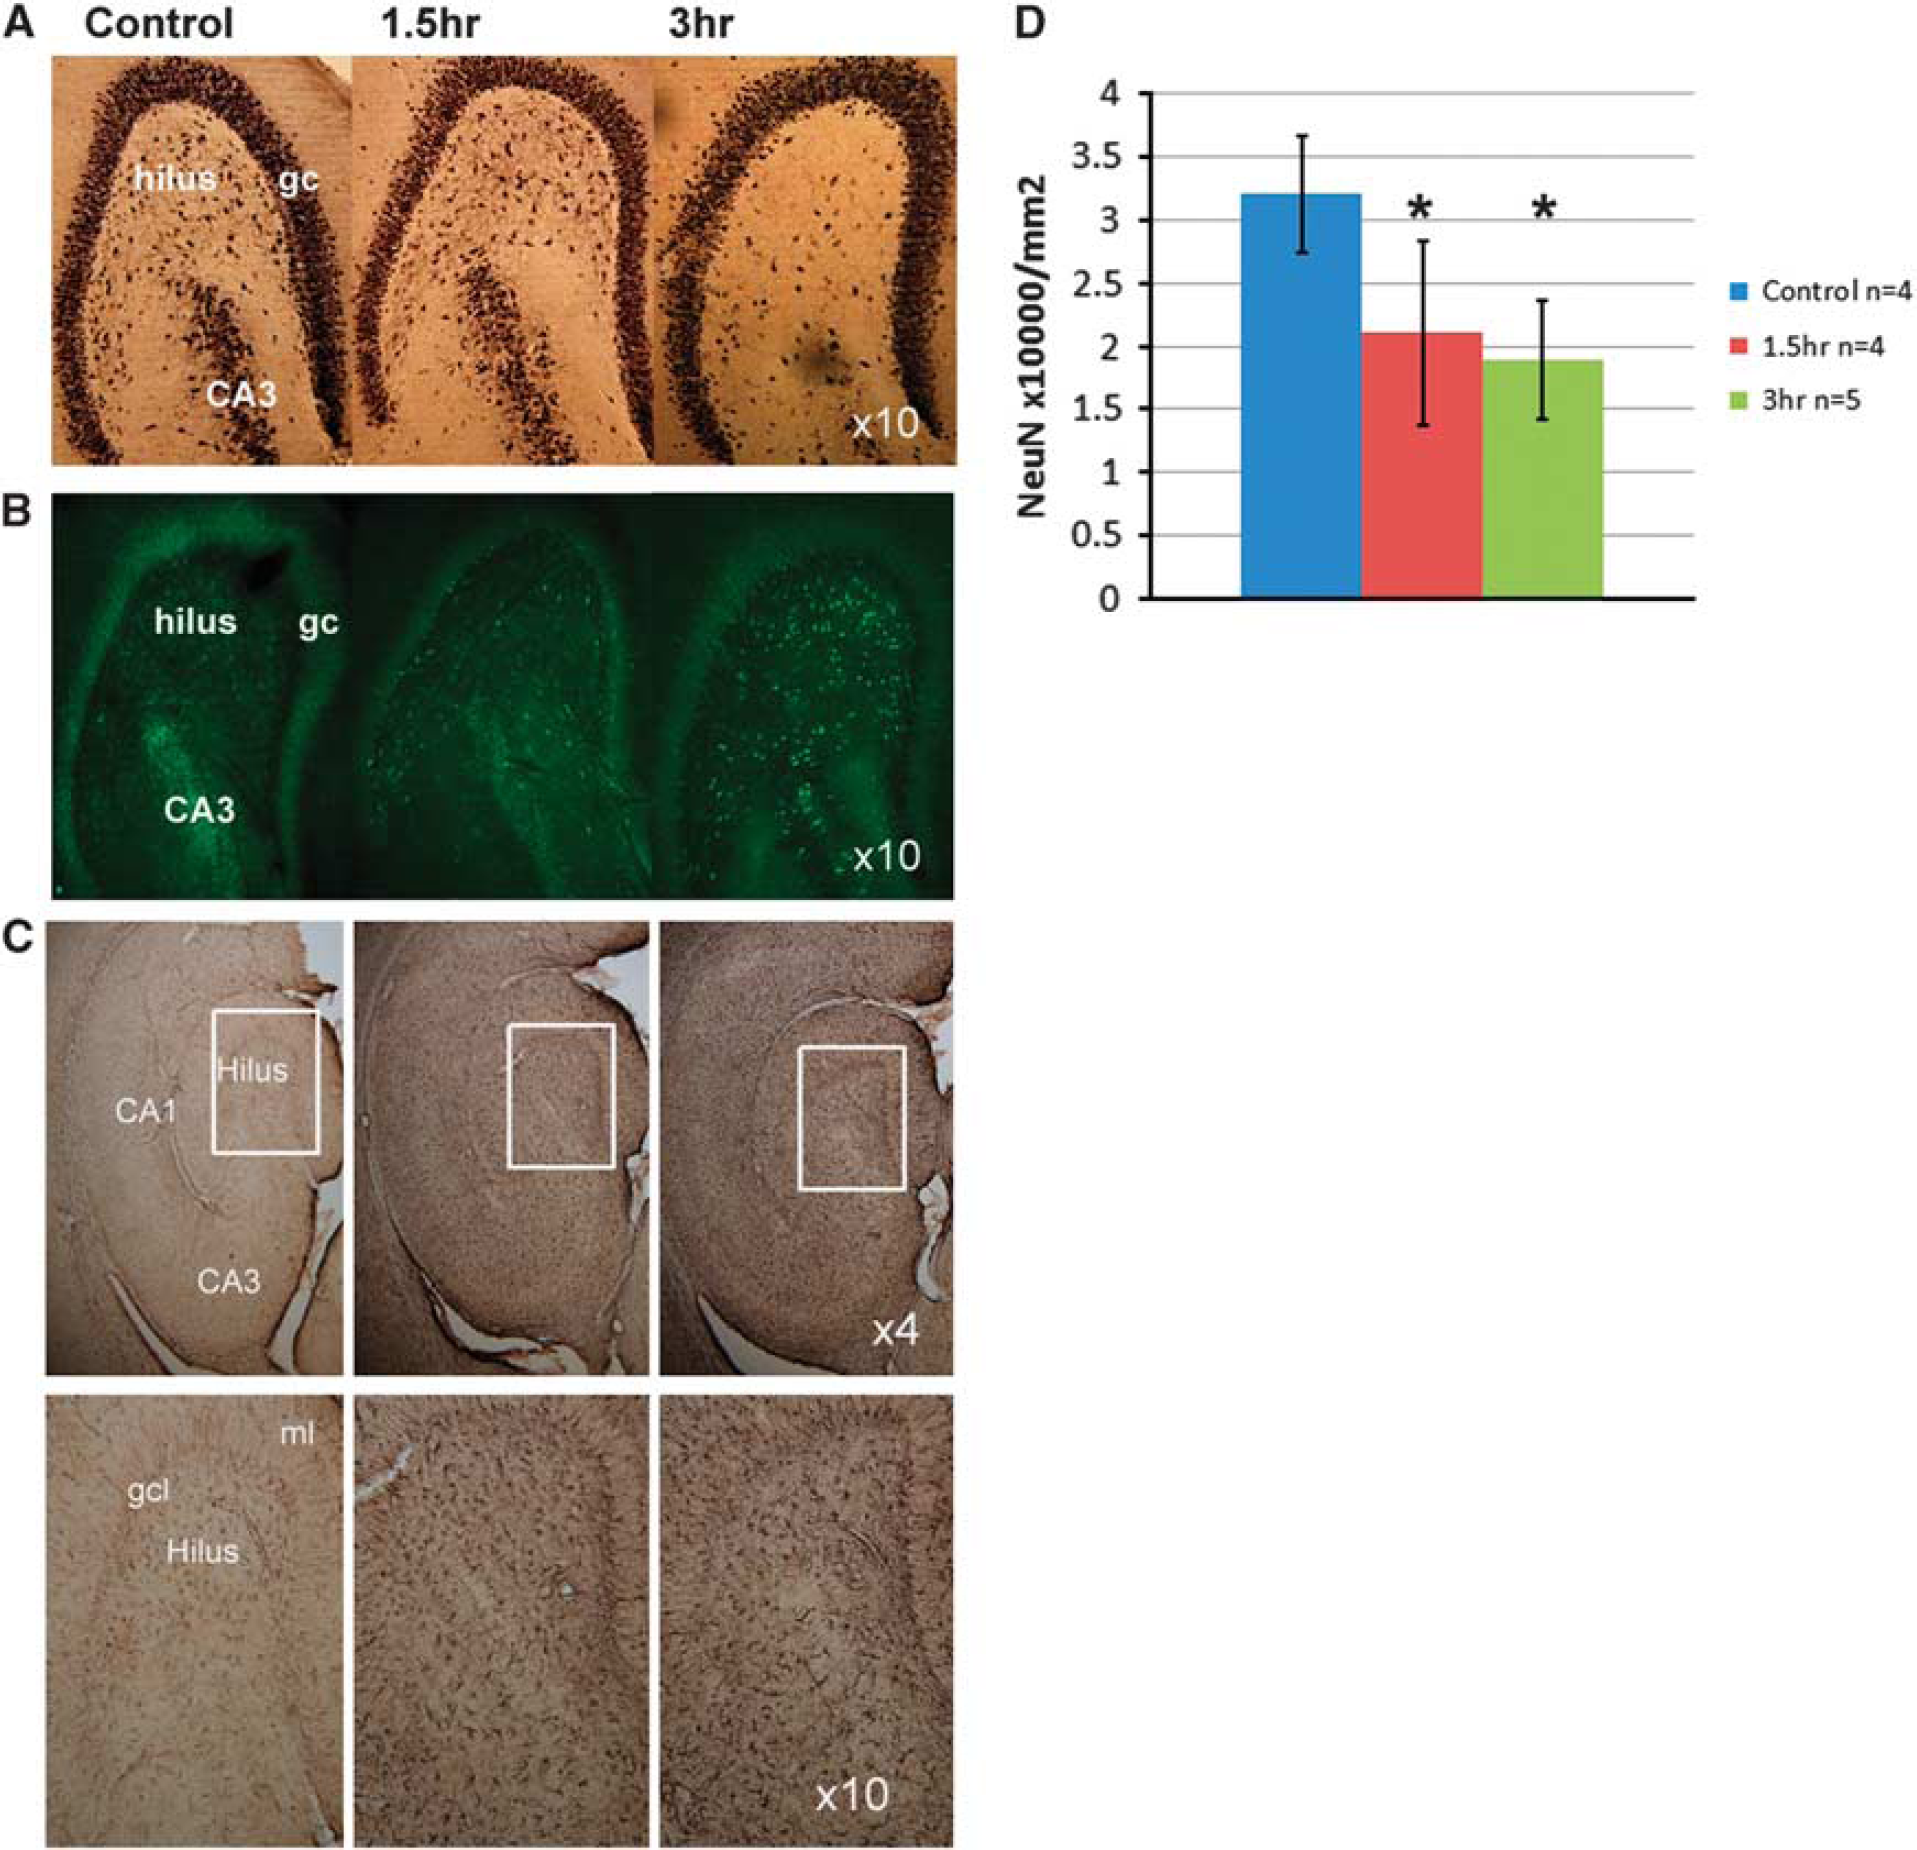
In all of the SE rats, Fluoro-Jade B staining revealed the presence of fluorescent degenerating neurons throughout the hippocampus. Variation in the staining density of neurons was apparent in the hilar region with the 1.5-hour SE rats showing a moderately lesser extent of degenerating neurons than the 3-hour rats. Glial fibrillary acidic protein staining was markedly elevated in both the 1.5- and 3-hour groups compared with control (Figure 3C) consistent with astrocytic activation. Quantification of neuron numbers in the hilus for NeuN-stained sections revealed that the SE rats had significantly fewer neurons than in the control group (
Regression Analyses
Given that the SE is anticipated to induce a correlated set of metabolic changes, a Pearson's correlation table was generated for both status groups (Table 1). There was no significant correlation between kainate dose with any of the metabolites. In discussing these correlations, we consider the individual metabolites grouped in terms of their roles in neuronal injury, glial reaction, etc. None of these metabolites were correlated in the control group.
For the evaluation of neuronal function, we assessed how Glu/tCr, GABA/tCr, and NAA/tCr were correlated. For Glu/tCr and NAA/tCr, the 3-hour group was highly correlated at
The group increase in Ins/tCr is consistent with the literature and astrocytic activation occurring with SE.5,26 This increase correlates with the quantitative T2 from the CA3 region for both the 1.5- and 3-hour groups, nearly identical at
As has been observed by Filibian 2012,
5
GSH is increased in the poststatus period, consistent with its decreased consumption with progressive neuronal injury. The present data finds a significant correlation in the 3-hour group between GSH/tCr with Gln/tCr (
DISCUSSION
Injury in the 1.5- and 3-hour Status Groups
These spectroscopic data confirm that whether with 1.5- or 3-hour SE, at the 3-day post-SE time point there is a decline in NAA/tCr consistent with the neuronal mitochondrial injury. This decline occurs at the same time that histologic data shows NeuN determined neuronal loss in the hilus and widespread Fluoro-Jade staining indicative of injured and degenerating neurons throughout the hippocampus. With glutamatergic neuronal function described by Glu/tCr, Figure 4A shows a 10% decrease in mitochondrial NAA/tCr before Glu/tCr and glutamatergic injury is manifest. Given the known slow turnover of NAA,
28
this 10% decrease is likely to represent an acute loss of neuronal mitochondrial function, with the further relationship of NAA/tCr with declining Glu/tCr (reaching a total mean decrease in NAA/tCr of ~ 25%) likely characterizing progressive glutamatergic dysfunction. A similar behavior is seen with NAA/tCr and GABA/tCr (Figure 4B). The high significance of the NAA–Glu relationship is consistent with the
Also seen in both status groups are significant relationships with Ins/tCr and quantitative T2 measurements from the CA3 region (Figure 4C). As shown by cellular and human studies,16,30 Ins is believed to be in high concentration in astrocytes with its molecular role identified with the maintenance of cellular osmolality relative to extracellular fluid. This homeostatic response would thus be anticipated to be developed during and after SE, consistent with studies showing shifts in tissue osmolality
31
and glial activation.
26
T2 values are known to be dynamic in the poststatus period, changing temporally and regionally. In the hyperacute time frame (either during the seizure or at most a few hours after seizures), the T2 decreases,20,32 consistent with increased deoxyhemoglobin content and increased cellular osmolarity (with decreased extracellular space) as suggested by Heinemann.
31
In the longer time frame, the T2 increases and then subsequently normalizes. As reported by Roch
As stated in the Introduction section, the present data are effectively cross-sectional in nature. Specifically, given the known variation in bioavailability of the kainate at a fixed dose, we anticipate that the varying temporal onset of injury will contribute to the observed spread in the group data. As diagrammed in Figures 5A and 5B, the spread of the NAA/tCr, Glu/tCr values can be because of ‘early onset’ (solid line) and ‘delayed onset’ (dashed line) injury. Regression analysis of these metabolic parameters would, depending on noise and dynamic range of values, exhibit the statistically significant positive correlations as experimentally observed. The observation that the neuronal parameters of NAA/tCr, Glu/tCr, and GABA/tCr give similar regressions from the 1.5- and 3-hour status groups suggests that the poststatus 3-day time courses of these parameters are similar between the two groups, consistent with the view that (not surprisingly) status-induced neuronal injury has been produced in both groups.
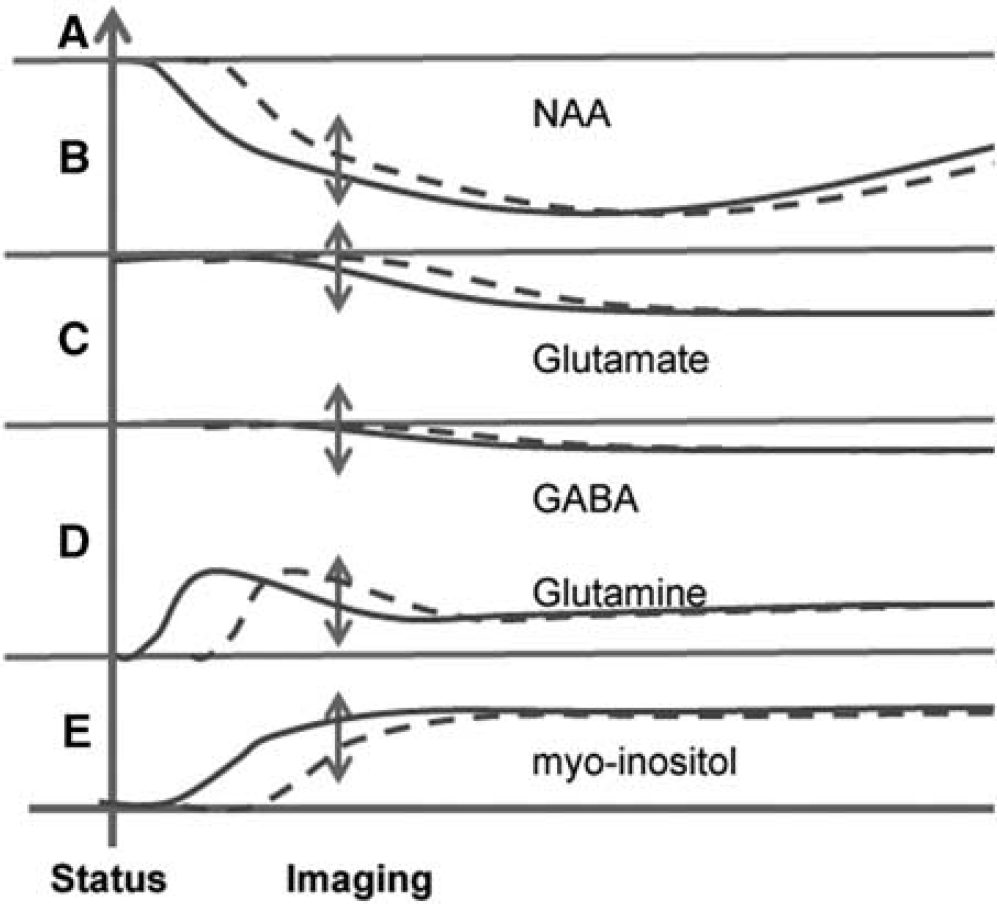
Hypothetical time courses of metabolic changes for (
Glial Activation
The increased Gln/tCr in the 3- and 1.5-hour groups is consistent with the view of increased Glu clearance driven by seizure activity, this view also supported by Western blot results from Hammer
One explanation for these observations may be a dynamic response of Gln. Although the above reports of Hammer and Sun have both identified an increase in GS activity in the latent period, several groups have found GS activity declines as astrocytes develop a reactive profile with progression from the acute into the chronic phase.3,34,36 This would also be consistent with the present data, in which the initial increase in Gln/tCr occurring in response to seizure linked Glu neurotransmission is followed by a decrease in Gln/tCr toward apparent normalization. With the cross-sectional nature of the group data and variation in temporal onset of seizure with subsequent neuronal injury and glial dynamics (diagrammed in Figure 5D), a rise and then fall in Gln/tCr would generate the observed positive regression in relation to Glu/tCr. This positive regression could also be partly understood based on the recognition that decreased glutamatergic function, with its decrease in neurotransmission would result in decreased Gln; however, this view does not provide good explanation for the increased Gln/tCr. Thus these data are consistent with an early increase in GS flux and content, with a decline in GS flux that follows as reactive astrocytosis develops.3,34–36
Short Versus Long Status Duration
As implicitly hypothesized in this study, with its greater sustained seizure period and near 100% rate in generating chronic epilepsy, the metabolic changes and processes seen in the 3-hour group may not necessarily match that of the 1.5-hour group. The present data are consistent with this, finding significant correlations with GSH/tCr in the 3-hour but not the 1.5-hour group. In the 3-hour group, GSH/tCr correlates with both Gln/tCr at
The 1.5-hour group does not show a clear relationship between GSH/tCr and Gln/tCr. The basis for this difference may be complex, possibly as a mix of multiple processes with differing time courses (e.g., GSH rapidly being consumed in the neuronal pool while there is also increased glial synthesis). Another explanation for this could be volume extent of injury in the CA3 region studied, e.g., with the 1.5-hour group exhibiting partial injury, while the 3-hour group has achieved the larger extent of metabolic injury. It should be noted, however, from the NAA/tCr, Glu/tCr dynamic ranges seen in Figure 4A that there is nearly complete overlap in these parameters between the 3- and 1.5-hour groups and thus a hypothetical volumetric injury difference is unlikely to be the only cause for the GSH/tCr regression differences. The GSH regressions in the long status group is thus likely representing a process of maturation of injury, consistent with the apparently slower increase in GSH/tCr as reported by Filibian
Caveats
The major caveats in this work rest on three issues, the use of metabolite ratios to total creatine rather than absolute concentrations, the qualitative difficulty of assessing seizure severity during the status period, and the termination of seizures. First, as stated in the Introduction section, the metabolite ratios in this study are considered as functional measures rather than strict concentrations. This is based on the view that the ratios can be more informative than concentrations alone because of the interest in understanding concentrations in terms of functioning mass, taken here as the size of the tissue's creatine kinase buffering system and measured by total creatine.15,38 Quantification measures based on tissue water or other reference would not provide this normalization. However, it is nonetheless important to consider how stable the total creatine pool is. Reports on the stability of the total creatine tCr pool in such models are few; Gupta
Second, while the Racine classification 21 is robust for identifying behavioral seizures, the identification of less intense seizures is variable. Our assessments of kainate dosing, seizure count, and metabolites showed no sensitivity, consistent with other descriptions of this model. 9 Finally, the use of diazepam to terminate the seizures can be problematic as it has been reported that abnormal EEG activity can persist although behavioral events resolve. Whether this difference is pertinent has been debated (e.g., there is no difference in latency to recurrent seizure onset between animals that required extra diazepam versus those that did not 40 ) but the greatest effect this will have on the present data would be to result in variability and a longer seizure period especially with the 3-hour group. However, as our interest lies in variability in these two groups, this is unlikely to be a problem for the metabolic and T2 effects reported here.
CONCLUSIONS
In the post-SE time frame, we believe that understanding the distortion of metabolism is pertinent to better target cellular compartments (glial versus neuronal) for potential therapeutic effect and to potentially provide biomarkers for epileptogenesis (rather than solely neuronal injury). Thus in this report, the Hellier–Dudek kainate model of epilepsy has been studied with MR spectroscopy, T2 imaging and histologic analysis using two durations of SE, 1.5 and 3 hours. As expected, the neuronal injury evaluated by NAA/tCr, Glu/tCr, and GABA/tCr was significantly correlated in both groups. Also in both groups, quantitative T2 values in the CA3 region was significantly correlated with Ins/tCr, consistent with the known role of Ins in responding to osmotic shifts and glial activation. More clearly identified in the 1.5-hour group compared with the 3-hour group, there was a significant positive relationship between Gln/tCr with Glu/tCr. It is noted that this positive relationship is likely to arise from an initial Gln/tCr increase in response to neurotransmission cycling and increased GS activity, with a subsequent decline as the glutamatergic injury develops. Significant relationships between GSH/tCr, Gln/tCr, and Glu/tCr are seen in the 3-hour group but not in the 1.5-hour group, consistent with the notion that as the SE injury matures, Gln decreases toward a pseudonormalized level, which in the context of glutamatergic injury, is accompanied by higher GSH/tCr. Whether these metabolic and imaging changes relate to the subsequent development of recurrent seizures will require more work; however, the metabolic response during and after status clearly evolves with a time course that relates to status duration and reflects neuronal injury interacting with early and later glial activation, accompanied by slower changes in GSH as neuronal injury progresses.
Footnotes
YW acquired the imaging data and participated in the analysis and interpretation. PSP created the epilepsy model, prepared the animals for imaging, and participated in the interpretation. AR performed the histologic analysis. TKH assisted in the setup of the imaging experiments. NCdL assisted in the interpretation and oversight of the histologic analysis. JWP participated in the imaging and model setup, analysis, and data interpretation.
The authors declare no conflict of interest.