
Abstract
Superoxide is the single-electron reduction product of molecular oxygen generated by mitochondria and the innate immune enzyme complex, nicotinamide adenine dinucleotide phosphate (NADPH) oxidase (Nox), and its isoforms. Initially identified as critical to the host defense against infection, superoxide has recently emerged as an important signaling molecule and as a proposed mediator of central nervous system injury in stroke, neurodegenerative conditions, and aging itself. Complete understanding of superoxide in central nervous system disease has been hampered by lack of noninvasive imaging techniques to evaluate this highly reactive, short-lived molecule in vivo. Here we describe a novel optical imaging technique to monitor superoxide real time in intact animals using a fluorescent probe compound and fluorescence lifetime contrast-based unmixing. Specificity for superoxide was confirmed using validated mouse models with enhanced or attenuated brain superoxide production. Application of fluorescence lifetime unmixing removed autofluorescence, further enhanced sensitivity and specificity of the technique, permitted visualization of physiologically relevant levels of superoxide, and allowed superoxide in specific brain regions (e.g., hippocampus) to be mapped. Lifetime contrast-based unmixing permitted disease model-specific and brain region-specific differences in superoxide levels to be observed, suggesting this approach may provide valuable information on the role of mitochondrial and Nox-derived superoxide in both normal function and pathologic conditions in the central nervous system.
Introduction
Optical imaging of fluorescent proteins and other molecules has transformed our ability to study many of the biologic processes and molecular mechanisms that underlie both normal physiology and transition to disease. However, noninvasive imaging techniques to assess the role of oxygen radicals such as superoxide in the intact animal have lagged behind these generally protein-based imaging methods. Superoxide, the one-electron reduction product of molecular oxygen, is an important oxygen radical species generated by mitochondrial metabolism of oxygen (Wang et al, 2008), and by a number of cellular oxidases, including nicotinamide adenine dinucleotide phosphate (NADPH) oxidase (Nox2), the respiratory burst oxidase involved in innate immunity and inflammation (Bedard and Krause, 2007). Recent studies have suggested that superoxide also serves as an intracellular and extracellular signaling molecule, and in the nervous system low levels of superoxide are required for normal longterm potentiation, excitatory neurotransmission, and learning and memory (Thiels and Klann, 2002; Infanger et al, 2006; Hu et al, 2007; Kishida and Klann, 2007). Superoxide is also believed to be critically involved in many disorders of the brain, including Alzheimer's dementia, Parkinson's disease, severe mental illnesses, and cerebrovascular disease including stroke (Maier and Chan, 2002; Cadenas, 2004; Behrens et al, 2007; Suh et al, 2007; Behrens et al, 2008; Dugan et al, 2009; Jung et al, 2010). However, attempts to fully define the contribution of superoxide from metabolic and other sources of superoxide have been hampered by the evanescent nature of this molecule, and the lack of imaging techniques to detect superoxide in the intact animal (critically reviewed in Nakano, 1998; Rosen et al, 1999; Tarpey and Fridovich, 2001; Nohl et al 2004; Tarpey et al, 2004). The current protocol was developed to address this unmet need for an imaging approach that can visualize and quantify levels of superoxide from mitochondria and other sources of superoxide in the intact animal.
Our technique relies on optical imaging of superoxide production using a systemically injected fluorescent probe compound, dihydroethidium (DHE). Dihydroethidium is an uncharged lipophilic compound that is converted to positively charged products by superoxide radical (Barbacanne et al, 2000; Fink et al, 2004; Fernandes et al, 2007). When administered systemically, DHE distributes rapidly into tissues including the brain (Murakami et al, 1998; Quick and Dugan, 2001) and, if not oxidized, is cleared from tissues and excreted, primarily in urine. However, the oxidation products of DHE (ox-DHE), because of their charge, are retained in cells in the brain for a sustained period of time (Quick and Dugan, 2001). This allows the amount of superoxide produced in a given tissue or cell to be quantified by measurement of the ox-DHE produced over a defined period. Here, studies were carried out to characterize and validate the use of DHE oxidation and whole animal fluorescence imaging to assess brain levels of superoxide in live mice, and to determine the identity and superoxide specificity of the DHE oxidation product using multiple techniques including fluorescence lifetime analyses. We also show the ability to detect and analyze superoxide production in specific brain regions, including cerebellum, hippocampus, and cortex. Finally, we report the development of a novel approach to remove tissue autofluorescence (AF) from the fluorescence intensity image using timedomain information from the fluorescence temporal point spread functions (TPSFs). Using this time-domain-based unmixing protocol, differences in brain superoxide levels were observed in vivo in several mouse models of disease, and in healthy, normal (i.e., nongenetically modified) aged mice. To our knowledge, this is the first reported imaging of either physiologic or pathologic levels of superoxide in brain in the intact animal.
Materials and methods
Imaging System
The eXplore Optix-MX2 system, developed by Advanced Research Technologies (Montreal, Canada), is a multiwavelength optical imaging system with time-domain capabilities for in vivo imaging of fluorescence and bioluminescence in small animals. Our Optix system is configured for imaging at four excitation wavelengths, 470, 635, 670, and 760 nm, with corresponding emission filters, including a 590 nm long-pass installed for the DHE studies. An important feature of the Optix is the pulsed excitation source and the time-resolved detector, permitting measurement of the fluorescence TPSF. The system uses a single source-detector arrangement that is raster scanned across a region of interest of a small animal in reflection mode to obtain the fluorescence TPSF for each pixel. The fluorescence TPSF is then used to calculate the fluorescence intensity and lifetime for each pixel. Specifically, the fluorescence intensity (continuous wave (CW)) is evaluated by temporally integrating the fluorescence TPSF, whereas the fluorescence lifetime is evaluated by fitting a single exponential decay to the tail of the fluorescence TPSF. Approximations are made in this definition of fluorescence lifetime as the decay of the fluorescence TPSF may not be a single exponential and, furthermore, it is influenced by the tissue optical properties, and hence the term effective lifetime is a more precise definition of this imaging parameter.
Dihydroethidium Injection
Intraperitoneal injection of DHE (50 mg/kg) was performed as described (Behrens et al, 2008; Quick et al, 2008). Briefly, DHE stock (1.25 mg/mL) was made fresh in anhydrous dimethylsulfoxide, and kept under low-flow nitrogen gas in the dark. Just before injection, DHE was added to an equal volume of sterile normal saline, mixed, and injected into the lower abdomen ~1 cm lateral to the mid-line. The use of DHE in vivo for repeated imaging requires that there be no toxicity from the DHE injection. Although we were unable to find literature describing either the toxicity of DHE or its LD50, we have the following observations. Mice injected with DHE while awake (i.e., without anesthesia) continued to eat, drink, groom, and move normally, and were indistinguishable from their uninjected cagemates for both short term (days) and long term (months). Thus, we have no evidence for toxicity from DHE per se. We did note that repeated exposure to anesthesia, however, was poorly tolerated, regardless of whether DHE was injected or not. We therefore recommend that mice should only be imaged twice within a 24-hour period if anesthesia is used. We also found that the vehicle for the DHE injectate, dimethyl-sulfoxide, has sedating and hypothermic effects, and hence the current procedure was developed to minimize the amount of dimethylsulfoxide administered. There is also no literature on the toxicity of the product, ethidium, but data on its brominated analog, ethidium bromide, have been reviewed extensively by the National Toxicology Program (part of Health and Human Services, http://ntp.niehs.nih.gov/?objectid=6F5F63F6-F1F6-975E-79965F7EE68AE7C0 and links therein), which found no substantial 2-year bioassay data to support positive or negative health effects in rodents. However, institutional guidelines for the use and disposal of ethidium, which is listed as a mutagen, were followed for all studies.
In Vivo Imaging of Brain
Anesthesia was induced by inhaled isofluorane (3%). After induction, the scalp was shaved using a small animal shaver, and the mouse was positioned prone on the scanner platform. Anesthesia was maintained (0.2%) by isofluorane delivered through a nose-cone installed in the scanner.
Each mouse was individually scanned using a 470 nm excitation laser and a 590 nm long-pass detection filter. The region of interest covering the brain 0.8 cm2) was raster scanned using a step size of 1 mm with 5 second integration time per step, resulting in a total acquisition time of ~7 minutes. To determine the time course of DHE oxidation animals, most mice were scanned before DHE injection, were then injected with DHE, and imaged sequentially at set time intervals up to 1 hour. For longer imaging sessions, mice were removed from the scanner between scans, and allowed to recover from anesthesia before the next scan. All animal experiments were conducted under the protocol approved by the University of California San Diego Institutional Animal Care and Use Committee.
Ex Vivo Imaging of Brain
To allow comparison of ox-DHE fluorescence intensity in brain in situ (through skull and skin) of live mice with the intensity of the ex vivo brains removed immediately after live imaging, mice were intracardially perfused with 4% paraformaldehyde immediately after the last Optix imaging session as described in detail (Quick and Dugan, 2001). Brains were placed on a weighing boat, re-imaged, and then placed in 2% paraformaldehyde for 48 hours. Some brains were then re-imaged several days later to confirm stability of the fluorescence signal after fixation. The settings were identical for all imaging sessions (using the ‘re-use’ function in the Optix software). After the final ex vivo image, after 48 hours of fixation, brains were chilled, mounted on the stage of a vibratome, and sliced coronally, with 100 μm floating sections maintained in 2% paraformaldehyde for 48 hours and then mounted on coverslips for confocal imaging of ox-DHE fluorescence as described (Quick and Dugan, 2001).
Confocal Imaging of Dihydroethidium Oxidation in Slices
Mounted tissue slices were imaged on a LSM510 Meta multiphoton laser confocal microscope (Carl Zeiss, Oberkochen, Germany) using laser excitation at 568 nm, and capturing the specific fluorescence from the DHE oxidation product using a 590 nm long-pass emission filter. With this configuration and settings, there is negligible nonspecific background fluorescence in the DHE channel, confirmed in animals that did not receive DHE injections, but were processed identically to DHE-injected animals. For each tissue slice, eight fields are selected randomly using bright-field optics to avoid bias in field selection, and the fluorescent image is then captured using a × 63 water-immersion objective. All sets of slices from a given study (e.g., young, old, Sod2+/−) were imaged at one sitting to allow valid comparison across conditions.
Image Processing and Analysis of Dihydroethidium Oxidation-Derived Fluorescence
Confocal image analysis was performed using MetaMorph image analysis software as described (Quick and Dugan, 2001; Quick et al, 2008; Dugan et al, 2009). An analyst masked to the treatment analyzed the fluorescence from DHE oxidation in each cell in each image using a software macro setup specifically for this protocol. The average pixel fluorescence intensity from DHE oxidation per cell is obtained and logged into an excel spreadsheet. The average intensity per cell for a specific cell type for each slice is then calculated. Slices from prefrontal cortex and hippocampus were analyzed for regional differences as has been previously reported (Quick and Dugan, 2001; Quick et al, 2008; Dugan et al, 2009).
Autofluorescence Correction of the Intensity (Continuous Wave) Signal
We first measured and defined the AF TPSF, TPSFAF, from control mice not injected with DHE. Figure 2 shows the CW intensity from a control mouse and corresponding fluorescence TPSF (blue curve). We then measured the fluorescence TPSF, TPSFmix, in mice in which ox-DHE fluorescent product was documented to be extensive. Figure 2 shows the CW intensity image from a mouse with high levels of superoxide at 1 hour after DHE injection and the corresponding fluorescence TPSF (green curve), which provided the ox-DHE TPSF, TPSFox-DHE. As a further confirmation of the TPSFox-DHE, specifically, phantom brains made of agar and containing authentic oxidized DHE with salmon sperm DNA were imaged. Salmon sperm DNA was included because ox-DHE exhibits an ~ 20-fold increase in fluorescence and slight spectral shift on binding to DNA or RNA. The phantom gave a TPSFox-DHE identical to that observed in vivo. The contribution to TPSFmix from the TPSFox-DHE was then approximated and defined by TPSFox-DHE = TPSFmix–TPSFAF (see Figure 2, red curve). The fluorescence TPSFs measured from subsequent imaging of mice at pixels (i, j), TPSF(i,j), can then be considered as a weighted sum of these two predefined basis functions, i.e., TPSF(i,j) = x(i,j)· TPSFAF ± Y(i,j) · TPSFox-DHE where x(i,j) and Y(i,j) are the respective weighting coefficients. The final CW intensity maps of AF and ox-DHE are calculated by temporally integrating x(i,j) TPSFAF and y(i,j) TPSFox-DHE, respectively.
Synthesis, Purification, and Analysis of Authentic 2-Hydroxyethidium
Synthesis of 2-hydroxy (2-OH) ethidium was performed by oxidation of dihydroethidium (Invitrogen Eugene, OR, USA) using disodium nitrosodisulfonate (Fremy's salt; Sigma-Aldrich, St Louis, MO, USA) in 0.1 mol/L phosphate buffer, pH 7.4, as described (Zielonka et al, 2005), with minor modifications. After stirring for 1 hour at room temperature in the dark, excess solvent was removed by rotovap. Purification was carried out by six extractions with chloroform/methanol (2:1); excess solvent was again removed by rotovap, followed by silica gel chromatography on a column prewashed with chloroform. Using methanol as eluent, 2-hydroxyethidium eluted as the second red band, which was collected and subjected to high-performance liquid chromatography (Zielonka et al, 2009; see Supplementary Figure 2) and liquid chromatography—mass spectrometry analysis for purity. Liquid chromatography—mass spectrometry confirmed the identity of the two separate peaks as ethidium and 2-hydroxyethidium, respectively (molecular mass: ethidium: 314.3, 2-OH-ethidium: 330.4).
Preparation of Phantom Gelatin Brains With Ethidium and 2-Hydroxyethidium for Fluorescence Lifetime Studies
Small brain-shaped agar phantoms were made by combining in a 15 mL conical tube 0.1 g molecular grade agar and 50 μL salmon sperm DNA in 5 mL phosphate-buffered saline (7.4 pH). These were gently heated in a water bath until the agar dissolved forming a clear viscous solution. When the agar was nearly room temperature, 1 mmol/L ethidium bromide (Sigma-Aldrich) or 1 mmol/L 2-hydroxy-ethidium (final) were added, and the solutions were poured into plastic molds and allowed to set. The agar brains were stored in sealed vials in the dark at 4°C and were imaged on the Optix scanner the same day.
Results
Regional Distribution and Kinetics of Dihydroethidium Fluorescence in Brain In Vivo
To establish the ability of live animal fluorescence imaging of DHE oxidation to provide spatial resolution of defined brain regions, including cerebellum, hippocampus, and forebrain cortex, a series of experiments were carried out to map fluorescence live imaged brains anatomically using Thy1-YFP mice. These mice exhibit intense yellow fluorescent protein expression and fluorescence in hippocampal pyramidal neurons (Brendza et al, 2003). For all studies, the fur was shaved over the skull, and images were then obtained through the intact skin and skull. The region of interest over the entire brain was defined using established mouse stereotactic coordinates, and Thy1-YFP mice were then scanned using the GFP/YFP channel on the eXplore Optix-MX2 imaging system. Two distinct regions of intense yellow fluorescent protein fluorescence were observed that mapped exactly onto the hippocampal formation, as reported by previous anatomic studies (Figures 1A to 1C). We then carried out studies to identify the regional distribution of ox-DHE fluorescence using live-imaged mice previously injected with DHE. To maximize the ability to detect regional ox-DHE fluorescence, mice with two robust sources of superoxide (mitochondria and NADPH oxidase-2 (Nox2)), were used for these studies. Strong ox-DHE fluorescence was observed in the cerebellum, bilateral hippocampal formations, and in the cortical hemispheres both rostral and lateral to the hippocampi (Figure 1D). Thus, ox-DHE-derived fluorescence in hippocampus, cerebellum, and forebrain cortices can be differentiated (Figure 1D, and Supplementary Figure 1).
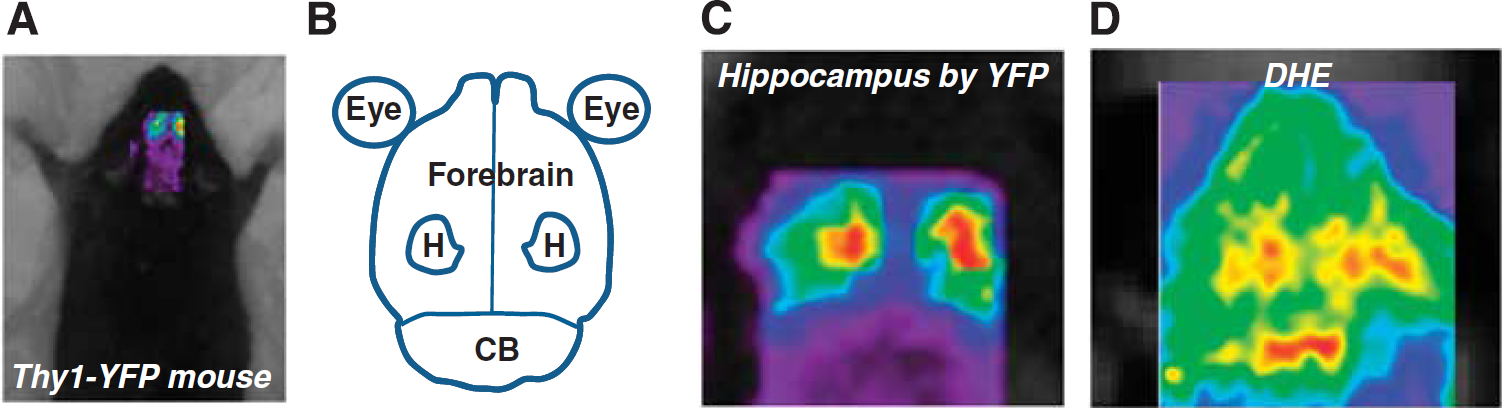
Regional mapping of dihydroethidium (DHE) oxidation in brain. (
To characterize the kinetics of DHE oxidation in brain, anesthetized mice were placed in the scanner before DHE injection for an initial scan in the absence of DHE, and then injected with DHE. Each mouse was imaged at defined times after DHE administration (Figure 2). Ideally, oxidation of the probe compound should be sufficiently rapid to allow imaging to be completed without unduly extending the period of anesthesia, but sufficiently slow to allow maneuvers such as positioning the animal to have minimal impact on the image. We found that although DHE oxidation-derived fluorescence was apparent by 10 minutes after injection, the maximal fluorescence was seen at 60 minutes after injection (Figure 2B). The fluorescence intensity signal then declined over the next hour, and remained stable thereafter (Figure 2B), for at least 8 hours after injection (data not shown).
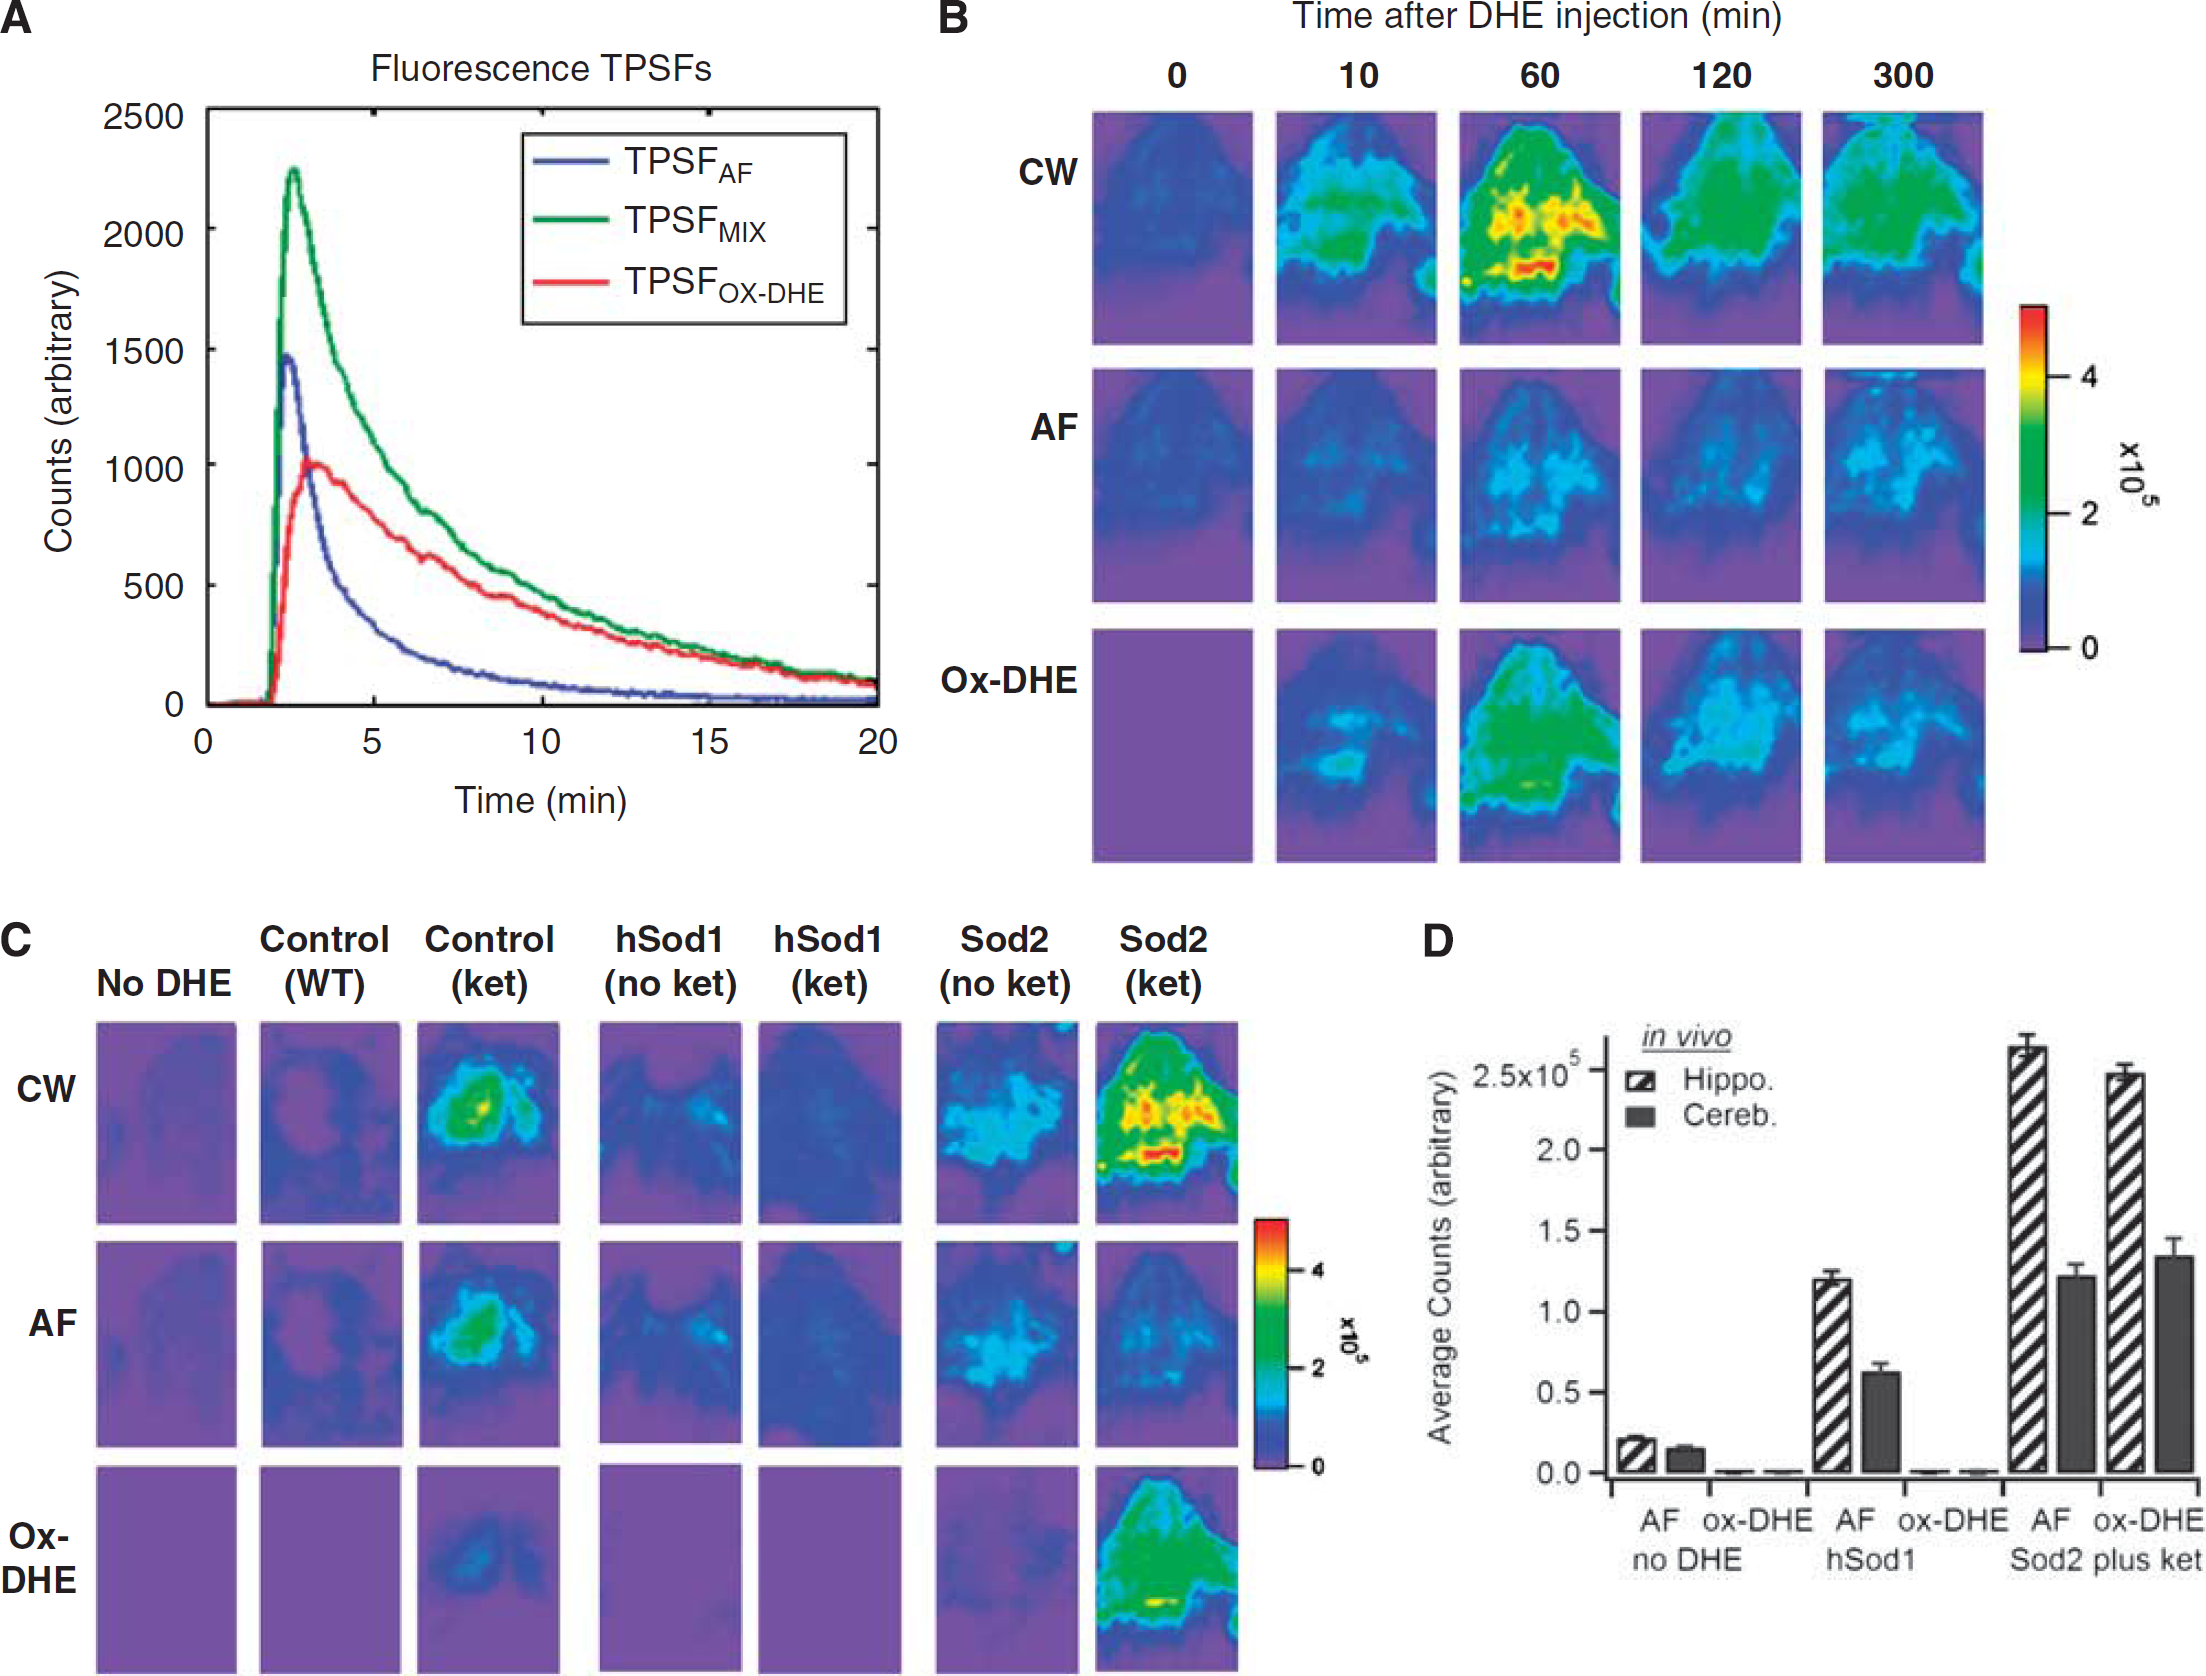
Characterization of the kinetics and superoxide dependence of in vivo dihydroethidium (DHE) oxidation and application of time-domain unmixing. (
Autofluorescence Correction Using Effective Fluorescence Lifetime Unmixing
Tissue AF can confound interpretation of standard fluorescence intensity analysis for a specific fluorophore, and because of the spectral overlap between AF and many fluorescent probes and labels, spectral unmixing can be quite challenging. Here we used a novel approach to remove AF from the fluorescence intensity image, capitalizing on the unique fluorescence lifetimes of a given fluorophore and tissue AF to resolve these components. Our previous work (Hall et al, 2009) showed our ability to decouple two fluorophores in vivo with contrasting lifetime in a somewhat similar manner. We have also been developing associated algorithms for recovering depth, lifetime, and concentration of a fluorophore in vivo (Han and Hall, 2008; Han et al, 2010). Here, we specifically assumed that the measured fluorescence TPSF (TPSFmix) is a weighted sum of the tissue AF (TPSFAF) and ox-DHE fluorescence (ox-DHE, TPSFox-DHE) TPSFs. The known temporal contrast between these fluorescence TPSFs, due to lifetime contrast, enables the measured fluorescence TPSF to be decoupled into separate images of the tissue AF and the fluorophore. In essence, we substitute the wavelength axis of spectral unmixing with the temporal axis of the fluorescence TPSF and perform lifetime unmixing (Figure 2A). Using this lifetime unmixing approach, the fluorescence TPSF data were then processed to decouple the fluorescence intensity image into images of tissue AF and ox-DHE (Figures 2B to 2D). As expected, decoupling the integrated (CW) fluorescence intensity from a mouse that did not receive DHE (Figure 2C, first column) into AF and ox-DHE contributions showed that none of the fluorescence is from ox-DHE, and that all observed fluorescence intensity is because of AF.
Specificity of Fluorescence for Superoxide and Ability to Detect Mitochondrial and Nox2-Derived Superoxide Production
Lifetime unmixing was then applied to a series of mouse models in which superoxide production was altered to reveal the signal specific for ox-DHE (Figures 2C and 2D). Although DHE has been used in both cell culture and animal models to assess cellular superoxide production, there has been debate over the specificity of oxidation for superoxide in certain situations. However, none of those studies were carried out in the intact animal, a fact that could be critical in determining the identity of the oxidation products because of the much lower concentration of tissue oxygen in vivo and the decreased likelihood of having a DHE-to-superoxide ratio sufficiently high to allow two sequential encounters with superoxide. Therefore, to determine how specific ox-DHE fluorescence is for superoxide in vivo, a series of experiments were carried out in mice with genetic modifications of superoxide dismutase, or with documented induction of superoxide production from mitochondria or the inflammatory respiratory burst oxidase (Nox2) (Behrens et al, 2007; Behrens et al, 2008). As expected, unmixing of the hSOD1cje3 mouse fluorescence image into AF and ox-DHE components showed that there was minimal ox-DHE signal; thus, the fluorescence intensity image reflects predominantly tissue AF in these mice. In contrast, unmixing of the signal from mice injected subchronically with ketamine to induce Nox2 showed significant ox-DHE signal (Figure 2C, columns 3 and 7), and this was seen in both wild-type and Sod2+/− animals. Thus, mice in which a cytosolic source of superoxide (Nox2) is induced have increased ox-DHE that is clearly not because of an increase in tissue AF. In contrast, mice that overexpress the cytosolic SOD1 (hSOD1cje3) and fourfold higher cytosolic superoxide dismutase activity than controls should have less superoxide and less DHE oxidation. As expected, hSOD1cje3 mice had essentially undetectable levels of ox-DHE fluorescence at baseline, and failed to exhibit an increase in ox-DHE in response to subchronic ketamine injection (Figure 2C, compare column 3 with column 5), supporting the specificity of DHE oxidation for superoxide in vivo. There was increased ox-DHE fluorescence in Sod2+/− mice, which have a 50% reduction in the mitochondrial superoxide dismutase and thus elevated basal levels of mitochondrial superoxide production (Figure 2C, columns 6 and 7). The ox-DHE signal in the Sod2+/− mouse without ketamine (Figure 2C, column 6) therefore reflects mitochondrial superoxide production, specifically. Correcting for the AF background, the ox-DHE images are much more quantitatively correlated with superoxide levels, with a much greater contrast between the animals with elevated superoxide levels, and those in which little superoxide is being produced; e.g., the two hSOD1cje3 mice and the Sod2+/− mouse have fairly similar CW images, but lifetime unmixing only reveals ox-DHE in the Sod2+/− mouse. Because lifetime unmixing is not affected by the intensity of the signal, even the relatively small superoxide signal from the Sod2+/− mouse was unmasked using this approach. Comparison of the CW, AF, and ox-DHE signals from three sets of animals is shown graphically in Figure 2D, with the mean and s.d. of the AF and ox-DHE contributions for the hippocampus and cerebellum.
Correlation of In Vivo, Ex Vivo, and Slice Confocal Imaging
To correlate the live animal imaging with the level of ox-DHE present in brains ex vivo (thus removing the attenuation inherent in imaging through the skin and skull), brains were removed and imaged post-mortem (Figure 3). In a manner similar to the AF correction used in vivo, ex vivo brains were also corrected for AF with similar results (Figures 3A and 3B). Comparison of the in vivo images (Figure 2C) and ex vivo brains (Figure 3A) suggests that the in vivo images, especially with lifetime unmixing applied, reflect the fluorescence ex vivo. To further show the correlation between in vivo ox-DHE and ox-DHE fluorescence within the brain, slices were prepared from the fixed brains and imaged by confocal microscopy. Photomicrographs of slices from the ex vivo-imaged brains are shown (Figure 3C). Both controls and hSOD1 mice have negligible levels of ox-DHE. In the Sod2+/− mice, in contrast, a strong ox-DHE signal was observed in vivo, in the ex vivo brain, and in the corresponding brain slices. Although the confocal slice images are not corrected for AF, the specific settings used here (excitation Λ 470 nm, emission Λ > 594 nm) provide essentially no detectable AF in the fixed tissue (e.g., no-DHE slice, Figure 3C, left panel). Overexpression of catalase (using Cat+/+ mice) to remove H2O2 had no effect on DHE oxidation (data not shown). Taken together, these points indicate that DHE oxidation in vivo is superoxide dependent, and that this specificity is significantly enhanced by lifetime unmixing of the CW signal, especially when the signal is less intense.
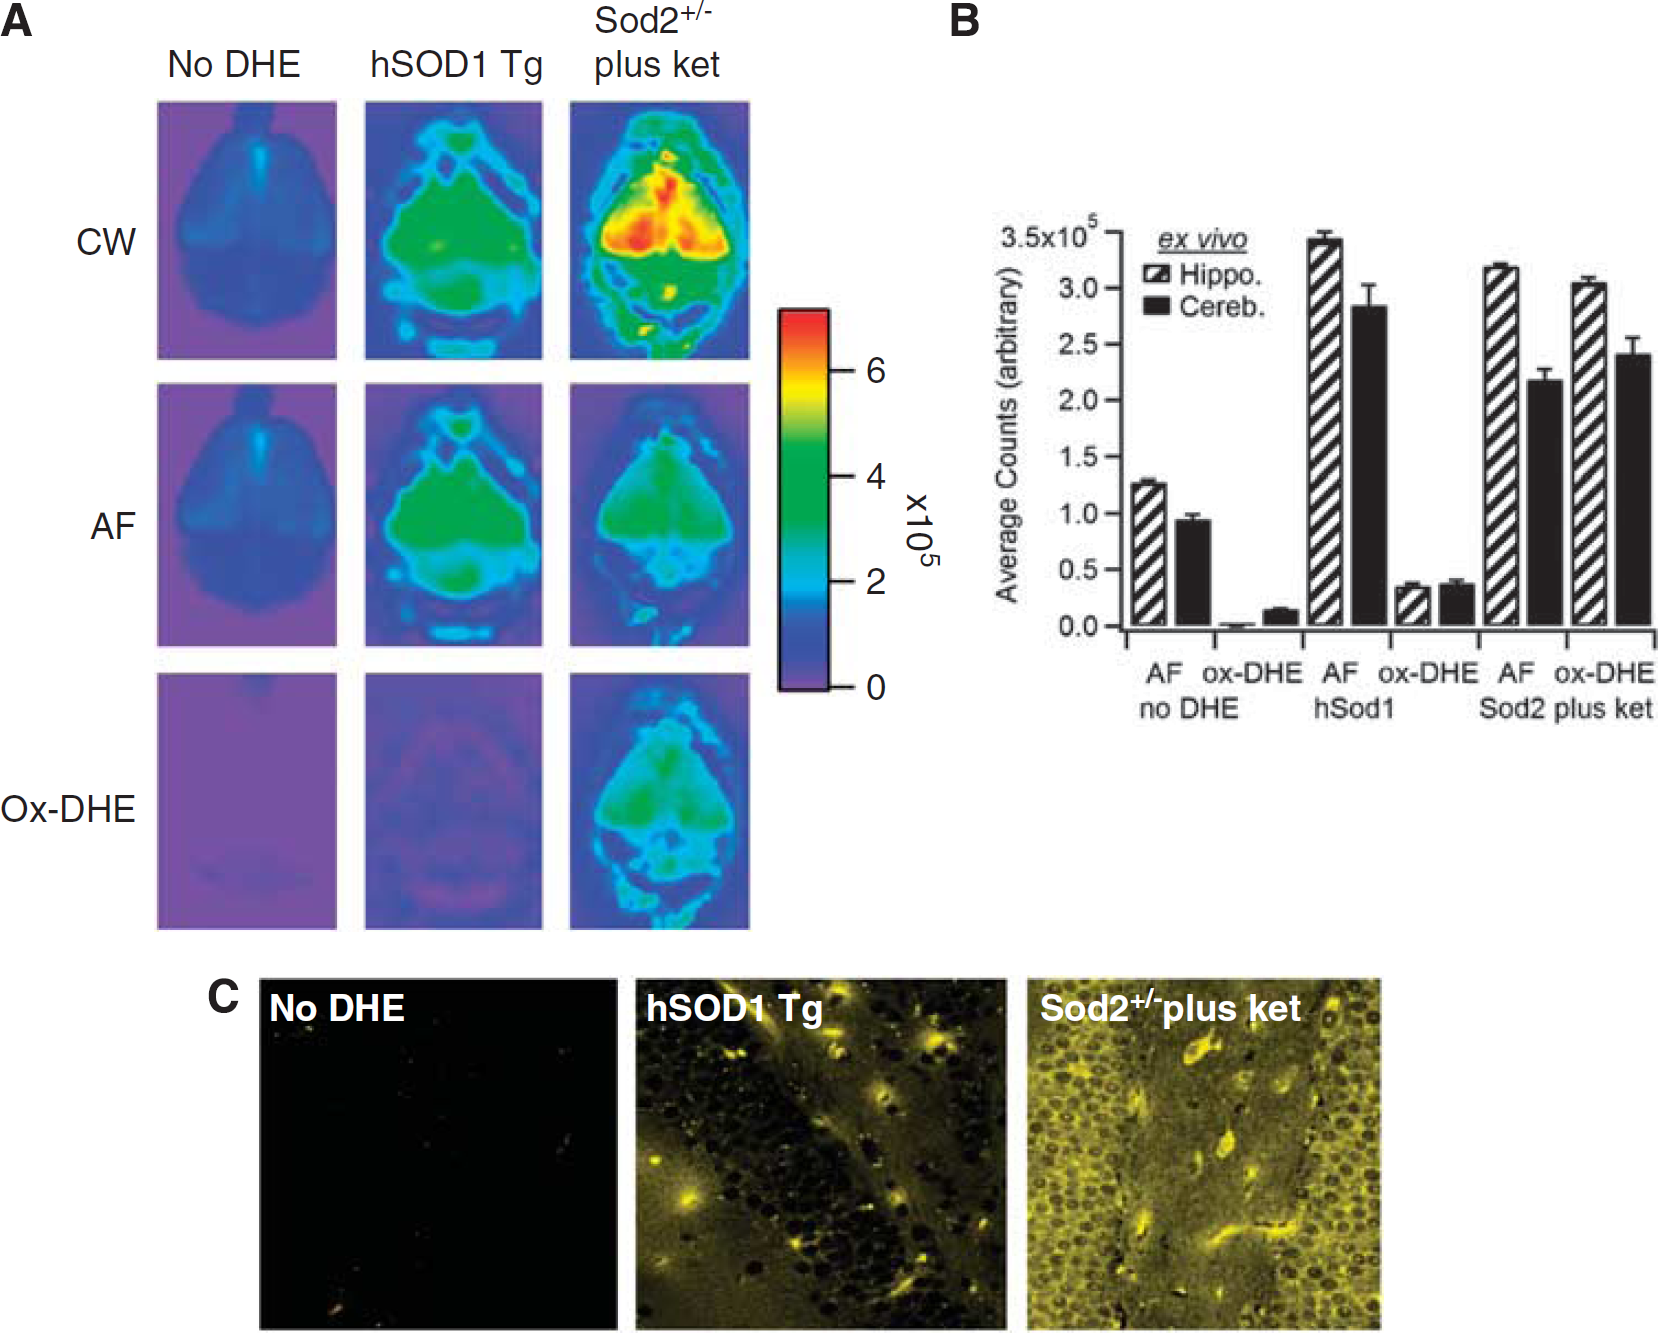
Comparison of in vivo fluorescence with ex vivo brain and confocal slice imaging of oxidized dihydroethidium (ox-DHE). (
Comparison of Dihydroethidium Oxidation in Young Versus Aged Mice
Finally, to establish the usefulness of this technique to discern physiologic levels of brain superoxide, young and aged wild-type mice were evaluated. We and others have previously shown that aged mice have increased production of superoxide from both mitochondria and NADPH oxidases, and that these two sources may produce the majority of superoxide in normal aging brain (Dugan et al, 2009). Figure 4 shows a time course series of ox-DHE fluorescence with CW, AF, and ox-DHE intensities. Young (4 months) mice (Figure 4A) had minimal ox-DHE fluorescence compared with old (27 months) mice (Figure 4B), shown quantitatively in Figure 4C, indicating that enhanced brain superoxide production in ‘normal’ nongenetically modified aged mice can be visualized using this technique. We conclude that this imaging technique is sufficiently sensitive to detect real-time, physiologically relevant levels of brain superoxide.
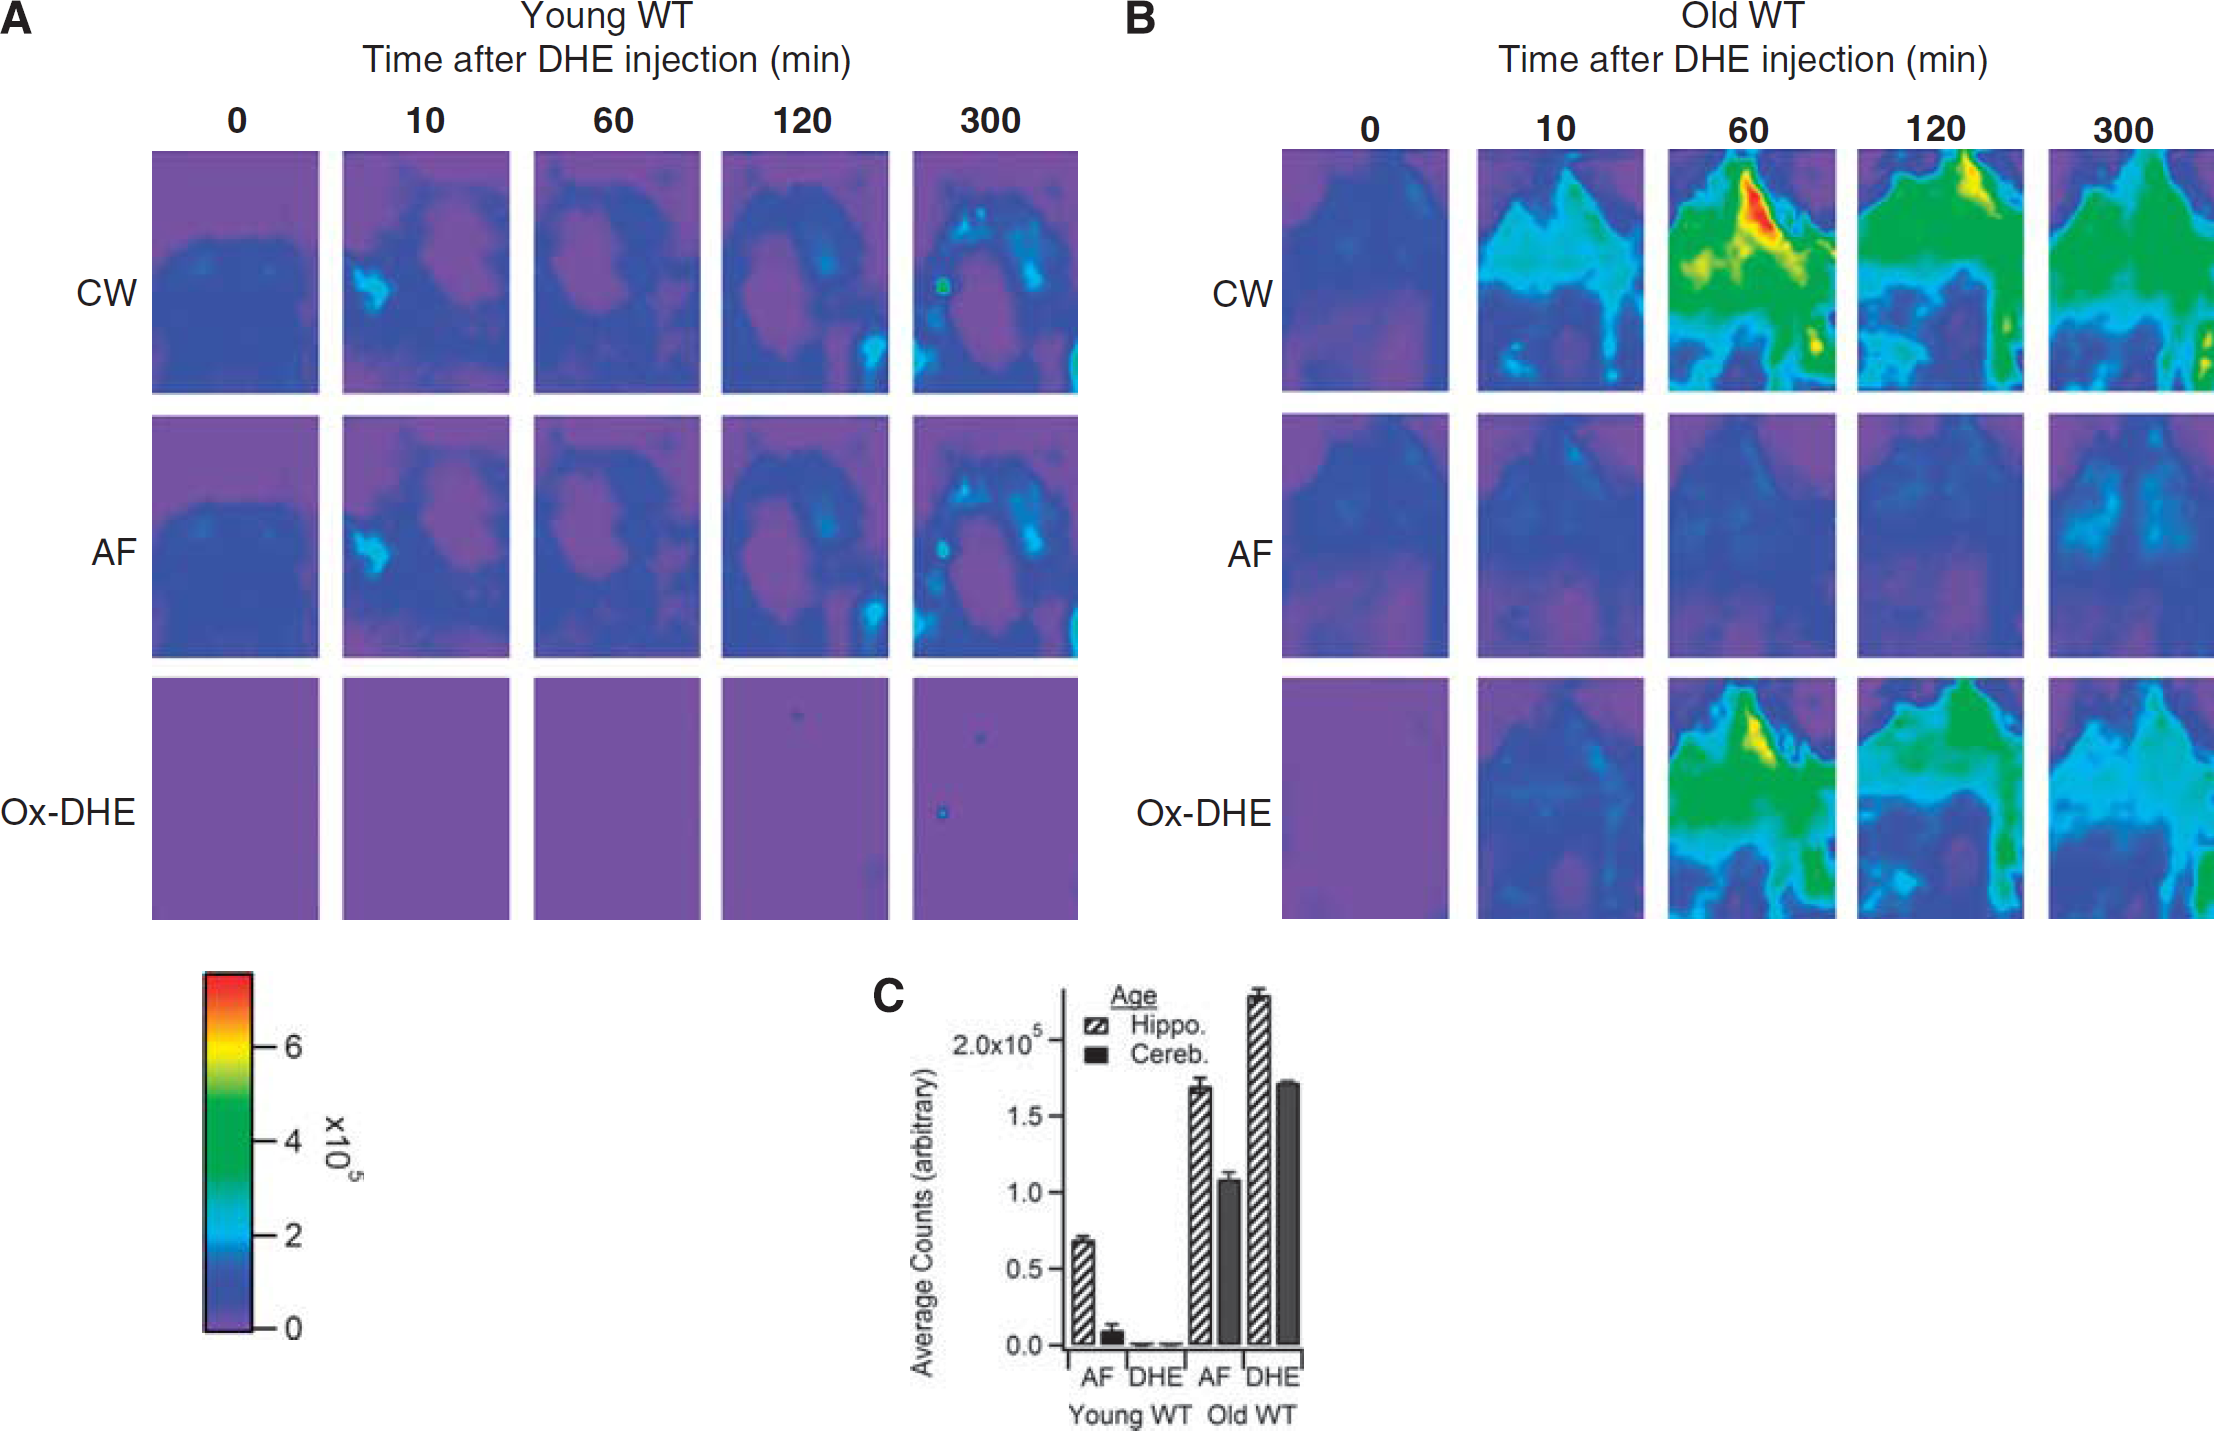
Application of time-domain unmixing reveals increased brain superoxide levels in aged mice. In vivo time series in (
Characterization of the Dihydroethidium Oxidation Product In Vivo by Fluorescence Lifetime Analysis
Superoxide ex vivo can be measured by a variety of techniques, including electron paramagnetic resonance quantitative spectroscopy, cytochrome c reduction, and analysis of oxidation of the lipophilic compound DHE to a fluorescent product that can then be measured fluorime-trically or by high-performance liquid chromatography. However, recent papers have suggested that the specific oxidation product of DHE by superoxide is not ethidium, as previously reported (Benov et al, 1998), but 2-OH ethidium (Zhao et al, 2005). These studies were performed in cell cultures or tissue slices at ambient (21%) oxygen, a condition under which artifactual oxidation of DHE rapidly occurs. Because the physiologic concentration of oxygen in mammals in vivo is < 3% in most organs, we carried out a series of studies to determine whether ethidium or 2-hydroxyethidium was the specific oxidation product of DHE in vivo (i.e., in the intact animal, not cell culture/tissue slice) using several different validated animal models of increased or decreased superoxide. Animals injected with DHE were followed over time, and the fluorescence lifetime (the time in nanoseconds required for loss of the photon) of the oxidation products in brain was determined. We found that a product with a lifetime of 6 ns was produced. The fluorescence lifetimes of ethidium and 2-hydroxyethidium have not been reported, and hence we generated authentic ethidium and 2-hydroxyethidium as described, with modifications (see Materials and Methods). The identity of ethidium and 2-hydroxyethidium was established by high-performance liquid chromatography (Supplementary Figure 2), by their previously reported characteristic absorbance spectra (Supplementary Figure 2), and by liquid chromatography—mass spectrometry. Putative ethidium had the expected molecular mass of ethidium (314.3), and putative 2-hydroxyethidium had the expected molecular mass of 2-hydroxyethidium (330.4). Ethidium, 2-hydroxyethidium, and DHE were then dissolved separately in agar containing salmon sperm DNA and prepared as phantom brains for imaging. A series of phantoms containing different concentrations of ethidium, 2-hydroxyethidium, or DHE were imaged in the Optix scanner to acquire the fluorescence lifetime for each compound. A control phantom brain containing no added fluorophore was also imaged. Authentic 2-hydroxyethidium had a lifetime of 12 ns, whereas ethidium had a lifetime of 6 ns. The lifetime of ethidium corresponded exactly to the lifetime observed in validated mouse models of elevated superoxide, including Sod2-deficient mice (Supplementary Figure 3). Thus, the product of DHE oxidation by superoxide in vivo has the signature fluorescence lifetime of ethidium, but not 2-hydroxyethidium.
Discussion
The method for real-time in vivo imaging of metabolic and inflammatory pathway activation described here provides two independently useful technical advances: use of a dynamic fluorescent probe compound to monitor oxygen metabolism to superoxide, and lifetime unmixing of the intensity signal to isolate fluorescence specific to the oxidation product from that of tissue AF. To date, we have found no published imaging techniques, whether optical or otherwise, that allow tissue superoxide to be monitored noninvasively in living animals in vivo. The use of a fluorescent probe compound DHE, which is highly selective for superoxide to monitor metabolic and inflammatory production of superoxide noninvasively, provides this ability. Although the present study focused on the brain, the technique is not restricted to the nervous system, and other organs, including kidney, liver, and heart, can be visualized (LL Dugan, unpublished data), allowing oxygen metabolism to superoxide to be assessed across organs in the same animal. The protocol also provides the ability to study superoxide levels before and after a stressor (e.g., hypoxia, infection, exercise, restraint) in the same animal, allowing the response over time to be followed. Pre- and post-imaging would also confirm efficacy of a proposed intervention (e.g., antiinflammatory therapies, metabolic modulators) to be confirmed in the same animal. Because this procedure is not disease specific, it should be broadly applicable across animal models, as well as scientific questions and imaging instrumentation/platforms. Although these studies were performed on GE eXplore Optix-MX2 optical imaging system, there are a growing number of commercially available live animal fluorescence imaging systems for which our strategy could be adapted. In addition, miniaturized confocal microscopy systems attached to awake animals have been developed, and the use of DHE as a superoxide probe in animals with mounted miniconfocal systems could provide a means to follow metabolic and inflammatory processes in awake, freely moving animals with potentially cellular resolution. Of note, we have previously carried out multiphoton confocal imaging of brain in live DHE-injected animals, and were able to visualize both neuronal and microglial production of superoxide at the single-cell level (LL Dugan and KL Quick, unpublished data).
A second valuable tool presented here is the use of the fluorescence lifetime to unmix the fluorescence signal from tissue AF in vivo. Lifetime unmixing enhanced the sensitivity and specificity of the DHE technique, and allowed us to show the ability to detect superoxide produced by mitochondria and superoxide generated by NADPH oxidase. Lifetime unmixing also allowed unequivocal identification of superoxide production from specific brain regions, and showed the ability to detect oxygen metabolism to superoxide from both mitochondria and Nox2, separately as well as combined.
The results presented here show application of time-domain fluorescence imaging and lifetime unmixing to resolve tissue AF from the oxidized product of DHE in vivo. Abnormal production or inadequate elimination of reactive oxygen species, including superoxide, has been linked to a range of health conditions, from obesity and diabetes to hypertension and the aging process itself. Therapeutic interventions targeting superoxide at the level of mitochondria or inflammatory cascades are being developed, but superoxide also serves a host of important physiologic functions. Thus, an imaging modality that provides a better understanding of the temporal, spatial, and biochemical contributions of superoxide could provide important insights into normal biology as well as diseases mechanisms and disease processes. The application of lifetime unmixing not only refines the information provided by DHE imaging, but also provides the ability to differentiate multiple fluorophores with overlapping spectra, and to remove confounding AF from the fluorophore-specific signal. We believe this provides a novel tool for in vivo imaging applicable to multiple research questions and models.
Footnotes
Acknowledgements
The authors thank NIH S10 RR22599-01A1, ICMIC NCI-P50-CA128346 and IVISR (DJH), and NIH R21AG030320, the Larry L Hillblom Foundation (LLD), and T35AG026757 (MR) for funding this work, and Greg Shekhtman and Jacinta Lucero for excellent technical assistance. The authors also thank Dr Robert Naviaux, UCSD, for critical review of the manuscript and valuable comments, and Dr Holly Van Remmen, UT San Antonio, for the generous gift of Cat−/− mice.
The authors declare no conflict of interest. Contributions: DJH and LLD designed the project. LLD and MR performed the in vivo and ex vivo imaging experiments. DJH and S-HH conducted the lifetime unmixing. LLD and MR carried out the confocal imaging experiments. AMC and EGI generated and characterized the authentic 2-hydroxyethidium and ethidium samples and phantoms. DJH and LLD wrote the paper.
References
Supplementary Material
Please find the following supplemental material available below.
For Open Access articles published under a Creative Commons License, all supplemental material carries the same license as the article it is associated with.
For non-Open Access articles published, all supplemental material carries a non-exclusive license, and permission requests for re-use of supplemental material or any part of supplemental material shall be sent directly to the copyright owner as specified in the copyright notice associated with the article.