The primary objective of this study was to verify the suitability of reference tissue-based quantification methods of the metabotropic glutamate receptor type 5 (mGluR5) with [11C]ABP688. This study presents in vivo (Positron Emission Tomography (PET)) and in vitro (autoradiography) measurements of mGluR5 densities in the same rats and evaluates both noninvasive and blood-dependent pharmacokinetic models for the quantification of [11C]ABP688 binding. Eleven rats underwent [11C]ABP688 PET scans. In five animals, baseline scans were compared with blockade experiments with the antagonist 1,2-methyl-6-(phenylethynyl)-pyridine (MPEP), and arterial blood samples were drawn and corrected for metabolites. Afterward, saturation-binding autoradiography was performed. Blocking with MPEP resulted in an average decrease of the total distribution volume (VT) between 43% and 58% (thalamus and caudate-putamen, respectively) but had no significant effect on cerebellar VT (mean reduction: −0.01%). Comparing binding potential (BPND) based on the VT with noninvasively determined BPND revealed an average negative bias of 0.7% in the caudate-putamen and an average positive bias of 3.1% in the low-binding regions. Scan duration of 50 minutes is required. The cerebellum is a suitable reference region for the quantification of mGluR5 availability as measured with [11C]ABP688 PET in rats. Blood-based and reference region-based PET quantification shows a significant linear relationship to autoradiographic determinations.
The metabotropic glutamate receptors (mGluRs) are G-protein-coupled receptors modulating synaptic transmission and neuronal excitability (for review see Cartmell and Schoepp, 2000). A dysfunction of the mGluR has been implicated for various neurological and psychiatric disorders.
Group I mGluR (mGluR1 and mGluR5) participate in the neurotoxicity and over excitability during epileptogenesis. Agonists for group I mGluR induced an excessive phospoinositid turnover and acted as convulsives in rodents (Conn and Pin, 1997; Tizzano et al, 1995). An upregulation of mGluR5 was found in hippocampal specimens from patients suffering from pharmaco-resistant temporal lobe epilepsy (Notenboom et al, 2006). Induced clonic seizures were suppressed by systemic application of mGluR5 antagonists in mice (Chapman et al, 2000).
Changes of the mGluR were found in neurodegenerative diseases like the dementia of the Alzheimer's type (for review see Parameshwaran et al, 2008). Further, it has been shown that pharmacological blockade of mGluR5 produces neuroprotection in a variety of models of neurodegeneration (for review see Bruno et al, 2001).
Because of a high interest in modulating mGluR5 activity, several drugs have been developed. Regarding Positron Emission Tomography (PET) imaging purposes, the currently most promising radio-pharmaceutical is 3-(6-methyl-pyridin-2-ylethynyl)-cyclohex-2-enone-O-11C-methyloxime ([11C]ABP688). In contrast with classic orthosteric receptor ligands, [11C]ABP688 binds to the mGLUR5 allosteric-binding site with high selectivity and high affinity (dissociation constant (KD) = 2.3nmol/L). It shows good blood–brain barrier permeability (extraction fraction ∼90%, logP = 2.4), fast kinetics, and nonbrain-permeable peripherally generated radioactive metabolites. [11C]ABP688 has successfully been used for the quantification of mGluR5 in rats and humans in vivo and in vitro (Ametamey et al, 2006, 2007; Hintermann et al, 2007; Wyss et al, 2007; Treyer et al, 2007). However, the methods for quantification of receptor availability implemented so far were dependent on metabolit-ecorrected arterial blood samples as input function.
The purpose of this study was to evaluate the reference tissue methods for [11C]ABP688 to circumvent invasive blood collection procedures in rats for quantifying receptor changes, which will permit repeated scans in the same animal.
Prerequisites for a tissue to be applicable as a reference region are the following: no specific binding in this region, identical nondisplaceable binding as in the target region, and localization behind the blood–brain barrier. Although the latter criteria are common for neuronal tissue, the first assumption is not fulfilled for the mGluR5 in rats as has been shown repeatedly (Patel et al, 2007; Hintermann et al, 2007; Minuzzi et al, 2009). Nevertheless, the ratio of specific binding of target to reference region (8- to 28-fold, see Discussion) is huge. Together with a small ratio of specific binding in reference region to nondisplaceable binding, the specific fraction could be negligible.
The proposed methods were evaluated by invasive in vivo blocking experiments in control rats. The aim was to confirm autoradiographic evidence that the cerebellum of the rat is a suitable reference region for [11C]ABP688 modeling.
In vivo binding experiments at tracer doses and blocking experiments were further verified by autoradiographic experiments in the same animals.
Materials and methods
Animals
Eleven male Sprague–Dawley rats (614 ± 106 g) were used. Rats were housed in a 12-hour light/dark cycle at 21°C, with access to food and water ad libitum; treatment was according to the Guide to the Care and Use of Experimental Animals (2nd edn) of the Canadian Council on Animal Care. The MicroPET imaging protocol was approved by the Animal Care Committee of the McGill University (Montreal, Quebec, Canada).
Five animals were used for baseline and subsequent blockade experiments, with arterial blood sampling of which four were included into autoradiographic evaluation. In addition, one animal without blood sampling underwent autoradiography.
Respiration rate, heart rate, and body temperature were monitored throughout the scan (MP150; Biopac Systems, Goleta, CA, USA).
Arterial Blood Sampling and Tracer Application
For the experiments without blood sampling, the radiotracer was administered as a 0.3-mL bolus injection over 5 seconds into the tail vein.
For the experiments with arterial blood samples, a polyethylene tube (PE50; Beckton Dickinson, Sparks, MD, USA) (catheter length: 10 cm, dead volume: 25 μL) was inserted into the femoral artery under general anesthesia with isoflurane. A venous catheter in the femoral vein served for tracer application. Surgery preceded the dynamic acquisitions by 1 hour. A syringe pump (model 33; Harvard Apparatus, Holliston, MA, USA) was used to infuse 1mL of radiotracer over 90 seconds. The radioligand was diluted in 1mL to reduce later fluid loss by blood sampling. Samples were collected by releasing the blockade of the catheter after discarding the dead volume of the catheter in heparin-coated microtubes by using a custom made three-way stopcock with a dead volume of 10 μL. To prevent coagulation and to substitute the loss of fluid, we flushed the catheter with heparinized saline solution after sampling. All whole blood and plasma samples were weighted to calculate the activity concentration. Targeted volume of whole blood samples was 100 to 150 μL per sample, which added up to 2.2 ± 0.3mL per experiment.
Samples were collected at 0.5, 1, 1.5, 2, 2.5, 3, 5, 10 minutes and in 10-minute intervals thereafter. An additional blood sample was taken before [11C]ABP688 administration, which served for the assessment of the fraction of free tracer in plasma (i.e., unbound to plasma proteins; denoted by fP). Individual fP values were determined by ultra filtration after incubation of whole blood samples with [11C]ABP688.
Metabolite Correction
After quantifying the whole blood and plasma activity concentration, the fraction of intact radioligand of total plasma activity was determined as described earlier (Wyss et al, 2007). Briefly, the intact ligand was bound by solid phase extraction to reversed phase C18 cartridges (Sep-Pak Plus; Waters Corporation, Milford, MA, USA). The cartridges were prewashed with 5mL of water and flushed with the plasma sample diluted in 2.5mL of water. Hydrophilic compounds were then eluted with 5mL of water, and the cartridge was flushed with 10mL of air to clear from fluid. The cartridge and a 1-mL fraction of the flushing fluid were then measured in the well counter. Metabolite analysis was performed for each blood sample. Previous test revealed that the retention of the parent compound in solvent to the cartridge (recovery factor) was between 91% and 96%. Therefore, the time course of the fraction of parent compound was normalized to the first sample and was fitted by nonlinear regression analyses (f(t) = 1/(1+a × t∧b)∧c+d). This fit was subsequently used to generate metabolite-corrected plasma curves. In the blocking experiment, radiolabeled metabolites from the preceding baseline experiment were already present in the first sample. Therefore, the recovery factor from the baseline experiment was used to correct for the incomplete retention of the cartridge.
Positron Emission Tomography Acquisition and Reconstruction
The PET measurements were performed on a Siemens MicroPET R4 scanner (Siemens-CTI, Knoxville, TN, USA), which has a spatial resolution at the center of the field of view of 1.84mm full width at half maximum in the axial direction and 1.66mm full width at half maximum in the radial and tangential directions (Knoess et al, 2003). Animals lay in prone position with the head immobilized by both the body holder and the nose cone of the anesthesia system with 2% isoflurane at 0.5L/min oxygen flow. The brain was positioned in the center of the field of view. A 10-minute 57Co-transmission scan was acquired to correct for attenuation. Total acquisition time was 60minutes.
List mode data were framed into a dynamic sequence of 12 × 10 seconds, 3 × 20 seconds, 3 × 30 seconds, 3 × 60 seconds, 3 × 150 seconds, and 9 × 300 seconds frames. Sixty-three slices of 1.2115-mm thickness (pixel size = 0.599891 × 0.599891 mm2, 128 pixels) were reconstructed by filtered back projection (Ramp filter, cutoff = 0.5) after Fourier rebinning into 2D sinograms. Data sets were corrected for random coincidences, scatter radiation, and attenuation.
Image Analysis
Coregistration of an integrated image to a cryosection-based rat template (Rubins et al, 2003) was performed manually by rigid body transformation based on anatomical landmarks using the software package PMOD (version 2.9; PMOD Group, Zurich, Switzerland, http://www.pmod.com). After checking for potential head movements, the transformation matrix was applied to each frame.
Regional time–activity curves (TACs) based on volumes of interest defined on the rat template were calculated for the following brain regions: cerebral cortex (mean total volume of left and right side = 0.79 mL), frontal/cingulate cortex (0.05 mL), hippocampus (0.178 mL), thalamus (0.124 mL), caudate-putamen (0.155 mL), and cerebellum (0.244 mL). The defined regions were sized to cover the entire anatomical structure.
Kinetic Models
Although receptor density is the parameter of interest, the maximal number of receptors available for binding (Bavail) cannot be determined in a single injection PET study. Therefore, the outcome parameters that are directly proportional to Bavail have been proposed: equilibrium total distribution volume (VT) and binding potential (BPND) (Innis et al, 2007). The VT is composed of the specific distribution volume (VS, equal to fPBavail/KD) and the distribution volume of free and nonspecifically bound ligand (VND). While VT is dependent on blood sampling, BPND refers to a region without or negligible specific binding. Herein, the ratio of VT/VND−1 is also linearly related to Bavail. The cerebellar cortex is used as reference region for [11C]ABP688 PET. The VT was determined by the following models: (1) standard two-tissue compartment model (2TCM) with blood volume fixed at 0.03 mL/cm3 (Adam et al, 2003) (2TCM); (2) as proposed by Wyss et al for [11C]ABP688 the 2TCM with fixed values (determined by coupled fitting for all regions) for K1/k2 and k4; and (3) Logan's graphical analysis (GA) with a time of linearization t* = 10 minutes (Logan et al, 1990). The arterial input function was shifted relative to the brain tissue response because of the time delay imposed by the length of catheter used for blood sampling. The delay was fitted previous to the modeling and kept fixed for the further analyses.
The BPND was determined by the following methods: (1) calculating the distribution volume ratio from the 2TCM (Mintun et al, 1984); (2) the simplified reference tissue model (SRTM) (Lammertsma and Hume, 1996); (3) its two-step simplified version (SRTM2) (Wu and Carson, 2002); (4) multilinear reference tissue model (MRTM) (Ichise et al, 2003); (5) its two-parameter version (MRTM2) (Ichise et al, 2003); and (6) noninvasive Logan's GA (NIGA) with a t* = 10 minutes (Logan et al, 1996). Selection of t* was based on visual inspection of the residual plot. If the model was dependent on a predetermined k2′, the average of low-noise regions from the SRTM/MRTM was used (Ichise et al, 2003). For MRTM2, different t* (0, 13, and 30 minutes) were evaluated for its bias compared with the BPND calculated using 2TCM VT. This was necessary as the reference region was best fitted by a 2TCM, which violates in a strict sense the use of t* = 0 minute. Parametric images were generated representing VT by the GA and BPND and R1 (ratio of ligand delivery to target and reference region) by the MRTM2 model.
The Akaike Information Criteria were used to assess the goodness-of-fit with a penalty for increasing the number of parameters in the model.
Time Stability
To test the dependency of the different methods of quantification of the scanning time, the stability and accuracy were analyzed by repeating the process with shortened scan durations in steps of 5 minutes (i.e., by iteratively omitting the last PET frames). The outcome parameters were normalized to the value obtained from the 60 minutes scan analysis for all scans with blood sampling.
Blocking Experiments
To evaluate cerebellum as a possible reference region, the specific binding was blocked after a baseline scan by the antagonist 1,2-methyl-6-(phenylethynyl)-pyridine (MPEP). It was administered by slow intravenously infusion directly after the first scan with a dose of 6 mg/kg body weight in a 10−2 mol/L saline solution. The blockade scan was started on average 18 ± 10 minutes after infusion of MPEP, which resulted in an average time difference of 78 minutes between first and second [11C]ABP688 injection. We did not observe any alterations of the physiological parameters monitored.
Radioligands and Chemicals
[3H]ABP688; specific activity (2738 GBq/mmol) was purchased from Amersham/GE Healthcare Biosciences (Little Chalfont, Buckinghamshire, UK). All other chemicals were of reagent grade and obtained commercially.
[11C]ABP688 was synthesized by reacting the sodium salt of desmethyl-ABP688 (ABX (Radeberg, Germany) desmethyl-ABP688 with NaOH) in anhydrous dimethyl-sulfoxide with [11C]methyl iodide at 90°C for 5 minutes. The product was purified by semipreparative high-performance liquid chromatography (Waters, μBondapak, C18; mobile phase, acetonitrile: 0.1% phosphoric acid (30:70); flow rate, 2 mL/min), and the retention time was 10 minutes. After removal of the high-performance liquid chromatography solvent by evaporation, the product was formulated using 9mL of phosphate buffer and 1mL EtOH. TLC: CH2Cl2:MeOH:AOAc (7:2:1). The radiochemical purity was > 99%.
For the blockade experiments at the start of the first scan, the mean specific radioactivity was 5.2 ± 4 GBq/μmol (range = 1.7 to 9.9 GBq/μmol) and 0.39 ± 0.36 GBq/μmol (range = 0.1 to 1.0 GBq/μmol) at the second scan. The mean injected radioactivity at first scan was 17.3 ± 6.6MBq (range = 8.9 to 25.3 MBq) and at second scan was 9.3 ± 3.9MBq (range = 6 to 13 MBq). The mass of injected ABP688 per body weight at first scan was 7.8 ± 5.9 nmol/kg (range = 3.5 to 17.8 nmol/kg) and at second scan was 61.1 ± 35.3 nmol/kg (range = 12.8 to 109.2 nmol/kg).
For the experiments used for the noninvasive modeling, the mean specific radioactivity was 6.4 ± 3.8 GBq/μmol (range = 1.7 to 13.8 GBq/μmol). The Mean injected radioactivity was 14 ± 6.6MBq (range = 3.9 to 25.3 MBq), and the mass 4.9 ± 4.was 3 nmol/kg (range = 1.7 to 17.8 nmol/kg).
Autoradiography
Rats (n = 5) were decapitated, their brains rapidly removed, frozen in 2-methylbutane (−40°C), and stored at −80°C. Ten brain sections per rat (20 μm thick) were thaw mounted onto poly-L-lysine-coated slides and stored at −80°C After a preincubation in N2 Hepes buffer (30 mmol/L; pH 7.4 containing 40 mmol/L NaCl, 5 mmol/L KCl, 2.5 mmol/L CaCl2 and 1.2 mmol/L MgCl) for 15 minutes at room temperature, 10 sections per rat were incubated (65 minutes; room temperature) in buffer containing seven different concentrations of [3H]ABP688. For the assessment of nonspecific binding, three slices per section were incubated with MPEP (10 μmol/L) in the medium. After three washes in incubation buffer (5 minutes, 4°C) and a rapid rinse in ice-cold water (15 seconds), the sections were dried with a stream of air (room temperature). Sections were then dried further in a vacuum container with formaldehyde powder for mild fixation (20 hours). Specific binding was calculated as the difference of total and nonspecific binding. Labeled sections were placed on phosphor-imaging plates (BAS 2025; Fuji, Japan), with industrial tritium activity standards (Amersham Biosciences, Piscataway, NJ, USA). On exposure, the plates were scanned with a plate reader (spatial resolution of 50 mm; BAS 5000; Fuji). The digital receptor autoradiography was processed using image analysis software (Image Gauge 4.0; Fuji) defining regions of interest (ROIs) according to a standard rat brain atlas (Paxinos and Watson, 1998) on each of the 10 sections per brain processed. The average area covered by the ROI were cerebellum 35.7 mm2; frontal/cingulate cortex 5.4 mm2; cortex 50.2 mm2; hippocampus (left and right) 5.6 mm2; thalamus 18.8 mm2; caudate-putamen (left and right) 10.9 mm2.
Statistics
All reported average values are mean ± s.d. Comparison of imaging outcomes across brain regions were conducted using one-way repeated analysis of variance followed by pairwise comparison corrected for multiple testing according to Bonferroni. Pearson's product-moment correlation coefficient and linear regression were conducted using SPSS (version 11.5; SPSS Inc., Chicago, IL, USA).
Results
Metabolite-Corrected Plasma Kinetic Analyses: Baseline and Blocking Experiments
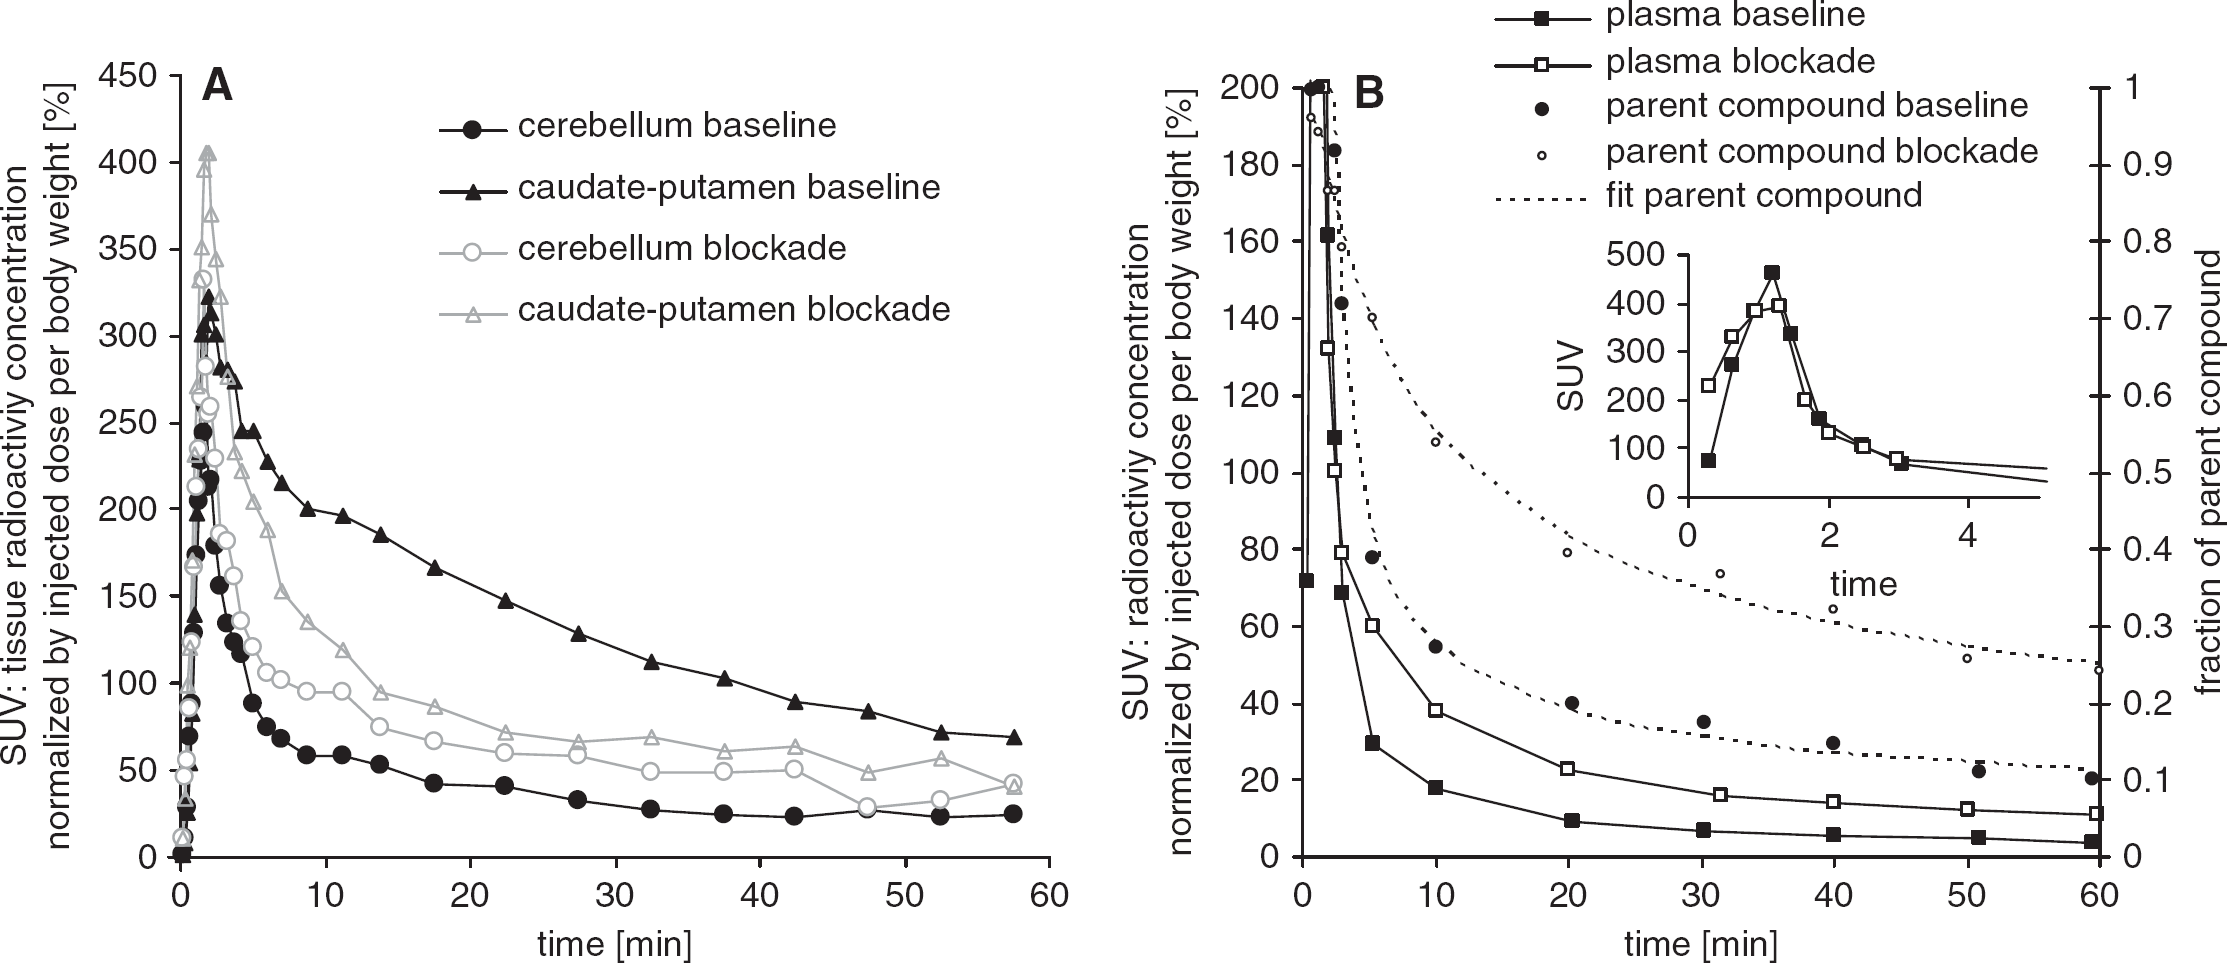
Figure 1 shows representative TACs of cerebellum and caudate-putamen for the baseline and blockade experiment with MPEP (Figure 1A). The TACs of the plasma concentration of the parent compound and the fraction of metabolites are shown in Figure 1B. Ligand concentrations increased in plasma and tissue linearly until the pump stopped after 90 seconds and decreased rapidly thereafter. No metabolism of [11C]ABP688 could be observed up to 60 seconds after injection. Parent compound was reduced to a fraction of 0.5 after ∼5 minutes and to 0.14 ± 0.03 after 60 minutes in the baseline and to 0.5 after 12 minutes and 0.25 ± 0.08 in the blockade experiment. The fraction of intact ligand in the blockade experiment amounted in the first samples after injection only to 0.91 ± 0.03 because of the presence of metabolites from the previous baseline experiment. Metabolite data could well be fitted by the equation proposed in the Materials and methods section. The ratio of plasma to whole blood activity peaked after 2 minutes (1.39 ± 0.13) and reached a steady state after 20 minutes being 1.10 ± 0.07 in baseline and 1.18 ± 0.08 after blockade. Plasma free fraction was on average 14.4% ± 5.6%.
Kinetics of the baseline (filled marks) and the 1,2-methyl-6-(phenylethynyl)-pyridine (MPEP) blockade experiment (open marks) of a representative control rat. (A) Relative time–activity curves of a high-binding region (caudate-putamen) and the reference region (cerebellum) normalized by injected dose and body weight. (B) Metabolite-corrected plasma time–activity curves (boxes, left y axis) and the fraction of nonmetabolized ligand (circles, right y axis). The dashed lines represent the respective fits. The small insert shows the plasma peak in the first minutes. Plasma activities are normalized to injected dose and body weight.
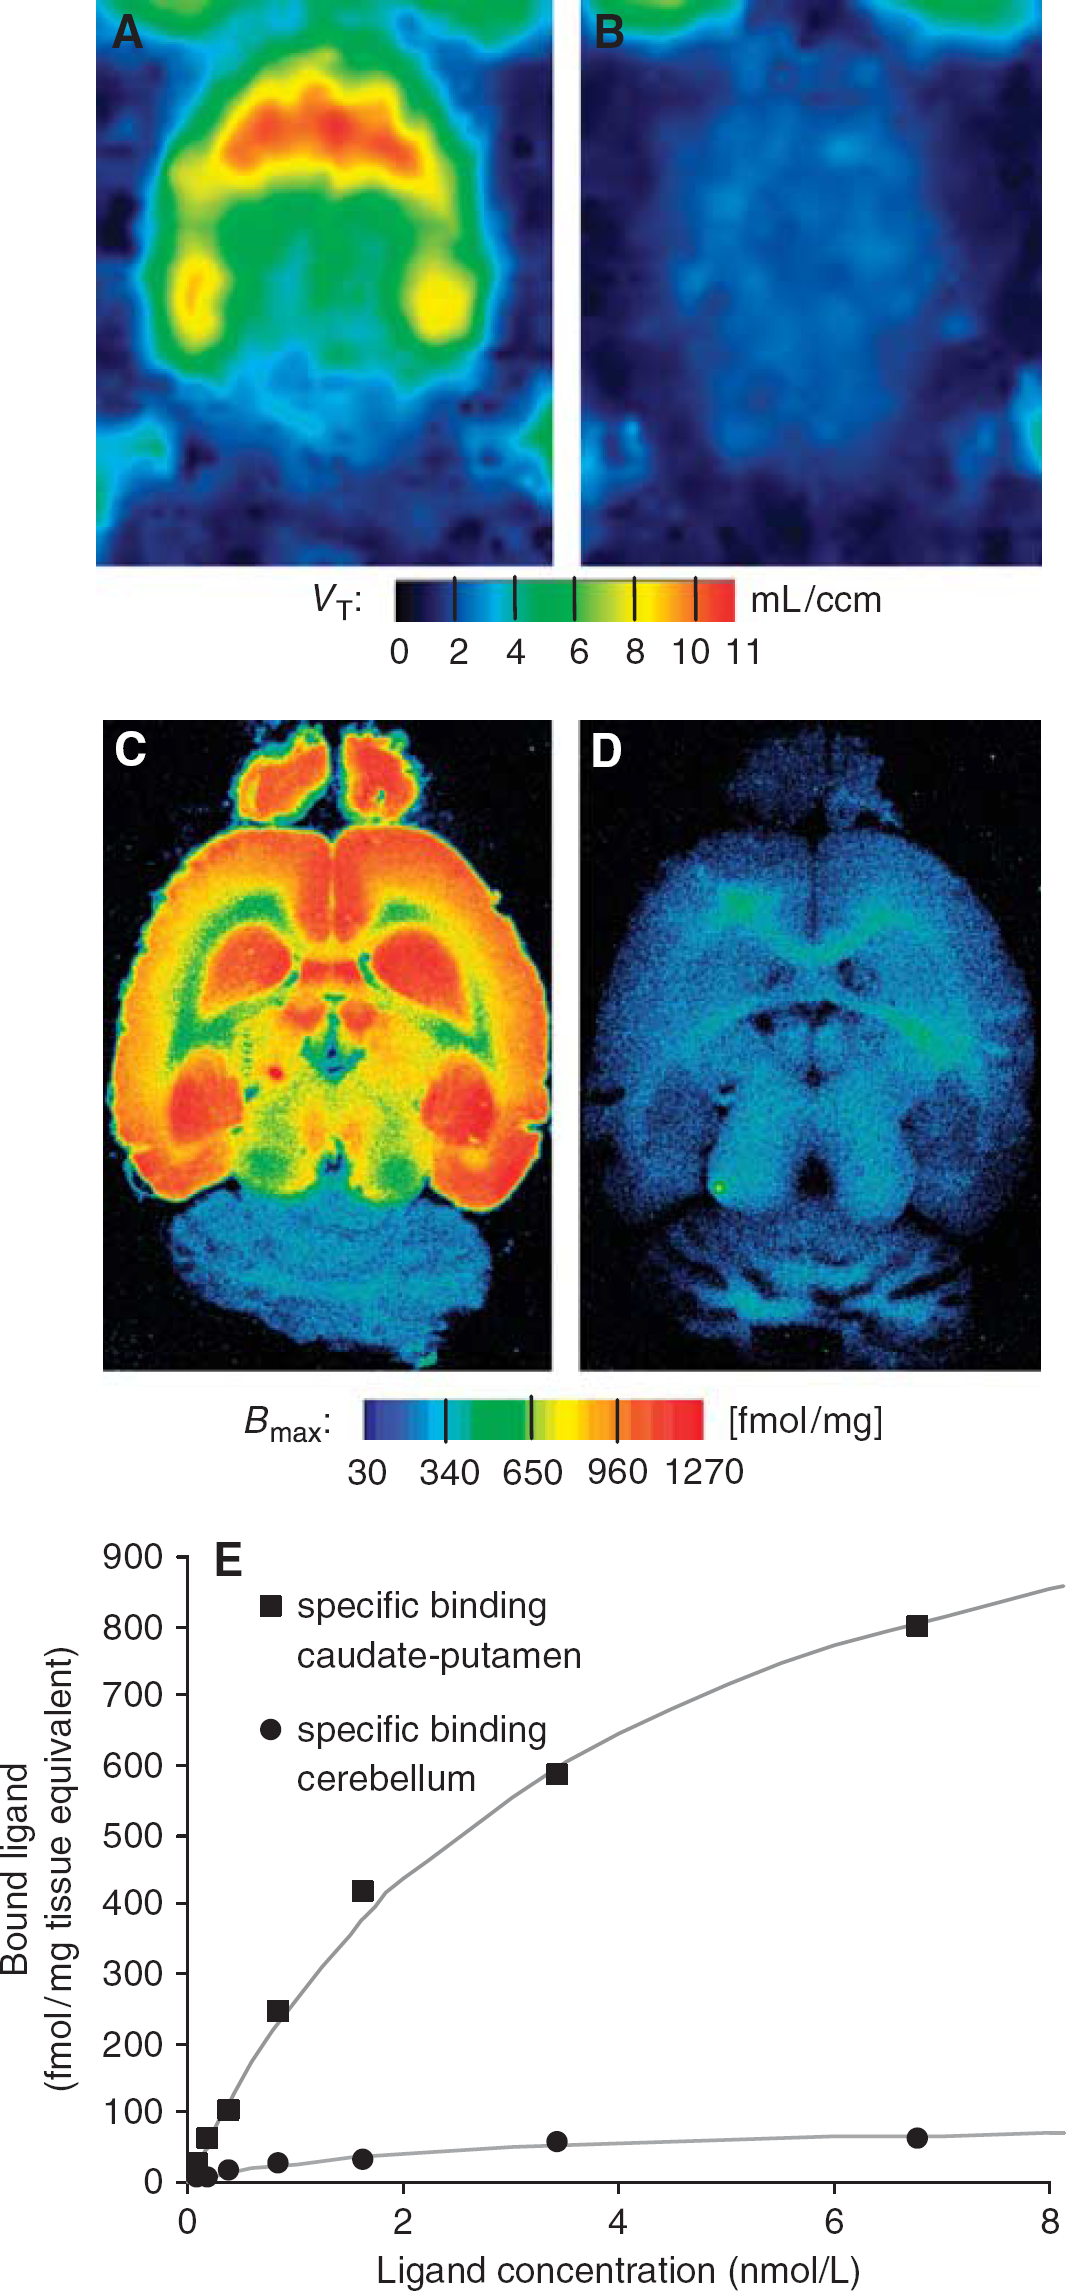
Figures 2A and 3 depict the typical distribution of mGluR5 in the rat brain, which is in good accordance to the distribution pattern in autoradiography (Figure 2C) of the same animal and of studies using different ligands (Patel et al, 2007).
Effect of blockade with 1,2-methyl-6-(phenylethynyl)-pyridine (MPEP). Horizontal sections of the same rat brain representing the metabotropic glutamate receptor type 5 (mGluR5) distribution and nonspecific binding at the level of caudate-putamen and hippocampus as detected in vivo and in vitro by: [11C]ABP688 positron emission tomography (A, B) and [3H]ABP688 autoradiography (C, D). In vivo total distribution volume (VT) parametric image generated with Logan's graphical analysis before (A) and after (B) blockade with MPEP. Rat brain autoradiogram (at 2 nmol/L concentration of [3H]ABP688) shows receptor total binding (C) and nonspecific binding in the presence of the antagonist MPEP (D) in two adjacent sections. (E) Autoradiographic saturation-binding experiment with [3H]ABP688. Displayed are the characteristics of the caudate-putamen (high-binding region) and cerebellum used as reference for the positron emission tomography experiments. Data are from the same animal as in (A–D).
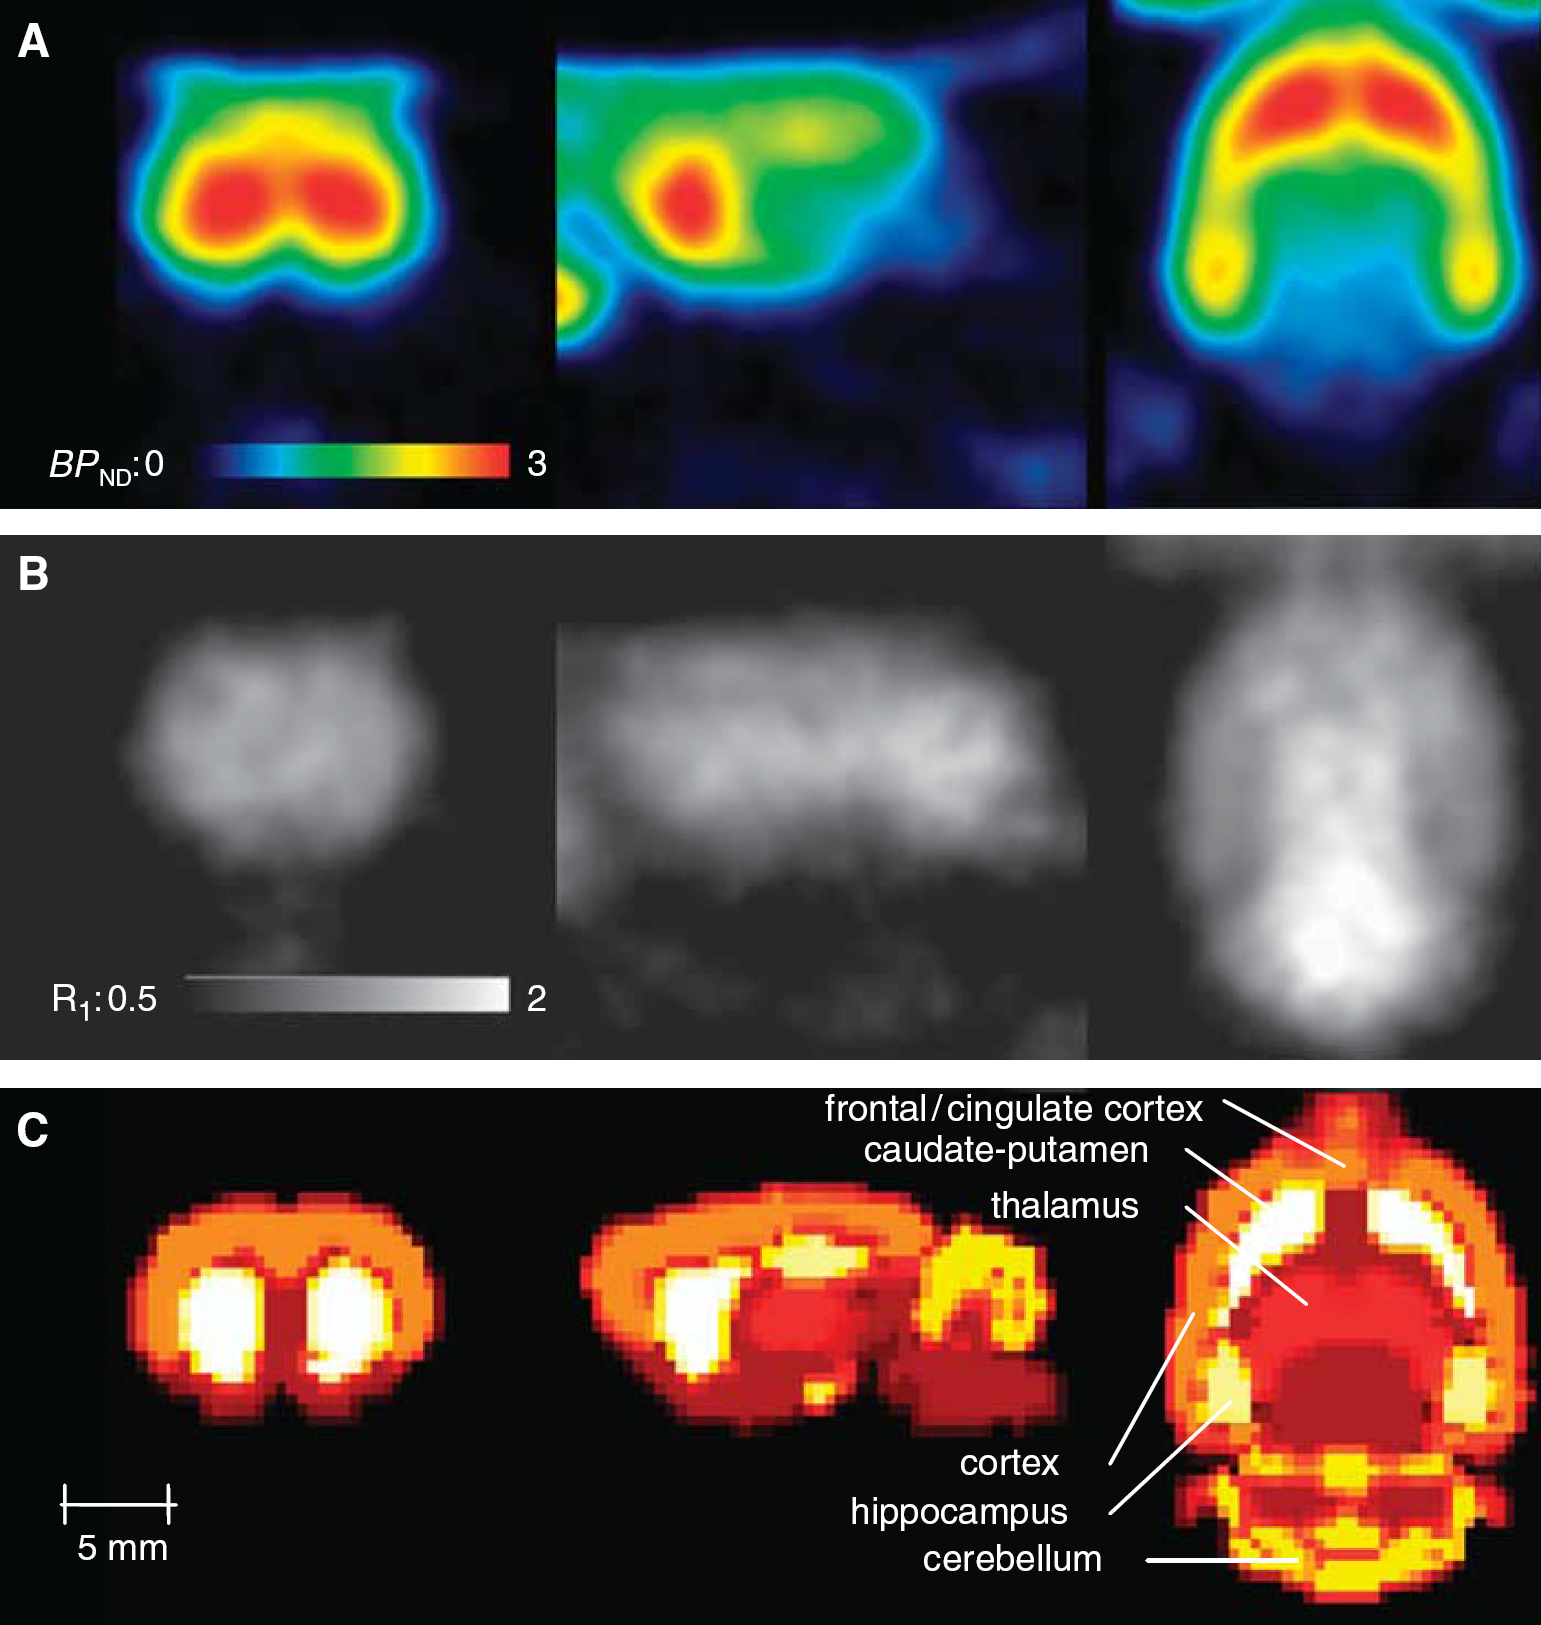
Coronal (left column), sagittal (middle column), and horizontal (right column) sections displaying parametric images of (A) the binding potential (BPND) and (B) the relative [11C]ABP688 delivery (R1) generated by voxel-wise application of the multilinear reference tissue model (MRTM2). Shown are average images of 11 normal control rats coregistered to a rat brain template (C).
The 2TCM without fixing K1/k2 and k4 or only k4 showed superior fitting compared with 2TCM with constraints as judged by lower values of the Akaike Information Criteria in all regions. Therefore, the standard 2TCM was used for all subsequent analyses.
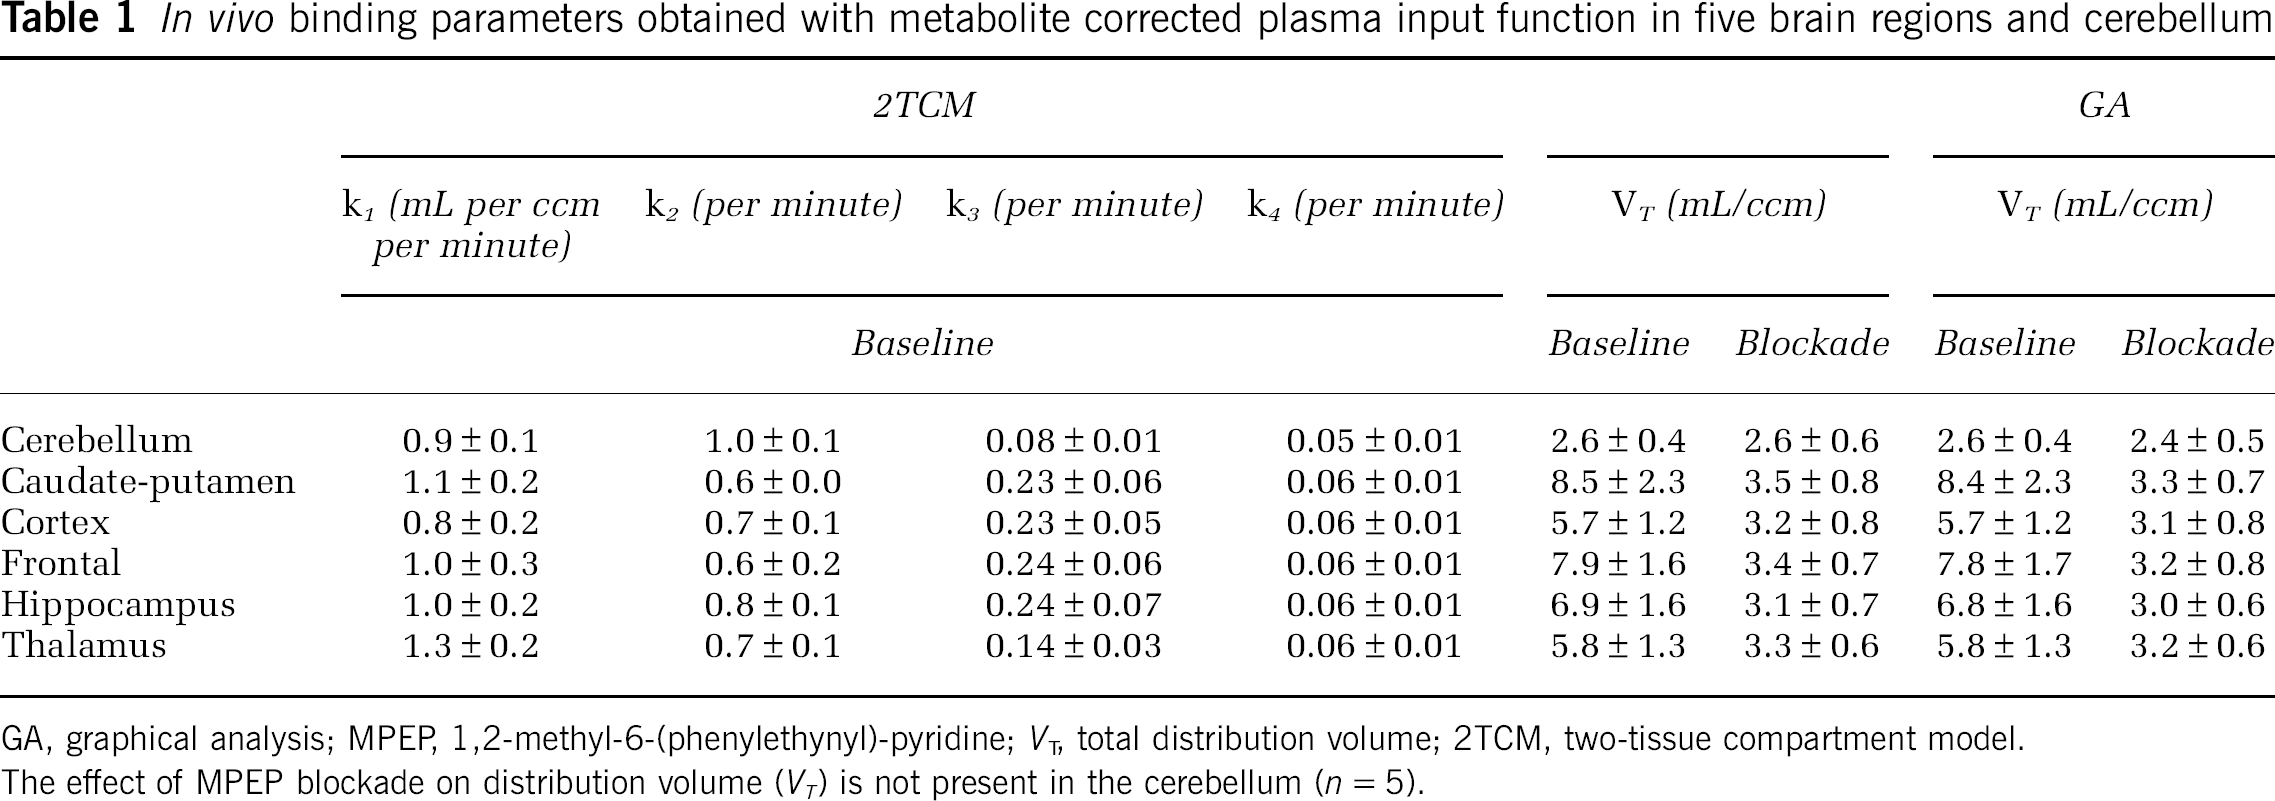
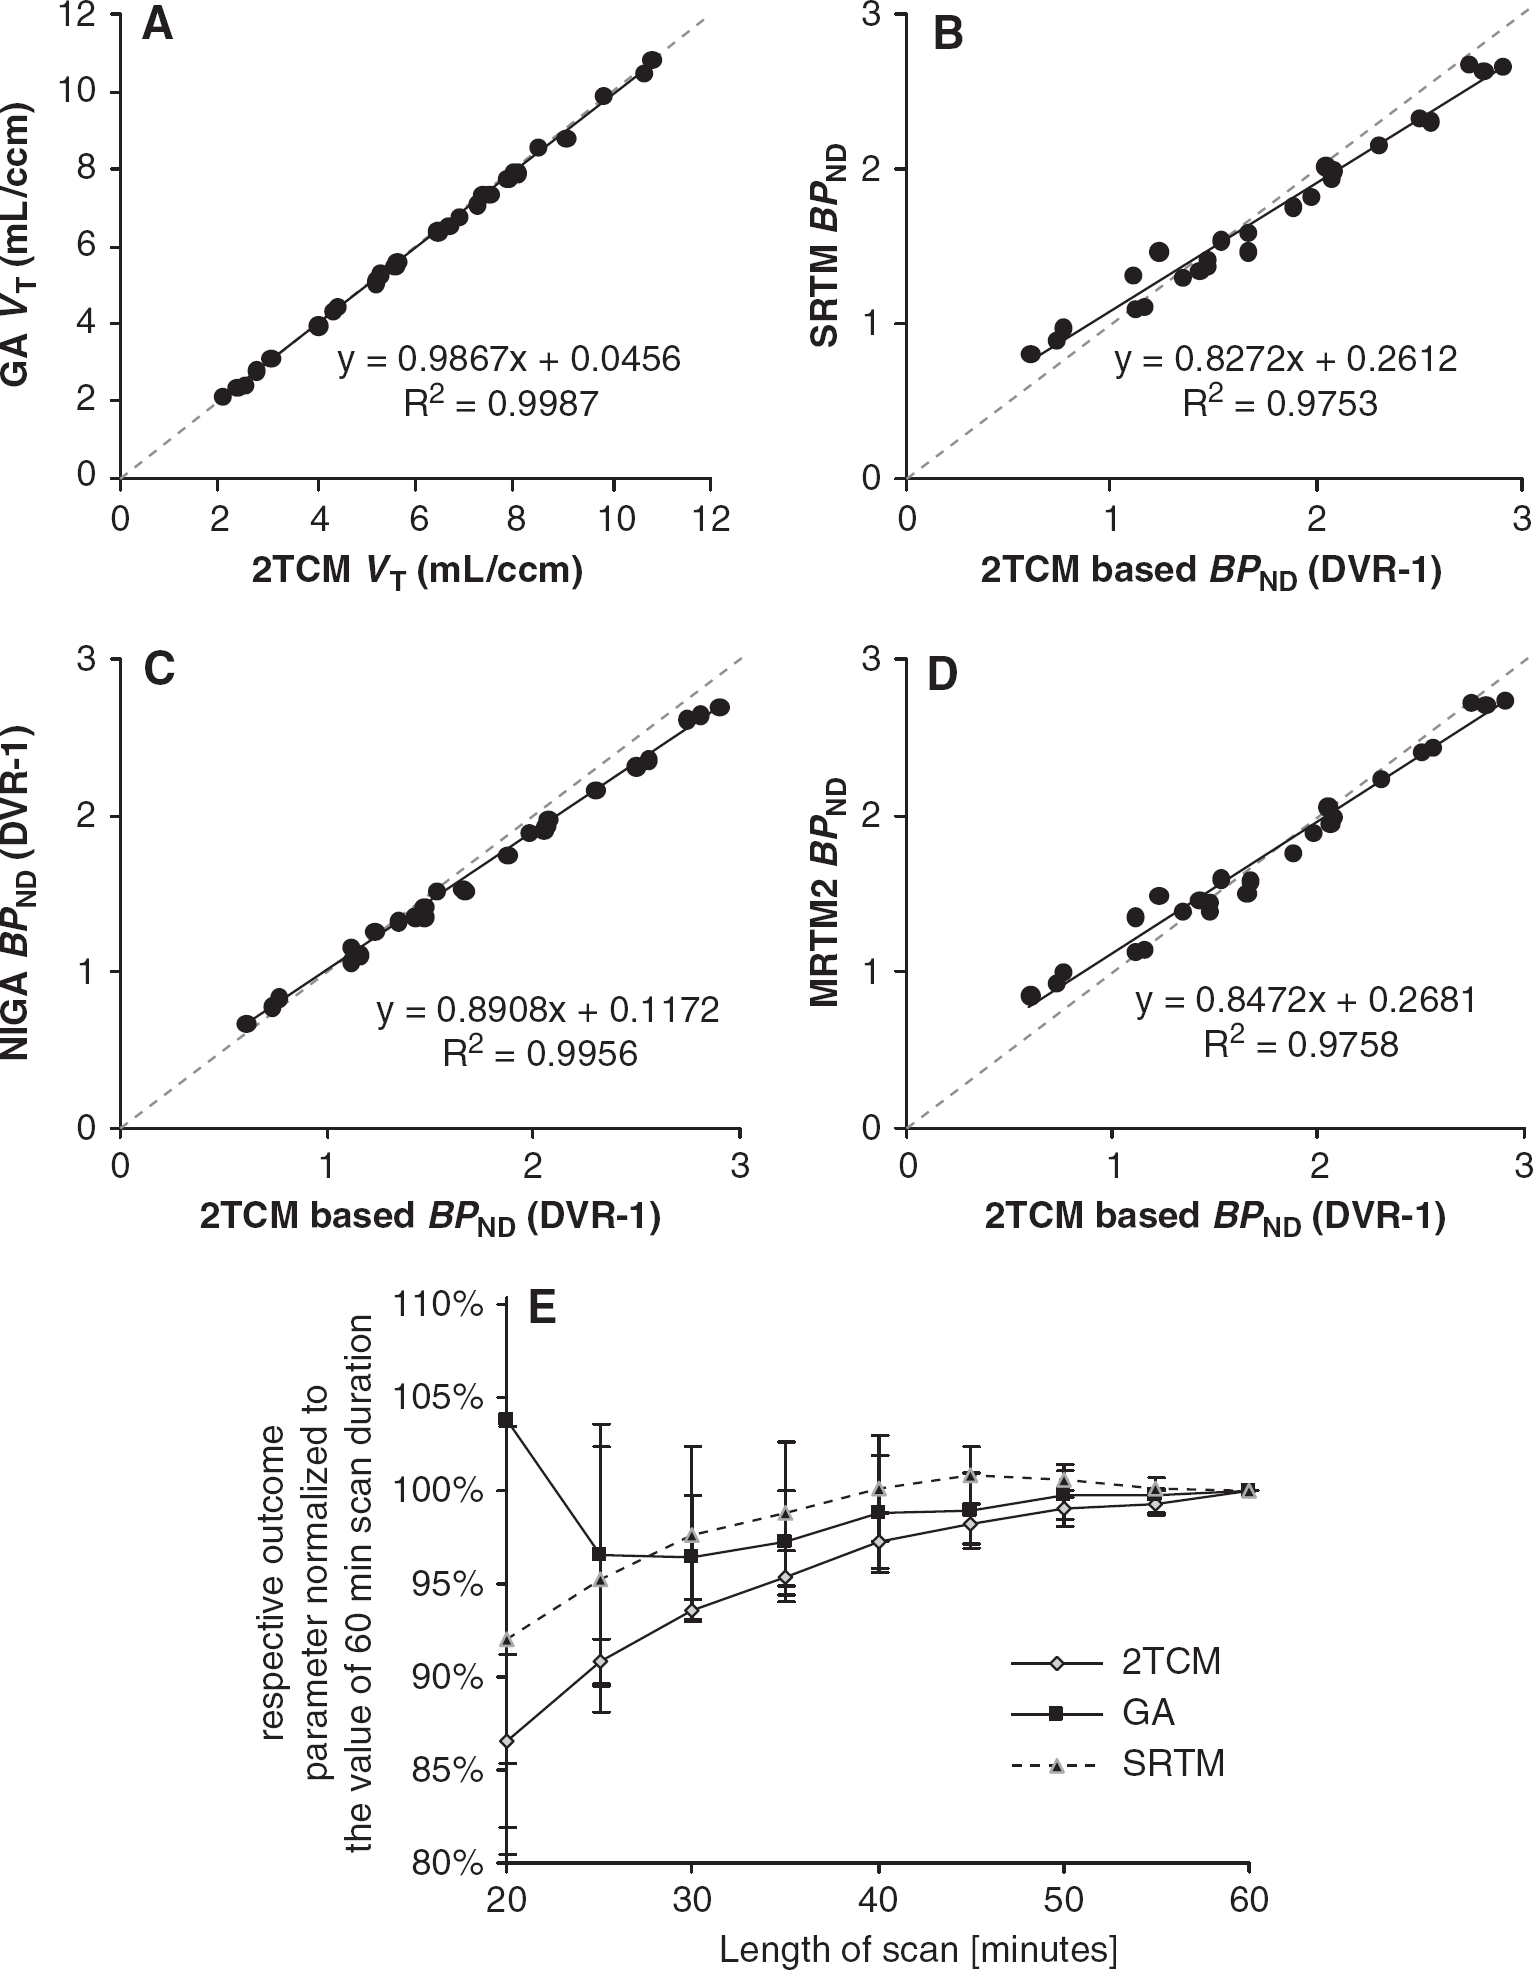
The results of the 2TCM fits are summarized in Table 1. The estimated K1 values are high (0.8 to 1.3mL per cm3 per minute), which is in agreement with the reported high extraction fraction of over 90% (Wyss et al, 2007) of [11C]ABP688, and the literature values reported for regional cerebral blood flow of rats was in the range of 1.3 to 1.7mL per cm3 per minute (Adam et al, 2003). The percent standard error of estimation of the parameter fits ranged for K1 between 1.7% to 6.5%, k2 4.6% to 14%, k3 6.1% to 23% and k4 4.3% to 26%, being highest for K1 and k2 in the smallest ROI (frontal) and for k3 and k4 in cerebellum (exceeding 10% only there). The VT based on the 2TCM was highest in caudate-putamen (8.5 mL/cm3) and lowest in cerebellum (2.6 mL/cm3). We found no relation between the injected dose and the VT. The GA revealed VT estimates in excellent agreement with the 2TCM VT (R2 = 0.999: the correlation graph and the regression term are provided in Figure 4A).
In vivo binding parameters obtained with metabolite corrected plasma input function in five brain regions and cerebellum
2TCM
GA
k1 (mL per ccm per minute)
k2 (per minute)
k3 (per minute)
k4 (per minute)
VT (mL/ccm)
VT (mL/ccm)
Baseline
Baseline
Blockade
Baseline
Blockade
Cerebellum
0.9 ± 0.1
1.0 ± 0.1
0.08 ± 0.01
0.05 ± 0.01
2.6 ± 0.4
2.6 ± 0.6
2.6 ± 0.4
2.4 ± 0.5
Caudate-putamen
1.1 ± 0.2
0.6 ± 0.0
0.23 ± 0.06
0.06 ± 0.01
8.5 ± 2.3
3.5 ± 0.8
8.4 ± 2.3
3.3 ± 0.7
Cortex
0.8 ± 0.2
0.7 ± 0.1
0.23 ± 0.05
0.06 ± 0.01
5.7 ± 1.2
3.2 ± 0.8
5.7 ± 1.2
3.1 ± 0.8
Frontal
1.0 ± 0.3
0.6 ± 0.2
0.24 ± 0.06
0.06 ± 0.01
7.9 ± 1.6
3.4 ± 0.7
7.8 ± 1.7
3.2 ± 0.8
Hippocampus
1.0 ± 0.2
0.8 ± 0.1
0.24 ± 0.07
0.06 ± 0.01
6.9 ± 1.6
3.1 ± 0.7
6.8 ± 1.6
3.0 ± 0.6
Thalamus
1.3 ± 0.2
0.7 ± 0.1
0.14 ± 0.03
0.06 ± 0.01
5.8 ± 1.3
3.3 ± 0.6
5.8 ± 1.3
3.2 ± 0.6
GA, graphical analysis; MPEP, 1,2-methyl-6-(phenylethynyl)-pyridine; VT, total distribution volume; 2TCM, two-tissue compartment model. The effect of MPEP blockade on distribution volume (VT) is not present in the cerebellum (n = 5).
Correlations of the outcome parameters distribution volume (VT) and binding potential (BPND) derived by different nonlinear and (multi) linear methods. (A) Correlation between VT of the two-tissue compartment model (2TCM) and Logan's graphical analysis (GA). (B) Correlation between BPND derived from the VT of 2TCM and the simplified reference tissue model (SRTM). (C) Correlation between BPND based on 2TCM and BPND derived from the distribution volume ratio (DVR) from Logan's noninvasive GA (NIGA). (D) Correlation between BPND based on 2TCM and the two-parameter version of the multilinear reference tissue model (MRTM2). The solid line represents linear regression analysis and dotted line represents identity. Results of regression are depicted of six regions in five animals. (E) Time stability of VT determination using the 2TCM and Logan's GA and of BPND using the SRTM for caudate-putamen. The y axis represents the actual outcome parameter (VT and BPND, depending on the curve) at a given time point divided by the respective outcome parameter with full-scan length. Error bars represent 1 s.d.
Blocking the binding site with MPEP resulted in an average decrease of binding between 43% and 58% (thalamus and caudate-putamen, respectively) when analyzed with 2TCM. In the cerebellum, no reduction of VT (−0.01% on average) could be observed, which was significantly different from zero. The GA showed a nonsignificant reduction of 7% (P = 0.38).
Reference Tissue-Based Kinetic Analyses
As there was no effect of the blockade detectable in the 2TCM VT of cerebellum, this region was chosen as reference region for testing the noninvasive quantification. Although, cerebellar kinetics could not be described adequately with a 1TCM (which is a violation of the assumptions of the SRTM), this model with cerebellar input was able to successfully quantify the binding of the radiotracer. Comparing BPND based on the 2TCM with SRTM BPND (correlation sketch: Figure 4B) revealed an average negative bias of 0.7% in the caudate-putamen (maximum 10%) and an average positive bias of 3.1% (maximum: 30%) in the low-binding region thalamus likely due to the required two-tissue kinetics in cerebellum (Slifstein et al, 2000). This bias was less pronounced when compared with the MRTM2 (Figure 4D) and least compared with the NIGA (Figure 4C). The correlation within the reference models itself was excellent and without noticeable bias (data not shown). Delaying t* of the MRTM/MRTM2 from 0 to 13 and 30 minutes did not reduce the observed bias to the BPND based on the 2TCM but increased the noise in the correlation analysis substantially (2TCM BPND versus MRTM2: 0 minutes: y = 0.85x + 0.27, R2 = 0.98; 13 minutes: y = 0.82x + 0.32, R2 = 0.95; 30 minutes: y = 0.81x + 0.26, R2 = 0.81). Therefore, we decided to fix t* to 0minute, which enables to calculate the ratio of ligand delivery to target and reference region (R1).
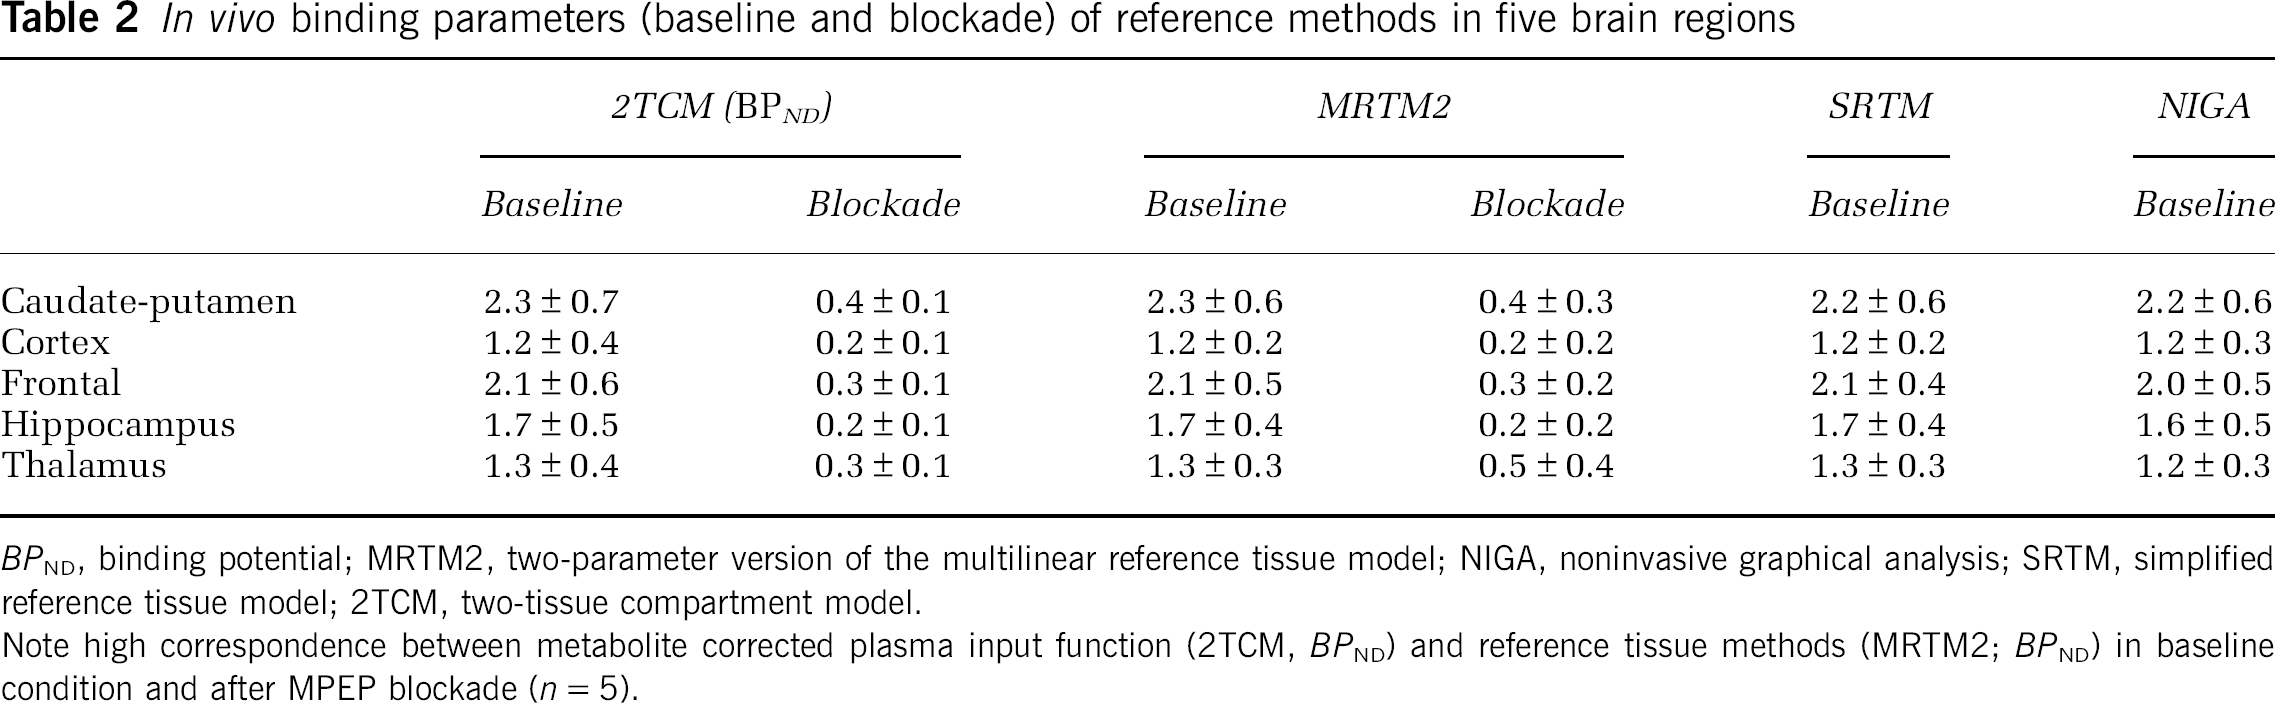
The BPND values at baseline and blockade condition are summarized in Table 2. Blockade resulted in an average decrease of binding between 65% and 87% (thalamus and hippocampus, respectively) when analyzed with MRTM2 and between 77% and 87% for 2TCM-based BPND.
In vivo binding parameters (baseline and blockade) of reference methods in five brain regions
2TCM (BPND)
MRTM2
SRTM
NIGA
Baseline
Blockade
Baseline
Blockade
Baseline
Baseline
Caudate-putamen
2.3 ± 0.7
0.4 ± 0.1
2.3 ± 0.6
0.4 ± 0.3
2.2 ± 0.6
2.2 ± 0.6
Cortex
1.2 ± 0.4
0.2 ± 0.1
1.2 ± 0.2
0.2 ± 0.2
1.2 ± 0.2
1.2 ± 0.3
Frontal
2.1 ± 0.6
0.3 ± 0.1
2.1 ± 0.5
0.3 ± 0.2
2.1 ± 0.4
2.0 ± 0.5
Hippocampus
1.7 ± 0.5
0.2 ± 0.1
1.7 ± 0.4
0.2 ± 0.2
1.7 ± 0.4
1.6 ± 0.5
Thalamus
1.3 ± 0.4
0.3 ± 0.1
1.3 ± 0.3
0.5 ± 0.4
1.3 ± 0.3
1.2 ± 0.3
BPND, binding potential; MRTM2, two-parameter version of the multilinear reference tissue model; NIGA, noninvasive graphical analysis; SRTM, simplified reference tissue model; 2TCM, two-tissue compartment model.
Note high correspondence between metabolite corrected plasma input function (2TCM, BPND) and reference tissue methods (MRTM2; BPND) in baseline condition and after MPEP blockade (n = 5).
Time Stability of Parameter Estimation
For acquisitions of 60 minutes, 2TCM, GA, and SRTM yielded relatively stable outcome parameters in terms of bias and variance. Thus, 60 minutes of dynamic data are suitable for the quantitative assessment of mGluR5. When scan duration is shortened to 30 minutes instead modeling becomes unstable and is associated with an average bias of −2% to −6% (Figure 4E).
Parametric Images
Figure 3A illustrates averaged (n = 11) parametric images of BPND generated with voxel-wise application of the MRTM2. Corresponding relative blood flow maps can be found in Figure 3B. The MRTM2 could be used successfully in all animals, in contrast to parametric images based on NIGA or SRTM, which were associated with considerable noise and several voxels where the modeling failed (data not shown). The BPND values read out using the same ROI as for TAC generation showed excellent congruency without any bias (regression: y = 1.0098x + 0.0014, R2 = 0.999, P < 0.0001) for the ROI TAC-based MRTM2 and the voxel-wise parametric image.
Figure 2A shows a representative example of a parametric image of VT generated with GA. The VT values read out using the same ROI as for TAC generation revealed a consistent negative bias (6% for high-binding region, considerably less for low binding. Regression: y = 0.9371x to 0.0383, R2 = 0.99, P < 0.0001) of the voxel-wise GA compared with the 2TCM and GA.
Autoradiography and Saturation Binding
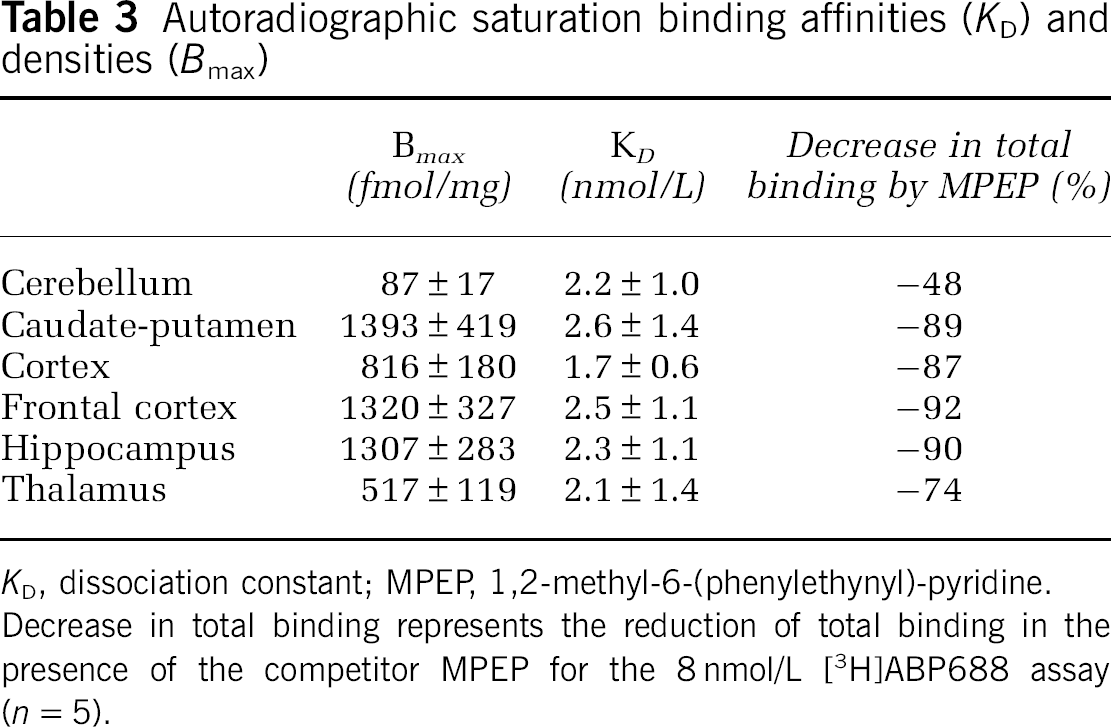
[3H]ABP688 binding in the rat brain was saturable and the nonlinear fit to the one binding site model revealed Bmax values between 80 and 2300 fmol/mg (tissue) (cerebellum and caudate-putamen, respectively) and KD values between 1.1 and 6 nmol/L (across animals). Average regional results are provided in Table 3, and a saturation-binding curve is presented in Figure 2E. The near to identity slope of the data transformed to the Hill plot of on average 0.98 ± 0.03 confirmed the use of a single site binding model. Saturable binding was also detected in white matter tissue. The mean Bmax value in white matter was 171 ± 21 fmol/mg (tissue) and KD value was 2.45 ± 1.1 nmol/L.
Autoradiographic saturation binding affinities (KD) and densities (Bmax)
Bmax (fmol/mg)
KD (nmol/L)
Decrease in total binding by MPEP (%)
Cerebellum
87 ± 17
2.2 ± 1.0
−48
Caudate-putamen
1393 ± 419
2.6 ± 1.4
−89
Cortex
816 ± 180
1.7 ± 0.
−87
Frontal cortex
1320 ± 327
2.5 ± 1.1
−92
Hippocampus
1307 ± 283
2.3 ± 1.1
−90
Thalamus
517 ± 119
2.1 ± 1.4
−74
KD, dissociation constant; MPEP, 1,2-methyl-6-(phenylethynyl)-pyridine. Decrease in total binding represents the reduction of total binding in the presence of the competitor MPEP for the 8 nmol/L [3H]ABP688 assay (n = 5).
Comparing KD differences over brain regions by performing a repeated-measures analysis of variance revealed a significant difference only for the contrast caudate-putamen versus cortex (P = 0.006).
In Vivo–In Vitro Comparison
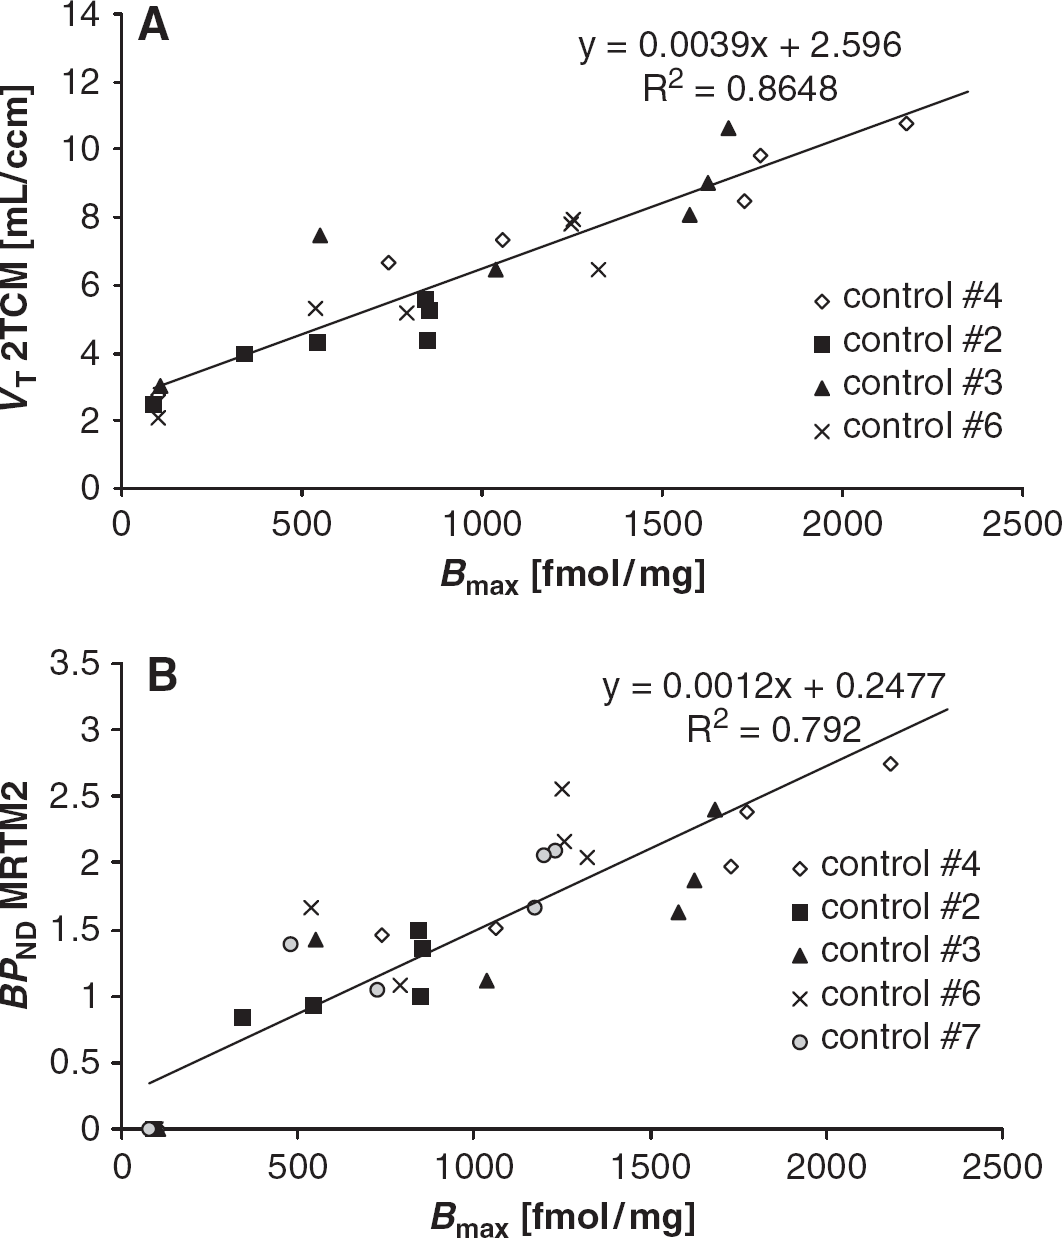
A significant relationship was observed between PET and autoradiographic measures in the same animals. Correlation between VT and Bmax is displayed in Figure 5A (Pearson's correlation P < 0.0001, regression data provided in the figure) and between BPND and Bmax in Figure 5B (P < 0.0001).
Comparison of metabotropic glutamate receptor type 5 (mGluR5) concentrations in six brain regions measured with autoradiographic saturation-binding experiments (Bmax) and positron emission tomography. Both total distribution volume (VT) of the two-tissue compartment model (2TCM; n = 4) (A) and binding potential (BPND) (B) derived from the two-parameter version of the multilinear reference tissue model (MRTM2; n = 5) were highly correlated with Bmax. The solid line represents linear regression analysis. Results of regression are given.
In autoradiography, total binding was reduced in the presence of the competitor MPEP in the 8 nmol/L [3H]ABP688 assay by 75% to 92% in the high-binding regions and by 48% in the cerebellum (Table 3) Comparing these relative in vitro changes to the ones in vivo shows a good correlation to the reduction in BPND (MRTM2, y = 0.76x to 0.25, R2 = 0.97) and a moderate to the decrease in VT (without cerebellum, y = 0.75x to 0.5, R2 = 0.62).
Discussion
This study presents in vivo and in vitro measurements of mGluR5 in the same rats and evaluates metabolite-corrected plasma input function and reference tissue-based pharmacokinetic models for the quantification of the PET radiotracer [11C]ABP688.
The primary objective of this study was to evaluate whether reference tissue methods provides suitable measures of mGluR5 availability in the rat brain. The line of evidence that leads to the conclusion that the cerebellum is a suitable reference region for reference tissue models is based on the following four major points: (1) there is no displaceable binding in the proposed reference region; (2) blood input-based quantification is correlated to reference region-based input quantification; (3) PET quantification correlates with autoradiographic quantification; and (4) the level of nondisplaceable uptake in the reference region and the ROI is the same.
The conclusions were drawn from the experimental data by showing that (1) the blockade of binding had a negligible effect on cerebellar VT, (2) the good correlation of 2TCM BPND to reference model BPND, (3) the good correlation of BPND to Bmax, and (4) the linearity of the Lassen plot of occupancy.
In detail, this was shown in vivo by comparing baseline scans to blockade experiments with a high dose of the selective antagonist MPEP and unlabelled ABP688 (due to the injection of the radiotracer with a low-specific activity). Blockade had no effect on cerebellar VT estimated with the 2TCM. The cerebellum is therefore considered as a suitable reference region, which can be applied with various noninvasive methods.
The bias between reference models BPND to 2TCM BPND due to the nonunity of the correlations was most pronounced in the SRTM in the low-binding region thalamus but low with a positive average bias of 3.1%. This nonunity and the magnitude of the bias have been observed for several other PET ligands that are quantified with a reference models (Parsey et al, 2000; Gallezot et al, 2010). The relationship between BPND and VT was though linear and thus provides as well a linear estimate of receptor density as can be seen in the linear correlation to the autoradiography Bmax.
In the autoradiographic saturation-binding experiments of the animals, which were previously scanned with PET, specific binding was detectable in cerebellum (∼90 fmol/mg (tissue)). This was expected as immunohistochemical investigations found antibody binding on glial cells like astrocytes (GFAP-positive cells) and oligodendrocytes (CNPase-positive cells) (Mudo et al, 2007). In addition, mGluR5 were found on Golgi cells of the granular layer (Neki et al, 1996).
Hintermann et al (2007) reported a rat whole brain homogenate binding of a Bavail of 0.87 pmol/mg (protein) and a KD of 2.3 nmol/L for [3H]ABP688. Tissue section experiments were only performed with a single concentration assay (5 nmol/L); therefore, only a caudate-putamen to cerebellum ratio (of about 8) can be calculated for comparison.
Specific binding in a saturation-binding experiment with [18F]F-PEB (an analog of MPEP) was also found by Patel et al (2007) in rat cerebellum sections. Caudate-putamen to cerebellum ratio for [18F]F-PEB in rats was about 28-fold with a Bmax of 1.4nmol/L (tissue) in cerebellum.
Accordingly in this study, specific binding with a Bmax of 90 fmol/mg (tissue) was detected in cerebellar cortex and about twofold higher in white matter. Bmax was small in comparison to the high-binding regions (1400 fmol/mg (tissue)). The caudate-putamen to cerebellum ratio is about 16-fold in this assay. Nevertheless, transferring the in vitro finding to the PET experiment, where nondisplaceable binding is present, the fraction of specific binding in cerebellum can be estimated to be around 10% (assuming that VND is homogenous). Because of the noise level in this low-binding region and a substantial partial volume effect, the impact of the in vivo blockade could be below the sensitivity of this experimental design. This question could be addressed by test–retest evaluations. Spill in from tissue with non-specific binding into a region with a small fraction of specific binding will seemingly reduce this fraction and eventually diminish possibly detectable differences in VT. In addition, it is very likely that in the in vivo situation not all receptors are as available for binding as in the autoradiography. Alternatively, one might say that, in vivo conditions, the cerebellum mGluR5 is insensitive to displacement due to unavailability of allosteric-binding site. In fact, here we show evidence that cerebellar receptors might have different binding properties compared with the prosencephalic mGluR5.
The VT after blockade is higher in caudate-putamen than the VT in cerebellum (both, before and after blockade). This discrepancy can be explained by an incomplete blockade of the receptors. When the difference of VT in baseline and blockade experiment is plotted against VT of the baseline, the relationship should be linear, and the intercept with the x axis should give an estimate of the VND and the slope of the regression should give an estimate of the occupancy (Lassen et al, 1995). Applying this method to the averaged regional 2TCM data from Table 1 reveals about 85% blockade and a VND of 2.7mL/cm3 (regression: y = 0.85x to 2.26, R2 = 0.99, P < 0.0001). This VND is higher than the cerebellar VT (2.6mL/cm3), which is proposed here as VND. The difference is probably due to a more pronounced partial volume effect in this ROI on the outer surface compared with the structures like caudate-putamen, which are surrounded by receptor bearing tissue.
We were able to reproduce the previously published distribution pattern of [11C]ABP688 and [3H]ABP688 binding in rats. Although the VT in caudate-putamen found by Wyss et al (2007) were ∼1.8-fold higher for the baseline experiments (n = 9) and 1.3-fold higher for the blocking experiment (n = 1), these higher VT can be explained by substantial methodological differences to our approach: Wyss et al (2007) used a β probe placed in the rat caudate-putamen to acquire tissue TACs and used whole blood TACs measured continuously with a coincidence counter over 30 minutes. Whole blood activity was then converted with population-based and -fitted metabolite data from earlier experiments to estimate parent compound in plasma. Besides the differences in sensitivity and in partial volume effects between β probe and MicroPET, and besides possible spillover from blood vessels to the β probe etc. and the use of population-based metabolite correction instead of individual data or the age of the rats there are the following two major issues that influence the results. First, we found that at least 50 minutes of scanning are necessary to achieve stable fitting results for the 2TCM, and second, that MPEP impairs the metabolism of [11C]ABP688 significantly and substantially at high doses. The measured metabolite fraction after blockade was up to two times higher than at the baseline condition. In addition, the determination of metabolites in every blood sample revealed that first metabolites were detected after 1.5 to 2 minutes, which implicates that the use of an exponential function for fitting without a delay overestimates metabolism during this time period.
The correlation of in vivo determinations of VT and BPND versus the in vitroBmax (Figure 5) offers the possibility to approximate an in vivoKD (named KappD): The intercept of VT versus Bmax should be VND and the slope be fP over KappD times a partial volume effect factor. The intercept is with 2.59 mL/cm3 very close to the 2TCM VND of 2.56 mL/cm3. With the measured fP of 0.15 and the slope of 0.0039 L/nmol KappD is 38nmol/L times the partial volume effect factor. If the caudate-putamen region from the atlas is filtered by a 2-mm Gaussian kernel, the partial volume effect factor is 0.55. This partial volume effect assumption would give an KappD of 19 nmol/L. Moreover, the intercept of BPND versus BmaXx should be zero and the slope be the free fraction of ligand in the nondisplaceable tissue compartment (fND) over KappD times the same partial volume effect factor. The fit of Figure 5B was close to zero with 0.25. If the fit is further forced to go through zero, the slope is 0.0014 L/nmol. The fND should equal fP over VND. Using these values, an KappD of 22 nmol/L can now be calculated. In addition, the ratio of the two slopes should be fP over fND and again give an estimate of VND. This ratio of 2.78 is about 7% higher than the 2TCM VND of 2.6 mL/cm3.
An important issue is whether the experiments were performed at tracer doses. To evaluate this question, we performed the following estimations: the plasma activity level of ABP688 in the latter half of the scans (CP, 30 to 60 minutes p.i. when high binding to reference region ratio was relatively stable (Sossi et al, 2007; Marner et al, 2010) is used as a measure of free ligand in plasma CFP = CP/SA × fP (specific activity (SA)) and the assumption is made that CFP and CFT (the concentration of free ligand in tissue) have equilibrated during this time span (with certain restrictions as discussed in Innis et al (2007)). The in vitroKD (2.2 nmol/L) was determined in saturation-binding experiments, and the occupancy can be estimated according to the Michaelis–Menten equation: Occ = CFT/(CFT +KD) (Marner et al, 2010). Under these assumptions, receptor occupancies with ABP688 were 2.5% ± 2.4% for the experiments with blood sampling (n = 5). Alternatively, the occupancy was estimated based on the peak uptake value in a reference region, the fraction of unbound tracer in tissue fND = fP/VND (Innis et al, 2007) and the in vivoKappD calculated of the slope of the correlation of autoradiography and PET (Gallezot et al, 2010). The limit of injected dose was calculated to occupy < 5% of the receptors. For this study, the average cerebellum peak activity was 18.3 KBq/mL and the injected dose was 17.3 MBq, resulting in an average peak uptake value of 1.05 injected dose per liter. Together with the fND based on the measured fP and the in vivoKappD, which was approximated from the correlation of VT and BPND versus Bmax, the dose limit can be estimated to be 18nmol. The highest dose injected in this study was 13 nmol.
In an earlier study, no effect of injected masses of up to 4.5 nmol/kg ABP688 on rat VT could be detected (Wyss et al, 2007), which is close to the average injected mass in this experiment (4.9 nmol/kg). However, a concluding answer to the occupancy issue can only be given by a dosing experiment.
A general restriction of reference tissue models is the homogeneity criterion of VND, which makes the results prone to changes only in the reference region. Cerebellar diseases in particular atrophies or vascular diseases may invalidate the VND estimation and comparability. When changes in cerebellar VND cannot be ruled out, invasive quantification methods should be preferred.
In the human cerebellum, mGluR5 densities and affinity are comparable to those in the rat cerebellum, and the high-binding region to cerebellum density ratio is similar as well ([3H]ABP688 autoradiography of human hippocampus specimen 1300 and cerebellum 90 fmol/mg (tissue) (Minuzzi et al, 2009). Human [11C]ABP688 PET VT cerebellum: 2.9, putamen 6.6 mL/cm3 (Treyer et al, 2007)). Animal models displaying the same receptor concentrations as humans, identical drug metabolism and pharmacokinetic profile can provide reasonable approximation of assumptions underlying the validity of reference regions in humans.
Thus, similarities in mGluR5 binding between the species make it most probable that the human cerebellum could be used as a reference region as well, which would simplify the applicability of [11C]ABP688.
Conclusion
The cerebellum is a suitable reference region for the quantification of mGluR5 availability with [11C]ABP688 PET in rats. Blood-based and reference region-based PET quantification is strongly supported by the in vitro autoradiographic determinations. A scan duration of at least 50 minutes is required.
Footnotes
Acknowledgements
Miriam Kovacevic, Ivan Skelin, Arturo Aliaga, Esther Schirrmacher, and Andreas Fintelmann (Advanced Biochemical Compounds, ABX GmbH) are gratefully acknowledged for excellent technical assistance and Christian La Fougère for valuable discussion.
The authors declare no conflict of interest.
References
1.
AdamJFElleaumeHLe DucGCordeSCharvetAMTropresILe BasJFEsteveF (2003) Absolute cerebral blood volume and blood flow measurements based on synchrotron radiation quantitative computed tomography. J Cereb Blood Flow Metab23:499–512
2.
AmetameySMKesslerLJHonerMWyssMTBuckAHintermannSAubersonYPGaspariniFSchubigerPA (2006) Radiosynthesis and preclinical evaluation of 11C-ABP688 as a probe for imaging the metabotropic glutamate receptor subtype 5. J Nucl Med47:698–705
3.
AmetameySMTreyerVStrefferJWyssMTSchmidtMBlagoevMHintermannSAubersonYGaspariniFFischerUCBuckA (2007) Human PET studies of metabotropic glutamate receptor subtype 5 with 11C-ABP688. J Nucl Med48:247–52
4.
BrunoVBattagliaGCopaniAD'OnofrioMDiIPDeBAMelchiorriDFlorPJNicolettiF (2001) Metabotropic glutamate receptor subtypes as targets for neuroprotective drugs. J Cereb Blood Flow Metab21:1013–33
5.
CartmellJSchoeppDD (2000) Regulation of neurotransmitter release by metabotropic glutamate receptors. J Neurochem75:889–907
6.
ChapmanAGNananKWilliamsMMeldrumBS (2000) Anticonvulsant activity of two metabotropic glutamate group I antagonists selective for the mGlu5 receptor: 2-methyl-6-phenylethynyl)-pyridine (MPEP), and (E)-6- methyl-2-styryl-pyridine (SIB 1893). Neuropharmacology39:1567–74
7.
ConnPJPinJP (1997) Pharmacology and functions of metabotropic glutamate receptors. Annu Rev Pharmacol Toxicol37:205–37
8.
GallezotJDNabulsiNNeumeisterAPlaneta-WilsonBWilliamsWASinghalTKimSMaguireRPMcCarthyTFrostJJHuangYDingYSCarsonRE (2010) Kinetic modeling of the serotonin 5-HT(1B) receptor radioligand [(11)C]P943 in humans. J Cereb Blood Flow Metab30:196–210
9.
HintermannSVranesicIAllgeierHBrulisauerAHoyerDLemaireMMoeniusTUrwylerSWhitebreadSGaspariniFAubersonYP (2007) ABP688, a novel selective and high affinity ligand for the labeling of mGlu5 receptors: identification, in vitro pharmacology, pharmacokinetic and biodistribution studies. Bioorg Med Chem15:903–14
10.
IchiseMLiowJSLuJQTakanoAModelKToyamaHSuharaTSuzukiKInnisRBCarsonRE (2003) Linearized reference tissue parametric imaging methods: application to [11C]DASB positron emission tomography studies of the serotonin transporter in human brain. J Cereb Blood Flow Metab23:1096–112
11.
InnisRBCunninghamVJDelforgeJFujitaMGjeddeAGunnRNHoldenJHouleSHuangSCIchiseMIidaHItoHKimuraYKoeppeRAKnudsenGMKnuutiJLammertsmaAALaruelleMLoganJMaguireRPMintunMAMorrisEDParseyRPriceJCSlifsteinMSossiVSuharaTVotawJRWongDFCarsonRE (2007) Consensus nomenclature for in vivo imaging of reversibly binding radioligands. J Cereb Blood Flow Metab27:1533–9
12.
KnoessCSiegelSSmithANewportDRicherzhagenNWinkelerAJacobsAGobleRNGrafRWienhardKHeissWD (2003) Performance evaluation of the micro-PET R4 PET scanner for rodents. Eur J Nucl Med Mol Imaging30:737–47
13.
LammertsmaAAHumeSP (1996) Simplified reference tissue model for PET receptor studies. Neuroimage4:153–8
14.
LassenNABartensteinPALammertsmaAAPrevettMCTurtonDRLuthraSKOsmanSBloomfieldPMJonesTPatsalosPN (1995) Benzodiazepine receptor quantification in vivo in humans using [11C]flumazenil and PET: application of the steady-state principle. J Cereb Blood Flow Metab15:152–65
15.
LoganJFowlerJSVolkowNDWangGJDingYSAlexoffDL (1996) Distribution volume ratios without blood sampling from graphical analysis of PET data. J Cereb Blood Flow Metab16:834–40
16.
LoganJFowlerJSVolkowNDWolfAPDeweySLSchlyerDJMacGregorRRHitzemannRBendriemBGatleySJ (1990) Graphical analysis of reversible radioligand binding from time-activity measurements applied to [N-11C-methyl]-(−)-cocaine PET studies in human subjects. J Cereb Blood Flow Metab10:740–7
17.
MarnerLGillingsNMadsenKErritzoeDBaareWFSvarerCHasselbalchSGKnudsenGM (2010) Brain imaging of serotonin 4 receptors in humans with [(11)C]SB207145-PET. Neuroimage50:855–61
18.
MintunMARaichleMEKilbournMRWootenGFWelchMJ (1984) A quantitative model for the in vivo assessment of drug binding sites with positron emission tomography. Ann Neurol15:217–27
19.
MinuzziLDiksicMGauthierSQuirionSRosa-NetoP (2009) In vitro quantification of mGluR5 in pons and cerebellum of human brain using [3H]ABP688. J Cereb Blood Flow Metab29:S360–75
20.
MudoGTrovato-SalinaroACanigliaGChengQCondorelliDF (2007) Cellular localization of mGluR3 and mGluR5 mRNAs in normal and injured rat brain. Brain Res1149:1–13
21.
NekiAOhishiHKanekoTShigemotoRNakanishiSMizunoN (1996) Metabotropic glutamate receptors mGluR2 and mGluR5 are expressed in two non-overlapping populations of Golgi cells in the rat cerebellum. Neuroscience75:815–26
22.
NotenboomRGHampsonDRJansenGHvan RijenPCvan VeelenCWvanNOde GraanPN (2006) Up-regulation of hippocampal metabotropic glutamate receptor 5 in temporal lobe epilepsy patients. Brain129:96–107
ParseyRVSlifsteinMHwangDRAbi-DarghamASimpsonNMawlawiOGuoNNVan HeertumRMannJJLaruelleM (2000) Validation and reproducibility of measurement of 5-HT1A receptor parameters with [carbonyl-11C]WAY-100635 in humans: comparison of arterial and reference tisssue input functions. J Cereb Blood Flow Metab20:1111–33
25.
PatelSHamillTGConnollyBJagodaELiWGibsonRE (2007) Species differences in mGluR5 binding sites in mammalian central nervous system determined using in vitro binding with [18F]F-PEB. Nucl Med Biol34: 1009–17
26.
PaxinosGWatsonC (1998) The Rat Brain in Stereotaxic Coordinates. San Diego: Academic Press
27.
RubinsDJMelegaWPLacanGWayBPlenevauxALuxenACherrySR (2003) Development and evaluation of an automated atlas-based image analysis method for micro-PET studies of the rat brain. Neuroimage20:2100–18
28.
SlifsteinMParseyRVLaruelleM (2000) Derivation of [(11)C]WAY-100635 binding parameters with reference tissue models: effect of violations of model assumptions. Nucl Med Biol27:487–92
29.
SossiVHoldenJEToppingGJCambordeMLKornelsenRAMcCormickSEGreeneJStudenovARRuthTJDoudetDJ (2007) In vivo measurement of density and affinity of the monoamine vesicular transporter in a unilateral 6-hydroxydopamine rat model of PD. J Cereb Blood Flow Metab27:1407–15
30.
TizzanoJPGriffeyKISchoeppDD (1995) Induction or protection of limbic seizures in mice by mGluR subtype selective agonists. Neuropharmacology34:1063–7
31.
TreyerVStrefferJWyssMTBettioAAmetameySMFischerUSchmidtMGaspariniFHockCBuckA (2007) Evaluation of the metabotropic glutamate receptor subtype 5 using PET and 11C-ABP688: assessment of methods. J Nucl Med48:1207–15
32.
WuYCarsonRE (2002) Noise reduction in the simplified reference tissue model for neuroreceptor functional imaging. J Cereb Blood Flow Metab22:1440–52
33.
WyssMTAmetameySMTreyerVBettioABlagoevMKesslerLJBurgerCWeberBSchmidtMGaspariniFBuckA (2007) Quantitative evaluation of 11C-ABP688 as PET ligand for the measurement of the metabotropic glutamate receptor subtype 5 using autoradiographic studies and a beta-scintillator. Neuroimage35:1086–92