
Abstract
Five different methods for the estimation of the binding potential, a measure of Bmax/Kd, of [11C]raclopride in human striatum were compared using data from a dose ranging study of the neuroleptic CP-88,059-01. Binding potential was estimated indirectly, from distribution volumes in striatum and cerebellum, using both single- and two-tissue compartment models with a metabolite-corrected plasma curve as input function. The two-tissue compartment model was also used for a direct estimate of the binding potential. In addition, a direct estimate was obtained from the reference tissue compartment model using the cerebellum as indirect input function. Finally, an estimate of binding potential was calculated from the ratio of striatum over cerebellum counts at late times after injection. The estimates of striatum binding potential from all methods, except the direct determination using a two-tissue compartment model with metabolite-corrected plasma input function, correlated with each other. Use of an average metabolite correction resulted in only a small reduction in accuracy in this series of normal subjects. The reference tissue model provided estimates of the binding potential with the same sensitivity for detecting changes as those methods that required a metabolite-corrected plasma input function. This indicates that for routine analysis of clinical [11C]raclopride studies, no arterial cannulation is required. The range of normal values was significantly less variable with the reference tissue method than when simple striatum-to-cerebellum ratios were used.
The highly selective antagonist [11C]raclopride (Farde et al., 1985; Köhler et al., 1985) is widely used with positron emission tomography (PET) for the assessment of dopamine D2 receptors in patients with movement disorders (Brooks et al., 1991, 1992; Rinne et al., 1993b; Sawle et al., 1993) and schizophrenia (Farde et al., 1987, 1992; Nordström et al., 1992). In addition, its successful use in measuring the occupancy of D2 receptors by neuroleptics has been described (Farde et al., 1988b, 1992; Bench et al., 1993; Leenders et al., 1993).
A variety of methods for data collection and analysis of [11C]raclopride studies have been described. These include simple striatum-to-cerebellum ratios at a certain time after tracer injection (Brooks et al., 1991, 1992; Nordström et al., 1992; Antonini et al., 1993; Leenders et al., 1993; Rinne et al., 1993b; Volkow et al., 1993), compartmental analysis of tissue time–radioactivity curves using either a metabolite-corrected plasma (Farde et al., 1989; Sawle et al., 1993; Volkow et al., 1993) or reference tissue (Hume et al., 1992b; Bench et al., 1993) input function, and equilibrium studies in the same individual (Farde et al., 1986; Rinne et al., 1993a).
It is clear that the reported methods for performing [11C]raclopride studies differ greatly both in terms of accuracy as well as in complexity. The purpose of the present study was to identify the method that is best suited for routine analysis of clinical studies. Consequently, only those methods involving a single bolus administration of the tracer were considered. To test the various methods over a range of receptor occupancies, each was applied to the data obtained in a D2 receptor occupancy study of the neuroleptic CP-88,059-01 (Bench et al., 1993).
METHODS
Subjects
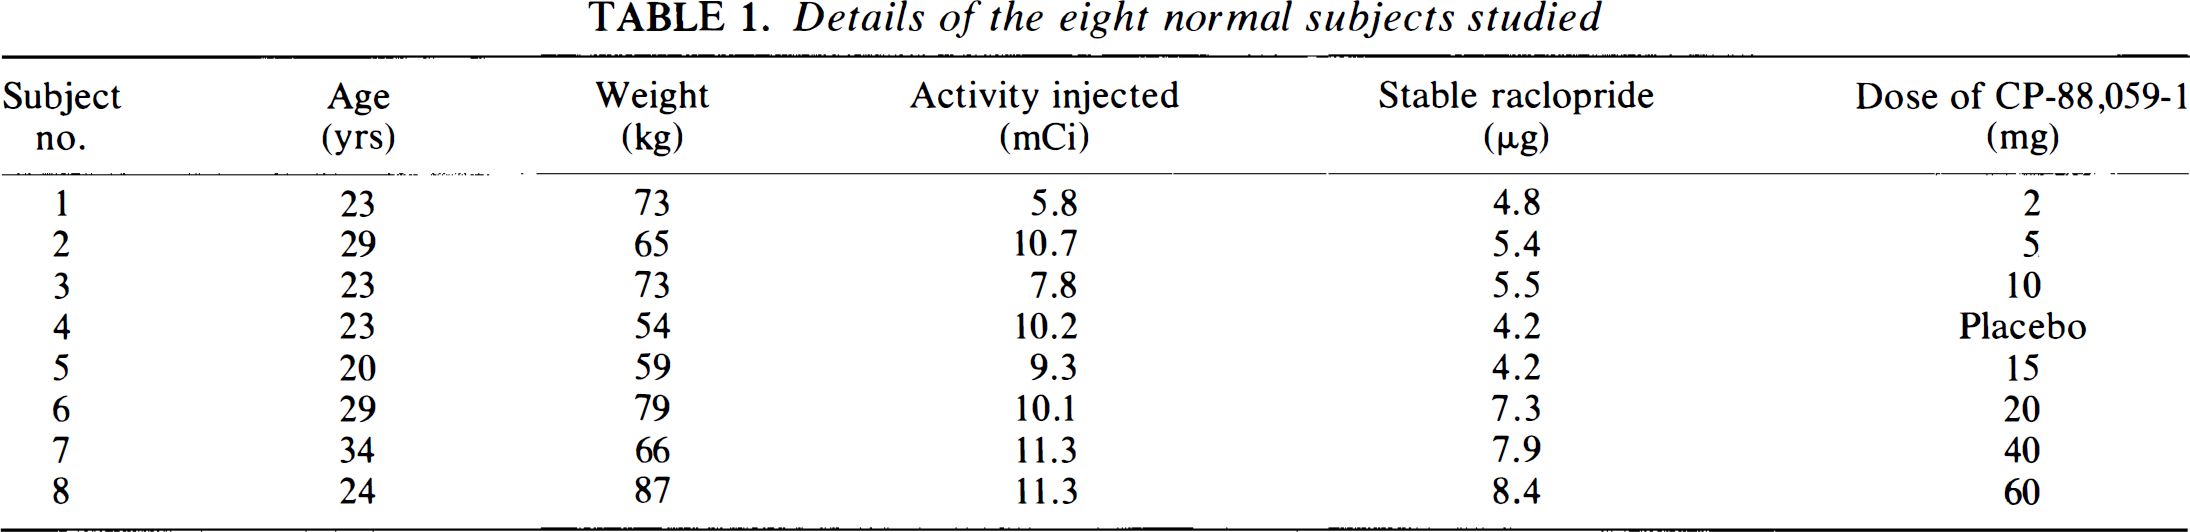
Eight normal male subjects with age ranges 20–34 years were studied. One subject received placebo and the other subjects one of seven different doses of CP-88,059-1, 6 h before scanning. Age, weight, and dose of CP-88,059-1 for the eight subjects are given in Table 1. Further study details of the subjects have been described previously (Bench et al., 1993).
Details of the eight normal subjects studied
All subjects gave their informed consent before scanning. The studies were approved by the Research Ethics Committee of Hammersmith Hospital. Permission to administer the radioactive tracers was obtained from the United Kingdom Administration of Radioactive Substances Advisory Committee.
Scanning protocol
After establishing the presence of satisfactory collateral circulation and subcutaneous infiltration with 0.5% bupivacaine (Marcain), a 22-g Teflon cannula was inserted into the left radial artery. Subjects were positioned in an ECAT 931-08/12 (CTI Inc., Knoxville, TN, U.S.A.) positron emission tomograph (Spinks et al., 1988) so that transaxial slices were parallel to the orbitomeatal line. Head movement was restricted by individual moulded polystyrene head supports and a transmission scan was acquired for the purpose of attenuation correction.
Each subject received a bolus intravenous injection of a saline solution of [11C]raclopride, which was prepared as described previously (Farde et al., 1988a). Details of injected doses (radioactivity and amount of raclopride) are listed in Table 1. Starting 30 s before time of injection, 22 sequential frames were collected during 60.5 min according to the following protocol: 1 × 30 s (background frame), 6 × 5 s, 3 × 10 s, 4 × 60 s, 2 × 150 s, 2 × 300 s, and 4 × 600 s.
Arterial whole blood was withdrawn continuously from the radial artery cannula at a rate of 5 ml/min for the first 10 min and 2.5 ml/min thereafter. The on-line detection system, cross-calibrated against the PET scanner, has been described previously (Lammertsma et al., 1991), except that now nonsticking polytetrafluoroethylene tubing was used. At set times (5, 10, 20, 30, 40, and 60 min after injection) continuous blood withdrawal was interrupted briefly for the collection of blood samples that were used to estimate plasma-to-whole-blood ratios and were analyzed for [11C]raclopride metabolites as described elsewhere (Luthra et al., 1993). After each sample, the arterial line was flushed with heparinised saline.
Using the continuously monitored arterial whole blood curve and the discrete arterial samples, a plasma curve (corrected for circulating metabolites) was generated as described previously (Lammertsma et al., 1991), except that a compartment model with total plasma as the input function was used to fit the buildup of metabolites in plasma (Lammertsma et al., 1993).
Image analysis
All emission scans were reconstructed using a Hanning filter with a cutoff frequency 0.5 of maximum. This resulted in a spatial resolution of 8.4 × 8.3 × 6.6 mm full width at half maximum at the centre of the field of view (Spinks et al., 1988).
After reconstruction, the dynamic images were transferred to a workstation (model 3/60, Sun Microsystems, Mountain View, CA, U.S.A.) and analyzed using image analysis software [Analyze version 3.0, Biodynamics Research Unit, Mayo Foundation, U.S.A. (Robb and Hanson, 1991)]. Average whole brain, striatum, and cerebellum time–radioactivity curves were generated using regions of interest (ROI), which were defined in a standardized manner as described elsewhere (Sawle et al., 1990; Bench et al., 1993). The average striatum ROI comprised a volume of 6.8 ml; the average cerebellum ROI was 22.9 ml.
Kinetic analyses
To obtain the delay parameter that was required to account for the difference in arrival between activity in the external blood detection system compared with that in the brain, the whole brain time–radioactivity curves were fitted for K1, k2, k3, k4, Vb, and delay of the blood curves, using a standard two-tissue compartment model and nonlinear regression techniques with the arterial whole blood and metabolite-corrected arterial plasma curves as input functions (Appendix A: Eq. A.5 with A.4, with appropriate delay terms included). Here K1 and k2 are the rate constants for transfer of [11C]raclopride from plasma to brain and vice versa, k3 and k4 are the rate constants for transfer between free and bound [11C]raclopride in tissue, and Vb is the fractional blood volume within the brain. Use of the metabolite-corrected plasma curve was based on reports that the labelled metabolites do not cross the blood–brain barrier (Köhler et al., 1985; Ross and Jackson, 1989). In the further analysis, where regional time–radioactivity curves were fitted, the blood delay was fixed to the value obtained from the whole brain.
Striatum and, where appropriate, cerebellum time–radioactivity curves were analyzed using three different kinetic models and a pseudoequilibrium method—A: Two-tissue compartment model with plasma and whole blood input functions, B: Single-tissue compartment model with plasma and whole blood input functions, C: Reference tissue model with cerebellum as indirect input function, D: Simple ratio of striatum-to-cerebellum counts at secular equilibrium.
A description of the compartment models used in methods A, B, and C is given in appendices A, B, and C, respectively.
In method A, the metabolite-corrected arterial plasma curve and the uncorrected arterial whole blood curve (to estimate blood volume) were used to fit the striatum curves for K1, k2, k3, binding potential (BP) (=k3/k4), and Vb (Eq. A.5 with A.4 and A.6). The ratio of k3 over k4, the binding potential BP, is a measure of Bmax over Kd and tends to be more stable than the individual rate constants (Hume et al., 1992b).
Apart from the aforementioned direct estimation of BP, method A was also used in an indirect manner. In this approach, a similar two-tissue compartment fit was also applied to the cerebellum curves. Then the volumes of distribution of [11C]raclopride (Vd) in both striatum (Vds) and cerebellum (Vdc) were calculated using Vd = (K1/k2)·(1 + k3/k4) with K1 to k4 from the striatum and cerebellum fits, respectively. Striatal binding potential was finally calculated from BP = (Vds — Vdc)/Vdc.
In method B, the metabolite-corrected arterial plasma curve and the uncorrected arterial whole blood curve were used to fit both the striatum and cerebellum curves for K1, Vd (= K1/k2), and Vb (Eq. B.2 with B.1 and B.3). Fitted values of Vd in striatum (Vds) and cerebellum (Vdc) were then used indirectly to estimate striatal binding potential from BP = (Vds — Vdc)/Vdc.
In method C, the cerebellum time–radioactivity curve was used as an (indirect) input function to the striatum curve. This method has previously been described for the analysis of [11C]raclopride PET data in small laboratory animals (Hume et al., 1992b), in which the collection of individual metabolite-corrected plasma curves is difficult to perform, and provides best estimates for BP, k2, k3, and the ratio of the K1 values for striatum and cerebellum (Eq. C.7).
Blood sampling was also not required for method D. This approach assumes that when a constant ratio has been achieved (i.e., when clearance rates from plasma and tissue are similar), the ratio R reflects Vds/Vdc. In the present study, R was calculated from the counts in striatum and cerebellum over the period from 30 to 60 min after [11C]raclopride injection. Striatal binding potential was then calculated from BP = R — 1.
The fits obtained with methods A, B, and C were compared using the Akaike (Akaike, 1974) and Schwarz (Schwarz, 1978) criteria and the F statistic (Cunningham, 1985).
Supplementary analyses
To assess the effect of variations in plasma metabolite fractions, the analyses using methods A and B were repeated, using individual plasma input functions, generated in a manner identical to that described previously herein, except that the individual metabolite sample data were replaced by the average of the eight subjects.
In order to compare the variability within methods C and D, both analyses were also applied to data from a different group of seven healthy normal male subjects (Bench et al., 1993), who did not receive any medication and in whose studies no blood data were collected.
RESULTS
The metabolite-corrected plasma time–radioactivity curve, together with striatum and cerebellum time–radioactivity curves for subject 4 (placebo) are shown in Fig. 1. Curves were similar for the other studies except that, as expected, the striatum curve became progressively reduced with increasing dose of CP-88,059-1. The plasma-to-whole-blood ratios were constant, both over time and over subjects (mean ± SD = 1.62 ± 0.03), and no correlation between formation of plasma metabolites (Fig. 2) and dose of CP-88,059-1 was found.
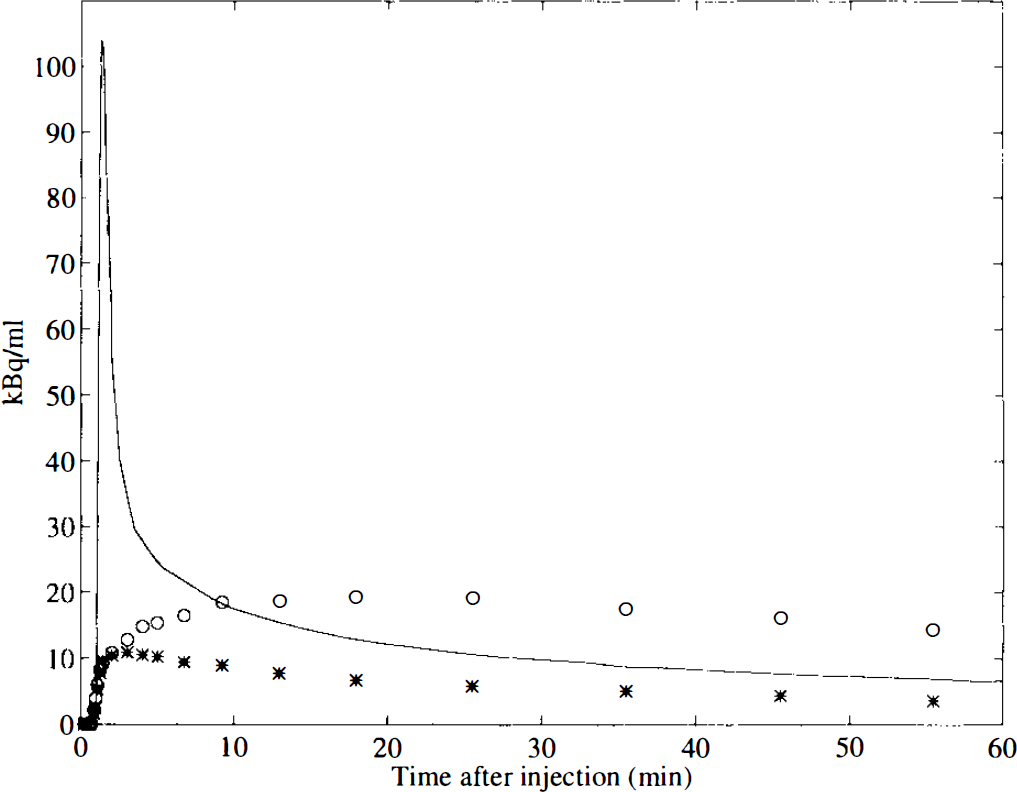
Decay corrected time–radioactivity curves of [11C]raclopride uptake in striatum (○) and cerebellum (*), together with the metabolite-corrected plasma curve (solid line), for subject number 4 (predosed with placebo). The metabolite-corrected plasma curve was generated according to Lammertsma et al. (1993).
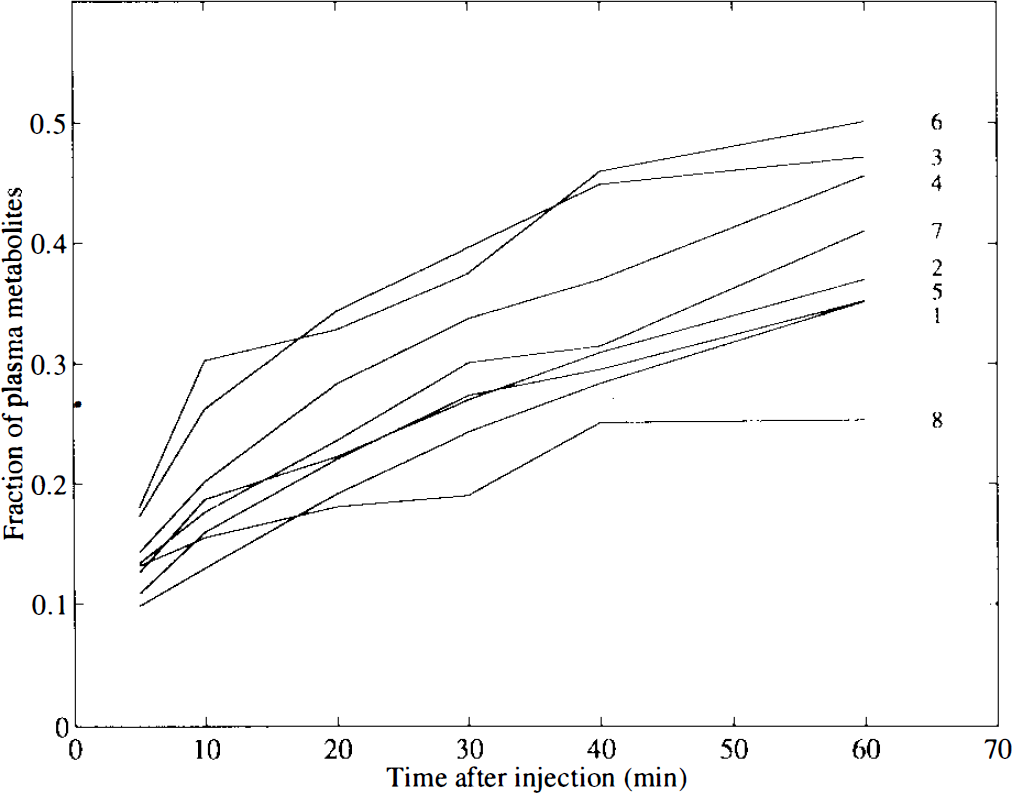
Fraction of 11C-labelled metabolites compared with the total radioactive signal in plasma as function of time (after injection) for each subject. Subject numbers, according to Table 1, are listed for each curve.
In Fig. 3, fits of the striatum time–radioactivity curve for subject 4 (placebo) are shown for methods A (two-tissue compartments with plasma input), B (one-tissue compartment with plasma input), and C (reference tissue with cerebellum input). In this subject, method A provided the best fit according to Akaike and Schwarz criteria, although the difference with method C was small (p < 0.01; F statistic). Both methods A and C were significantly better than method B (p < 0.001; F statistic). Similar results were found for the striatum curves of the other subjects. According to Akaike and Schwarz criteria, the two-tissue compartment model (method A) performed best in five subjects, whereas the reference tissue model (method C) was best in the other three studies. The F statistic showed a similar pattern.
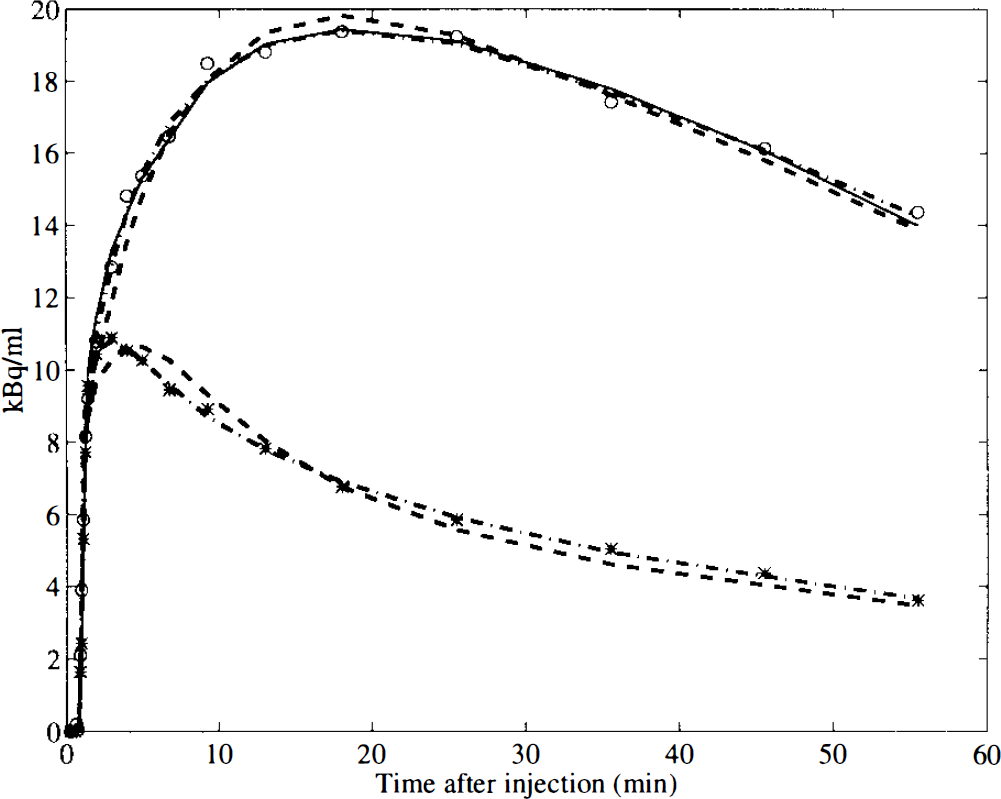
Measured time–radioactivity curve of [11C]raclopride uptake in striatum (○) and cerebellum (*) for subject 4 (predosed with placebo). Fitted curves according to models A (dash–dot), B (dashed), and C (solid; striatum only) are shown.
Analysis of the cerebellum curves revealed that, in all cases and with all three criteria, significantly better fits were obtained with method A (two-tissue compartments) as compared with those obtained with method B (one-tissue compartment).
The values of the volume of distribution of raclopride in both cerebellum and striatum are given in Table 2. Although the differences were relatively small, it is clear from this table that the two-tissue compartment model gave systematically higher values than the single-tissue compartment model.
Volume of distribution of [11C]raclopride
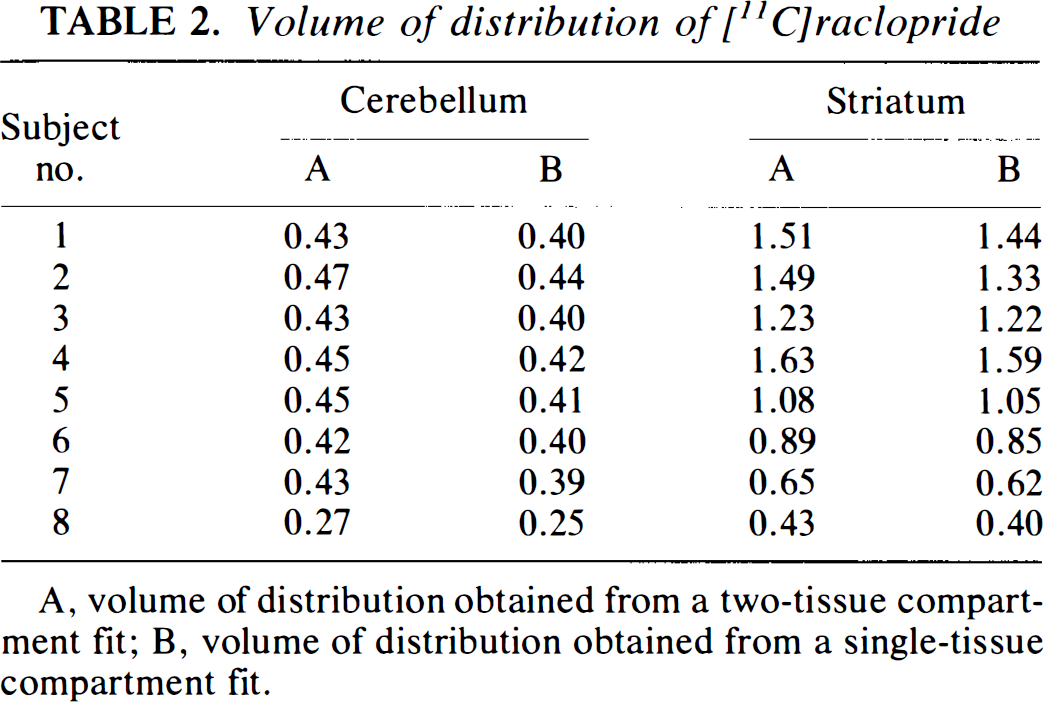
A, volume of distribution obtained from a two-tissue compartment fit; B, volume of distribution obtained from a single-tissue compartment fit.
In Table 3 values for the calculated and fitted binding potentials are given for the four methods. Note that for method A two values are given, one obtained directly from the fit, the other indirectly from the volumes of distribution. As illustrated in Fig. 4, a good correlation between BP values obtained with the various methods was found, with the exception of the direct estimation of BP using method A, which did not correlate with any of the other methods. This lack of correlation was due to the fact that, although good fits were obtained with method A, the fitted BP parameters had high standard errors, ranging from 19 to 77%.
Binding potential of [11C]raclopride in striatum
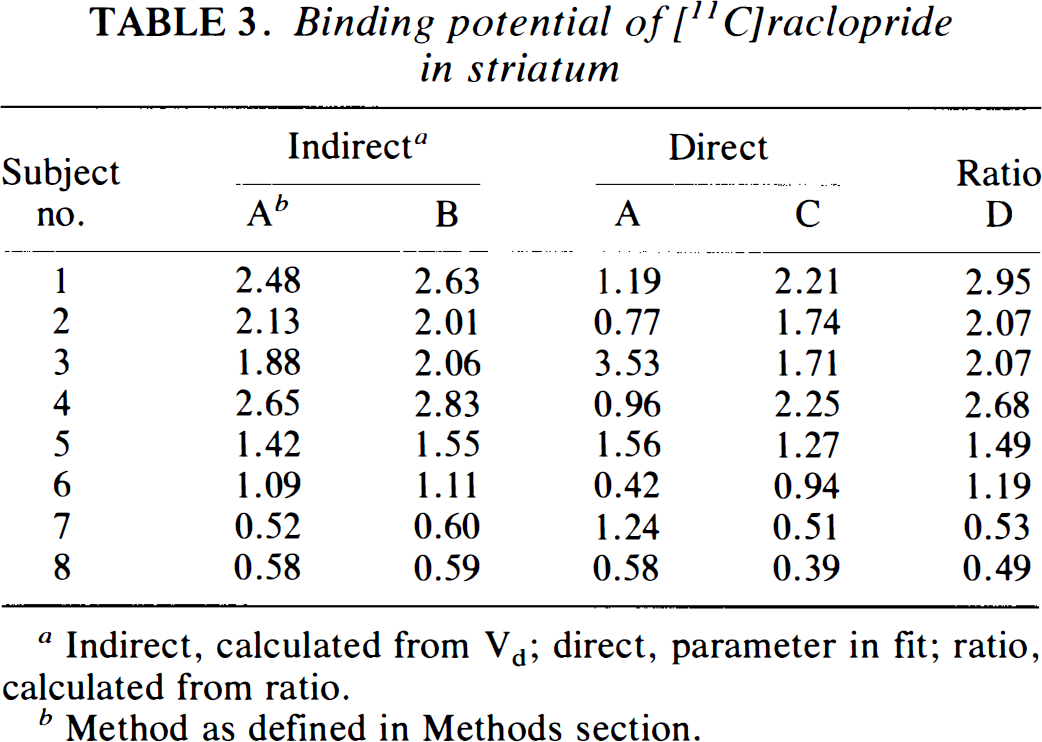
Indirect, calculated from Vd; direct, parameter in fit; ratio, calculated from ratio.
Method as defined in Methods section.
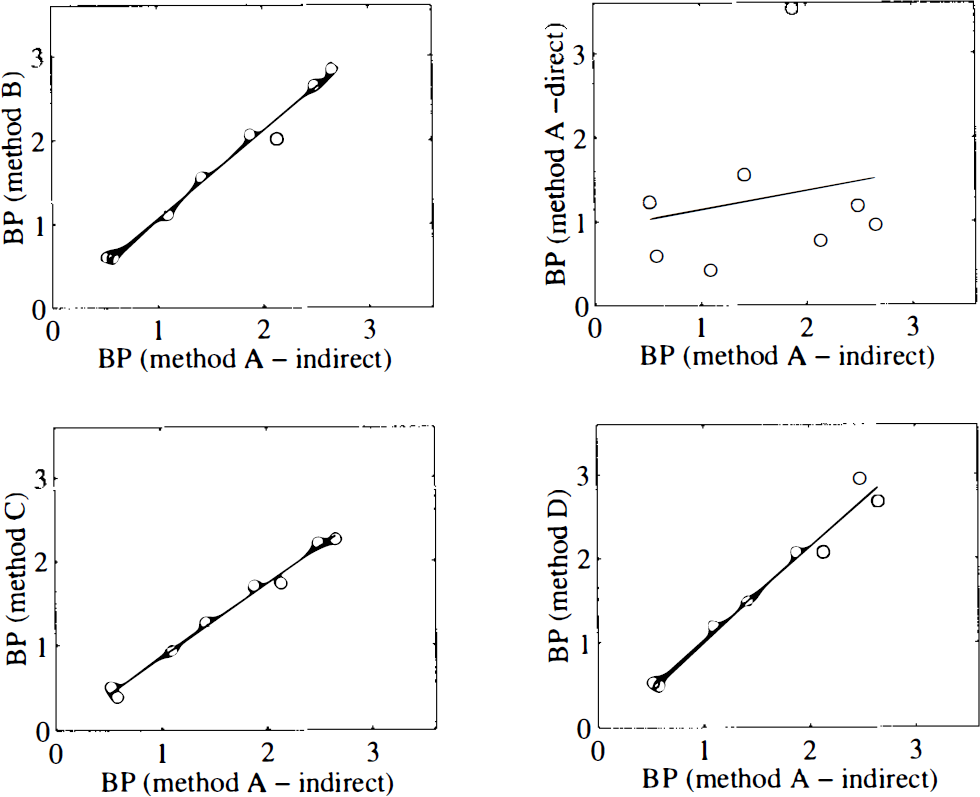
Correlation between estimates of binding potential (BP) obtained with the various methods and those obtained with the indirect application of method A, where BP was calculated from cerebellum and striatum Vd values. Method A—direct refers to the directly fitted BP parameter with method A. The straight lines were obtained with linear regression analysis.
Dose-response curves for the other four BP estimates are given in Fig. 5. As expected from the correlation between these parameters, all dose–response curves showed a similar and consistent pattern.
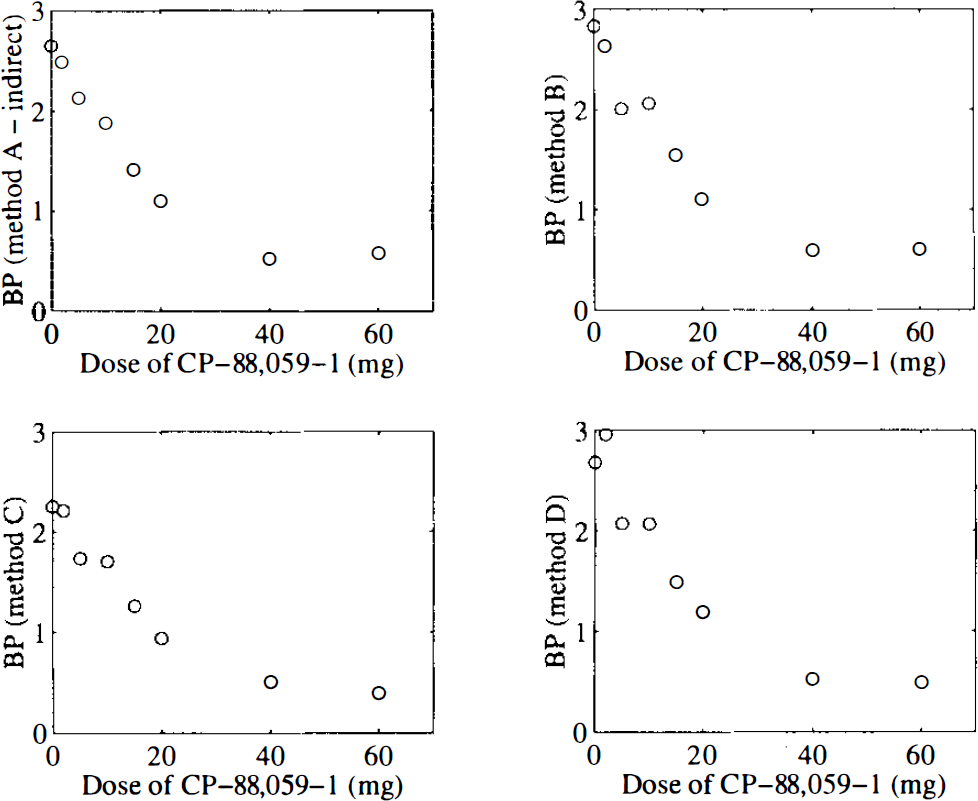
Dose-response curves of CP-88,059-1 using the estimates of binding potential (BP) obtained with the various methods. No consistent dose–response curve was observed with the directly fitted BP parameter of method A and results are not shown.
Use of an average rather than individual metabolite correction had little effect on the indirect (through Vd) estimation of BP using method A (two-tissue compartments). The range of BP values ranged from 3% lower to 4% higher when compared with the corresponding values from the analyses using individual metabolite corrections, despite the fact that individual Vd values for striatum and cerebellum were up to 15% different. For method B (single-tissue compartment) the difference in BP values using average compared with individual metabolite corrections ranged from −5 to −13%.
Application of the reference tissue model (method C) to a different group of seven normal controls resulted in a BP value of 2.20 ± 0.31 (mean ± SD), which was similar to the value obtained for the placebo study (subject 4). BP calculated from the ratio (method D) for the same group of subjects was 2.38 ± 0.72.
DISCUSSION
The ideal method for the analysis of clinical PET data is often a tradeoff between accuracy and simplicity. Given the widespread use of [11C]raclopride and the variety of reported tracer procedures (see beginning of this article), a comparison between various methods seemed appropriate.
The methods were applied to data obtained from a dose-ranging study of the neuroleptic CP-88,059-01. The pharmacokinetic aspects and results of this dose-ranging study have previously been published (Bench et al., 1993). Although the number of subjects (n = 8) was relatively small for a comparative study, this disadvantage was outweighed by the possibility to test the various methods over a wide range of receptor occupancies. Because neither CBF (Bench et al., 1993), nor the formation of labelled metabolites (Fig. 2) were correlated with the administered dose of CP-88,059-1, extrapolation of the results to clinical situations of reduced receptor densities seems reasonable. The level of labelled metabolites as a function of time (Fig. 2: range 25–46% at 40 and 25–50% at 60 min after injection) was similar to that previously reported by Swahn et al. (1992) (24% at 42 min after injection) and Volkow et al. (1993) (32% at 60 min after injection).
Using metabolite-corrected input functions (methods A and B) for cerebellum and striatum, K1 values ranging from 0.10 to 0.15 were found, corresponding with a first-pass extraction fraction of ∼20%, similar to that of a previous report (Farde et al., 1989). Also confirming Farde's earlier work was the finding that two-tissue compartments were preferred for the cerebellum fits. The absence of D2 receptors in the human cerebellum (Fields et al., 1977; Camps et al., 1989), the fact that the labelled metabolites of [11C]raclopride do not cross the blood–brain barrier (Köhler et al., 1985; Ross and Jackson, 1989), and the fact that k3 values are not reduced by a decrease in specific activity of [11C] raclopride (Farde et al., 1989) would indicate that this second tissue compartment represents nonspecific binding that is not infinitely fast. This was confirmed by the lack of correlation between cerebellum Vd and dose of CP-88,059-1. Based on K1/k2 ratios and total Vd values (both from method A), a contribution of ∼25% of the total cerebellum Vd could be attributed to the second tissue compartment, which is higher than the 5–10% nonspecific binding found in rat brain (Köhler et al., 1985). It should be noted, however, that the second compartment is not required for rat cerebellum (Hume et al., 1992b) and that for other ligands nonspecific binding has been shown to be higher in human brain than in rat brain (e.g., Hume et al., 1992a). An alternative explanation for the presence of two-tissue compartments would be the existence of parallel, rather than sequential, compartments as a result of heterogeneity within the sampled cerebellum (i.e., grey and white matter).
On statistical grounds, both methods A and C provided significantly better fits to the striatum data than method B, although in practice the differences were relatively small (Fig. 3). For example, calculated Vd was on average only 5% higher with method A than with method B (8% for cerebellum, Table 2). In this small series of subjects, no consistent difference between methods A and C was seen, with method A providing the best fits in five and method C in three subjects, respectively.
It is well established that a single tracer administration study does not permit the measurement of Bmax and Kd separately (Mintun et al., 1984). However, the binding potential BP (= k3/k4), a measure of Bmax/Kd, is a useful parameter for the quantification of receptor binding characteristics (Hume et al., 1992b). This parameter, which is also more stable than individual k3 and k4 values was, therefore, selected for the comparison of the various methods. BPs were obtained directly from the fits (fitting for k3/k4, methods A and C) or indirectly calculated from striatum and cerebellum Vd (methods A and B) or from the ratio of striatum over cerebellum counts at late times (30–60 min, method D).
With the exception of the directly fitted BP using method A, all estimates of BP (Table 3) correlated with each other (Fig. 4) and resulted in similar dose–response curves for CP-88,059-1 (Fig. 5). The failure of the direct application of method A was due to the instability of the parameter BP (high standard errors), probably related to the relatively poor separation of the two compartments, as indicated by the small difference between two- and single-tissue compartment fits in Fig. 3. On the other hand, the total volume of distribution for striatum and cerebellum should be determined more accurately with the inclusion of a second tissue compartment (better fits) and, therefore, the indirect measurement of BP using method A should be a better estimate of BP than that obtained with method B. However, differences were small (Fig. 4, Table 3).
It should be noted that, although a good correlation between methods existed, quantitative differences were observed, with the highest BP estimates from the ratio and the lowest from the reference tissue method. One possible explanation for these quantitative differences is a potential difference in the effect of nonspecific binding on the estimation of BP. For example, if the kinetics of the nonspecific binding were described by k5 and k6 [i.e., Vds = (K1/k2)·(1 + k3/k4 + k5/k6) and Vdc = (K1/k2)·(1 + k5/k6)], it can be seen that the indirect methods [i.e., using BP = (Vds — Vdc)/Vdc] would underestimate true BP by a factor 1 + k5/k6, provided nonspecific binding was the same in striatum and cerebellum. If the second tissue compartment in the cerebellum were representative of nonspecific binding, this underestimation would be on average ∼20%. Possible higher levels of nonspecific binding in the striatum than in the cerebellum, as suggested by Seeman et al. (1990), would tend to reduce this underestimation. For example, for normal BP, a 35% higher level of nonspecific binding in the striatum would lead to an overestimation of <5%. However, this effect would be dependent on the BP itself and could rise to ∼15% for the studies with the highest doses of CP-88,059-1.
The two different effects of nonspecific binding would also apply to the estimation of BP from the ratio (method D). However, even in the absence of nonspecific binding, the ratio from a secular equilibrium study tends to overestimate BP to a degree that is dependent on tissue kinetics and the rate of plasma clearance (Carson et al., 1993). Thus, the tissue concentration at any given time is related to the history of the plasma curve, not the instantaneous (decreasing) plasma concentration.
The effects of nonspecific binding on the estimation of BP using the reference tissue model (method C) is more complicated. Theoretically, the model is only correct if the cerebellum can be described by a single-tissue compartment (Hume et al., 1992b). It has been reported that a small amount of specific binding in the reference tissue can underestimate Bmax for the target tissue with a much smaller effect on Kd (Cunningham et al., 1991). Similarly, an underestimation of BP would be expected if nonspecific binding in the reference tissue had to be described by a second tissue compartment. However, this effect would be somewhat counteracted by the presence of possibly a higher degree of nonspecific binding in the striatum.
It should be noted that the tracer kinetic description provided in Appendices A, B, and C is related to the the total concentration of unmetabolised [11C]raclopride. If significant protein or lipid binding in plasma exists, only part of the [11C]raclopride (free fraction) will be available for transfer from plasma to tissue (Mintun et al., 1984). However, this will only affect K1 and the apparent volume of distribution of free [11C]raclopride (K1/k2). BP (=k3/k4), as obtained by any of the models described here, will not be affected. Nonspecific binding in tissue has been discussed previously herein for the case in which its kinetics is such that it needs to be described by additional rate constants k5 and k6. If, on the other hand, the kinetics of nonspecific binding in tissue is very fast, the equations in Appendices A, B, and C are still valid. In particular, there is no affect on the k3/k4 ratio. The free fraction in tissue, providing the truly free [11C]raclopride in tissue (Mintun et al., 1984), becomes important when this k3/k4 ratio is compared with the in vitro Bmax/Kd ratio.
The close correlation between most of the BP estimates (Fig. 4) indicates that all these methods, except the direct estimation of BP using method A, showed a similar sensitivity toward changes in BP. For methods A (indirect) and B, use of an average metabolite correction resulted in only a small loss of accuracy with respect to the estimation of BP, in particular for the indirect application of method A (<5%). This is due to the fact that the basic step in the calculation of BP is a division of two Vd values (striatum and cerebellum). Both will be affected in a similar manner by a slight change in the tail of the plasma curve, which can result from a change in metabolite correction. It should be emphasised that the aforementioned finding has been obtained in a group of normal subjects. It is possible that certain disease states or coadministered therapeutic agents might alter hepatic metabolism, resulting in systematic changes in tracer metabolic profiles. Because this may lead to artificial between-group differences, use of an average metabolite correction needs to be validated in each patient population separately.
Although in the present study the labour-intensive measurements of plasma metabolites could be omitted from methods A and B, by using an average metabolite correction, methods C (reference tissue) and D (ratio) have the additional advantage that no metabolite-corrected plasma input function at all is required. Consequently, no arterial cannulation is required for these methods. In addition, because methods C and D are independent of the plasma curve, they are also independent of the tracer metabolic profile and, thereby, of possible errors in the measurement of metabolites.
Both linearised (Blomqvist, 1984) and graphic (Logan et al., 1990) variations of methods A and B have been described. However, these methods still require a measured (metabolite-corrected) arterial plasma input function. The main finding of the present study is that alternative methods exist that do not require arterial sampling and measurement of plasma metabolites. Therefore, only a comparison with the standard single (B) and two (A)-tissue compartment models seems sufficient.
Method D has the advantage that, in principle, only a single scan is required that can be initiated 30 min after injection. However, in practice, the gain in time is less. A transmission scan is still required for attenuation correction purposes. In addition, the overestimation of BP from the ratio is dependent on BP itself and could be different in situations of low flow. The reference tissue method, on the other hand, takes flow changes into account and provides a measure of striatum flow relative to cerebellum flow (Hume et al., 1992b). Finally, the ratio method only uses 30 min of data collection, starting 1.5 half-lives after injection. In contrast, the reference tissue method uses all data. Results of a further study on seven normal subjects were in agreement with the latter argument. The coefficients of variation of BP were 14% for method C and 30% for method D, respectively.
As already mentioned, the only method that did not require the use of cerebellum data (direct estimation of BP using method A) provided unsatisfactory results. All other methods made use of cerebellum data and should, therefore, be used with caution in the presence of cerebellar disease. In particular, cerebellar atrophy (e.g., multiple systems degenerations, anticonvulsant/seizure-associated cerebellar atrophy, alcohol exposure, or toxic/metabolic conditions) may affect the estimation of cerebellum tracer levels due to partial volume effects, thereby invalidating method D. Because the volume of distribution will be affected to the same extent, methods A and B also will be compromised. It is of interest to note that partial volume effects will primarily result in an underestimation of K1, but not of k2 (fractional clearance rate). Although the reference tissue model allows for differences in K1 between striatum and cerebellum, method C will also be affected by cerebellar atrophy, because the assumption of equal volumes of distribution of not specifically bound tracer in striatum and cerebellum (Eq. C.6) is no longer valid.
CONCLUSIONS
A number of methods for the analysis of single-injection [11C]raclopride PET studies provided estimates of striatum BP that correlated well with each other, despite some quantitative differences. Of the methods tested, only the direct fitting of BP using a metabolite-corrected plasma curve as input function did not provide reliable estimates.
The reference tissue compartment model and count ratio methods, in avoiding arterial cannulation, greatly simplify both data collection and analysis procedures. Both methods can be used for the analysis of routine clinical studies, without sacrificing the sensitivity for detecting changes in specific binding. Based on the safeguard against possible breakdown of underlying assumptions and possibly also on statistical grounds, the reference tissue method is to be preferred.
Footnotes
APPENDIX A
In Fig. A1 a schematic diagram of a two-tissue compartment model as applied to PET studies is given. It shows the calculation of the plasma input function from the continuously measured arterial whole blood time-activity curve, indicating the corrections for labelled blood cells and metabolites. The differential equations relating to this compartment model follow from Fig. A1 and are well known:
where Cp = Metabolite-corrected plasma concentration (kBq ml−1)
In practice, only the total concentration Ct within a region is measured. This is related to the free and bound concentrations by:
From Eqs. A.1 to A.3 the usual relationship between the tissue concentration Ct and the metabolite-corrected plasma concentration Cp for a two-tissue compartment model, as function of time, can be derived:
with a = r · (k3 + k4 — c)
However, with PET a macroscopic ROI will be sampled that will contain a significant contribution from intravascular activity in the early phase after a bolus injection. This “background” signal will not depend on the plasma concentration, but on all activity within the intravascular space, i.e., the whole blood concentration Ca. A blood volume component Vb should therefore be included in the measured ROI concentration CROI as follows:
From Eqs. A.4 and A.5, the parameters K1, k2, k3, k4 and Vb can be obtained using standard nonlinear regression analysis. From k3 and k4, the BP can be calculated as:
Alternatively, if Eq. A.6 is substituted in Eq. A.4, BP (together with K1, k2, k3 and Vb) can be fitted directly, which was the approach adopted for the direct estimation of BP.
It should be noted that previous equations have been derived for negligible nonspecific binding of the tracer. However, if the kinetics of nonspecific binding are fast, the previous equations are still valid, because the rapid exchange between free and nonspecific pools effectively increases the free compartment. On the other hand, for slower nonspecific kinetics, the k3/k4 ratio will contain a nonspecific component. For the cerebellum this ratio will be dominated by nonspecific binding.
APPENDIX B
Figure B1 shows a schematic diagram of a single-tissue compartment model as applied to PET studies. The description of plasma and whole blood components is exactly the same as that shown in Fig. A1. However, the tissue is now represented by a single compartment. The tissue concentration Ct is related to the metabolite-corrected plasma concentration Cp, as function of time t, according to the usual equation for a single-tissue compartment model:
where K1 = Rate constant for transfer from plasma to tissue compartment (ml ml−1 min−1)
Again, in analogy with Appendix A, a blood volume component Vb, related to the whole blood concentration Ca, needs to be taken into account to describe the measured ROI concentration CROI:
APPENDIX C
A schematic diagram of the reference tissue model is given in Fig. C1. The differential equations of this compartment model as function of time t are as follows:
where Cp = Metabolite-corrected plasma concentration (kBq ml−1)
As mentioned in Appendix A, in practice only the total concentration Ct within a “specific” region is measured. This is related to the free and bound concentrations by:
From Eqs. C.1 to C.4 it is possible to derive a relationship between Ct and Cr that contains K1 to k4, K1′ and k2′, but not Cf, Cb, and Cp. However, this equation still contains six parameters with the rate constants K1 and K1′ only entering as a ratio. This ratio accounts for differences in delivery between specific and reference tissue. Substituting
and assuming that the volume of distribution of the not specifically bound tracer in both tissues is the same
results in the following relationship between Ct and Cr:
with a = (k3 + k4 — c) · (c — r)/p
Using standard nonlinear regression analysis, Eq. C.7 can now be used to obtain best estimates for R1, k2, k3, and BP (after substitution of BP = k3/k4) from the measured tissue concentrations Ct(t) and Cr(t), without the need for measuring Cp(t). The operational equation takes into account differences in delivery between specific and reference tissue (R1). In addition, it does not assume that Cr(t) equals Cf(t).