
Abstract
Positron emission tomography (PET) imaging of small striatal brain structures such as the ventral striatum (VST) has been hampered by low spatial resolution causing partial-volume effects. The high-resolution research tomograph (HRRT) is a brain-dedicated PET scanner that has considerably better spatial resolution than its predecessors. However, its superior spatial resolution is associated with a lower signal-to-noise ratio. We evaluated the test–retest reliability of the striatal and thalamic dopamine D2 receptor binding using the HRRT scanner. Seven healthy male volunteers underwent two [11C]raclopride PET scans with a 2.5-hour interval. Dopamine D2 receptor availability was quantified as binding potential (BPND) using the simplified reference tissue model. To evaluate the reproducibility of repeated BPND estimations, absolute variability (VAR) and intraclass correlation coefficients (ICCs) were calculated. VAR values indicated fairly good reproducibility and were 3.6% to 4.5% for the caudate nucleus and putamen and 4.5% to 6.4% for the lateral and medial part of the thalamus. In the VST, the VAR value was 5.8% when the definition was made in the coronal plane. However, the ICC values were only moderate, in the range of 0.34 to 0.66, for all regions except the putamen (0.87). Experimental signal processing methods improved neither ICC nor VAR values significantly.
Introduction
In quantification of striatal D2 receptor binding in vivo in humans using positron emission tomography (PET), [11C]raclopride is a well-validated tracer. Previous studies with different test–retest time intervals and quantification methods indicate that the region of interest (ROI) measurement of striatal [11C]raclopride binding is highly reliable (Volkow et al, 1993; Mawlawi et al, 2001; Hirvonen et al, 2003). However, PET measurements have bias because of the partial-volume effect (PVE) caused by the low spatial resolution, especially when imaging the small, D2 receptor-rich striatal brain structures such as the caudate nucleus and the ventral striatum (VST) (Sureau et al, 2008). Brain imaging has recently benefited from the development of scanners such as the high-resolution research tomograph (HRRT), which has a spatial resolution in the range of about 2.5 to ∼3 mm in the 10-cm field of view that covers most of the brain (de Jong et al, 2007). The ability to reliably measure dopamine D2 receptor binding in striatal subregions is important, because these regions are differentially involved in cognitive and motor performance both in healthy volunteers and in patients with Parkinson's disease (DeLong, 1983; Evarts and Wise, 1984; Volkow et al, 1993; Bäckman et al, 2000; Kaasinen and Rinne, 2002). In addition, the VST has recently attracted attention because of its role in human behavior and its disorders such as addiction (Floresco et al, 2008; Belin and Everitt, 2008). However, applying a high-resolution scanner is associated with a lower signal-to-noise ratio, which may impair the reliability of the measurement (Sureau et al, 2008; Johansson et al, 2007). Evaluation of the test–retest variability of PET measurement is particularly important in studies in which the same individuals are scanned repeatedly before and after intervention or when small brain structures, such as the VST, are analyzed. Knowledge about the test–retest variability also allows to estimate the number of subjects needed to detect a change in tracer binding, for instance after experimental intervention.
In this study, we evaluated the test–retest reliability of the striatal and thalamic D2 binding by administering a single bolus of [11C]raclopride twice on the same day in seven healthy males and collecting data using the HRRT scanner. A novel approach in data sampling was implemented to account for potential bias in statistical image reconstruction of the HRRT data, and a recently introduced resolution-modeling image reconstruction algorithm (Comtat et al, 2008) was applied for evaluation purposes.
Materials and methods
The study protocol was approved by the Ethics Committee of the Hospital District of Southwestern Finland. The study subjects were given written information about all the relevant issues involved in this study. A written consent was obtained from each subject. This study was performed according to the ethical guidelines given by the Declaration of Helsinki.
Subjects
Seven healthy male subjects free of any somatic or psychiatric illness volunteered to take part in the study. All were right handed and nonsmokers. To exclude any structural brain abnormalities and to obtain anatomic reference, all subjects underwent 1.5 T magnetic resonance imaging. The age, height, and weight of the subjects were 24.5 ± 3.5 years, 185.5 ± 12.5cm, and 74 ± 14 kg, respectively (mean ± s.d.). Each subject underwent two [11C]raclopride PET scans during the same day between 10.00 a.m. and 6.00 p.m., at least 2.5 hours apart.
Preparation of [11C]raclopride
The precursor
Positron Emission Tomography Imaging
Positron emission tomography experiments were performed using a brain-dedicated high-resolution PET scanner, the ECAT HRRT (Siemens Medical Solutions, Knoxville, TN, USA). The HRRT is a dual-layer, crystal-detector scanner allowing a depth-of-interaction measurement for the coincident photons. It is characterized by an isotropic 2.5-mm intrinsic spatial resolution. Spatial resolution in the reconstructed images varies in the radial and tangential directions from about 2.5 to ∼3 mm and in the axial directions from 2.5 to 3.5 mm in the 10-cm field of view covering most of the brain (de Jong et al, 2007).
The left antecubital vein was cannulated and a single [11C]raclopride bolus injection was administered intravenously and flushed with saline. The injected dose, specific radioactivity, and the injected mass for the test and retest scans were 413 ± 91 MBq, 222 ± 154 MBq/nmol, and 2.47 ± 4.68 μg versus 393 ± 99 MBq, 257 ± 142 MBq/nmol, and 0.68 ± 0.35 mg, respectively, (mean ± s.d.), see Table 1. There were no statistically significant differences in the injected doses (paired
[11C]raclopride injections and their test–retest characteristics
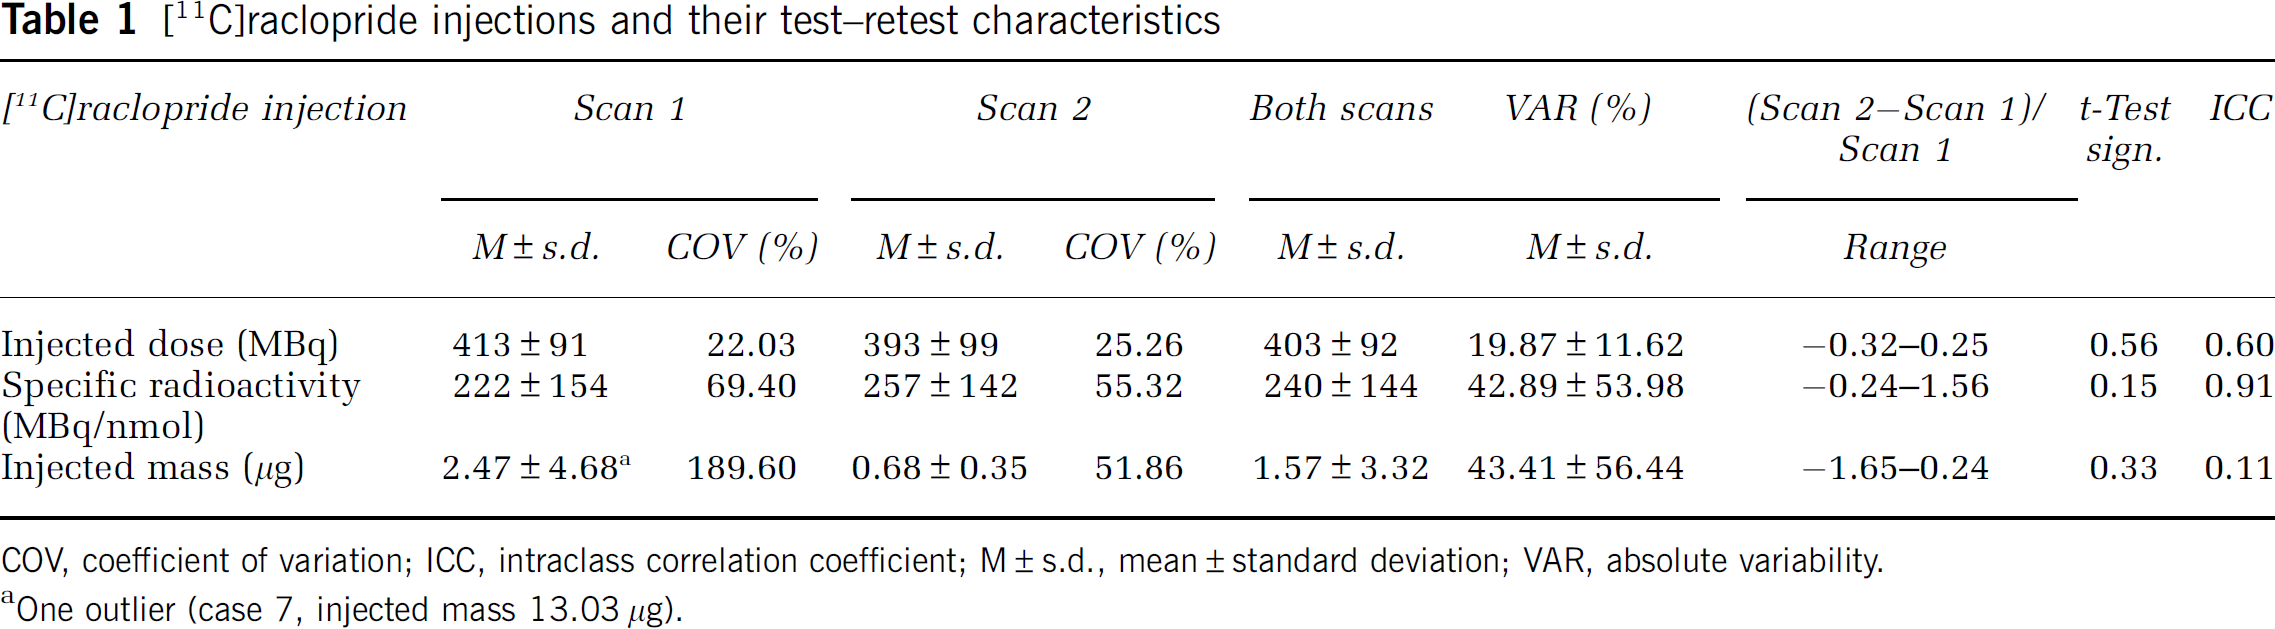
COV, coefficient of variation; ICC, intraclass correlation coefficient; M ± s.d., mean ± standard deviation; VAR, absolute variability.
One outlier (case 7, injected mass 13.03 μg).
An individually shaped thermoplastic mask was used with each subject to minimize the head movement. To monitor the head movement, an external position detector (Polaris Vicra, Northern Digital, Waterloo, Ontario, Canada) was used. The position information was converted into motion information by subtracting the average reference position (transmission scan position) coordinates from the position data. A representative motion parameter was obtained by taking the norm of the translation vector. The external motion data were used to estimate three features of motion, which hamper the quality of PET imaging. First, translocation from the transmission scan (TX) position may cause erroneous attenuation correction. To measure distance from the TX position, the mean of the norm vector was calculated within each frame. Second, within-frame motion, which may cause signal blurring, was measured as the amplitude of the norm vector within each frame. Finally, frame-to-frame motion, which may cause sudden changes in the time–activity curve, was measured as the mean of the norm from the previous frame position (transmission scan position for the first frame). Distance from the TX position, the within-frame motion, and the frame-to-frame motion for the test and retest scans were 1.11 ± 0.58, 0.46 ± 0.47, 0.21 ± 0.25 mm versus 1.09 ± 0.56, 0.47 ± 0.46, and 0.21 ± 0.19 mm, respectively (mean ± s.d.), and there were no systematic differences in motion between the test and retest scans. Thus, the amount of motion was negligible and in average tolerable compared with scanner resolution. Frame-to-frame coregistration was deemed unnecessary based on external motion recordings.
Quantification of [11C]raclopride Binding
All images were corrected for attenuation, scattering, and random events, scanner dead time, and detector normalization, and finally calibrated to kBq/mL within decay correction. Prompt and random events, attenuation, and scatter correction and normalization factors were processed in 3D sinogram mode, with an axial compression of span 9 and a maximum ring difference of 67, resulting in 2,209 sinograms in 16 segments. Tissue attenuation maps were reconstructed using the maximum a posteriori for transmission data (MAP-TR) algorithm with the standard human brain priors for air, bone, noise, water, or soft tissue (Nuyts et al, 1999). The 3D attenuation correction sinograms were obtained by forward projecting the tissue attenuation maps. Scattered events were estimated using the single scatter simulation algorithm (Watson, 2000), and randoms were estimated from the block singles using a variance reduction algorithm (Byars et al, 2005).
The [11C]raclopride uptake was measured continuously for 55 minutes after the injection. Histogramming was made in the following sequence of frames: 2 × 30, 9 × 60, 3 × 120, 3 × 180, and 6 × 300 seconds, resulting in altogether 23 frames. Image estimates with isotropic voxel dimensions of 1.22 mm × 1.22 mm × 1.22 mm were generated using a speed-optimized version of ordinary poisson ordered subsets expectation maximization (OP-OSEM-3D) reconstruction with 16 subsets and 8 iterations, if not otherwise mentioned (Hong et al, 2007).
The [11C]raclopride images were processed with SPM2 in Matlab 7.0.4 as follows. First, to correct the head positioning between two PET scans, PET-to-PET realigment was made between the sum images. Second, for anatomic reference, T1-weighted magnetic resonance images were coregistered to a mean image of the realigned PET images. Regions of interest were drawn using Imadeus software, version 1.2 (Forima, Turku, Finland) on coregistered magnetic resonance images. Thus, an identical set of ROIs was applied for both [11C]raclopride scans of the same subject. The regions of interest were defined in a transaxial plane on the caudate nucleus, the putamen, the VST, the cerebellum, and the thalamus. We divided the thalamus into a medial and a lateral part because there is a gradient in D2 receptor distribution between these sections (Kessler et al, 1993). In addition, VST was drawn in the coronal plane according to Mawlawi et al (2001) (Figure 1).
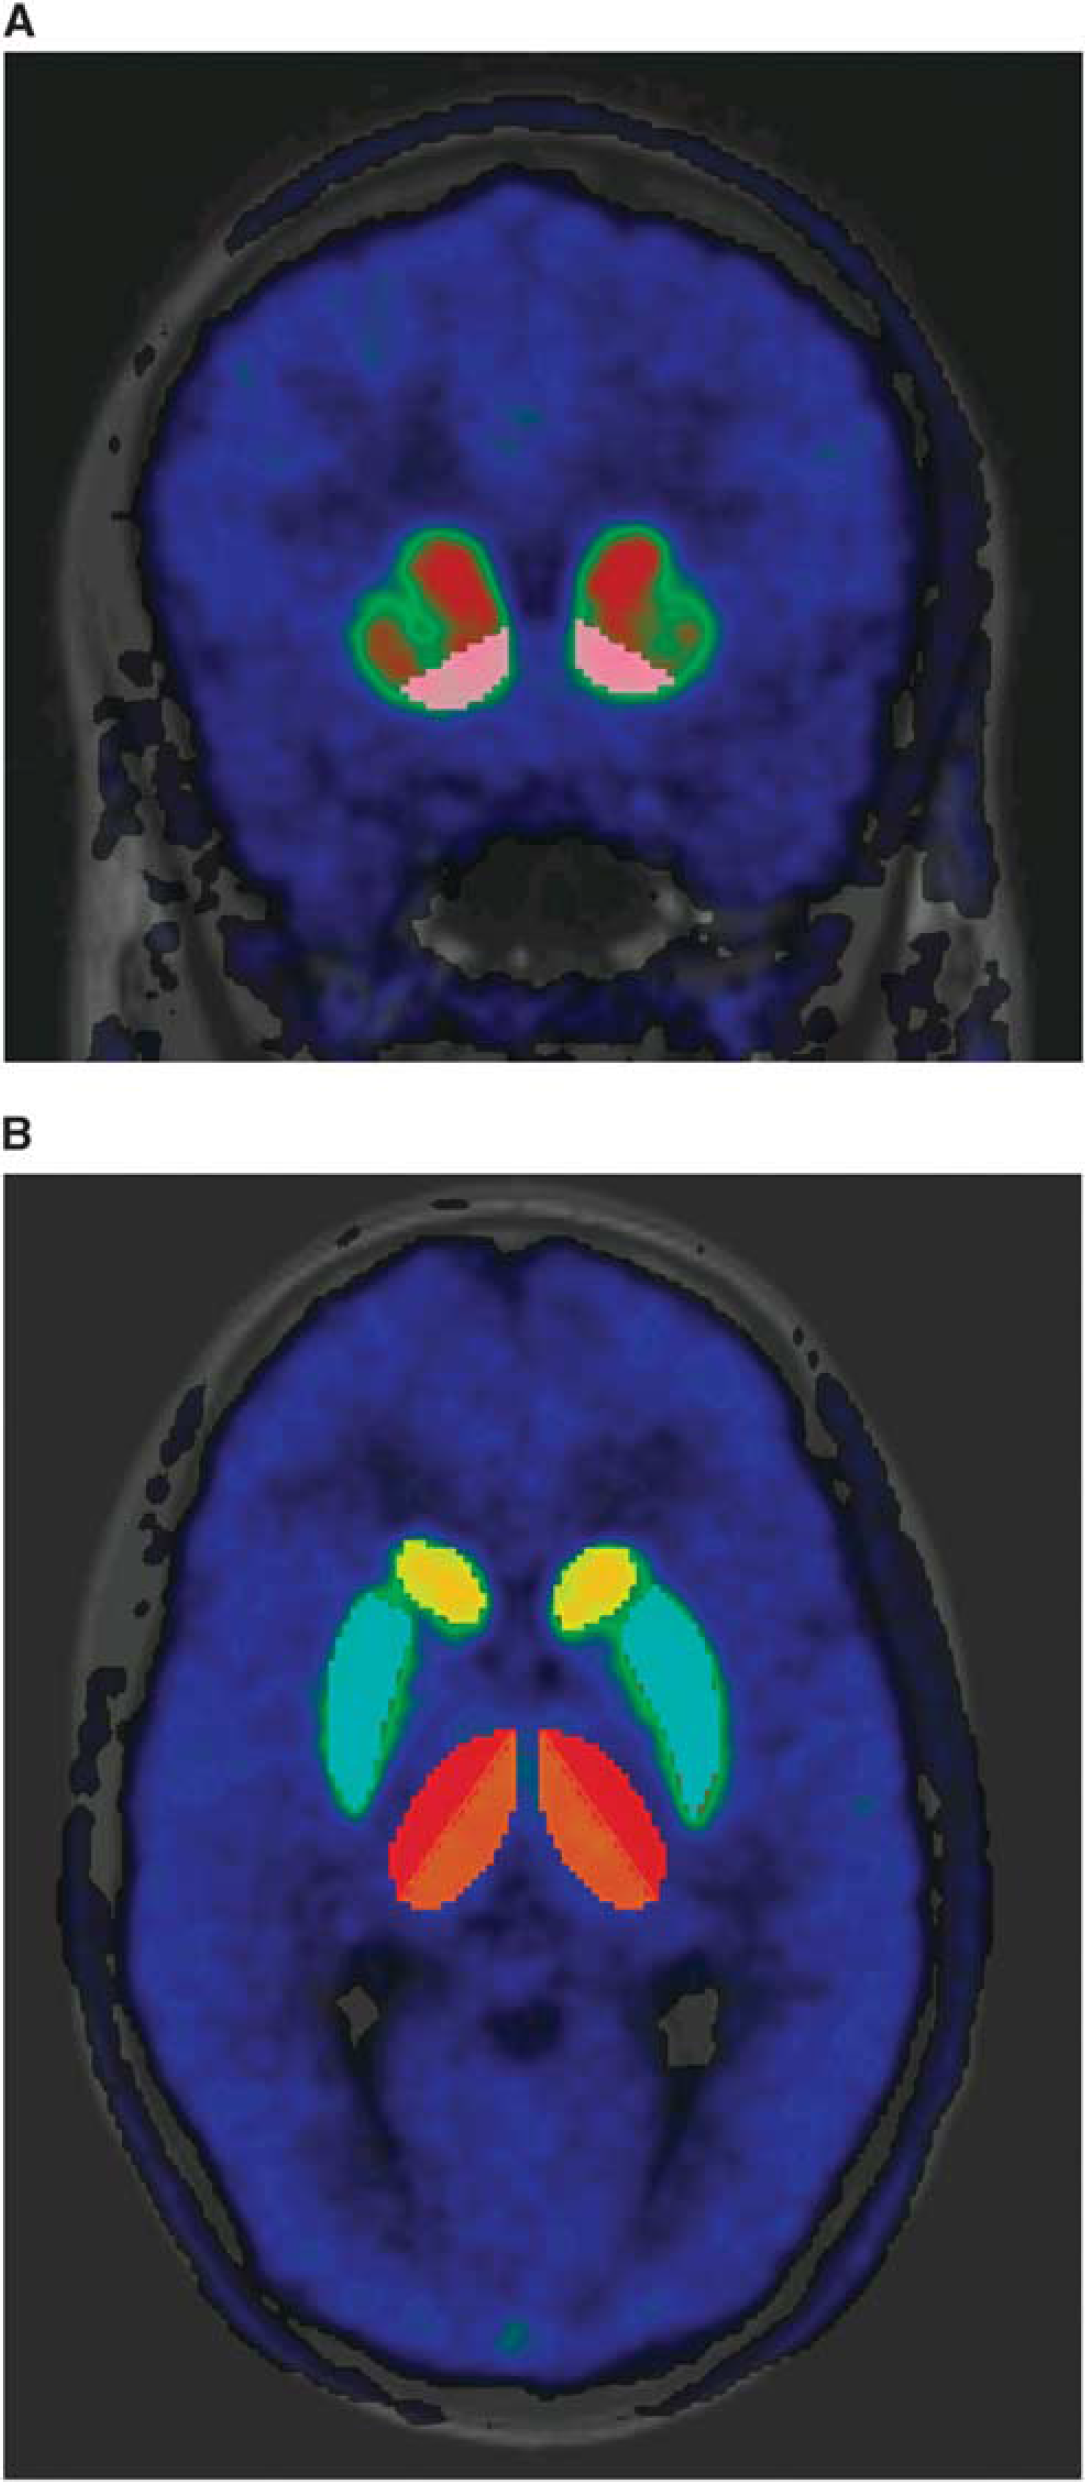
Activity distribution of [11C]raclopride in coronal view (
The mean activity concentration values in the ROIs were calculated and used to generate the regional time–activity curves. No partial-volume correction was made to the mean ROI values. These time–activity curves were used to calculate the regional [11C]raclopride binding potential (BPND) using the simplified reference tissue model with the cerebellum as reference tissue (Lammertsma and Hume, 1996). In this model, it is assumed that free plus nonspecific and specific binding equilibrium are reached so rapidly that they can be treated as a single compartment. Binding potential is defined according to the following equation: BPND =
Statistical Analyses
Test–retest variability was evaluated as follows:
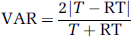
where
Test–retest consistency was measured with an intraclass correlation coefficient (ICC). Intraclass correlation coefficient can have a value between −1 and 1. Values closer to 1 indicate that most of the variance is due to between-subject variation rather than within-subject variation, which indicates good reliability, whereas values under 0 indicate greater within-subject than between-subject variation, indicating poor consistency. Values are expressed as mean ± s.d.
Paired two-tailed
Image Reconstruction With Fixed Counting Statistics
Conventionally, in the histogram mode image reconstruction, discrete time points are fixed in the sinogram space while counting statistics are let to vary. This procedure originated from old generation scanners that were not able to record all events as a stream in the acquisition disk. Modern scanners such as the HRRT record all events in a so-called list mode format, which allows us to determine framing after scanning, based on the number of acquired events for instance.
In PET, it is convenient to treat the acquired events as so-called noise-equivalent counts (NECs).
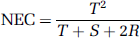
where
The rebinned sinogram data were reconstructed using the method described above. The head positioning between repeated PET scans was corrected using the coregistration parameters estimated from the original data, and thus the same ROIs were applied to yield new time–activity curves. Areas under the curve were calculated from both the original and the new sets of time–activity data and relative changes from original data were calculated as follows:
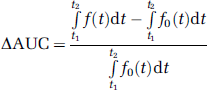
where
Image Reconstruction With Resolution Modeling
Additional image data were generated using a resolution model within the statistical reconstruction (Sureau et al, 2008). Resolution modeling exploits a measured point-spread function (PSF) of the scanner, which is assumed to be space invariant within the field of view. Implementation of the algorithm into OP-OSEM-3D has been described earlier (Comtat et al, 2008). The same PSF parameters, iteration number (10), and number of subsets (16) were used as in an earlier paper (Comtat et al, 2008). The same PET-to-PET coregistration parameters and ROIs as with the original data were applied, and the resulting time–activity course data were evaluated using the ΔAUC defined above. The BPs were reestimated using the above described method.
Results
The mean BPND values of the test and retest scans ranged from 0.65 ± 0.04 to 4.41 ± 0.47 with the conventional framing using the OP-OSEM-3D reconstruction (Table 2). The BPND was highest in the putamen, followed by the caudate nucleus and the VST. The BP values were lowest in the thalamus. Thalamic BPND values were nearly identical for the medial and lateral sections (BPND values 0.65 ± 0.04 and 0.67 ± 0.04, respectively). No noticeable lateralization of the [11C]raclopride binding was observed (
Regional [11C]raclopride BPND values and their test–retest characteristics
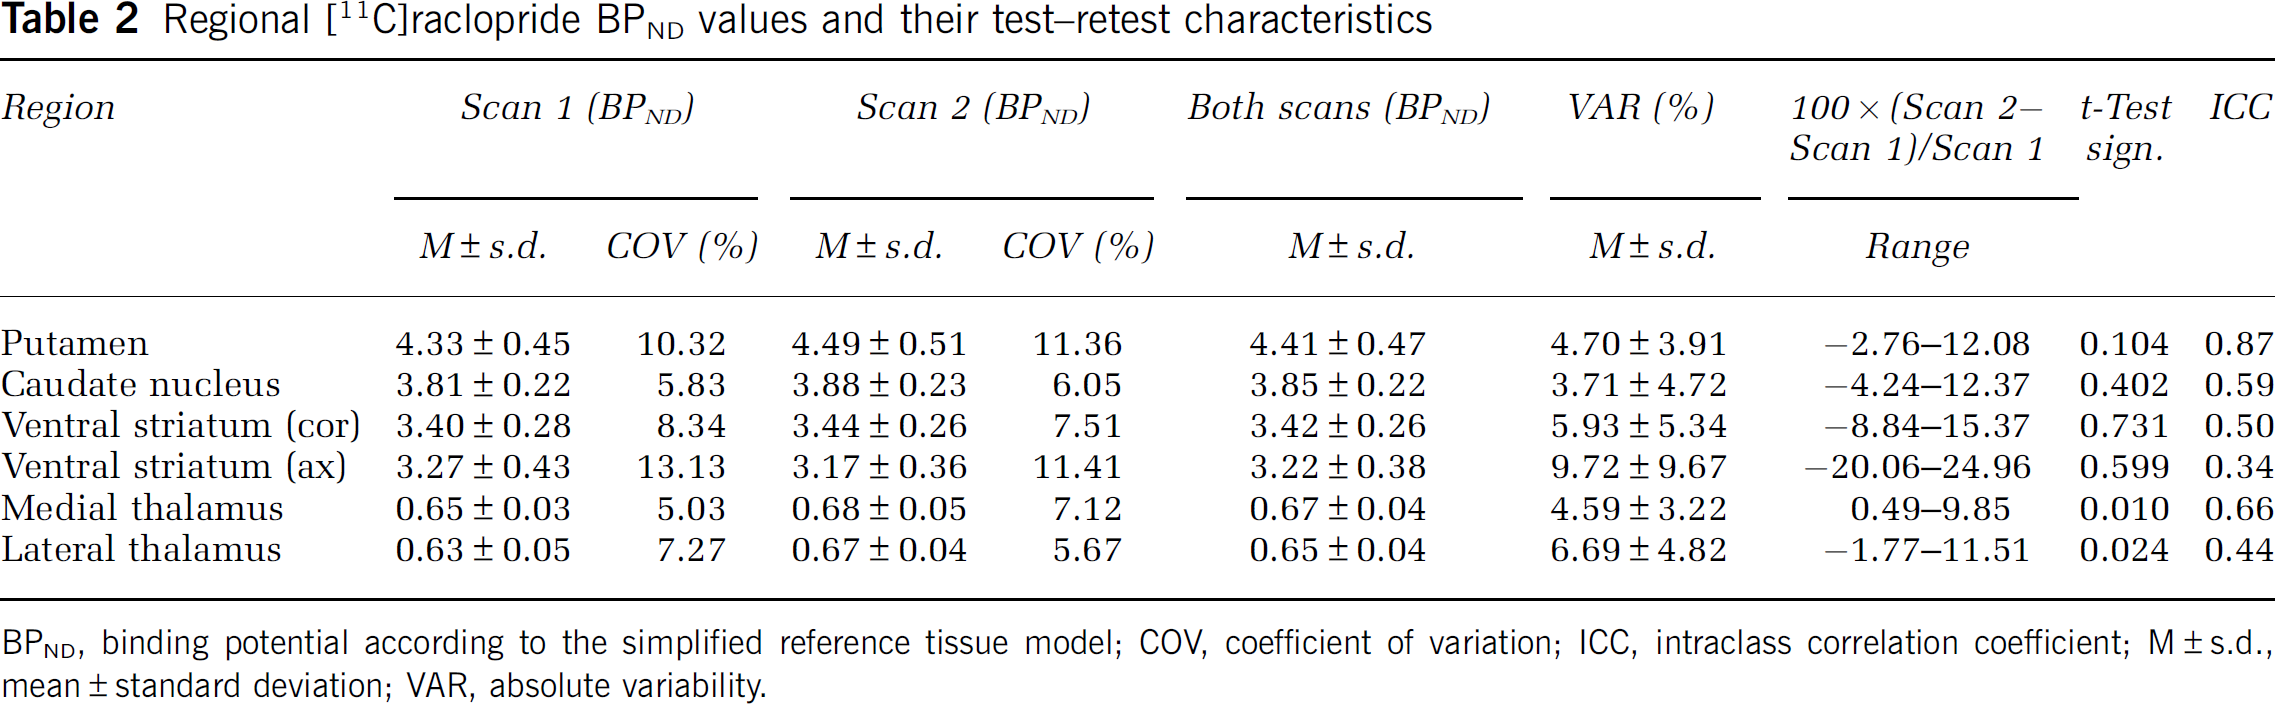
BPND, binding potential according to the simplified reference tissue model; COV, coefficient of variation; ICC, intraclass correlation coefficient; M ± s.d., mean ± standard deviation; VAR, absolute variability.
Variability and Consistency of the Test and Retest Scans
The test–retest VAR and ICC values for the combined ROIs are presented in Table 2. Mean VAR (%) values were 3.7% to 4.7% for the caudate nucleus and the putamen, and 4.6% to 6.7% for the lateral and medial part of the thalamus, indicating fairly good reproducibility in these regions. The BPND values measured from the putamen yielded high ICC values both for the separate hemispheres and for the combined hemispheres (0.87 for the combined putamen). In the caudate nucleus, the hemispheric ICC values varied considerably and the ICC value for the combined ROI was only moderate (0.59). Thalamic BPND values resulted in moderate ICC values of 0.44 for the lateral part and 0.66 for the medial part. For the VST, the ROIs defined in the coronal plane yielded higher BPND values than the ROIs drawn in the axial plane (3.42 ± 0.23 versus 3.22 ± 0.32, respectively). In addition, the VAR (5.9%) and the ICC (0.50) values were superior for the coronally defined VST ROIs as compared with those drawn on the axial plane (9.7% and 0.34, respectively).
Image Reconstruction With Fixed Counting Statistics
Figure 2 shows a typical set of time–activity course data obtained with the different framings and the relative changes in the AUC (ΔAUC(%)) are presented in Table 3.
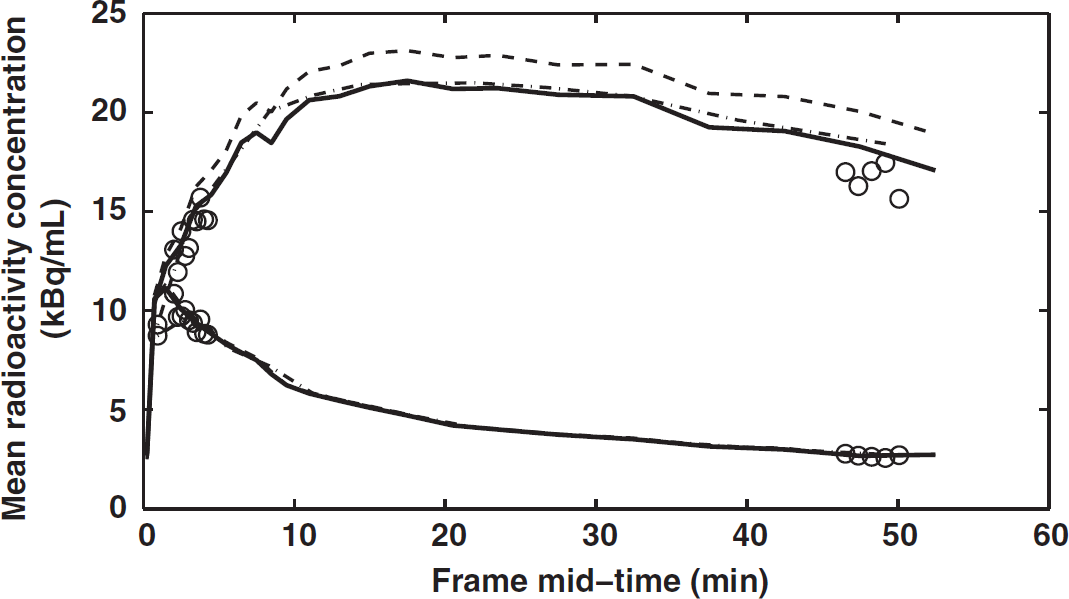
A typical example of regional time–activity course data in the putamen and the cerebellum estimated by the different framings and the point-spread function (PSF) reconstruction. Solid line is for original framing with non-PSF reconstruction, dashdot line is for high statistics framing, dashed line is for PSF reconstruction, and circles are for low statistics framing.
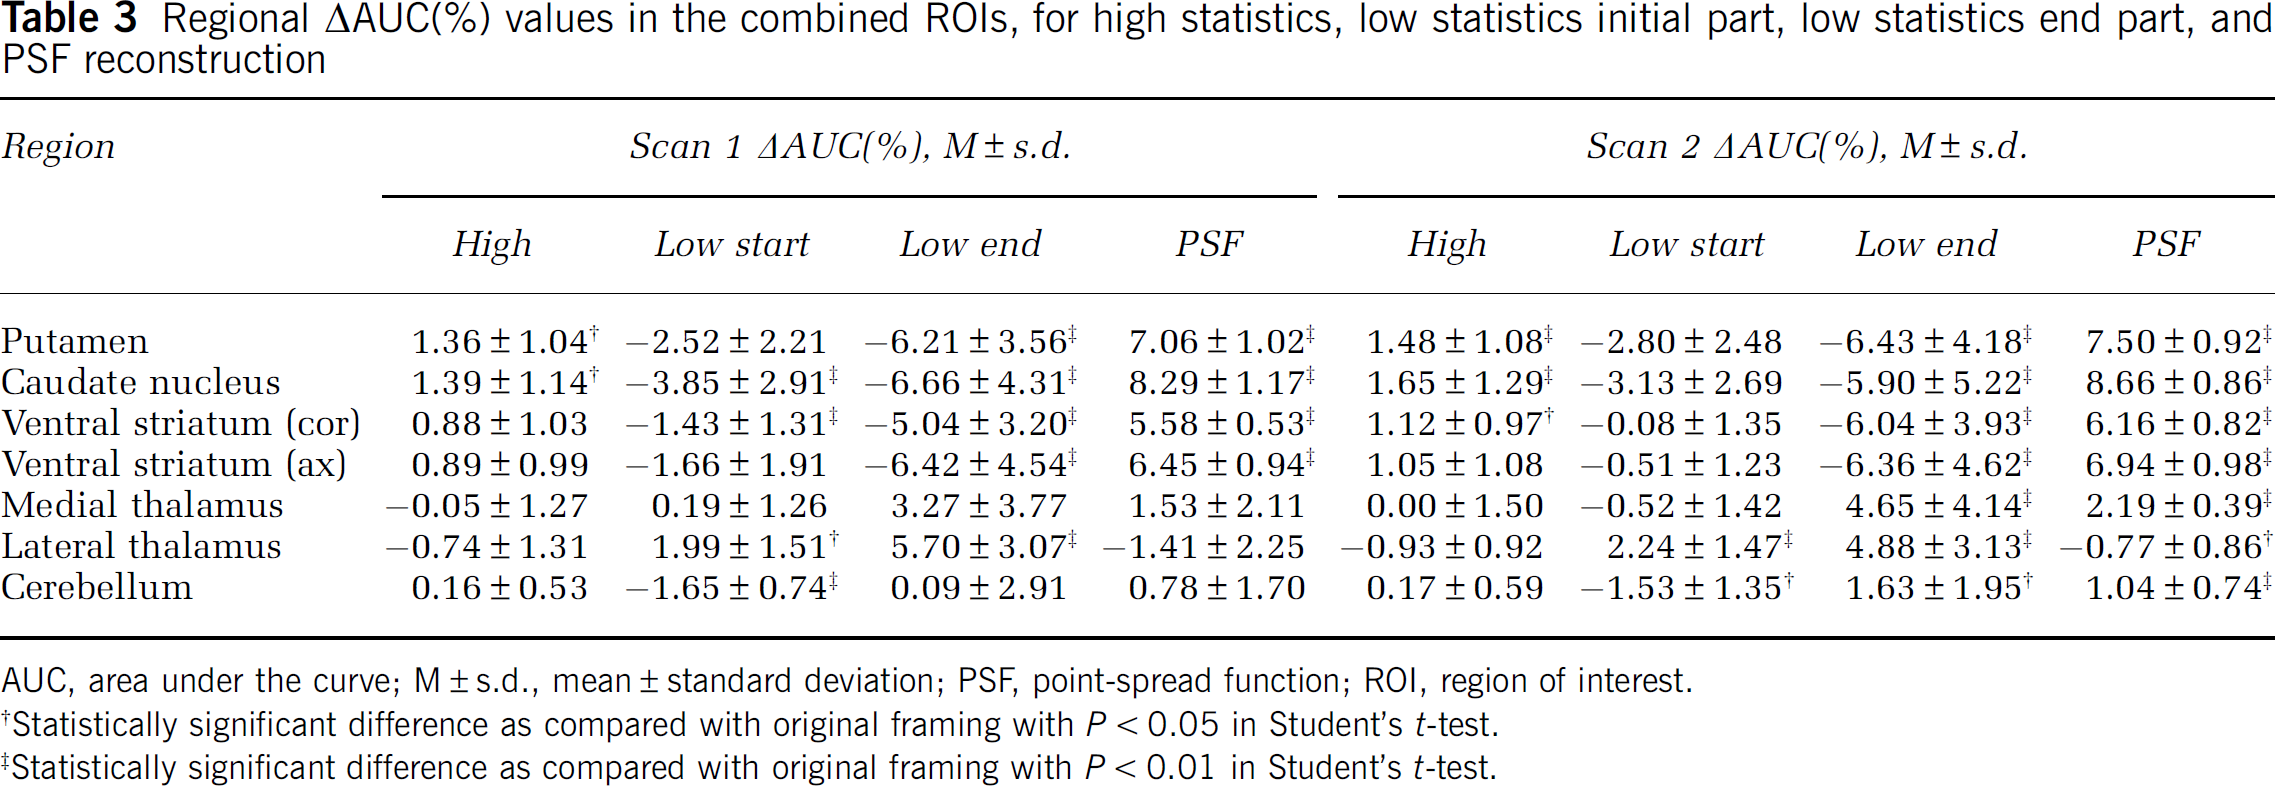
Regional ΔAUC(%) values in the combined ROIs, for high statistics, low statistics initial part, low statistics end part, and PSF reconstruction
AUC, area under the curve; M ± s.d., mean ± standard deviation; PSF, point-spread function; ROI, region of interest.
Statistically significant difference as compared with original framing with
Statistically significant difference as compared with original framing with
Regional ΔAUC(%) values have nonzero means for both the high and low statistics. High counting statistics yielded a positive mean in both the scans in the caudate nucleus (1.39 ± 1.14 and 1.65 ± 1.29), in the putamen (1.36 ± 1.04 and 1.48 ± 1.08), in the VST (transaxial ROI, 0.89 ± 0.99 and 1.05 ± 1.08), and in the cerebellum (0.16 ± 0.53 and 0.17 ± 0.59). However, negative (or zero) means were observed in both the scans in the medial (−0.05 ± 1.27 and 0.00 ± 1.50) and in the lateral parts of the thalamus (−0.74 ± 1.31 and −0.93 ± 0.92). Thus, high counting statistics yielded larger AUC estimates as compared with the original in the regions with high radioactivity concentration (RC) and smaller AUC estimates in the regions with low RC. For the low statistics, the behavior of the mean ΔAUC(%) was inversed: the caudate nucleus and the putamen had negative means in both the scans in the beginning and at the end of the scan, whereas the thalamus had positive means in all cases except for the start of the second scan. In the cerebellum, the mean ΔAUC(%) was −1.65 ± 0.74 and −1.53 ± 1.35 in the beginning of the scan but 0.72 ± 3.02 and 1.49 ± 1.94 at the end of the scan. However small, the direction of the change in the AUC is clear—high counting statistics yielded larger estimates in the high RC regions and smaller estimates in the low RC regions as compared with low counting statistics. Although statistically significant in the paired
BPND estimates and the VAR and ICC values for combined ROIs with the high statistics framing are presented in Table 4. Changes in the mean BPND were positive in the caudate nucleus (2.86%), in the putamen (2.95%), in the axially drawn VST (2.17%), and in the coronally drawn VST (2.05%), and negative or zero in the lateral (−1.59%) and medial parts of thalamus (0.00%) as compared with the conventional framing. In the VAR and ICC, the changes were more ambiguous, as high counting statistics yielded higher VAR in the caudate nucleus, the putamen, and in the lateral part of thalamus, but lower VAR in the medial part of thalamus and in the VST. None of the regions had significantly different mean VAR as compared with the original framing. The high counting statistics improved the ICC in the thalamus and in the coronally defined VST, whereas in the other regions, the change was negative or zero.
Regional [11C]raclopride
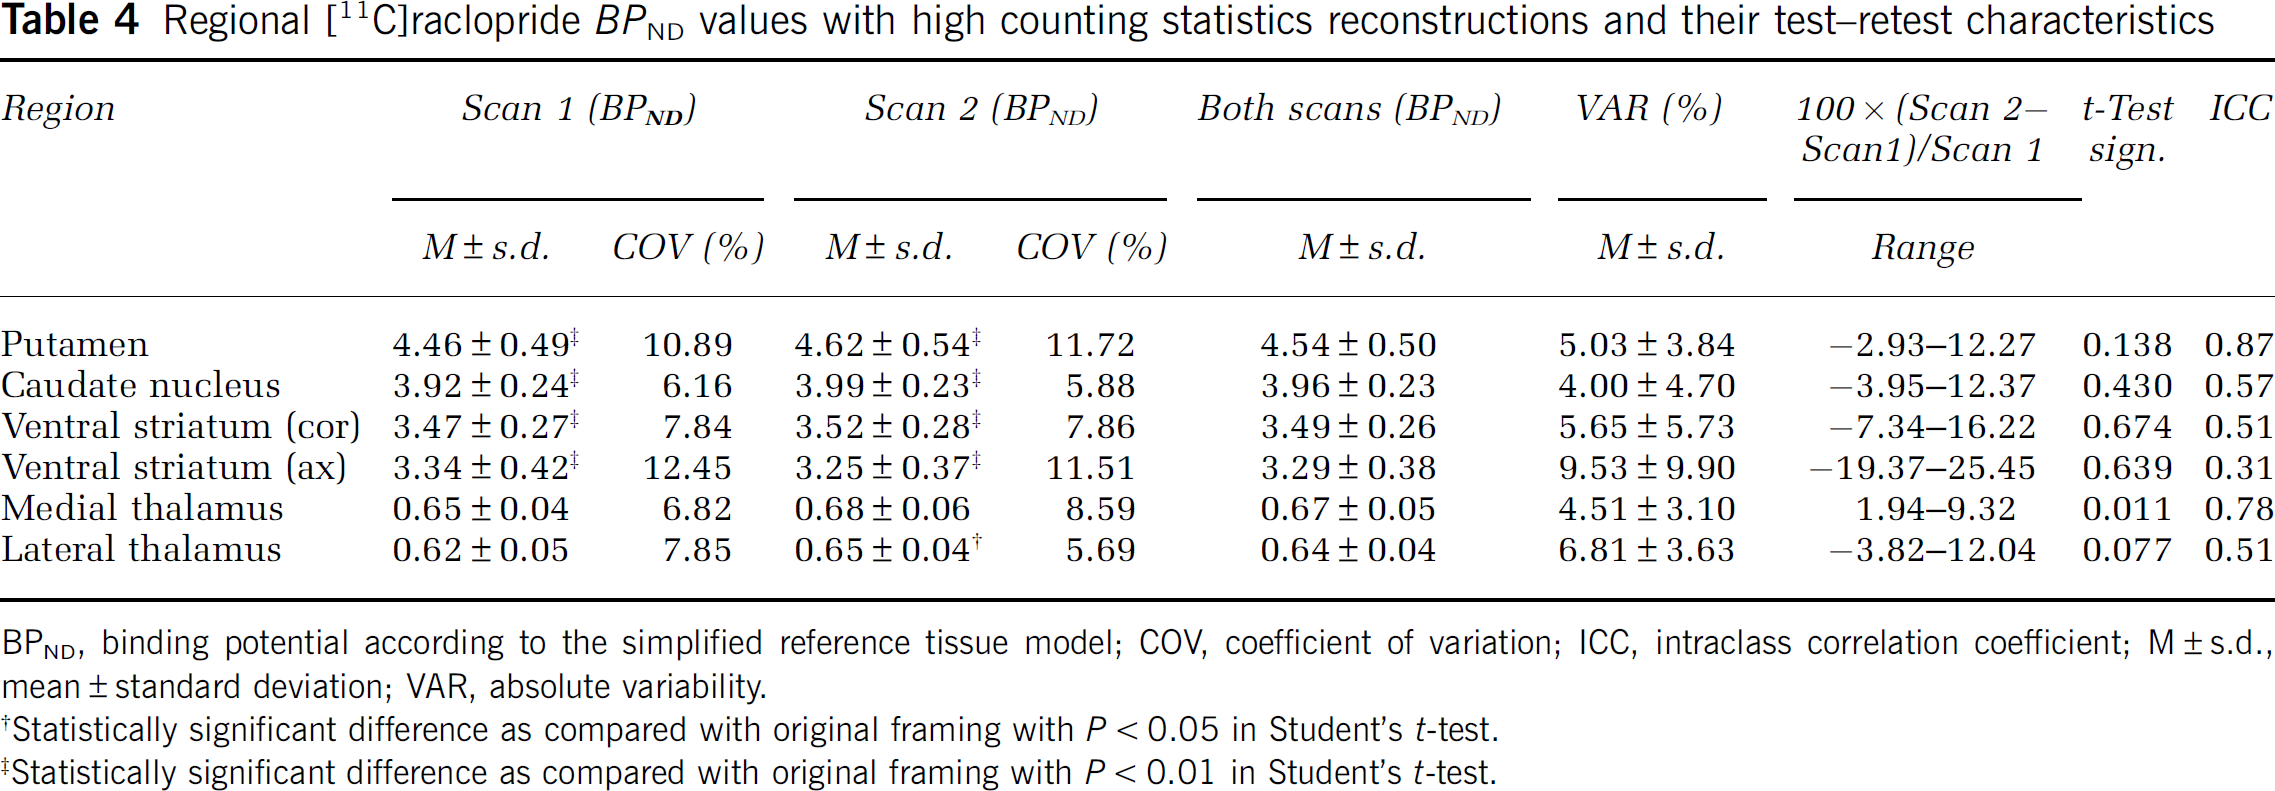
BPND, binding potential according to the simplified reference tissue model; COV, coefficient of variation; ICC, intraclass correlation coefficient; M ± s.d., mean ± standard deviation; VAR, absolute variability.
Statistically significant difference as compared with original framing with
Statistically significant difference as compared with original framing with
Image Reconstruction With Resolution Modeling
In Figure 2, a typical set of time–activity course data obtained with the PSF reconstruction along with the different framings using the non-PSF reconstruction is seen. Regional ΔAUC(%) values for PSF reconstruction are presented in Table 3.
Regional ΔAUC(%) values have positive means in both the scans except for the lateral thalamus (−1.41 ± 2.25 and −0.77 ± 0.86), with largest increases in the caudate nucleus (8.29 ± 1.17 and 8.66 ± 0.86) and the putamen (7.06 ± 1.02 and 7.50 ± 0.92), whereas the smallest changes were seen in the cerebellum (0.78 ± 1.70 and 1.04 ± 0.74).
The BPND estimates, the mean VAR, and the ICC values for combined ROIs with the PSF reconstruction are presented in Table 5. The PSF reconstruction yielded higher BPND estimates in all other regions expect the lateral thalamus when compared with the original framing using the non-PSF reconstruction. Increases were largest in the caudate nucleus and in the putamen. However, the increased BPND estimates were coupled with increased VAR and thereafter decreased ICC in many of the regions. In striatal regions, the largest increase in the VAR was seen in the caudate nucleus and in the putamen, whereas the VAR was somewhat smaller in the VST. The ICC values were decreased in all regions except the lateral thalamus, with largest decrease in the caudate nucleus.
Regional [11C]raclopride
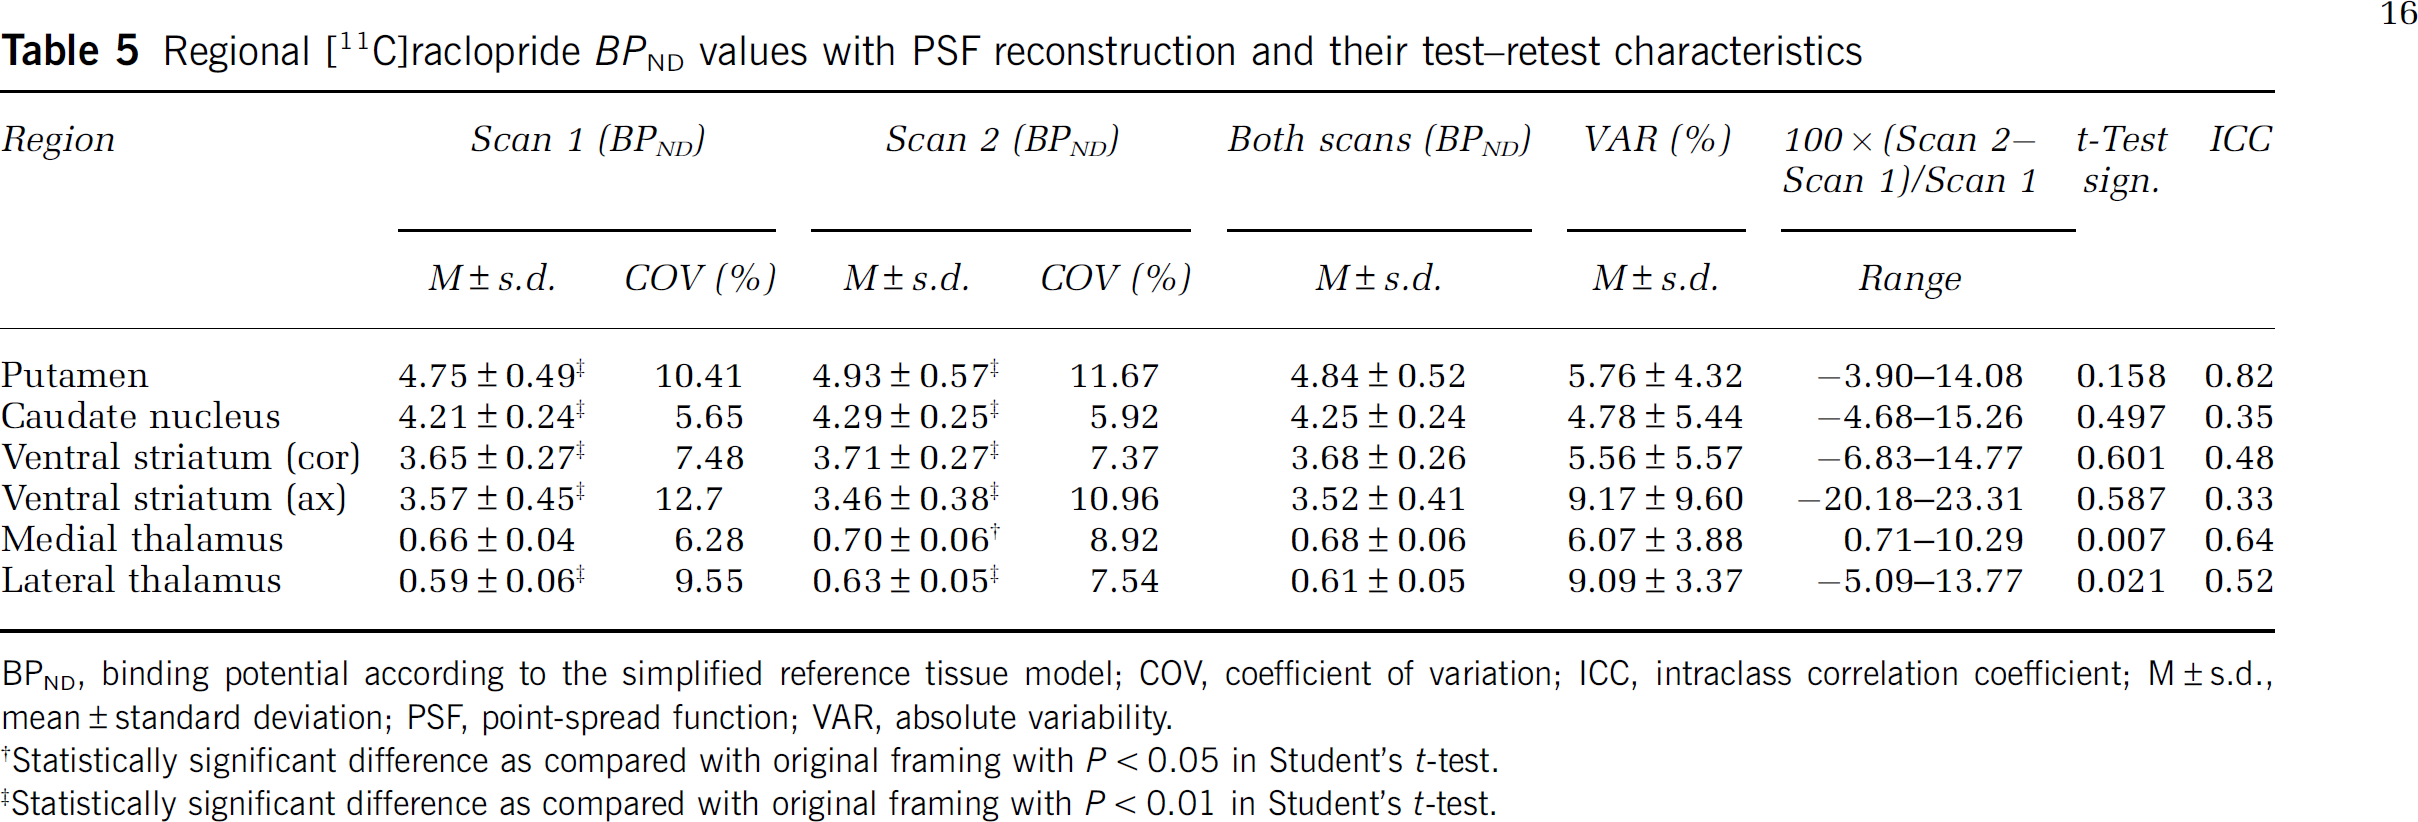
BPND, binding potential according to the simplified reference tissue model; COV, coefficient of variation; ICC, intraclass correlation coefficient; M ± s.d., mean ± standard deviation; PSF, point-spread function; VAR, absolute variability.
Statistically significant difference as compared with original framing with
Statistically significant difference as compared with original framing with
Discussion
In this study, we set out to evaluate the test–retest reliability of the striatal, ventrostriatal, and thalamic D2 binding using [11C]raclopride and the HRRT scanner. The reproducibility of striatal [11C]raclopride binding has been explored earlier in various studies (Volkow et al, 1993; Hietala et al, 1999; Mawlawi et al, 2001; Hirvonen et al, 2003), but not with a high-resolution tomograph. In this study, with the conventional framing and non-PSF reconstruction, the VAR values were 3.7% ± 4.7% in the caudate nucleus, 4.7% ± 3.9% in the putamen, and 5.9% ± 5.3% in the VST (coronal plane). These values are comparable to those reported in an earlier study in which striatal and ventrostriatal D2 receptors were quantified (5.3% ± 5.2% for the caudate nucleus, 3.5% ± 3.9% for the putamen, and 8.6% ± 6.2% for the VST) (Mawlawi et al, 2001). However, the ICC values from our study were slighty lower for every region except for the putamen. This difference may, at least partly, be due to methodological differences such as the bolus plus infusion method used in the previous study (Mawlawi et al, 2001).
A previous study evaluating the reproducibility and validity of the thalamic D2 receptor binding measurements in a test–retest setting found the VAR values to be 8.5% ± 6.1% for the medial part and 8.9% ± 5.3% for the lateral part of the thalamus (Hirvonen et al, 2003). In this study, we obtained slightly superior VAR values, with 4.5% ± 3.1% for the medial and 6.4% ± 4.5% for the lateral part of the thalamus. The earlier results (Hirvonen et al, 2003) for the caudate nucleus (4.0% ± 2.2%) and for the putamen (5.3% ± 3.4%) are well in line with this study. Nonetheless, except for the putamen (0.87), the ICC values were less than those reported earlier for the caudate nucleus (0.96), the putamen (0.84), the medial thalamus (0.84), and the lateral thalamus (0.86) (Hirvonen et al, 2003). The most likely explanation to the lower ICC values in this study is the small between-subject variability in our study group (see Table 2, coefficient of variation (%)) when compared with the earlier study (Hirvonen et al, 2003). Altogether, the VAR values in our study indicate good reproducibility and are well in line with the previous studies.
In this study, we observed an increase in the mean BPND values from the test to the retest scans in all regions except the VST, which might also impair the ICC. However, the increase was statistically significant only in the lateral (
This is the first study measuring the reproducibility of [11C]raclopride binding using the HRRT. There are some previous reports with other radioligands such as [18F]-FDG (fluorodeoxyglucose) showing that the better spatial resolution of the HRRT scanner decreased the PVE when determining metabolic rates in small brain nuclei (Heiss et al, 2004). Dopamine transporter binding was measured using the selective dopamine transporter radioligand [11C]-PE2I, which resulted in a significant increase (30%) in striatal BP values when using the HRRT versus a more conventional scanner (Leroy et al, 2007), and a recent study reported a good test–retest reliability of dopamine transporter binding using [11C]-PE2I with the HRRT (Hirvonen et al, 2008). Accordingly, we also discovered a significant benefit from the better spatial resolution of the HRRT scanner in noticeably higher BPND values compared with previous [11C]raclopride studies with more conventional scanners. For example, we obtained BPND values 20% higher for the caudate nucleus, the putamen, and for the thalamus than the BPND values reported using a lower-resolution scanner (Hirvonen et al, 2003).
The measured [11C]raclopride BPs in this study were high throughout the whole striatum, ranging from 3.22 (VST) to 4.41 (putamen), and moderate in the thalamus (0.65 to 0.67), using the conventional quantification methods. These results are in a good agreement with the previous
Instrumentational and Signal Processing Considerations
The small size of the VST renders the signal highly vulnerable to head movement. Therefore, in our study we used individually shaped thermoplastic mask with each subject to minimize head movement. The external motion detector (Polaris Vicra) used in this study showed very little motion during the scans, despite a trend toward increased movement during the course of the scan. Even when being greatest, the movement was less than the spatial resolution of the scanner, thus no movement correction was applied as this potential confound was not obviously affecting the results.
It has been reported that the HRRT image reconstruction suffers from quantification bias in low count statistics, such as we saw in this study (Johansson et al, 2007). Despite the development of algorithms such as variance reduction on randoms (Byars et al, 2005) and ordinary poisson OSEM reconstruction (Comtat et al, 2004), a recent study still reported a noticeable bias in statistical reconstruction as compared with analytical reconstruction in low count statistics (van Velden et al, 2008). However, analytical image reconstruction is not optimal for the HRRT image reconstruction because of gaps in the sinogram data. In this study, we implemented a novel approach in PET data sampling to overcome the bias issue. Our aim was to collect a fixed number of counts in each frame, which is made possible by the list mode event recording. Noise-equivalent count was applied because it takes into account the varying randoms rates and scatter fractions. We extrapolated an NEC threshold per frame from a previous phantom study in which we studied the quantification bias in low statistics (Johansson et al, 2007). In the conventional framing, the threshold of 7 × 10⁶ NECs was not reached during the first 600 seconds of the scan because of dense framing depicting the bolus peak. After that NECs per frame varied below and above the threshold, depending on the subject mass and injected dose. Absolute difference in the injected doses between the test and retest scans ranged between 3 and 113 MBq, with the mean injected dose of 403 MBq. Scans with lowest dosage may yield lower BPND as compared with their counterpart, which would impair the ICC and VAR values. Our NEC-based framing was aimed at removing this biasing effect if it was present in this study. First, to evaluate the effect of the NEC-based framing the bias was estimated directly from the time-activity course (TAC) data (Table 3). It was concluded that the NEC-based framing yielded higher contrast images as compared with the original framing, with statistically significant difference in the high RC regions. Second, the BPND estimates were recalculated from the NEC-based data and the ICC and VAR values were estimated (Table 4). As expected, the observed changes in the AUC were transferred into BPND so that in the high RC regions the BPND estimates were higher as compared with the conventional framing. However, there was no improvement either in the ICC or in the VAR values, which could be expected because of relatively small within-subject differences in injected doses (Table 1). To study the bias further, we used NEC-based framing with thresholds of 5 × 10⁵ to 2 × 10⁶ NECs per frame. Parts of the data were histogrammed and reconstructed with the low count statistics, and bias was estimated directly from the TAC data (Table 3). Now, a statistically significant decrease in the image contrast was seen in the high and low RC regions when the NEC-based framing was compared with the original framing. The BPND estimates were not calculated for low statistics data because there were only a few samples from the beginning and end of each scan. Our observations add evidence to the claim that the current statistical reconstruction suffers from bias, which has significant magnitude, for instance, in follow-up studies if the injected doses vary substantially between scans. Thus, to cope with the bias the injected doses should be equalized, if not succeeded, the NEC-based framing should be used to maintain similar conditions for the statistical reconstruction. Ultimately, new bias-free reconstruction schemes must be explored to remove the count statistics limitation in the HRRT studies.
Detector design of the HRRT aims at removing the PVE from the PET measurement. Conventionally, the PVE is corrected from the collected data and a variety of algorithms have been proposed. An implementation of a scanner-specific PSF-based method was recently made for the HRRT and delivered to the HRRT users (Comtat et al, 2008). It has been reported that the PSF-based method is able to generate higher BP estimates as compared with the conventional reconstruction (Sureau et al, 2008; Comtat et al, 2008; Mourik et al, 2010; Varrone et al, 2009). Approximately, 25% higher BPND estimates in the caudate nucleus, 23% in the putamen, and 10% in the VST using [11C]-PE2I with listmode reconstruction and PSF modeling has been reported (Sureau et al, 2008). In a study including one human subject imaged with [11C]-raclopride ∼10% higher BPND estimates in the caudate nucleus and 6% higher in the putamen were obtained (Varrone et al, 2009). In a study using [11C]-flumazenil in five subjects no noticeably higher distribution volume estimates with PSF as compared with non-PSF reconstruction were obtained (Mourik et al, 2010). The authors concluded that the improvement obtained through the usage of PSF reconstruction is tracer dependent. In this study, we obtained ∼ 10% increase in the BPND estimates in the caudate nucleus and putamen and 8% increase in the VST, which are in good agreement with an earlier report (Varrone et al, 2009). Moreover, we obtained ∼ 7% lower BPND estimate in the lateral thalamus, and < 2% increase in the medial thalamus, which would suggest that the PSF reconstruction alleviates the spill-in effect as well. In this study, our main objective was to evaluate the methods with regard to measurement reproducibility. Although PSF reconstruction provided BPND estimates that should be less contaminated by the PVE, its VAR values and, consequently, the ICC values were somewhat inferior to the non-PSF reconstruction. In the thalamus and VST, the VAR and ICC values were identical between the PSF and the non-PSF reconstructions.
As the line-of-response (LOR) of the HRRT is significantly thinner as compared with conventional scanners, the counting statistics rather than the spatial resolution becomes a limiting factor in the quantitative HRRT studies. In this report, we conclude that the statistical reconstruction of the HRRT is vulnerable to bias in low count statistics, but also, that the PSF reconstruction rather increases than decreases the VAR values. However, the PSF reconstruction was recently evaluated with regard to count statistics (Walker et al, 2009) and it was found to be less vulnerable to low count statistics bias. In this study, we did not evaluate the PSF reconstruction with regard to count statistics, but we observed that both the increment of count statistics and the inclusion of the resolution model in the reconstruction increase the contrast of the images. In addition, the preceding evaluation using list mode reconstruction and the resolution model (Planeta-Wilson et al, 2008) supports the usage of PSF reconstruction in the low statistics HRRT studies.
Conclusions
This study showed that the use of single bolus [11C]raclopride and the high-resolution research scanner HRRT results in good reproducibility of quantification of D2 receptor binding. The use of the HRRT scanner increased the signal from the striatum and the thalamus and resulted in higher BPND values compared with previous studies using scanners with lower resolution. The good test–retest reproducibility of the quantification of the VST is encouraging and shows the feasibility of the use of the HRRT in studying the dopaminergic system in small brain regions. Our results show that [11C]raclopride BP has good reproducibility even when using a high-resolution scanner that allows analysis of small brain structures.
Footnotes
Acknowledgements
The authors thank the personnel of Turku PET Centre for skillful assistance during the scanning.
The authors declare no conflict of interest.