
Abstract
[18F]MK-6240 is a selective, high-affinity PET radiotracer for imaging neurofibrillary tangles (NFT) in Alzheimer’s disease (AD). Herein, we report test–retest (T–RT) reproducibility of [18F]MK-6240 in AD and healthy volunteers (HV). Twelve subjects with AD and three cognitively normal HV were enrolled in the study and dynamically scanned for 150 min with [18F]MK-6240 under a T–RT protocol. Two radioactivity doses were investigated: 165 ± 3 MBq (n = 6) and 300 ± 40 MBq (n = 9). Serial arterial blood samples were taken for each scan to obtain metabolite-corrected input functions. Following intravenous administration of [18F]MK-6240, the tracer rapidly partitioned into the brain and its heterogenous distribution pattern was consistent with known NFT pathology in AD. In contrast, uptake in HV was low and uniform across the brain parenchyma. Across all subjects, average T–RT variabilities in NFT-rich regions were ∼21%, ∼14% and ∼6% for various quantitative metrics: total distribution volume (VT), binding potential (BPND), and standardized uptake ratio (SUVR90–120), respectively. No significant differences in SUVR T–RT variability were observed between the high and low injected radioactivity groups (5.6% and 6.1%, respectively). This work suggests [18F]MK-6240 has adequate SUVR T–RT characteristics supporting the use of this outcome in future studies.
Introduction
[18F]MK-62401–5 is a selective, high affinity PET radiotracer for neurofibrillary tangles (NFTs) in Alzheimer’s disease (AD) that is currently being investigated as a tool to quantify aggregates of hyperphosphorylated tau in the brain. In vitro characterization of [18F]MK-6240 has shown a favorable pharmacological profile including sub-nano molar affinity in tau-rich human tissue samples (Kd = 0.4 nM), no evidence of a displaceable off-target binding component and co-localization with phosphorylated tau measured by immunohistochemistry. 3 In addition, no displaceable binding was observed by [18F]MK-6240 self-block studies in vivo in rhesus monkey brain. 2 In a first-in-human pilot study, [18F]MK-6240 demonstrated favorable kinetics and uptake patterns in the brain of subjects with AD that were consistent with the known pathological distribution of tau aggregates. 4
Herein we present the results of a test–retest study with [18F]MK-6240 in cognitively normal healthy controls and subjects with Alzheimer’s disease, inclusive of arterial blood sampling for full kinetic quantification. The test–retest characteristics and the relationship among different quantitative and semi-quantitative PET outcomes are discussed.
Materials and methods
Population
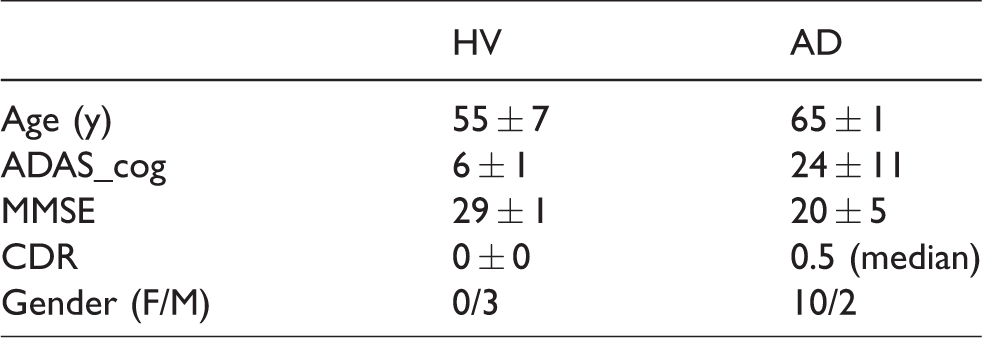
A total of 12 subjects with AD and three cognitively normal healthy volunteers (HVs) participated in the study. The study was approved by New England Independent Review Board, A WIRB-Copernicus Group Company and performed under local regulations and with the ethical principles laid down in the Declaration of Helsinki (via protocol section 11.1 Regulatory and Ethical Compliance). All subjects or their legal representative in the case of subject with AD provided written informed consent before enrollment. As a part of the screening procedures, a brain MRI was obtained, and [18F]florbetapir PET imaging was completed to determine eligibility for the study based upon a qualitative visual read to confirm the presence of amyloid deposition in AD subjects and the absence in HV. Participants underwent a battery cognitive test (ADAS_cog, MMSE and CDR) to assess the degree of clinical severity in the AD population. All subjects completed the Ohio State University traumatic brain injury questionnaire (OSU-TBI) and all scored in the range of improbable TBI. After completion of the initial [18F]MK-6240 PET imaging session (test), the subjects were scanned again (retest) between three days and three weeks following the first scan. Table 1 shows a summary of basic demographics and cognitive scores.
Population characteristics (
Radiochemistry
[18F]MK‐6240 was manufactured by nucleophilic fluorination of the 5-diBoc-6-nitro precursor using conventional heating followed by acid deprotection and semi-preparative high-performance liquid chromatography (HPLC) purification as previously described.4,6 The manufacturing process afforded a formulated intravenous preparation with >99% purity ready for dispensing and injection. Analysis of the radiochemical yield, molar activity and final product testing using a validated procedure in accordance to good manufacturing procedure were performed before release.
Blood and metabolite analysis
At each scan session, manual arterial sampling for whole blood, total plasma counts (at 1,1.5,2,3,4,5,6, 10,15,20,25,30,40,60,75,90,120 and 150 min) and metabolite analysis (at 5, 10, 20, 30, 40, 60, 75, and 90 min) was conducted to derive an arterial input function that was used to estimate the total volume of distribution (VT). Plasma samples for metabolite analysis were prepared and analyzed for fraction of unchanged parent by radio-HPLC. The final plasma input function was calculated as the product of the total plasma curve and the parent fraction curve after appropriate interpolation of the data (see details below).
For the determination of [18F]MK-6240 plasma-free fraction, 200 µL aliquots of plasma from blood spiked with the radiotracer (∼2 µCi for 7 mL of blood) were pipetted in duplicates into ultrafiltration units (Amicon Centrifree 30 kDa, Millipore) and centrifuged at 20°C for 20 min at 3000g. The radioactivity in the ultrafiltrate (50 µL aliquot) and the filtration units were counted. The plasma-free fraction fp was calculated as the ratio of the ultrafiltrate activity to that in the whole ultrafiltration unit (ultrafiltrate plus collection vial) and expressed as the average of the two measurements.
Imaging and analysis
In each [18F]MK-6240 visit, subjects received a single intravenous bolus injection of the radiotracer over 3 min with a volume not exceeding 10 mL. Six subjects received a low radioactivity injection of 165 ± 3 MBq at test and retest, while the remainder received a higher radioactivity injection of 300 ± 40 MBq at test and retest. Total injected mass for the low radioactivity injection group was 0.3 ± 0.1 μg and 0.5 ± 0.4 μg for test and retest, respectively, while for the high radioactivity injection group was 0.8 ± 0.3 μg and 0.9 ± 0.6 μg for test and retest, respectively. Immediately following the injection and while the subjects rested supine in the scanner table, dynamic PET brain imaging was conducted on a Siemens ECAT EXACT HR+ for a period of up to 150 min. Between 40 and 60 min, all subjects were allowed to get out of the scanner for a break. At the end of the break, subjects were repositioned in the scanner to resume dynamic PET scanning. Two CT scans were acquired (one for each PET segment) for the attenuation correction purposes. [18F]MK-6240 and the study procedures were generally well tolerated by all subjects.
Reconstructed PET data volumes were motion corrected, realigned onto the subject MRI and subsequently normalized into the standard MNI (Montreal Neurological Institute) space where volumes of interest (VOI) were defined from a template (Hammers, N30R83). No partial volume corrections were applied to the PET data. Subject MR was segmented into grey matter, white matter and CSF probability maps. Average activity concentration (kBq/ml) within each VOI (constrained to grey matter voxels only) was determined and time activity curves (TACs) were generated. TACs were expressed in SUV units (g/ml) by normalizing to the weight of the subject and the injected dose. Arterial blood samples were collected to measure whole blood and total plasma radioactivity and to derive [18F]MK6240 parent fraction at various time points between 5 and 90 min using an HPLC technique. A fixed blood volume of 5%7,8 was used to account for vascular contribution (whole blood) into the TACs for full kinetic modeling purposes. A combination of visual assessment, sum of squared errors and model complexity (in the form of the Akaike information criteria AIC), magnitude and range of individual rate constants was used to determine the goodness of fit of pharmacokinetic models. All the image analysis and modeling were performed using MIAKAT™ (www.miakat.org).
Three quantitative approaches were used to analyze the data and generate PET outcomes of tracer uptake; (1) compartmental modeling using an arterial input function (2) Simplified reference tissue model (SRTM9,10) and (3) target to reference ratios (SUVR). Target VOIs were divided into NFT-rich and NFT-poor reflecting the expected distribution of tau in subjects with AD. 4 Similarly to Betthauser et al., 3 the cerebellar grey matter region, excluding the dorsal cerebellum to avoid spillover from occipital cortex, was used as reference region. Additionally, a 5-mm radius spherical erosion kernel was applied to the target and reference regions to minimize spillover from adjacent extra-cerebral uptake. Figure 1, bottom right image, shows the definition of the reference region (before grey matter masking). Test–retest (T–RT) variability of the different outcome measures (VT, BPND and SUVR) was assessed as: %T–RT= 100 × 2×abs(Test–Retest)/(Test+Retest).
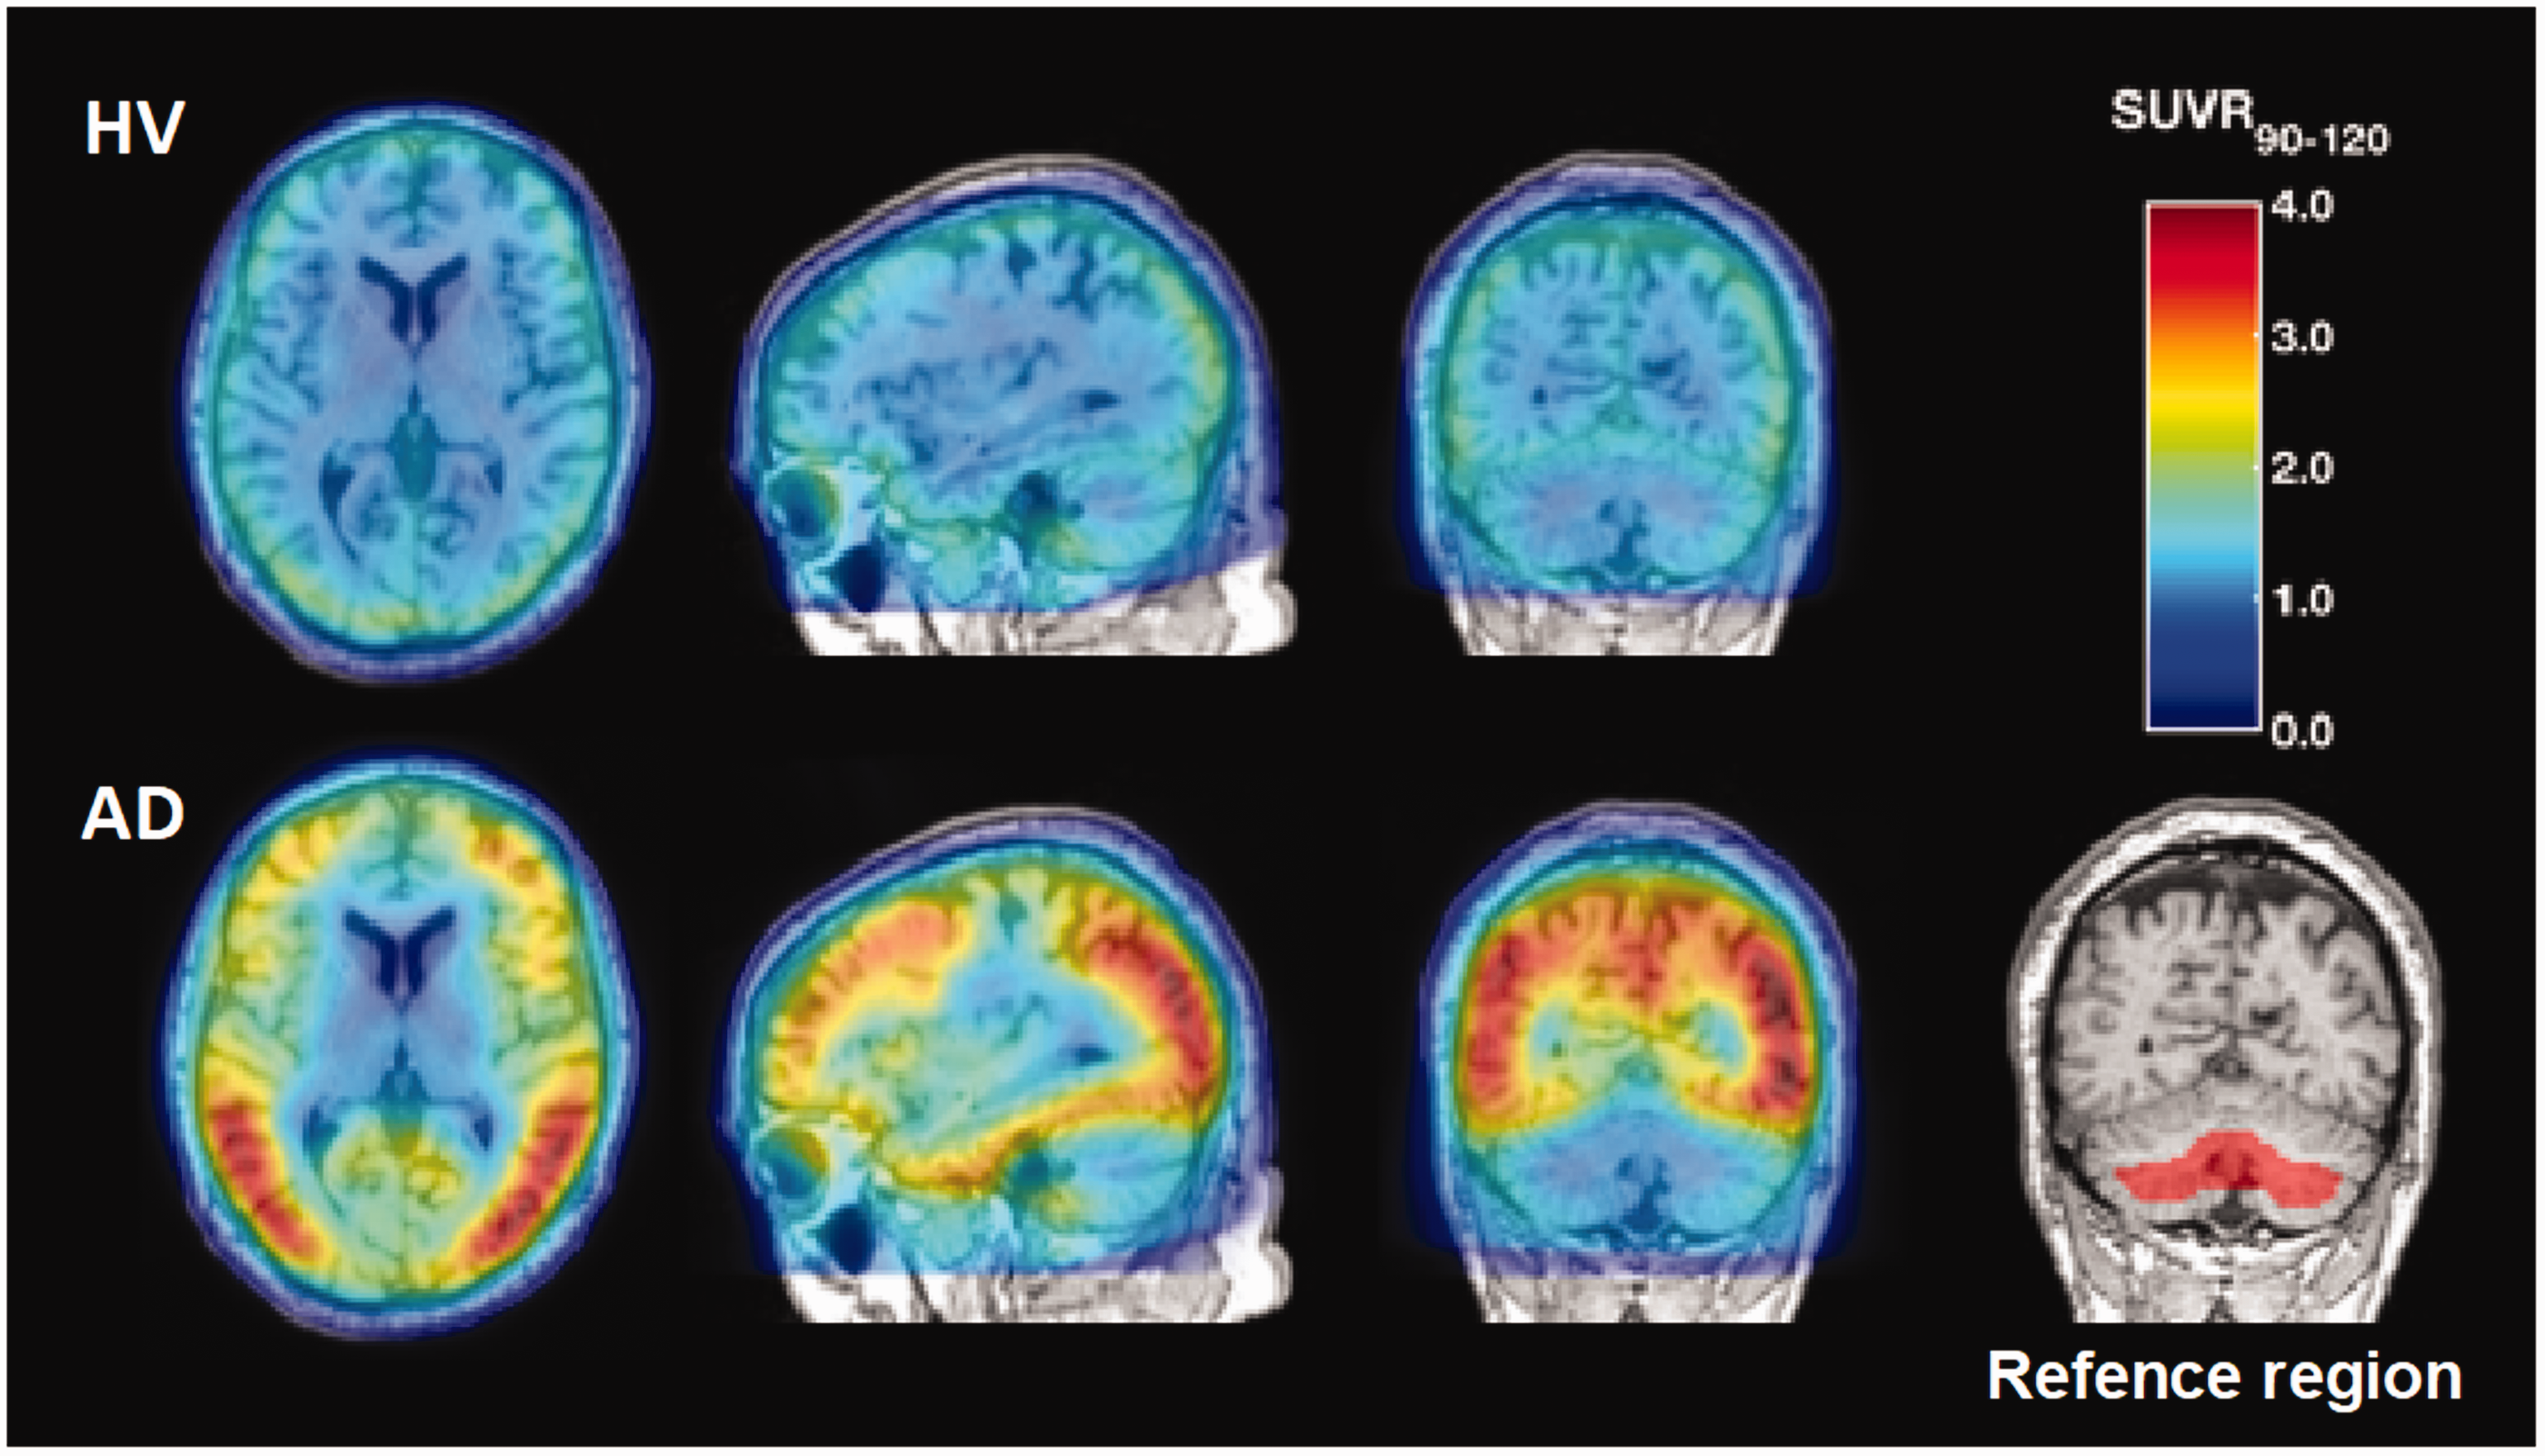
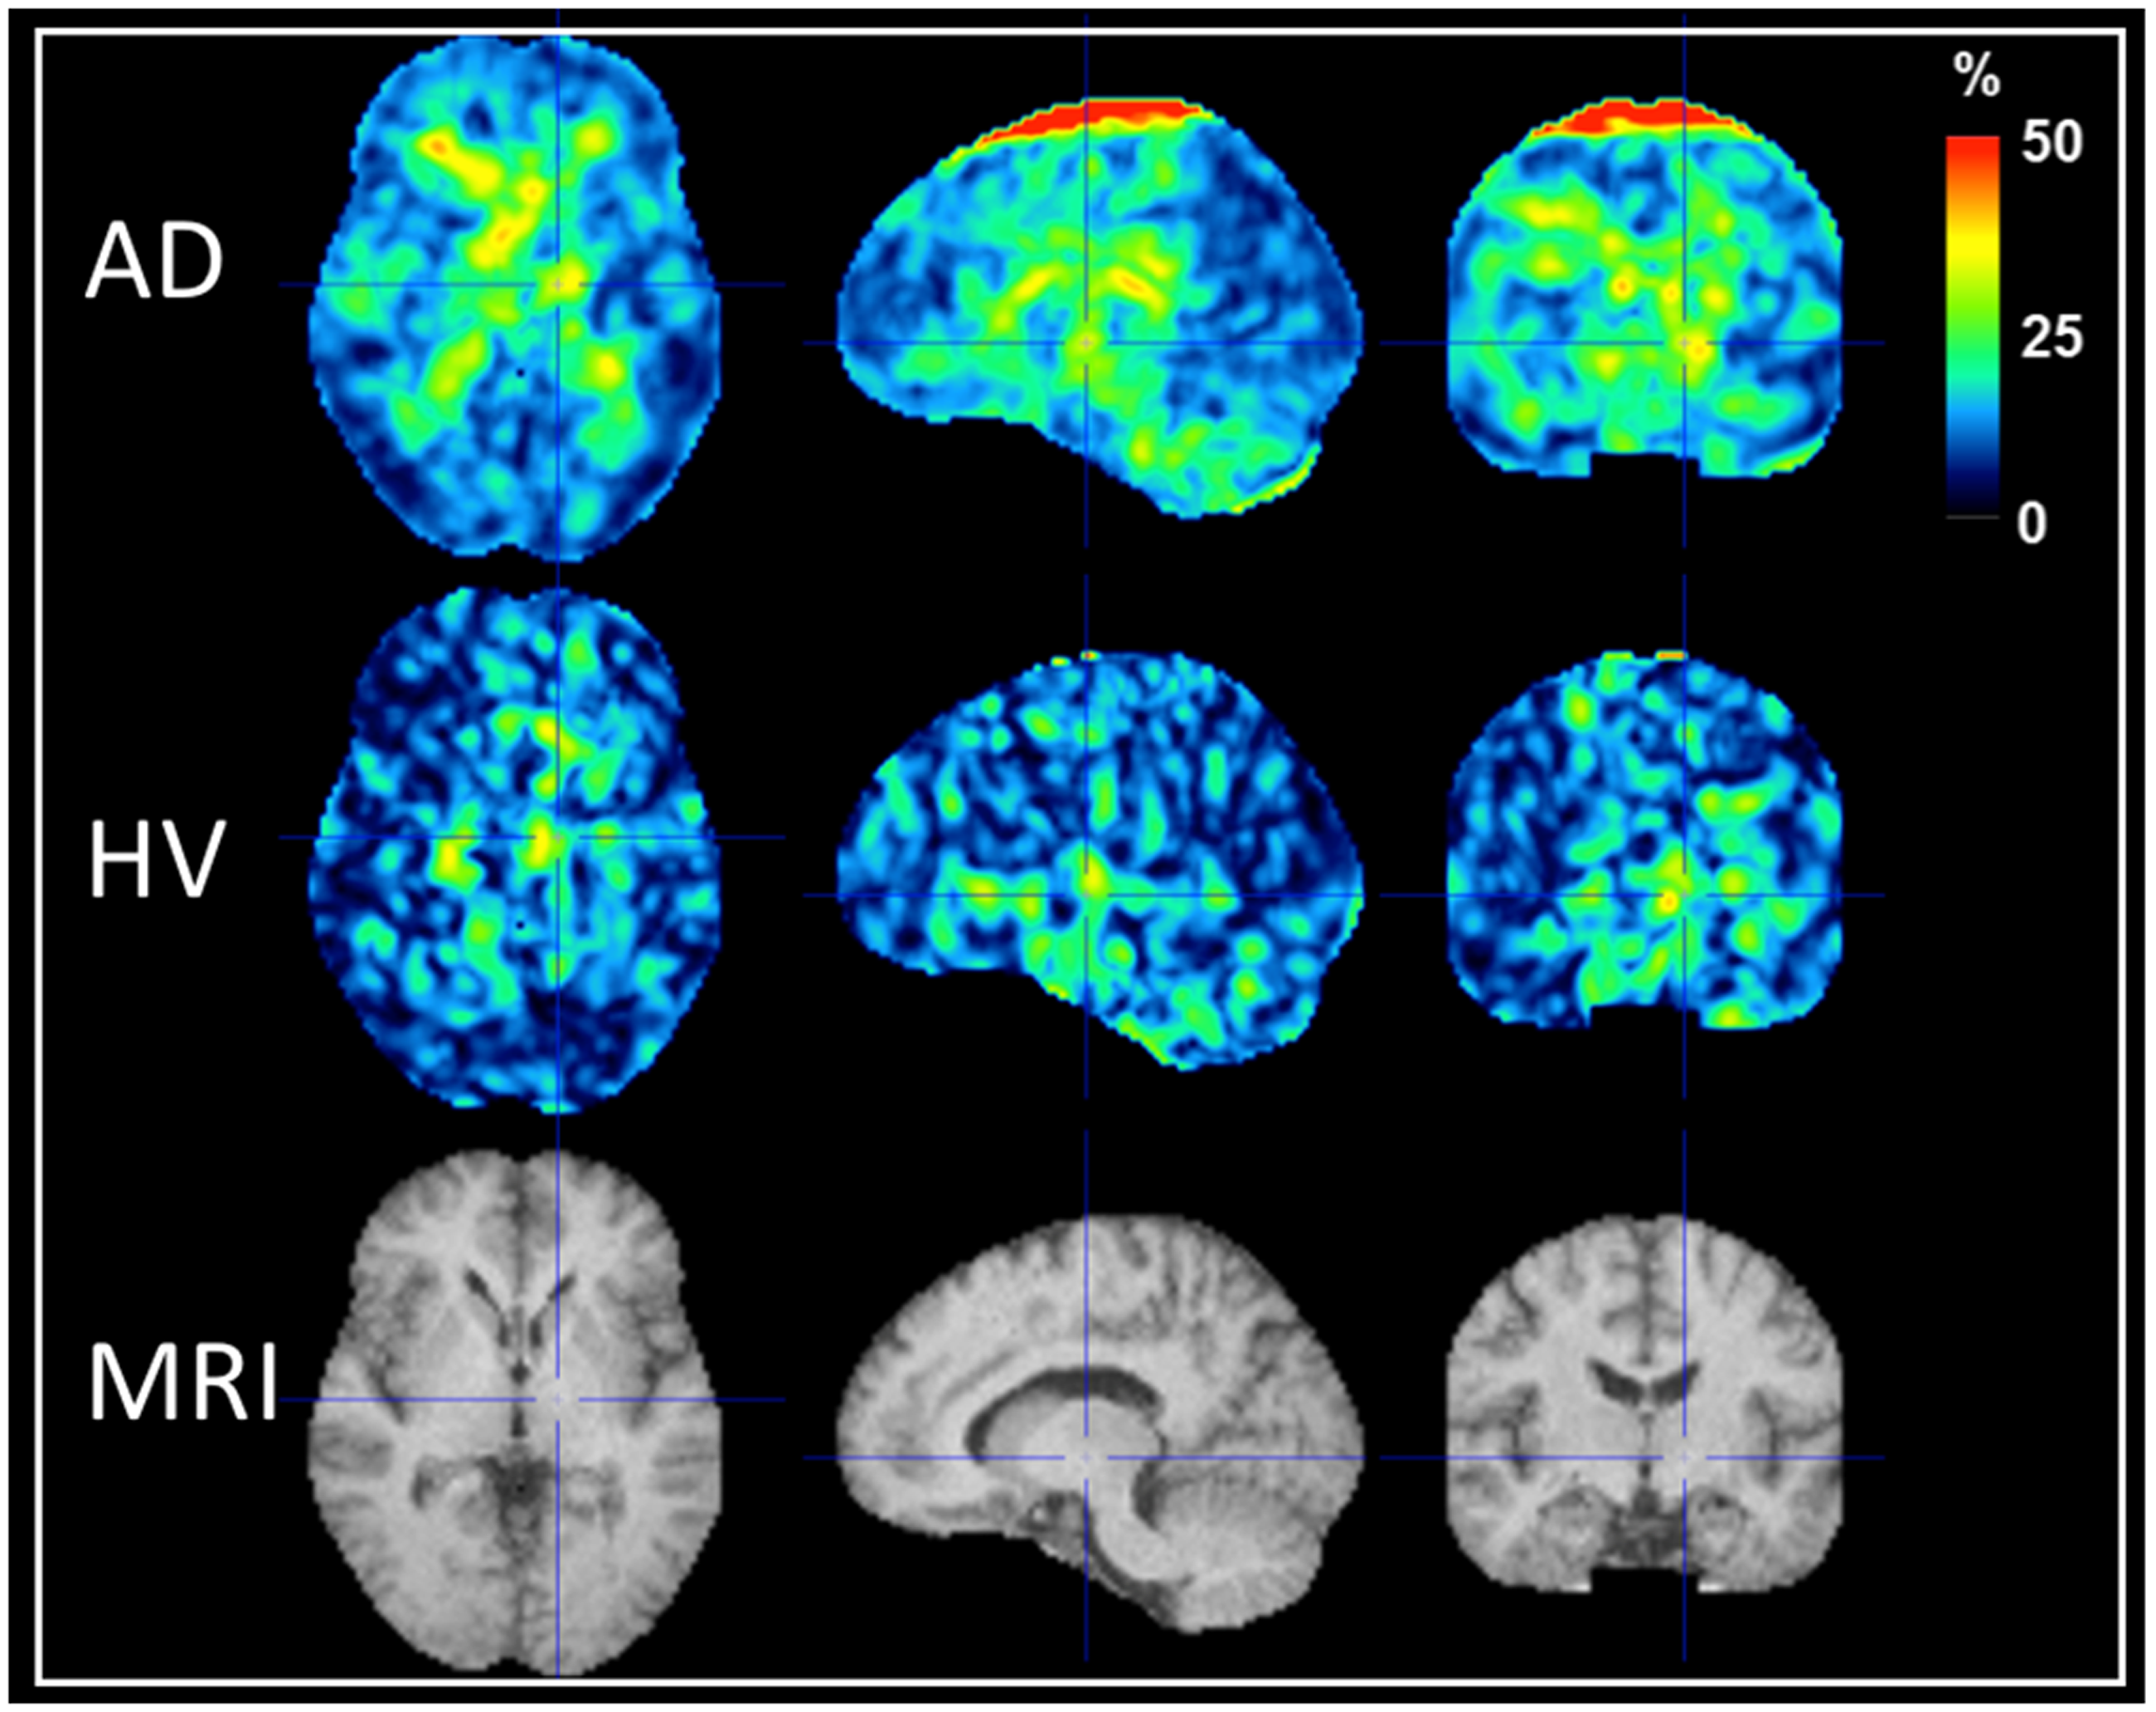
Average uptake pattern between 90 and 120 min for HV and subjects with AD normalized to the uptake in the reference region during the same time period. Bottom right image represents the definition of the cerebellar reference region (before grey matter masking in red). Notice the exclusion of the dorsal part of the cerebellum and the erosion applied in the ventral cerebellum to minimize extra cerebral tracer uptake.
Results
Brain distribution
Following intravenous administration, [18F]MK-6240 rapidly partitioned into the brain and its heterogenous distribution pattern in cortical regions and generally symmetry in AD subjects was consistent with the generally known localization of the NFT pathology. In contrast, radioactivity retention in HV was low and uniform across the brain parenchyma. Figure 1 shows the average uptake pattern between 90 and 120 min for HV and subjects with AD normalized to the uptake in the reference region during the same time period. Topological distribution of the tracer is consistent with observations made previously with [18F]MK-62403,5 and with other tau-tracers. 11 Similarly to what was described by Betthauser et al., 3 low tracer uptake was observed surrounding the brain and major crevices (e.g. cerebellar tentorium) which was most noticeable in HV. Off-target binding was evident only in the substantia nigra of one HV subject.
Brain and blood kinetics
In brain regions with high tracer uptake in AD subjects, MK-6240 showed TACs consistent with a rapid diffusion from blood to tissue compartments followed by a phase of slow washout. SUV peak values would typically range from 2.0 to 5.0. Figure 2(a) shows the uptake in a subject with AD in three NFT-rich brain regions with high (occipital cortex), medium (temporal gyrus) and low (insular cortex) uptake and the uptake in the NFT-poor grey matter cerebellum (reference region).
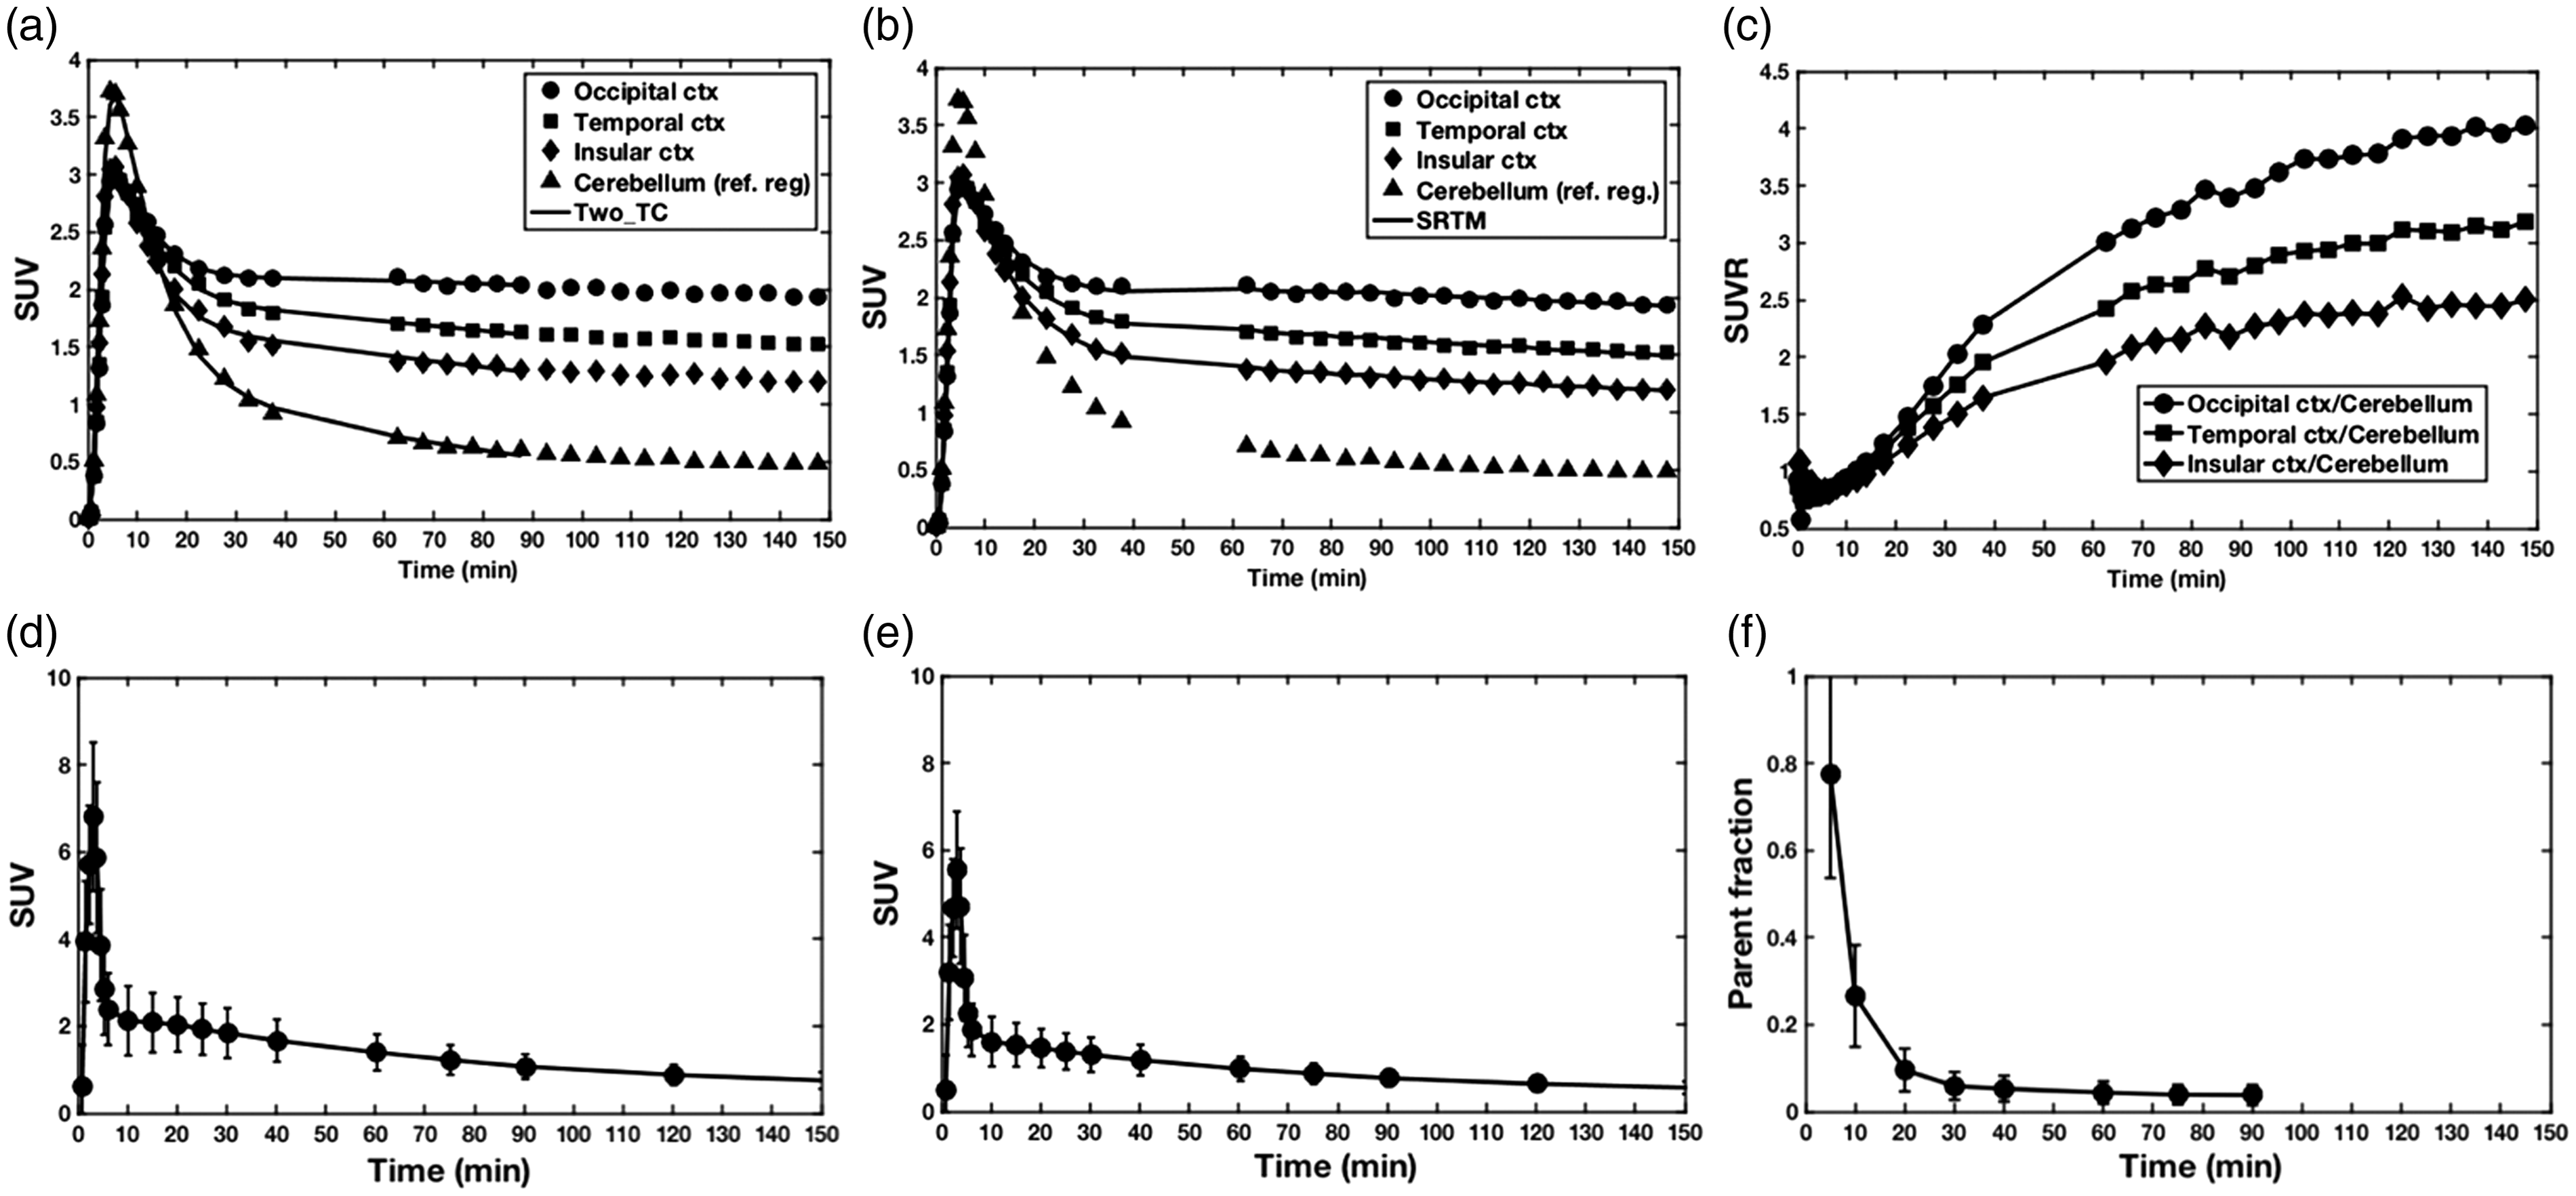
(a and b) Tracer uptake in a subject with AD (female, 70 years old, MMSE 18) in three NFT-rich brain regions with high (occipital cortex), medium (temporal gyrus) and low (insular cortex) uptake and the uptake in the NFT-poor grey matter cerebellum (reference region). Solid lines in (a) and (b) correspond to the 2TC (0–90 min) and SRTM (0–150 min) model fits, respectively. (c) Example of SUVR curves in same subject with AD for three NFT-rich brain regions. Time course of whole blood (d), total plasma (e), and [18F]MK-6240 parent fraction (f). Data in (d), (e) and (f) represent mean ± SD from 15 subjects. (a), (b), (d) and (e) are in SUV units normalized to body mass and injected dose.
Total radioactivity in whole arterial blood and plasma quickly reached peak and cleared rapidly after the end of the bolus administration (Figure 2(d) and (e)). HPLC radio-metabolite analysis of plasma samples only revealed the presence of less (than parent) lipophilic radiolabeled species and a parent fraction of [18F]MK-6240 that rapidly decreased with time (Figure 2(f)). On average [18F]MK-6240 contributed to ∼10% of the total radioactivity concentration in plasma at 30 min post injection and remained at low levels by 90 min. Because VT is highly dependent on parent fraction measurements, we investigated their reproducibility between test and retest. Parent fraction measurements were very consistent between test and retest with a maximum T–RT variability of only 7% around the 10-min parent fraction mean value. Plasma-free fractions (fp) were small and not significantly different between AD (0.4% ± 0.2%) and HV (0.4% ± 0.1%) subjects.
Modeling and quantification
Compartmental modeling
Due to the rapid peripheral metabolism, parent fraction data were only measured up to 90 min post-injection. A sigmoidal model was used to fit the individual parent fraction curves. Compartmental model fitting was performed between 0 and 90-min post-injection. Consistent with Lohith et al., 4 the brain kinetics of [18F]MK-6240 were better described by a reversible two-tissue compartment model based on a visual and AIC approach. Figure 2(a) shows the compartment model fits in a subject with AD for three NFT-rich brain regions.
In HV, K1 values were relatively uniform in all brain regions 0.4 ± 0.09 (mL·cm−3·min−1). Similarly, total VT (mL·cm−3) values across grey matter brain regions were uniform with a mean value of 5 ± 0.7. In AD subjects, a lower average estimate of K1 was found 0.3 ± 0.07 and a larger degree of heterogeneity of VT values was observed (17 ± 8 in NFT-rich and 5 ± 0.6 in NFT-poor regions) reflecting the larger heterogeneity and expected higher regional uptake of [18F]MK-6240 in this population (Figure 3(a)). The average reference region VT in HV was similar to that found in subjects with AD; 6 ± 0.6 and 6 ± 2, respectively. Time stability analysis showed that in general stability of VT with medium to low uptake (VT ∼ <20) was in general attained after 70 min (data not shown). Regions with high uptake (VT ∼ >20) did not attained stability at 90 min.
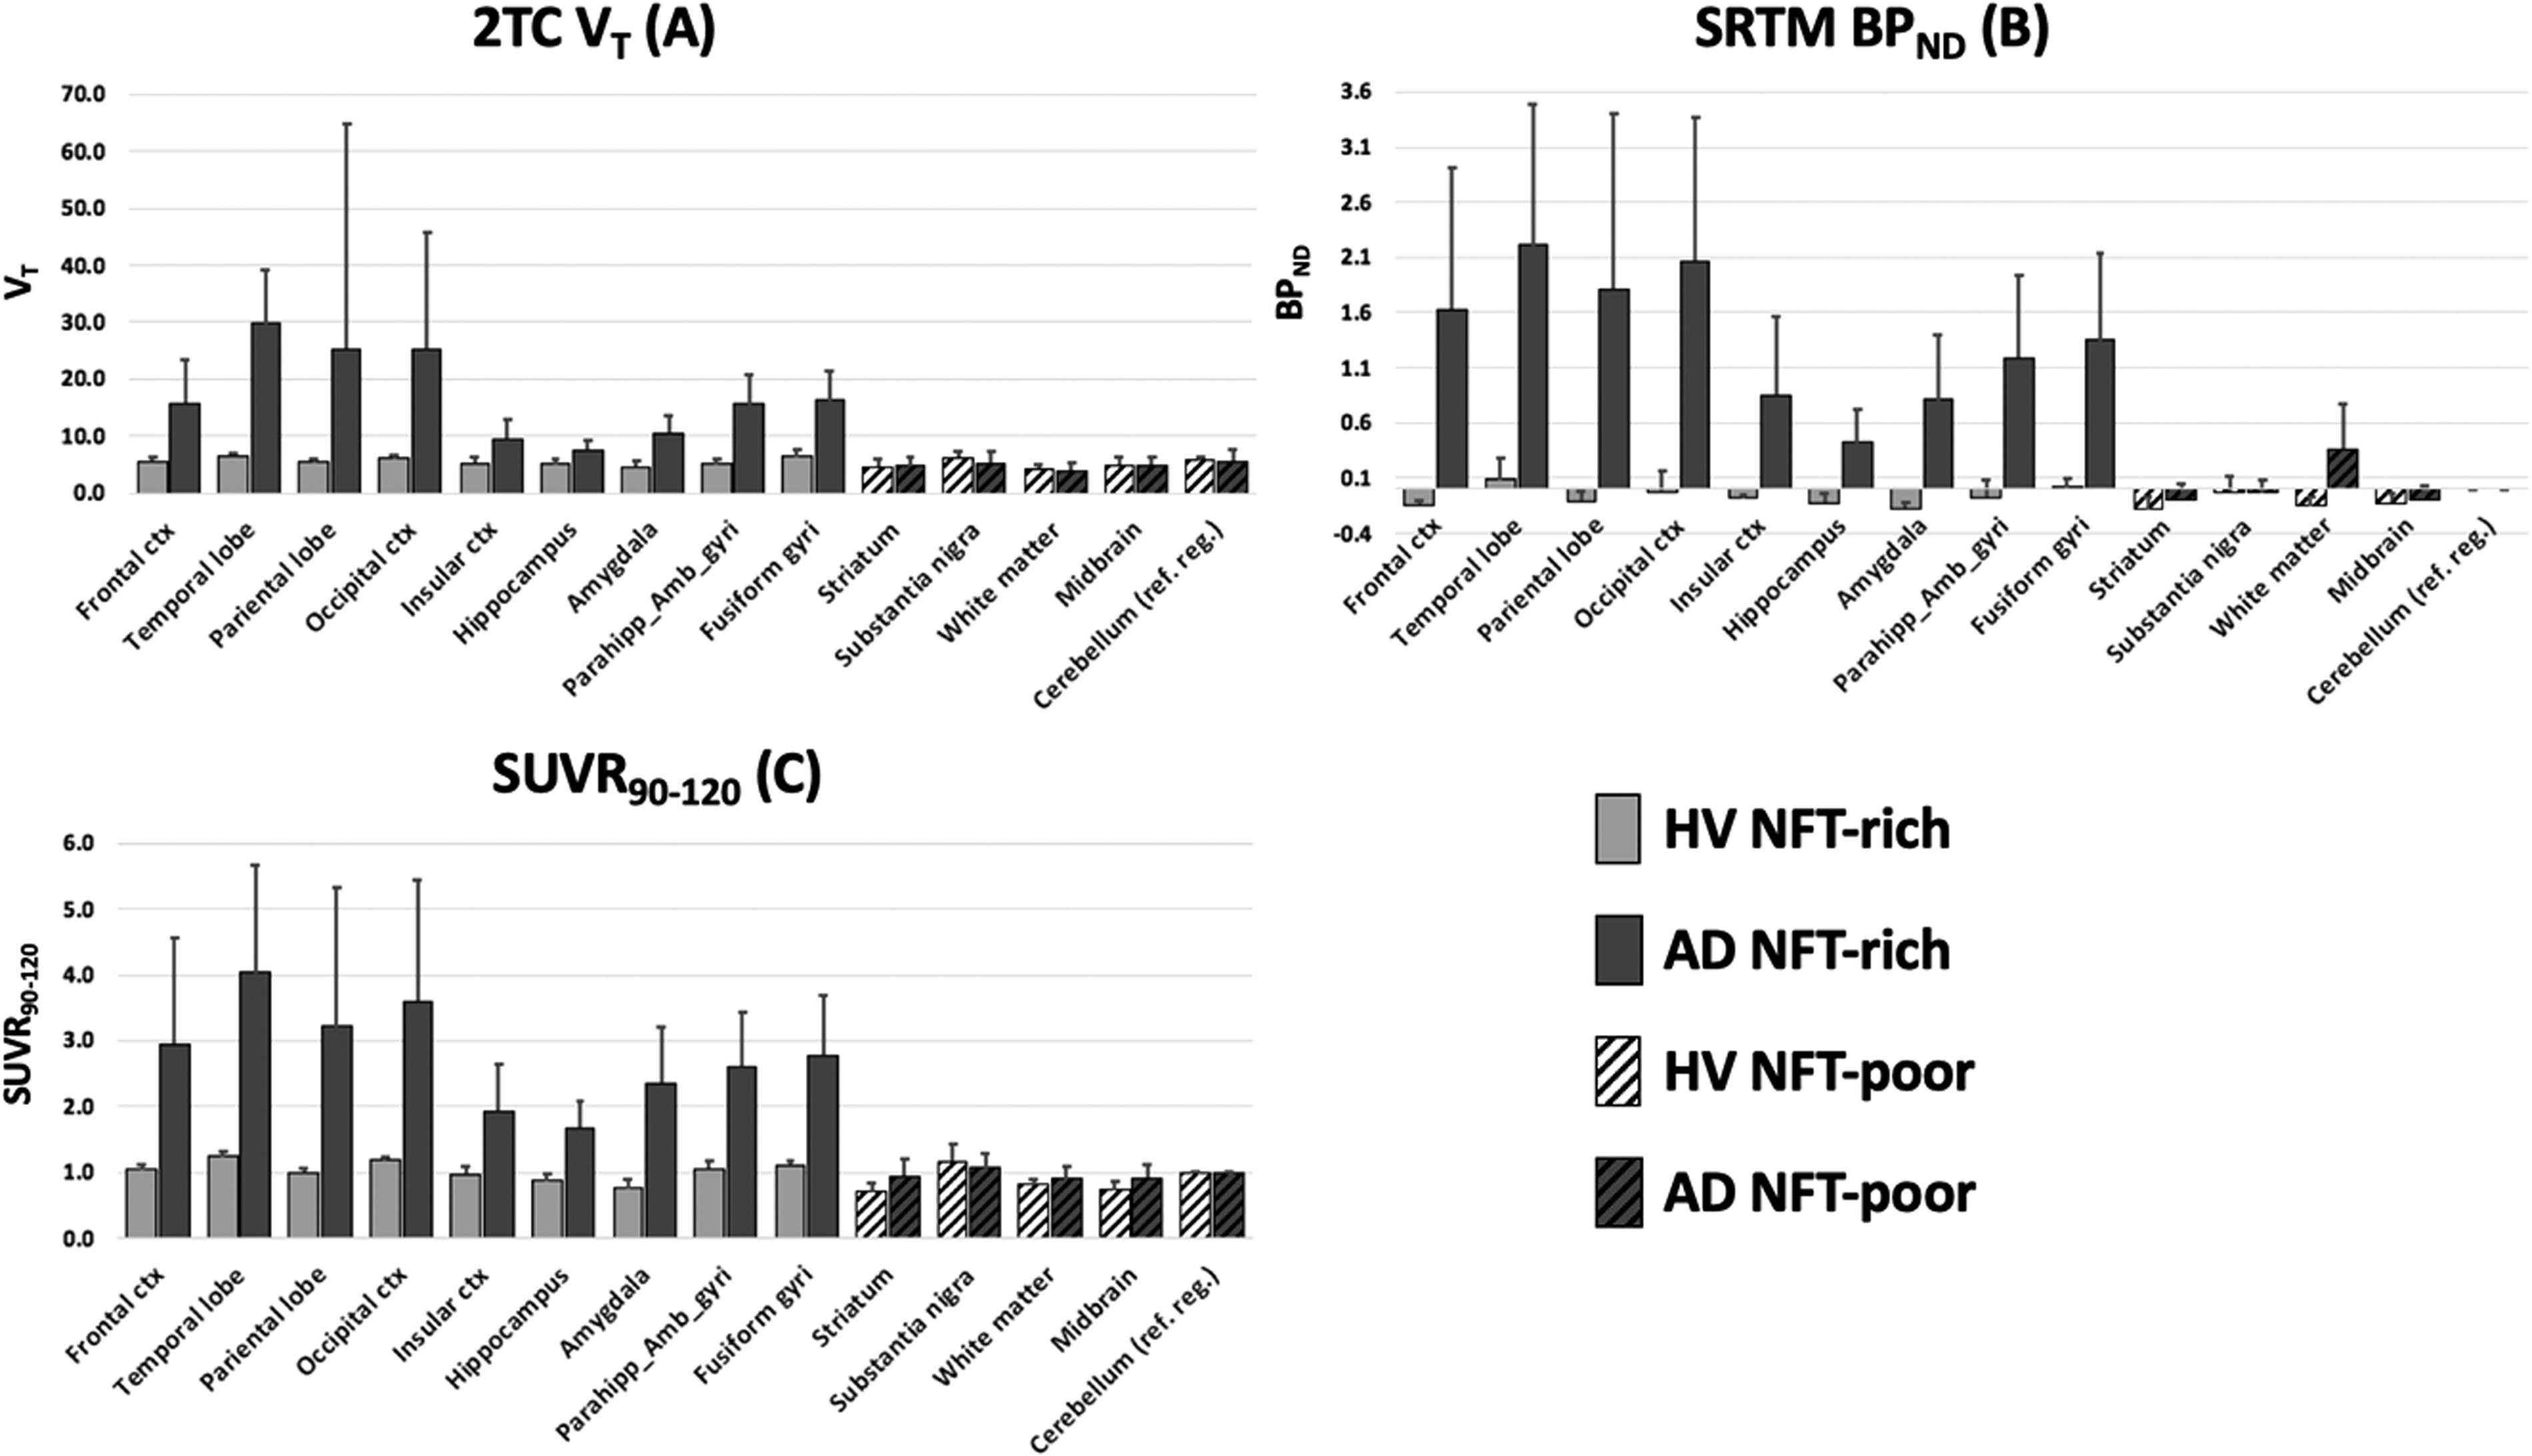
Average (
Simplified reference tissue model
In AD NFT-rich regions, the SRTM model produced good model fits and reliable BPND estimates (Figure 2(b)). In AD NFT-poor and in HV regions, despite good model fits, BPND estimates were unreliable with high coefficients of variation. BPND estimates in HV and AD NFT-poor regions were in average very small (−0.05 ± 0.1) whilst in AD NFT-rich regions, BPND estimates were substantially higher (1.4 ± 0.61) (Figure 3(b)).
Standardized uptake ratio
Figure 2(c) shows an example of SUVR curves in a subject with AD for three NFT-rich brain regions. In subjects with AD, SUVR curves in NFT-rich regions were in general higher than those in NFT-poor regions after 90 min where global SUVR stabilization was attained. Stabilization of the SUVR in very high binding regions was achieved at later time points or in some cases not achieved within the 150-min scan duration. Figure 3(c) shows a summary of SUVR values between the 90 and 120-min time window. The average SUVR90-120 in HV and NFT-poor AD brain regions was 1.0 ± 0.08, while in AD NFT-rich regions was 2.8 ± 0.76.
PET outcome relationships
The three PET outcomes examined showed good correspondence describing a similar uptake pattern across multiple brain regions (Figure 3(a) to (c)). A strong linear relationship was observed for STRM BPND and SUVR90–120-1 (Figure 4(a)) while the relationship between the STRM BPND and SUVR90–120-1 against 2TC DVR-1 although monotonic was skewed towards high binding regions with 2TC DVR-1 overestimating the other two (Figure 4(b) and (c)).
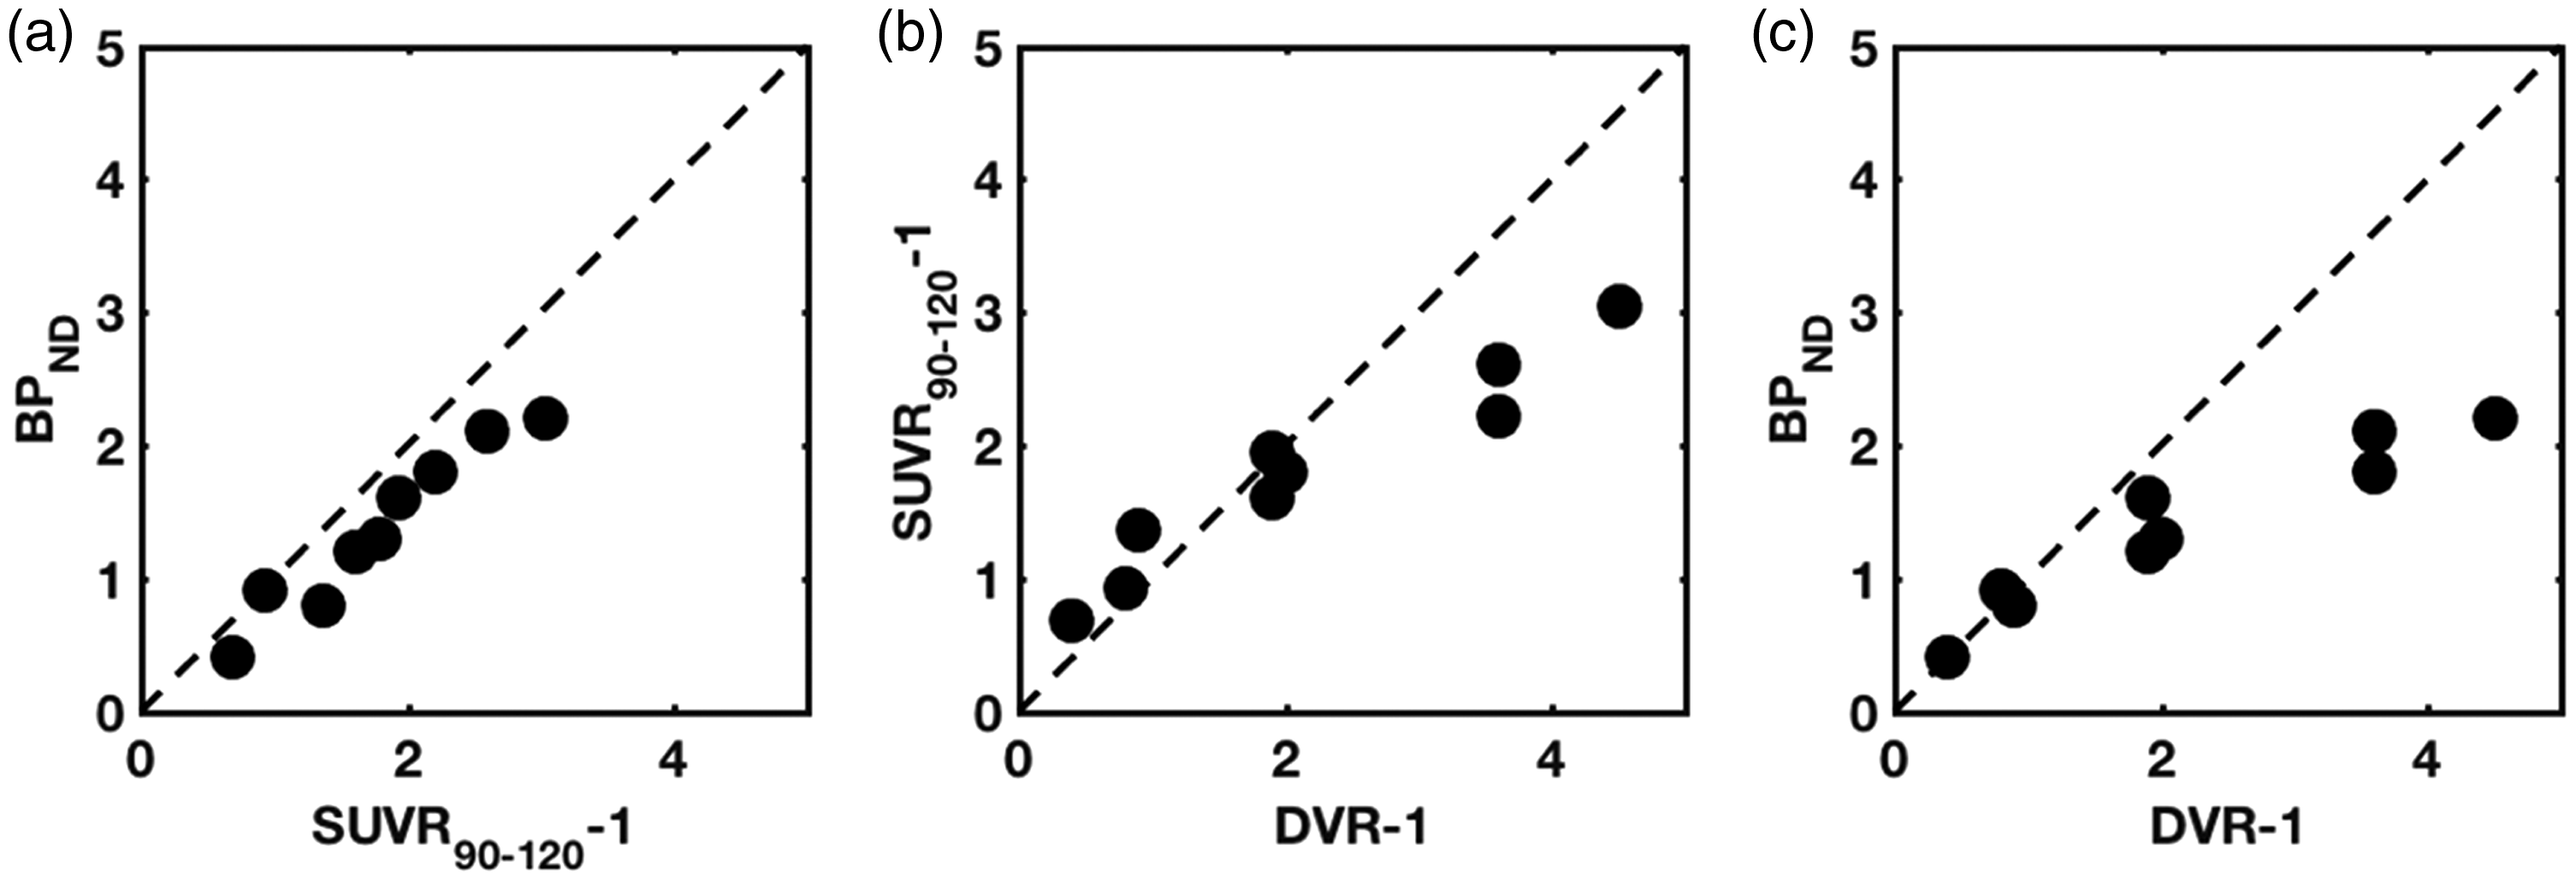
Relationship among between PET outcomes. (a) BPND vs. SUVR90–120-1 (b) SUVR90–120-1 vs. DVR-1 (c) BPND vs. DVR-1.
Test–retest variability
Table 2 shows a summary of T–RT variability for the three PET outcomes (2TC VT, STRM BPND and SUVR90-120) in NFT-rich and NFT-poor brain regions. Across subjects, average T–RT variabilities in NFT-rich regions were ∼21%, ∼14% and ∼6% for 2TC VT, SRTM BPND, and SUVR90–120, respectively. Lack of numerical stability impaired the calculation of meaningful BPND T–RT variability in AD NFT-poor and HV NFT-rich and poor brain regions where >100% variability was observed. Considering the brain region parcellation adopted in this work (NFT-rich vs. NFT-poor) and subject diagnosis (HV vs. AD), the 2TC VT T–RT variability was similar considering all four permutations. A similar behavior (although lower T–RT variability) was observed for SUVR90–120. No significant differences were observed in NFT-rich SUVR90–120 T–RT variability between the high and low injected radioactivity groups (5.6 ± 3.5 and 6.1 ± 5.5, respectively). Similarly, no significant differences were observed in VT and BPND T–RT variability in NFT-rich brain regions as a result of differences in injected radioactivity.
Summary of %T–RT variability for 2TC VT, SRTM BPND, and SUVR90-120 in subjects with AD and HV in selected NFT-rich and NFT-poor brain regions.
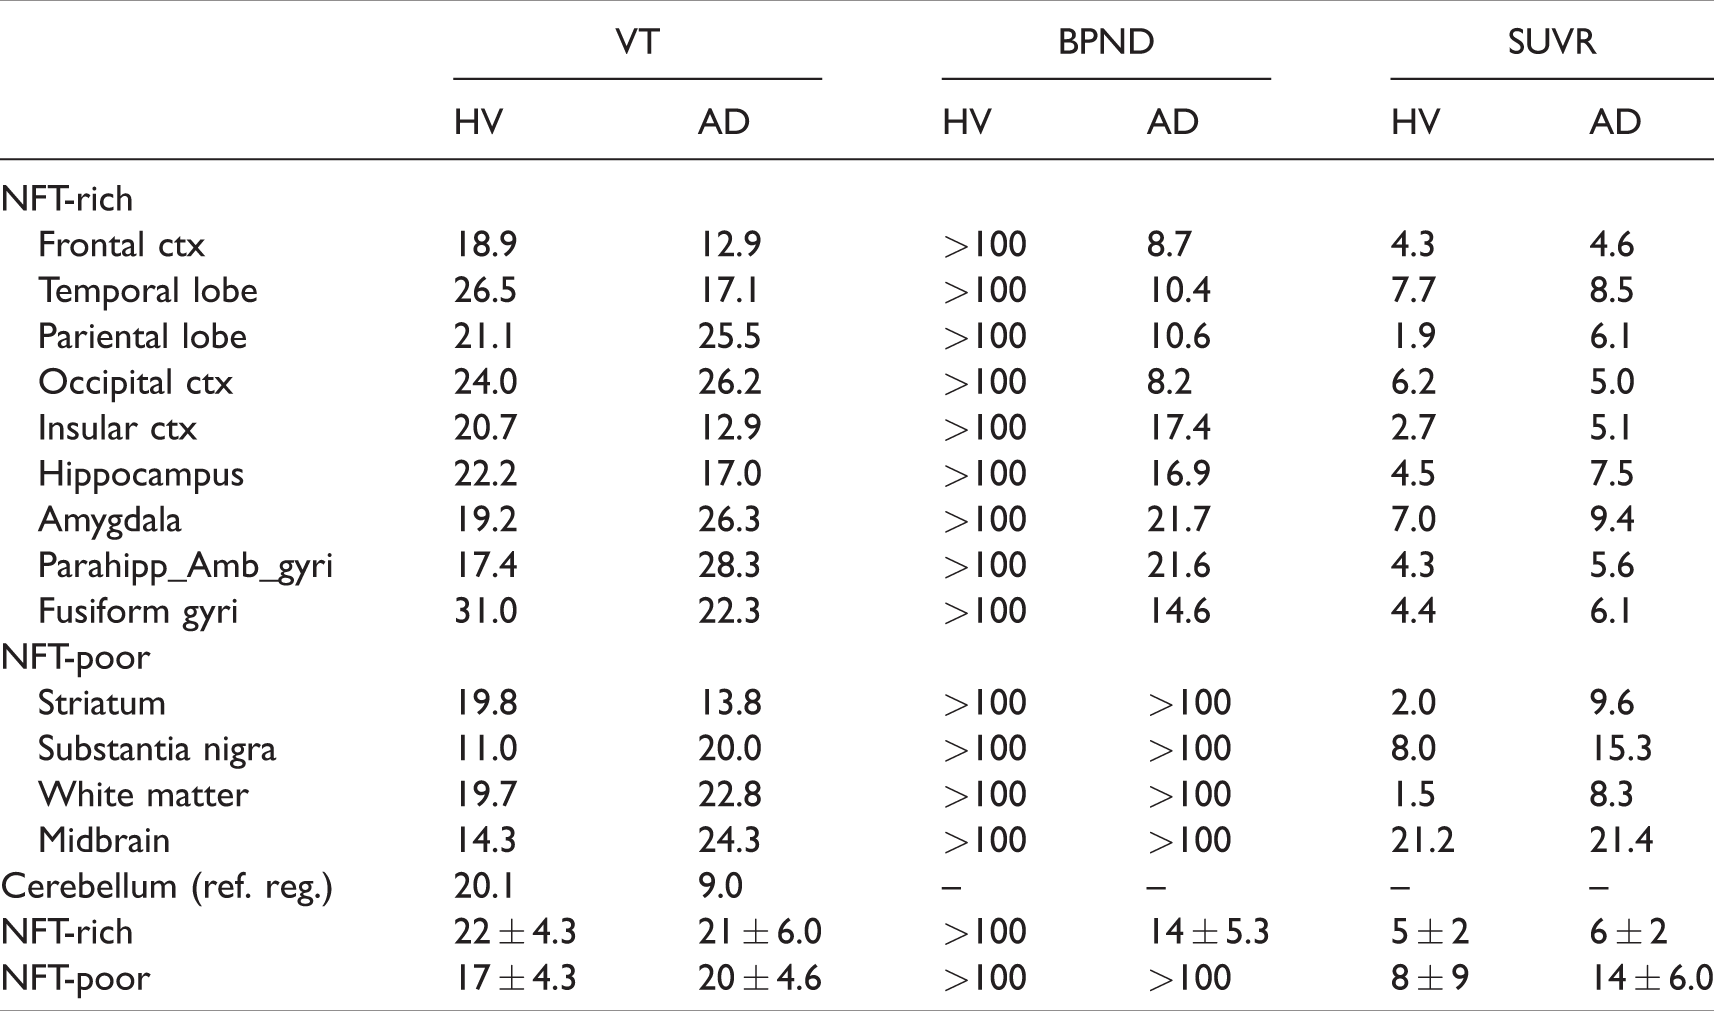
Figure 5 shows the voxel-wise map of SUVR90–120 T–RT variability averaged across the HV and AD populations. Images were registered to a common MRI space before calculating the average values. In general, T–RT variability was low in cortical regions and, as expected, relatively high in basal ganglia, brain white matter and midbrain structures due to their low uptake. Additionally, slightly higher T–RT variability in low uptake regions was observed in the AD group presumably due to spillover effects from grey matter uptake.
Voxel-wise average SUVR90–120 T–RT variability images in AD and HVs. Images were registered to a common MRI space. High variability at the top of the brain (sagittal and coronal view on the top row) represents an artifact due to bad FOV positioning in one the subjects.
Discussion
The pharmacokinetic characterization, quantification and test–retest variability of [18F]MK-6240 using three quantitative approaches spanning from full quantification with arterial input function (VT), reference tissue model (BPND) to SUV target to reference region (SUVR) were presented in this work. Regional TACs were well described by the reversible two-tissue compartment model and the simplified reference tissue model. Volumes of distribution estimates were high in AD NFT-rich brain regions with an average of ∼17 mL·cm−3, while estimates in AD NFT-poor and HV were lower averaging ∼5 mL·cm−3. Notice that the VT values work was not corrected by plasma-free fraction value. Plasma-free fraction values were very small and in our experience below the threshold that would ensure accurate estimates. SRTM BPND estimates were also comparatively high in AD NFT-rich brain regions with an average value of ∼1.4 and close to zero in AD NFT-poor and HV. In our selection of NFT-poor regions, despite good fits, the SRTM produced unreliable numerical estimates of binding potential with high coefficients of variation. This observation was consistent with that found in Lohith et al. 4 and it is possibly related to the low signal-to-noise ratio in these regions in comparison to the reference region. In NFT-rich brain regions, SUVR curves asymptotically reached equilibrium. SUVR values (SUVR-1), derived from the 90–120-min time window, linearly correlated to SRTM BPND estimates with only a small bias that could be explained by the application of the SRTM outside the framework that defines its validity (2TCM behavior of the tracer 10 ). On the other hand, the relationship between SUVR-1 and DVR-1, although monotonic, deviated from linearly in high binding regions (DVR-1 > 3). A similar effect was observed between BPND and DVR-1. Divergence between arterial input and reference tissue-based outcomes could be explained by a combination of factors, for example BPND and SUVR estimates can introduce biases with respect to measurement of specific uptake derived from volumes of distribution (DVR-1) that are dependent of the magnitude of the uptake and can lead to an underestimation of the specific binding.10,12 Also, slow tracer kinetics in brain regions with high uptake with respect to the relatively fast kinetics in plasma mainly driven by fast peripheral metabolism make the accurate estimation of VT challenging. Furthermore, low radioactivity counts in plasma samples at late time points can also introduce variability due to low counts hindering the accurate estimation of VT. It is important to consider these factors and the divergence between BPND, SUVR and VT when interpreting metrics of specific MK-6240 binding described by SUVR metrics, particularly in high binding regions.
Across all subjects, average T–RT variabilities in NFT-rich regions were ∼21%, ∼14% and ∼6% for 2TC VT, SRTM BPND, and SUVR90–120, respectively. The number of independent variables needed to calculate each of three PET outcomes is different and it is consistent with the expected variabilities of each outcome. Furthermore, the accuracy/precision balance generally favors precision over accuracy when using simplified metrics such as SUVRs are used. Importantly, T–RT variability in NFT-rich brain regions was not significantly different between the low and high injected radioactivity groups for the three PET outcomes studied in this work. This warrants the use of low injected activity studies (∼165 MBq), which is not only accurate and reproducible, but also offer lower radiation burden to patients.
[18F]MK-6240 showed a distribution pattern in the brain of cognitive normal and subjects with AD that was consistent with previous reports on [18F]MK-6240 and other tau PET tracers that does not contradicts histopathological studies on pathologically aggregated tau in Alzheimer’s disease. 13 However, as previously noted, 3 accumulation of the tracer outside the brain, most noticeable in HV, was observed which prompted us to use a cerebellar reference region that attempted (by means of volumetric erosion) to minimize spillover effects that could contribute to biased quantitative outcomes. The nature of this binding is still unknown and could reflect not only the uptake of parent [18F]MK-6240 but also contribution from radiolabeled metabolic species. Further investigation will be needed to understand the nature of this binding and to assess the impact of different methodologies, including partial volume corrections, to define an optimal reference region that minimizes spillover effects from this extra-cerebral uptake. In the subjects studied in this work, we did not find strong evidence of brain and midbrain off-target binding. Only one HV subject showed above-background retention of the tracer in substantia nigra. This is consistent with the heterogeneity of the uptake in this region across different subjects reported by Betthauser et al. 3
We have identified two limitations in the results presented in this study. First, it is the relative clinical heterogeneity of the AD population and the small number and relatively younger cognitively normal controls. However, we believe that the messages delivered in this manuscript in relation to quantification and T–RT characteristics of [18F]MK-6240 are still useful and applicable to further studies. Second, the T–RT variability results presented here represent variability observed within a short period of time (no more than three weeks) where brain hemodynamics and tracer delivery properties are unlikely to drastically change. Extrapolation of these results to longer time windows or in subjects undergoing therapeutics interventions that could alter tracer delivery to the brain is not guaranteed. Further studies are needed to address T–RT variability under these conditions.
In conclusion, the results presented in this work are consistent with previous publications that suggest [18F]MK-6240 is a fit for purpose radiotracer to assess the NFT status in subjects with Alzheimer’s disease. The simplified SUVR metrics provided the most reproducible outcome measure, particularly in NFT-rich regions of AD and healthy subjects. Further longitudinal studies are needed to understand its value as a disease progression biomarker.
Footnotes
Funding
The author(s) received no financial support for the research, authorship, and/or publication of this article.
Acknowledgements
The authors thank Jennifer Madonia, Nichole Deagele, Olivier Barret and Cristian Constantinescu from Invicro (Invicro A Konica Minolta Company) for their contribution on the execution of this study.
Declaration of conflicting interests
The author(s) declared the following potential conflicts of interest with respect to the research, authorship, and/or publication of this article: Cristian Salinas, Ajay Purohit, John Beaver and Laurent Martello are fulltime employees of Biogen Inc. Talakad G. Lohith, Arie Struyk, Cyrille Sur and Idriss Bennacef are fulltime employees of Merck & Company, Inc.
Authors’ contributions
All authors make substantial contributions to conception and design, acquisition of data, analysis and interpretation of data. Specific contributions are described below:
Study conception and design: Cristian Salinas, Talakad Lohith, Arie Struyk.
Acquisition of data: Cristian Salinas, Ajay Purohit.
Analysis and interpretation of data: Cristian Salinas, Talakad Lohith, Arie Struyk, Laurent Martarello.
Drafting of manuscript: Cristian Salinas, Talakad Lohith.
Critical revision: Cyrille Sur, John Beaver, Laurent Martarello.