
Abstract
Determination of compartment-specific cerebral blood volume (CBV) changes is important for understanding neurovascular physiology and quantifying blood oxygenation level-dependent (BOLD) functional magnetic resonance imaging (fMRI). In isoflurane-anesthetized cats, we measured the spatiotemporal responses of arterial CBV (CBVa) and total CBV (CBVt) induced by a 40-second visual stimulation, using magnetization transfer (MT)-varied BOLD and contrast-agent fMRI techniques at 9.4 T. To determine the venous CBV (CBVv) change, we calculated the difference between CBVt and CBVa changes. The dynamic response of CBVa was an order of magnitude faster than that of CBVv, while the magnitude of change under steady-state conditions was similar between the two. Following stimulation offset, ΔCBVa showed small poststimulus undershoots, while ΔCBVv slowly returned to baseline. The largest CBVa and CBVt response occurred after 10 seconds of simulation in cortical layer 4, which we identified as the stripe of Gennari by T1-weighted MRI. The CBVv response, however, was not specific across the cortical layers during the entire stimulation period. Our data indicate that rapid, more-specific arterial vasodilation is followed by slow, less-specific venous dilation. Our finding implies that the contribution of CBVv changes to BOLD signals is significant for long, but not short, stimulation periods.
Introduction
Functional magnetic resonance imaging (fMRI) techniques allow for noninvasive visualization of hemodynamic responses induced by neural activities. However, it remains controversial as to whether the area of changes in the fMRI signal fully corresponds with the site of increased neural activity, and whether the most commonly used blood oxygenation level-dependent (BOLD) fMRI signals can be quantified as physiological parameters. The laminar structure of the visual cortex has been used for examination of the spatial localization of fMRI signals (Goense and Logothetis, 2006; Harel et al, 2006; Jin and Kim, 2008a; Kim and Kim, 2010; Logothetis et al, 2002; Walters et al, 2003; Zhao et al, 2006). The middle of the cortex (layer 4) has the highest capillary density and metabolic responses in the primary sensory cortical areas (Payne and Peters, 2002; Woolsey et al, 1996). In humans and nonhuman primates, layer 4 contains the myelin-rich stripe of Gennari in the primary visual cortex and is identified by its prominent anatomical MRI contrast (Barbier et al, 2002; Logothetis et al, 2002; Walters et al, 2003). Although the laminar model in the cat visual cortex has been used (Harel et al, 2006; Jin and Kim, 2008a; Kim and Kim, 2010; Zhao et al, 2006), the location of layer 4 in anatomical MR images remains undetermined. As brain topography varies among individual cats, it is extremely advantageous to know the in vivo MRI correlation between the structural and functional contrast of cortical layers.
In cortical layer-dependent functional studies with large activation areas, the largest change in conventional gradient-echo BOLD fMRI signals occurs at the cortical surface, but the largest change in cerebral blood volume (CBV) responses appears in the middle of the cortex (Harel et al, 2006; Jin and Kim, 2008a; Lu et al, 2004; Mandeville and Marota, 1999; Zhao et al, 2006). Unlike increased venous oxygenation, an increase in venous CBV decreases BOLD fMRI signals. Thus, it is important to separate total CBV (CBVt) into arterial and venous CBV (CBVa and CBVv, respectively) changes to quantify BOLD fMRI signals as physiological parameters, and to better understand compartment-specific vascular responses. Here, we define CBVa as the blood volume within arterial vessels of all sizes, including a portion of capillaries, and CBVv as the remainder of CBVt; thus, if CBVt and CBVa are known, we can calculate CBVv. We can determine the CBVa change using our newly developed magnetization transfer (MT)-varied fMRI technique (Kim et al, 2008; Kim and Kim, 2010). When a long off-resonance radio frequency (RF) pulse is applied, MT effects reduce tissue water signals and could produce a similar effect on venous blood due to the upstream free exchange between tissue water and capillary water. In contrast, the arterial blood pool experiences only a minimal MT effect as there is an inflow of fresh blood spins unaffected by the MT-inducing pulse. Thus, MT-insensitive arterial blood signals can be separated from MT-dependent extravascular tissue and venous blood.
Based on our previous 15 seconds somatosensory stimulation studies in isoflurane-anesthetized rats, the CBVa change is dominant while the CBVv change is negligible (Kim et al, 2007). In two separate fMRI studies in isoflurane-anesthetized cats, time-dependent spatial responses of CBVt and CBVa across the visual cortex appear similar (Jin and Kim, 2008a) and (Kim and Kim, 2010), suggesting that CBVt changes originate mostly from arterial vessels, the responses share a similar special specificity, or both. However, CBVa and CBVv compartments may undergo different dynamic changes during neural stimulation; thus, responses may depend upon the duration of stimulation. Indeed, CBVt-weighted fMRI signals in the rat somatosensory cortex occur as two components: an early rapid response followed by a slow prolonged response (Mandeville et al, 1999; Silva et al, 2007). Important questions include whether the slow CBVt response originates from passively responding venous vessels, and whether the spatial specificity of CBVv is similar to that of CBVa. Systemic examination of functional CBVa versus CBVv responses will determine whether our previous finding of the dominant CBVa change resulted from relatively short stimulus duration (15 seconds); how the spatial specificity of CBV responses varies with the stimulus duration; and when the CBVv response is significant.
In this study, each cat was used to both identify layer 4 in the visual cortex by imaging the stripe of Gennari with T1-weighted images, and measure functional CBVa and CBVt changes (ΔCBVa and ΔCBVt) during 40 seconds visual stimulation by MT-varied BOLD and contrast-agent fMRI techniques. We used the difference in ΔCBVa and ΔCBVt time courses to determine the dynamic change in CBVv (ΔCBVv). Temporal characteristics of ΔCBVa and ΔCBVv were compared to identify the sources of early and late contributions to CBVt responses. To investigate time-dependent spatial specificity, we obtained functional maps and cortical profiles of ΔCBVa, ΔCBVt and ΔCBVv during four 10-second stimulation periods, and compared these with in vivo high-resolution anatomical images to correlate structure and function.
Materials and methods
Animal Preparation and Visual Stimulation
Nine adolescent cats weighing 1.1 to 2.0 kg were performed with the approval from the University of Pittsburgh Institutional Animal Care and Use Committee: two cats for visualization of anatomic cortical structure with in vivo and fixed brain MRI, and seven cats for fMRI studies. The animals were anesthetized with 1.0% to 1.1% isoflurane with air supplemented with O2 to attain a total O2 level of ~30%. End-tidal CO2 was maintained in the range of 3.5% to 3.8%. Rectal temperature was maintained at 38.5°C ± 0.5 °C. For visual stimulation, binocular, full-field, black (0.5 cd/cm2) and white (29 cd/cm2) square-wave moving gratings (spatial frequency: 0.15 cycles/degree, temporal frequency: 2 cycles/s) were presented. It is noted that much higher luminance was used for our laboratory's previous visual stimulation studies (Jin and Kim, 2008a, b ; Zhao et al, 2006). The details of animal preparation and visual stimulation were described previously (Kim and Kim, 2010).
Overall Magnetic Resonance Imaging Acquisitions
All MRI measurements were performed using a 9.4 T/31-cm magnet interfaced to a Unity INOVA console (Varian, Palo Alto, CA, USA) and an actively shielded 12 cm gradient coil, with a maximal strength of 400 mT/m and rise time of 130 microseconds. A 1.5-cm diameter surface coil was used. Magnetic field homogeneity was manually optimized using a slab, twice the imaging-slice thickness.
Visualization of Anatomical Structure in the Primary Visual Cortex
A coronal slice of a T1-weighted image was acquired using a four-segmented turbo-fast low angle shot (FLASH) technique with pixel resolution = 78 μm × 78 μm × 2 mm, field of view = 2.0 × 2.0 cm2, flip angle = ~10°, echo time (TE) = 5 milliseconds, repetition time (TR) = 10 milliseconds, intersegment delay = 4 seconds, and an inversion time (TI) of 1.2 and 1.4 seconds. Total CBV-weighted maps (ΔR*2,MION) were also measured by FLASH images (without inversion) before and after a bolus injection of ~12 mg Fe/kg dextran-coated monocrystalline iron oxide nanoparticles (MIONs). The images were acquired with TR = 40 milliseconds, TE =10 to 15 milliseconds, intersegment delay = 100 milliseconds, and the same pixel size as T1-weighted images. After the MR experiments, cat brains were fixed with 4% paraformaldehyde in 0.1 mol/L phosphate-buffered saline (n = 2), and then placed in a container with agarose gel for MRI. As the fixation changes T1 values of the brain, the TI value was adjusted to 850 milliseconds to replicate the cortical contrast of the in vivo images. Following the MR scan, a 4-mm coronal slab was extracted from the fixed brain (n = 1). We stained ten 10-μm thick slices with Luxol Fast Blue/Cresyl Violet to visualize myelin and Nissl bodies. The histological cortical profile was compared with the corresponding T1-weighted image.
Functional Magnetic Resonance Imaging Studies: ΔCBVa and ΔCBVt
Preliminary multislice gradient-echo BOLD fMRI was performed in the visual cortical area. We then selected one 2-mm thick coronal slice for fMRI studies from each cat. High-resolution T1-weighted anatomical images (field of view = 2.0 × 2.0 cm2, matrix size = 128 × 128) were obtained from the same slice to identify brain structures by the two-segmented turbo-FLASH technique with a TI of 1.4 seconds. Functional magnetic resonance imaging data were obtained using a single-shot EPI technique with in-plane resolution = 312 μm × 312 μm, flip angle = 20° to 30°, and TR of 1 second. Each fMRI run consisted of 50 prestimulation, 40 stimulation and 100 poststimulation images, repeated ~20 times for signal averaging.
Measurement of Functional ΔCBVa
Stimulus-induced ΔCBVa measurements were performed with TR = 1 second (880 milliseconds off-resonance MT pulse duration with 5,000 Hz offset to water, 20 milliseconds delay, and 100 milliseconds slice excitation and data acquisition), and TE = 20 milliseconds. The RF power level of MT-inducing pulses was adjusted to achieve intensities of visual cortical area (Sss,MT) to 1, ~0.7 and ~0.4 (n = 4), or 1 and ~0.4 (n = 3) of the steady-state signal without MT effects. Details of theoretical background and methods were described previously (Kim et al, 2008; Kim and Kim, 2010).
Measurement of Functional ΔCBVt
Stimulus-induced CBVt changes were measured with the same parameters as ΔCBVa measurements, except without MT pulses and a TE of 13 milliseconds after the intravenous administration of 7 to 15 mg Fe/kg MION. For the calculation of ΔR*2 induced by MION without stimulation (ΔR*2,MION), images were separately measured with TE = 20 -milliseconds before each fMRI run.
Data Processing
General data processing: Data analysis was performed with STIMULATE, ImageJ, and in-house Matlab routines (Mathworks, Natick, MA, USA). For each study, all runs with identical conditions were averaged to generate group data. The first 10 seconds of prestimulation data was excluded to ensure that the steady-state condition was met. The baseline images included data acquired 40 seconds before simulation, while the stimulation images included data acquired between 1 and 40 seconds after stimulation onset. Individual results were averaged and group data are reported as mean ± s.d.
Calculation of CBVa, CBVt, and CBVv Changes
For ΔCBVa calculations, stimulus-induced changes (ΔSss,MT) at each MT level was normalized to the fully relaxed signal S0 (ΔSss,MT/S0). Then, these normalized signal changes were linearly fit against corresponding normalized baseline signals at each MT level (Sss,MT/S0). DCBVa (units of mL blood/g tissue) values were obtained by multiplying the intercept with a tissue-to-blood partition coefficient of 0.9 mL/g (Herscovitch and Raichle, 1985).
The susceptibility-induced change in R*2 by MION injection (ΔR*2,MION) was linearly related to the CBVt value in the baseline condition: ΔR*2,MION = κ × CBVt, where κ is a constant dependent on the concentration of MION in blood (Kennan et al, 1998). Determination of an accurate κ requires a susceptibility change of the blood, but in our survival experiments, we could not withdraw the large amount of blood needed, and thus did not quantify κ as previously (Kim et al, 2007). Instead, ΔR*2,MION was calculated by ln(Spre/Spost)/TE, where Spre and Spost are signal intensities with a TE of 20 milliseconds before and after the MION injection, respectively. The stimulus-induced relaxation rate change after MION injection is also linearly related to the absolute ΔCBVt. As the magnitude of the negative CBVt-weighted fMRI response (ΔR*2,stim,MION) after the MION injection is reduced by the positive BOLD response (ΔR*2,stim), the BOLD signal must be removed from the CBVt-weighted fMRI response (Kennan et al, 1998); ΔR*2,stim,MION (= κ × ΔCBVt), where ΔR*2 is computed by –ln(Sstim/Sbase)/TE, where Sbase and Sstim are the signals under baseline and stimulation conditions, respectively. Note that the BOLD signal should be obtained from fMRI data without MT effects. Relative CBVt change (ΔCBVt/CBVt) was calculated as (ΔR*2,stim,MION−ΔR*2,stim)/ΔR*2,MION (i.e., κ × ΔCBVt/κ × CBVt).
To compare ΔCBVa, ΔCBVt, and ΔCBVv, we converted ΔCBVt/CBVt to ΔCBV by estimating baseline CBVt. In the intracortical region of interest (ROI) covering the most active pixels, three different baseline CBVt values were assumed to cover an adequate CBVt range: (1) CBVt = ΔCBVa/(ΔCBVt/CBVt), assuming the peak amplitude of ΔCBV = the peak amplitude of ΔCBVa (Kim et al, 2007); (2) a fixed value of 4.5 mL/100g; and (3) a fixed value of 5.0 mL/100 g. The assumption of the ΔCBVt peak = the ΔCBVa peak defines the lower limit of the CBVt value. The constant κ was determined by κ = CBVt/in the intracortical ROI in the intracortical ROI. Time-dependent ΔCBVt was calculated by (ΔR*2,stim,MION−ΔR*2,stim)/κ. ΔCBVv was obtained from the subtraction of ΔCBVa from ΔCBVt. As three baseline CBVt values were assumed, three corresponding ΔCBVt and ΔCBVv values were determined.
Generation of Functional Cerebral Blood Volume Maps
All images were smoothed with a 2D Gaussian filter (kernel size = 3 × 3, sigma = 0.5). ΔCBVa and ΔCBVt/CBVt and ΔCBVv maps were generated for the entire 40 seconds stimulation period. In addition, the stimulation period was divided into four equal parts and maps generated for each: 1 to 10 seconds, 11 to 20 seconds, 21 to 30 seconds, and 31 to 40 seconds.
Images from the baseline and the stimulation conditions were averaged for each MT level. To calculate ΔCBVa maps, only activated pixels satisfying a P value <0.05 (for baseline versus stimulation conditions) at all MT levels were selected. ΔCBVa was then obtained on a pixel-by-pixel basis, excluding the pixels with negative intercepts due to the contamination of cerebrospinal fluid (CSF) signals (Kim and Kim, 2010). For ΔCBVt/CBVt maps, only pixels with a P value <0.05 in both CBV-weighted fMRI and BOLD fMRI without MT were selected. ΔCBVt maps were generated by pixel-wise calculation assuming the peak ΔCBVt = peak ΔCBVa for the lowest ΔCBVt, and CBVt = 5 mL/100 g for the highest ΔCBVt. ΔCBVv was then calculated by subtracting ΔCBVa from ΔCBVt, but only for positively activated pixels in both ΔCBVa and ΔCBVt maps.
Hemodynamic Responses of Cerebral Blood Volume Changes
Temporal dynamics were determined on a ROI basis without applying the spatial filter. We chose the following four ROIs: (1) an entire intracortical ROI covering the primary visual cortex; (2) a middle cortical ROI based on anatomical T1-weighted MRI contrast; (3) an upper cortical ROI; and (4) a lower cortical ROI. The middle, upper, and lower cortical ROIs had the same sum as the entire intracortical ROI. Signals from all pixels within the ROI were averaged to obtain fMRI time courses. ΔCBVt, ΔCBVa, and ΔCBVv time courses were then calculated. These time courses were fit with a single-exponential hemodynamic response function convolved with the boxcar stimulus function; time-constant and steady-state amplitudes were obtained. As ΔCBVv time courses have low sensitivity, only averaged time courses across all seven animals were used for fitting.
Time-Dependent Cortical Depth Profiles of Cerebral Blood Volume Changes
We performed cortical depth profile analysis in area 18 within the visual cortex, as described previously (Zhao et al, 2006). Images were spatially interpolated using a bilinear method to match the resolution of the T1-weighted anatomical images without smoothing. To generate a signal profile in the cortical depth dimension, we selected two quadrangular ROIs (one within each hemisphere) from the cortex surface to the gray/white-matter boundary, based on T1-weighted anatomical images in each animal (Figure 5A), except for one animal in which the cortical surface in one hemisphere was distorted by large draining vein artifacts. The cortical depth was spatially interpolated to 11 pixels from the cortical surface to the white matter, resulting in an average depth resolution of 163 μm. The signals at the same relative cortical depths ere averaged. Depth-dependent ΔCBVt, ΔCBVa, and ΔCBVv values were then determined for each 10-second time period following the onset of stimulation, and their cortical profiles plotted as the distance from the cortical surface. The profiles of T1-weighted images were also obtained for an anatomical reference of layer 4. Cortical layer locations were approximately assigned based on relative distances of those layers in area 18 (Payne and Peters, 2002).
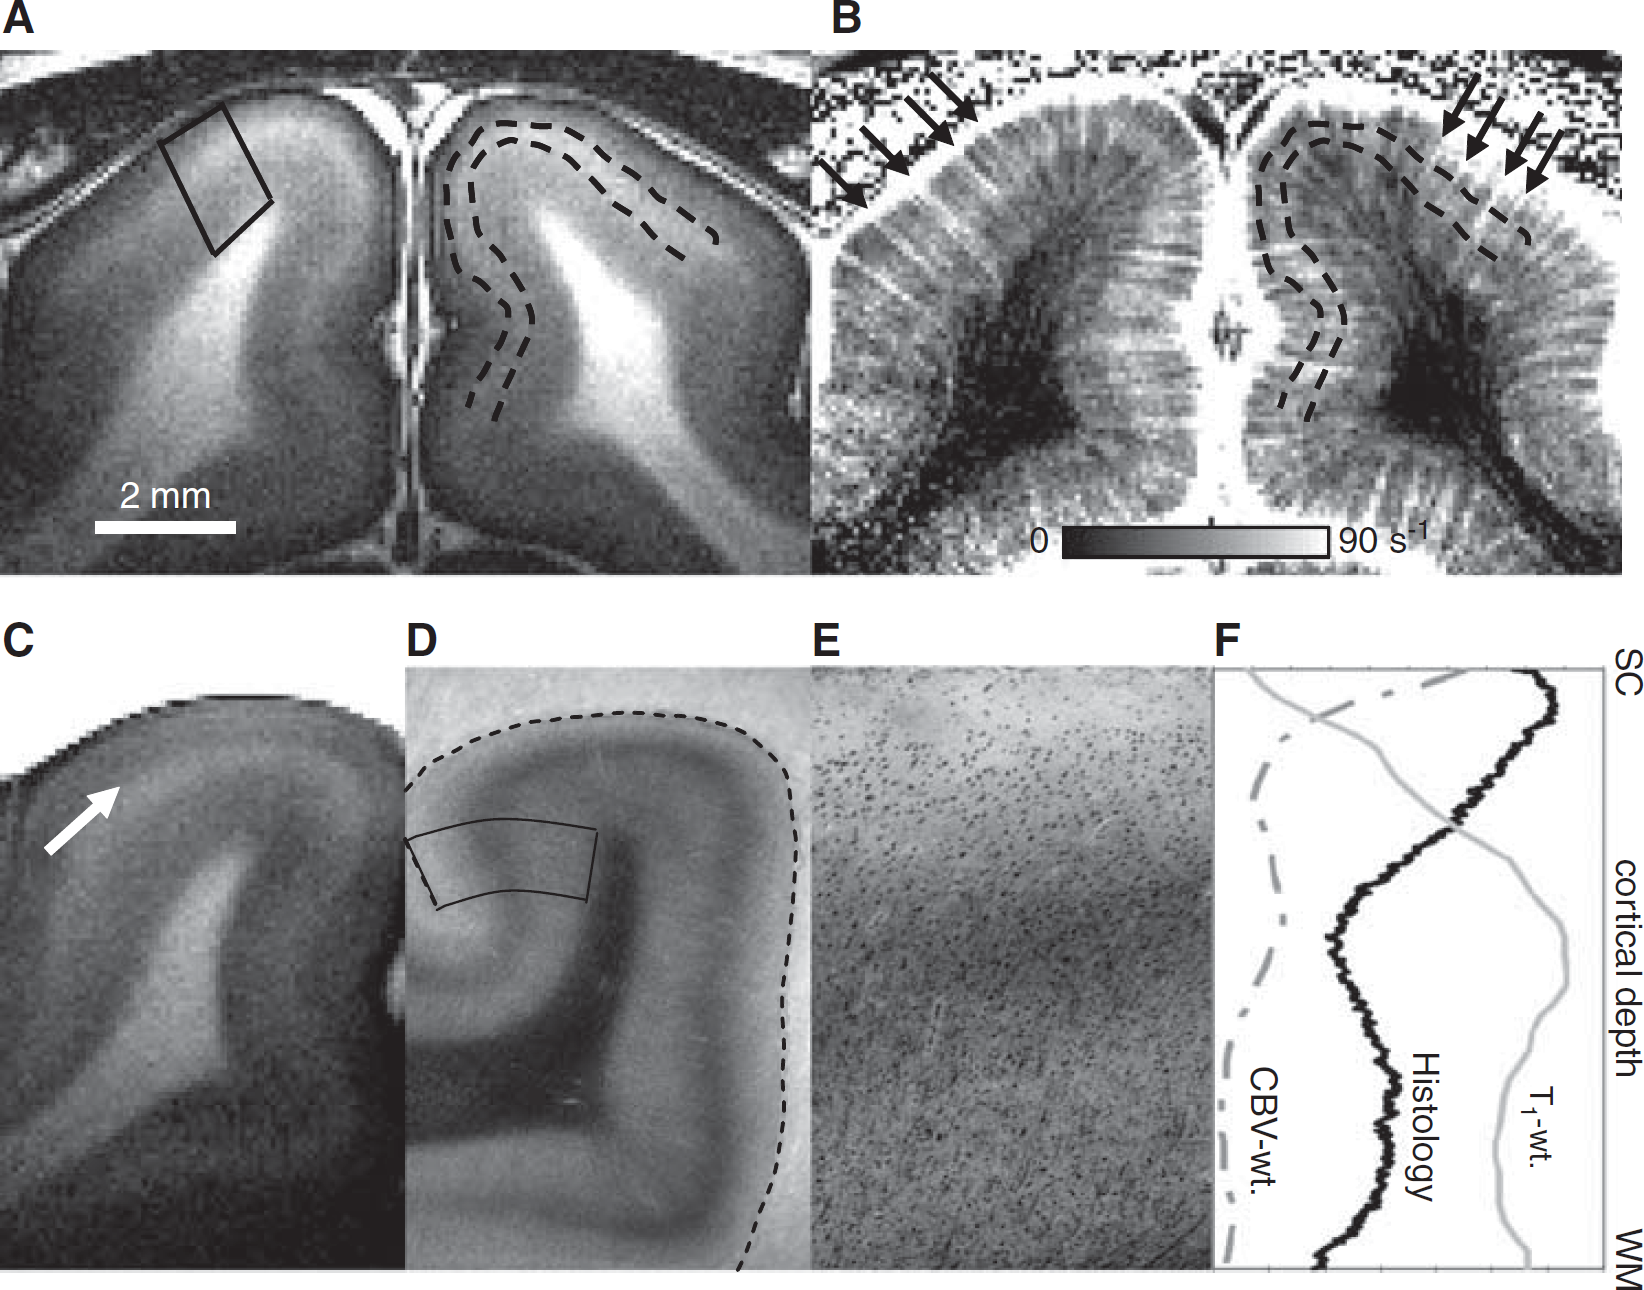
In vivo identification of the stripe of Gennari, layer 4 in the cat visual cortex. In vivo magnetic resonance (MR) images of one animal (
Relationship between anatomy (
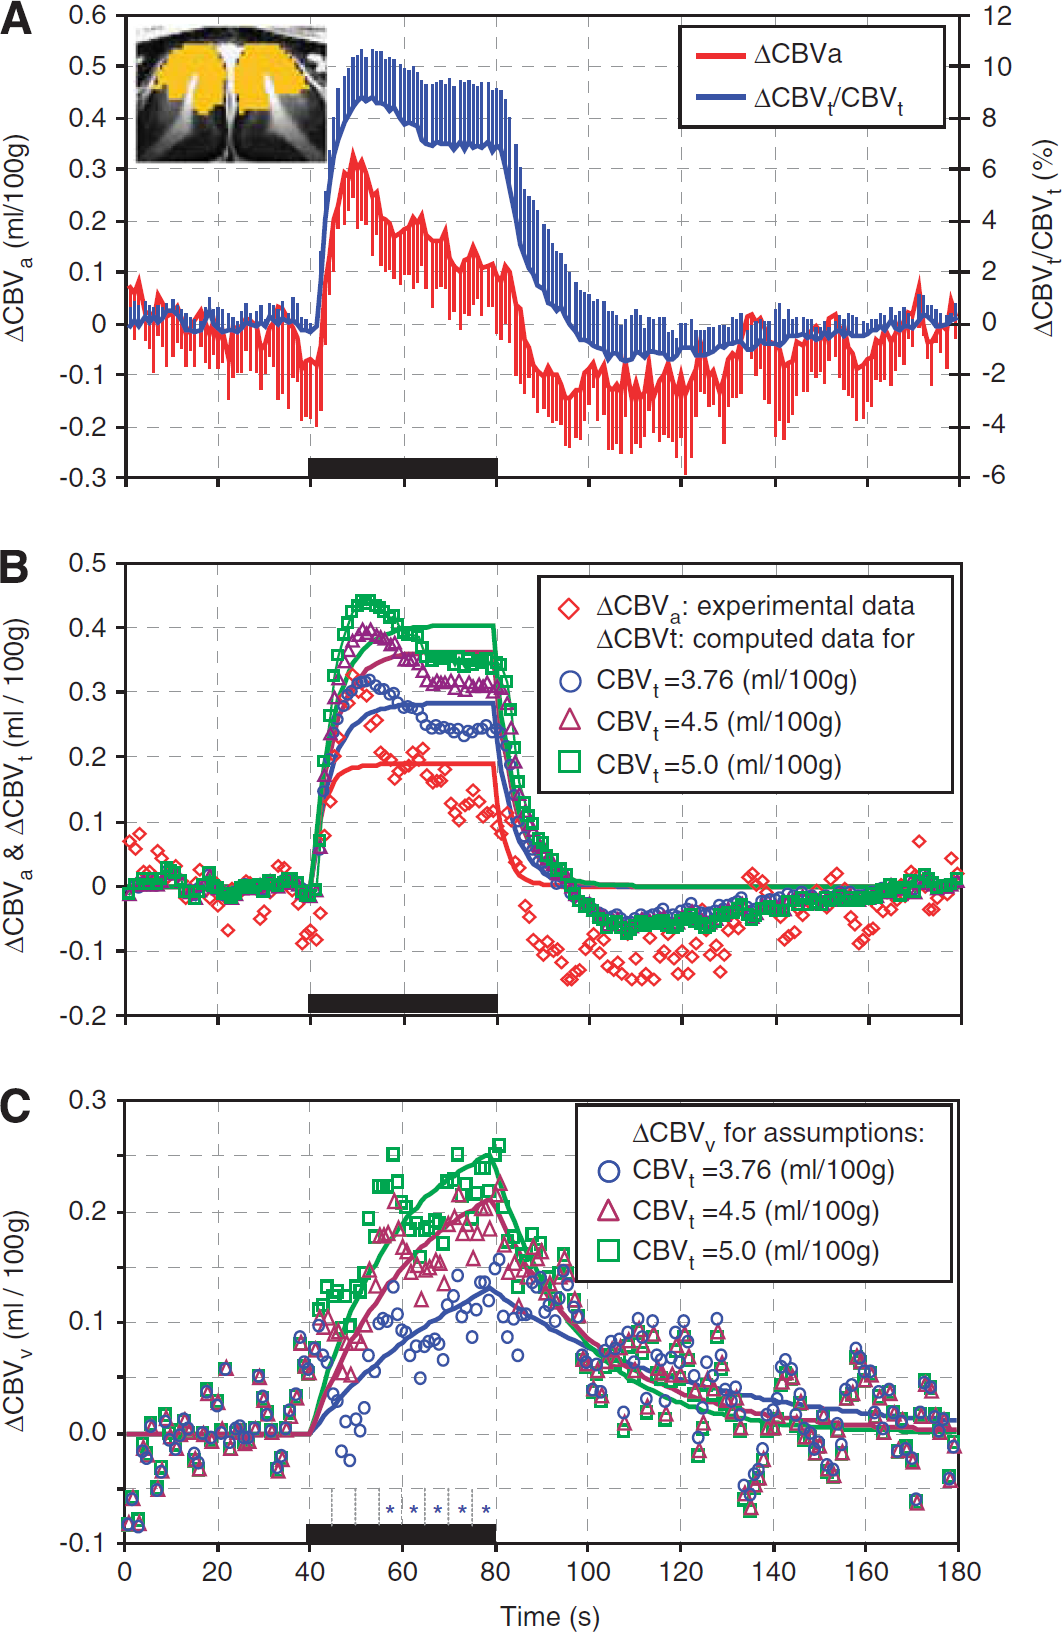
Dynamic functional changes of total, arterial, and venous cerebral blood volume (CBV). (
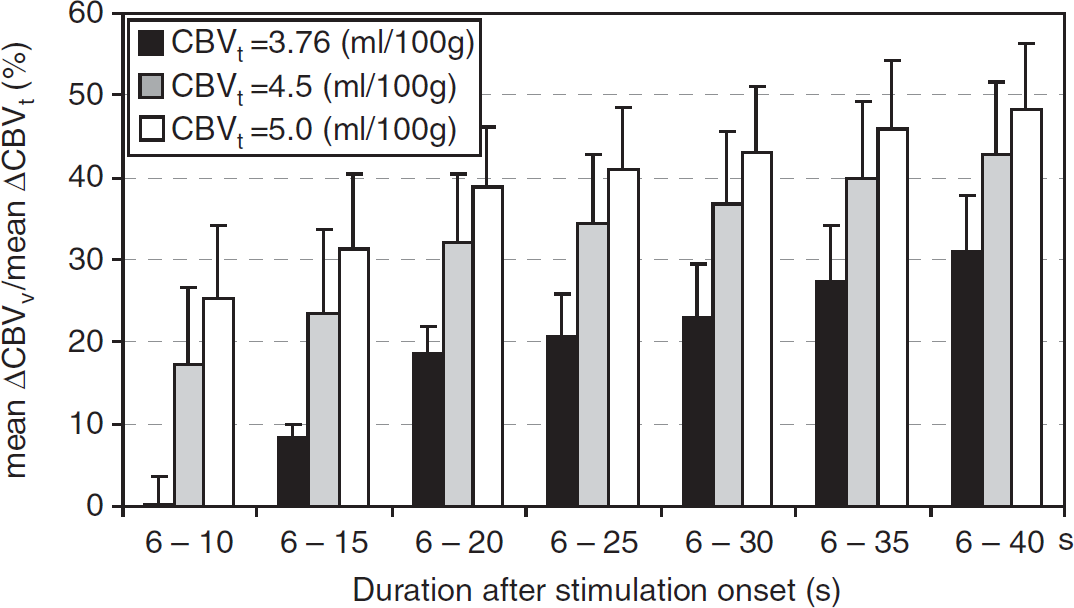
Stimulus-duration-dependent contribution of venous cerebral blood volume (CBV) to total CBV change (n = 7). The ratio of average ΔCBVv to average total CBV (ΔCBVt) increases was determined for different stimulus durations at three different baseline CBVt values, 3.76 (black), 4.5 (gray), and 5.0 mL/100 g (white). Error bars: standard errors of means.
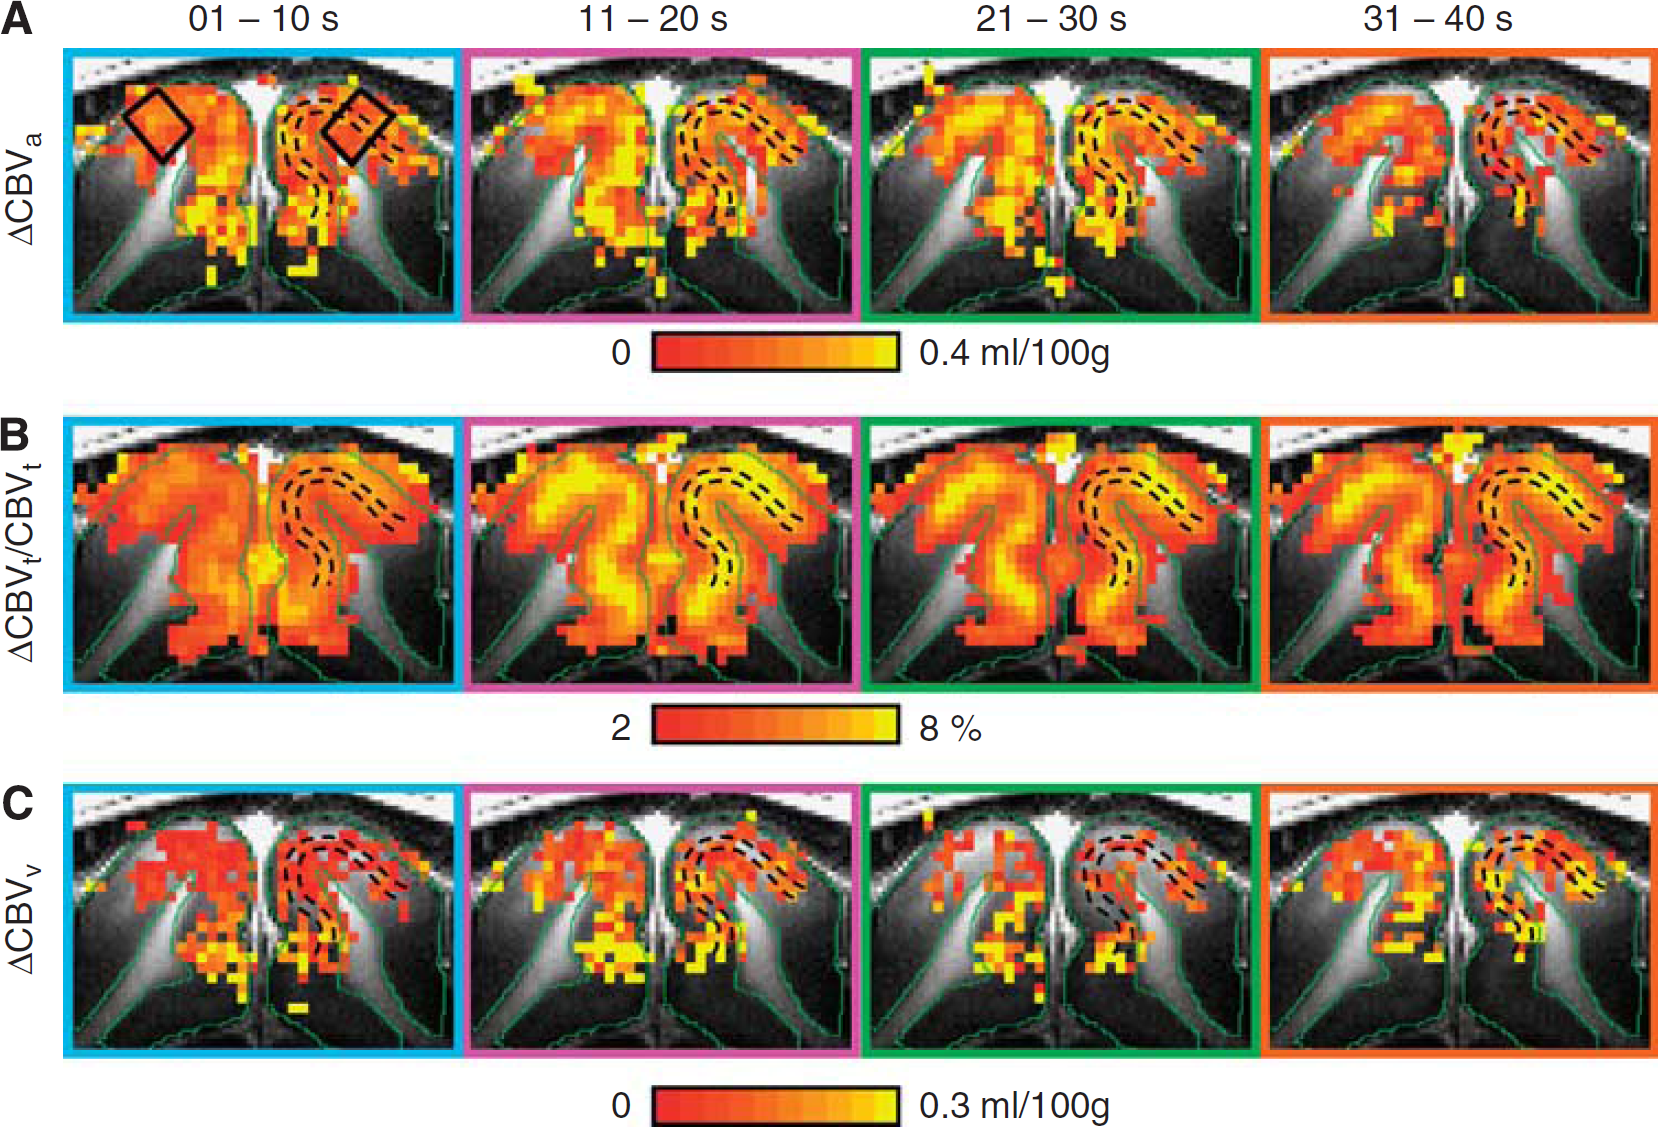
Time-dependent functional maps of total, arterial, and venous cerebral blood volume (CBV). Arterial CBV (ΔCBVa) (
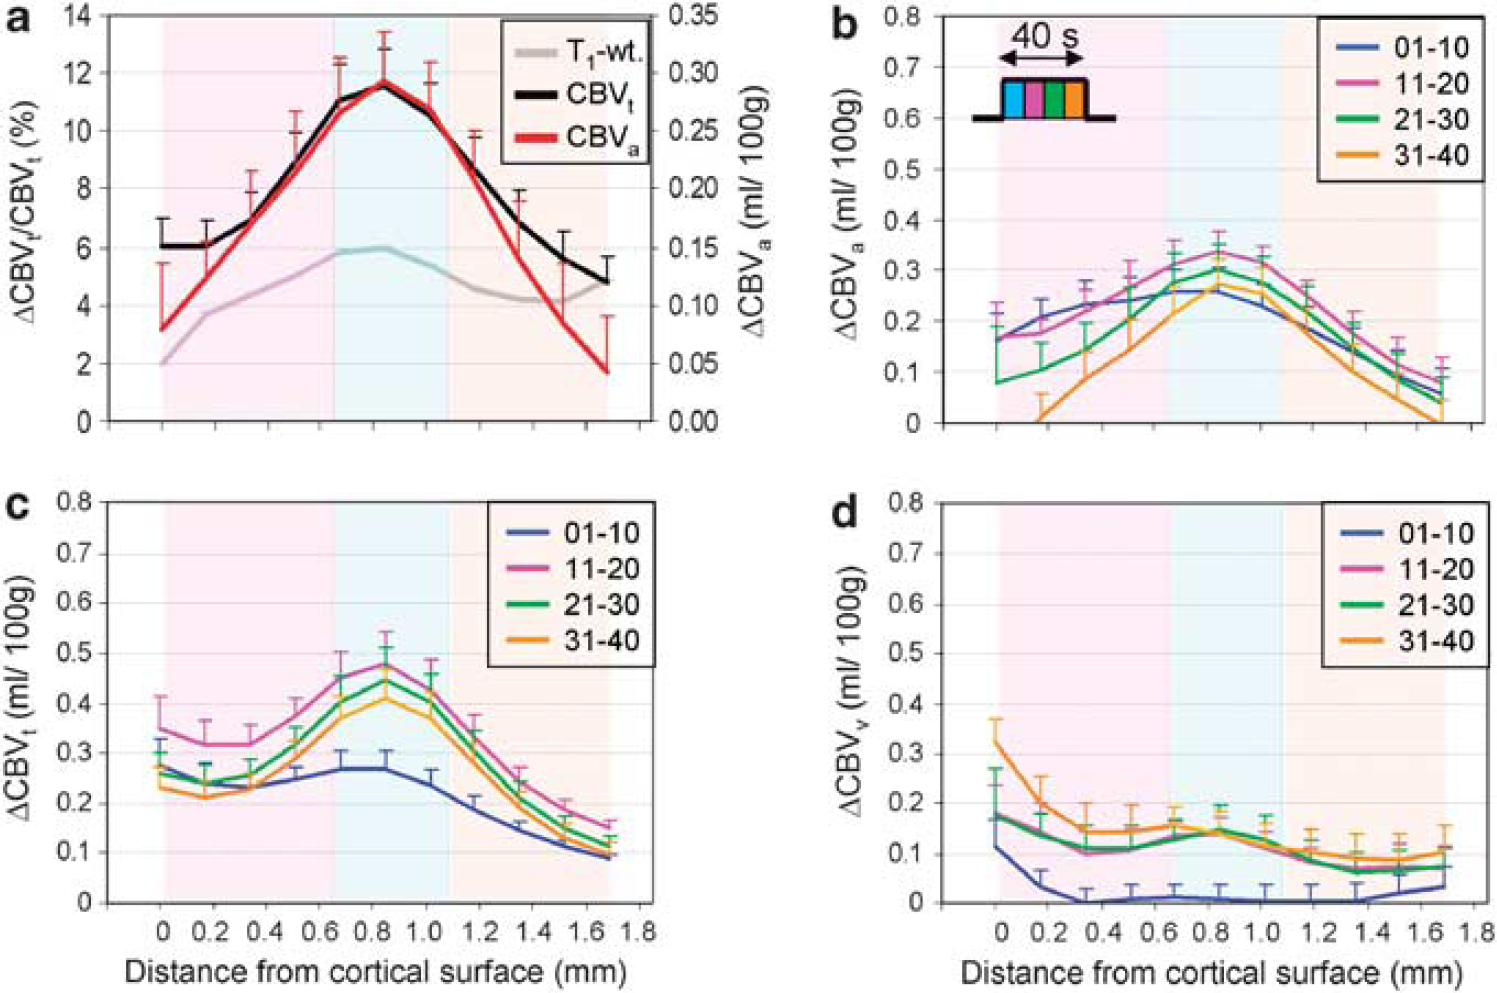
Cortical profiles in visual cortical area 18 (n = 7). Cortical depth profiles were generated from the regions of interest (ROIs) (black quadrangular ROIs in Figure 5A) in each animal. (
Results
Visualization of Anatomical Structure in the Primary Visual Cortex
Hyperintense layers were clearly visible in the middle cortical regions (outlined by dashed lines) in T1-weighted images with TI = 1.4 seconds (Figure 1A). However, with TI = 1.2 seconds, these layers became hypointense (data not shown), indicating that the signal source of these stripes is related to longitudinal relaxation properties. The source of this contrast is derived from the myelin-rich stripe of Gennari, a prominent feature in layer 4. The baseline CBVt-weighted (ΔR*2,MION) map (Figure 1B) shows higher CBVt values at the surface and the middle cortical layers, and at penetrating vessels (arrows). The high CBVt values in the middle cortical layers is consistent with the high vascular density found in layer 4 (Tieman et al, 2004). This area also colocalized with the hyperintense stripes in the T1-weighted images (see dashed contours in Figures 1A and 1B). As the T1 of blood and tissue are slightly different at 9.4 T, contrast in T1-weighted image may occur. However, after removal of the blood, the hyperintense layer was still evident in T1-weighted images of the fixed brain (1C), although the fixation process slightly distorted the brain. In the histological image (Figure 1D), myelin clearly appeared as the dark band in the middle of the cortex, and Nissl substances (i.e., cell bodies) as black dots (see Figure 1E). As tissue shrinkage and distortion occur during fixation, the tissue slides were roughly coregistered to MR images, based on relative location to less-distorted white-matter structures. We observed a correlation between the myelin-rich dark stripe in the magnified histological image (Figure 1E) and the hyperintense band in the T1-weighted image (from quadrangular box ROIs in Figure 1A), indicating that the hyperintensity within the cortex originated from myelin. These myelin-related profiles also agree with the profile of CBVt-weighted images (ΔR*2,MION) (Figure 1F).
Dynamics and Magnitude of Functional Cerebral Blood Volume Changes
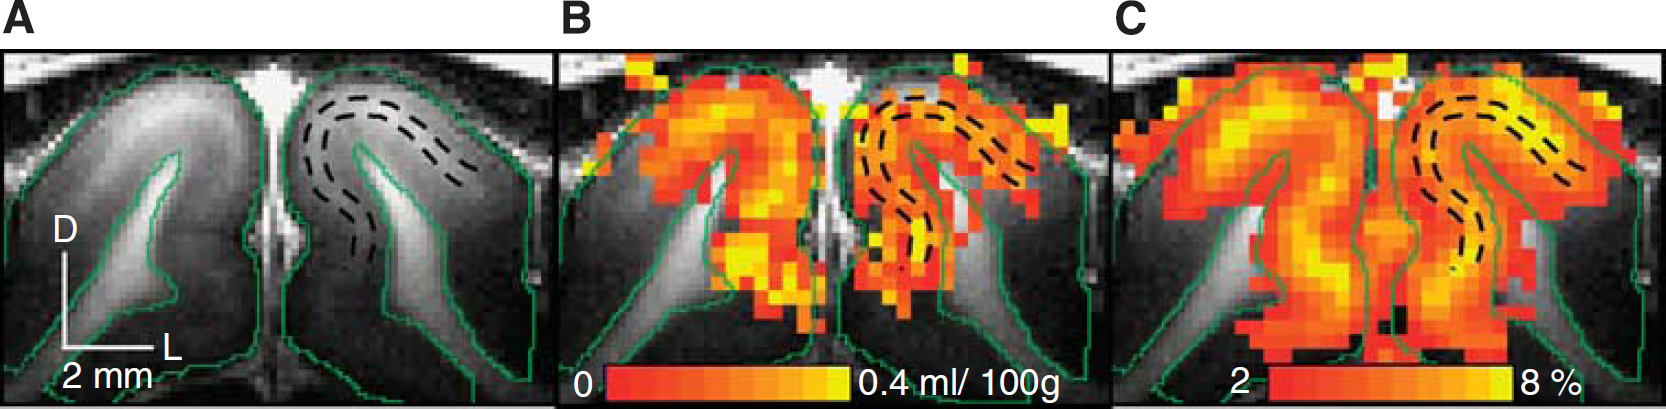
Visual stimulus-induced ΔCBVa and relative CBVt change maps were generated for the 40-second stimulation period (Figure 2). The greatest signal changes (yellow pixels in Figures 2B and 2C) in the cortex generally appeared in the area denoted by the two black dashed lines that represent the hyperintense stripes in T1-weighted images (Figure 2A). This indicates that the greatest ΔCBVa and ΔCBVt happened within layer 4, consistent with our previous cortical layer-dependent fMRI studies (Kim and Kim, 2010; Zhao et al, 2006).
To determine the temporal dynamics, we obtained ΔCBVa and ΔCBVt/CBVt time courses (Figure 3A) from the intracortical ROI (see yellow pixels in the inserted figure). Both CBV signals increased immediately following the stimulus onset, peaked within 10 seconds, and then slightly decreased during the remaining period of stimulation (Figure 3A). Assuming identical peak amplitudes for ΔCBVt and ΔCBVa (Kim et al, 2007), we calculated the baseline CBVt value as 3.76 ± 1.34 mL/100 g tissue. We next converted ΔCBVt/CBVt time courses to ΔCBVt time courses for the three baseline CBVt values, for example, lower limit value, 4.5 and 5 mL/100 g (Figure 3B), and calculated the corresponding ΔCBVv time courses (Figure 3C). Both ΔCBVa and ΔCBVt time courses showed rapid, positive changes after stimulus onset followed by small undershoots poststimulation (Figure 3B). In contrast, ΔCBVv slowly increased after stimulus onset, and then slowly decreased without the poststimulus undershoots (Figure 3C). We observed significant CBVv changes from baseline (see asterisk marks in Figure 3C) at 15 seconds after stimulation onset for a CBVt of 3.76 mL/100 g (blue circles in Figure 3C). Although complex functions might fit the experimental data better, the simple single-exponential model captured the characteristics of arterial versus venous blood volume responses. Fitted functions of the averaged data were shown as solid lines in Figures 3B and 3C, and its results are summarized in Table 1. ΔCBVa and ΔCBVt responses with the lower baseline CBVt limit yielded single-exponential time constants of 2.68 ± 0.85 seconds and 4.93 ± 1.05 seconds and steady-state amplitudes of 0.19 ± 0.06 mL/100 g and 0.29 ± 0.06 mL/100 g, respectively. To examine region-dependent CBV responses, the intracortical ROI was divided into three cortical ROIs (Supplementary Figure S1); general temporal characteristics were consistent in all ROIs. When a higher baseline CBVt was used, the amplitude of ΔCBVt and ΔCBVv increased, and the time constant of ΔCBVv shortened. The time constant for ΔCBVv is about an order of magnitude longer than that for ΔCBVa (Table 1).
Characteristics of functional CBVa, CBVt, and CBVv responses
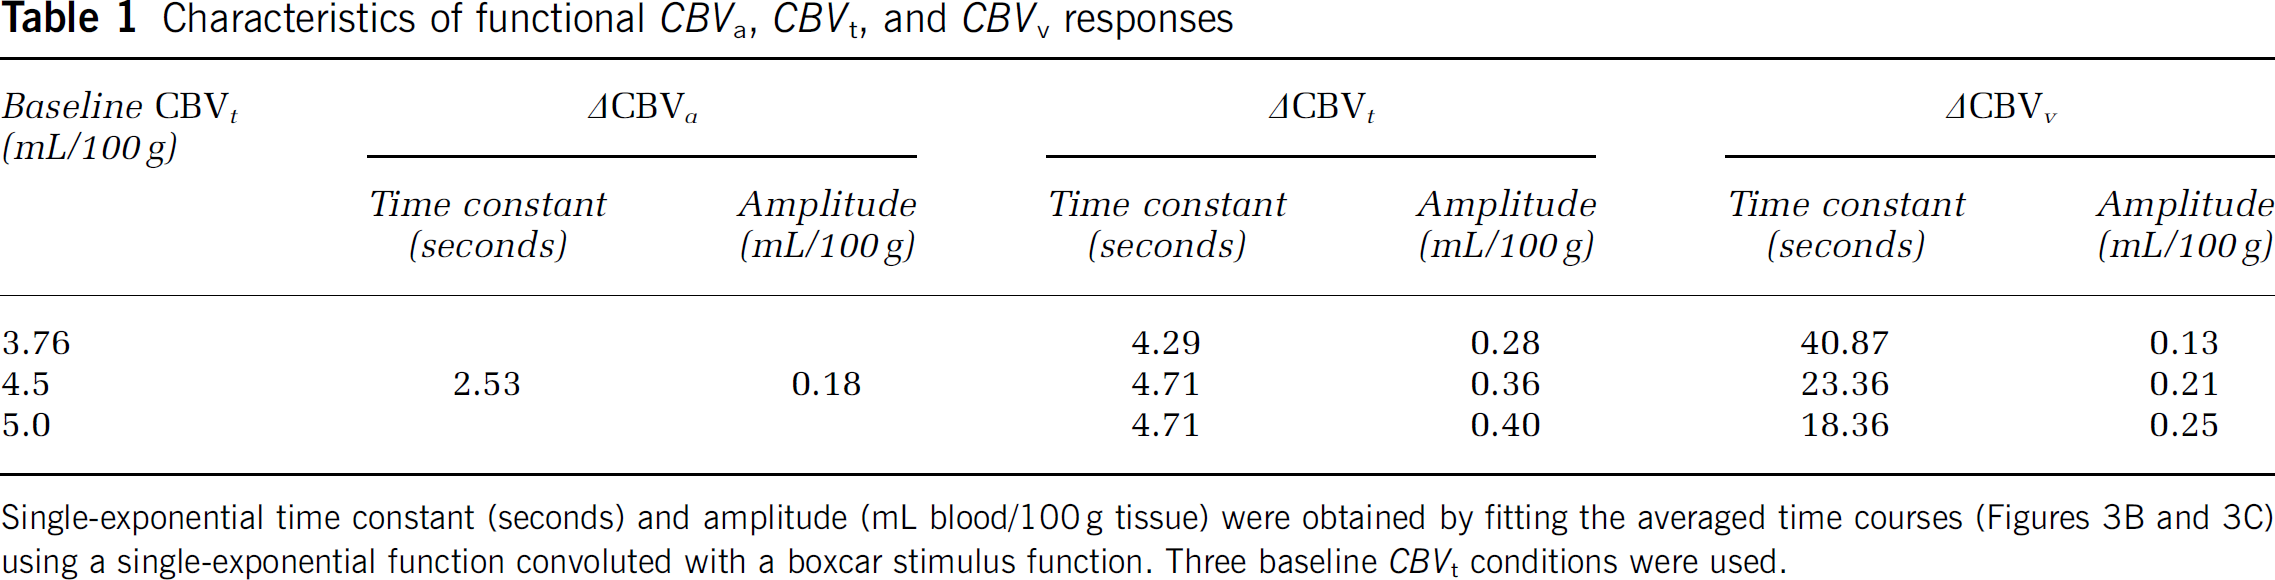
Single-exponential time constant (seconds) and amplitude (mL blood/100 g tissue) were obtained by fitting the averaged time courses (Figures 3B and 3C) using a single-exponential function convoluted with a boxcar stimulus function. Three baseline CBVt conditions were used.
To investigate the stimulus-duration-dependent contribution of ΔCBVv to ΔCBVt, the ratio of mean ΔCBVv to mean ΔCBVt was calculated for the three baseline CBVt conditions (Figure 4 for the intracortical ROI and Supplementary Figure S2 for the three cortical ROIs). As the peaks of ΔCBVa and ΔCBVt were assumed to be identical, and the time to reach 90% of the peak ΔCBVa was 6.42 ± 2.58 seconds, initial 5 seconds data were not included for the ΔCBVv/ΔCBVt calculations. Overall, the ratio of ΔCBVv/ΔCBVt increased with stimulus duration, indicating that ΔCBVv is significant during periods of long simulation.
Time-Dependent Spatial Specificity of Functional Cerebral Blood Volume Changes
To visualize the time-dependent fMRI maps, we divided the 40-second stimulation data into four equal time periods (Figure 5). During the initial 10-second period, ΔCBVa and relative CBVt change maps did not show a large volume change localized to layer 4, but during the later periods of stimulation, large changes did appear in this region (Figures 5A and 5B). This finding indicates delayed responses from small arterial vessels and presumably capillaries at the active site since the CBVt response propagates from large arterial vessels to capillaries, and agrees with previous observations of ΔCBVa (Kim and Kim, 2010) and relative CBVt change (Jin and Kim, 2008a). Unlike ΔCBVa and relative CBVt change maps, ΔCBVv was not localized to the middle cortical layer during the entire stimulation period (Figure 5C for the lower CBVt limit and Supplementary Figure S3A for CBVt = 5.0 mL/100 g). However, an individual subject's ΔCBVv map may not accurately reflect the spatial specificity and magnitude change due to the larger errors that result from pixel-wise subtraction (Figure 5C). Thus, group-averaged cortical depth profile analysis is necessary.
Cortical depth profiles were determined within the two black quadrangular ROIs shown in Figure 5A, and plotted as a function of depth from the cortical surface (Figure 6). The largest ΔCBVa and relative CBVt change during the 40-second stimulation period occurred in the middle cortical region (Figure 6A), which correlates with the hyperintensity band found in T1-weighted anatomical images (Figure 1). For examining time-dependent spatial specificity, we plotted cortical depth profiles of ΔCBVa (Figure 6B), ΔCBVt (Figure 6C), and ΔCBVv (Figure 6D). ΔCBVt and ΔCBVv profiles are shown for the lower limit value of baseline CBVt (Figures 6C and 6D) and for a baseline CBVt of 5 mL/100 g (Supplementary Figures S3B and S3C). Note that cortical profiles of ΔCBV during the poststimulus period were not plotted due to intersubject variations and insufficient signal-to-noise ratio. ΔCBVa and ΔCBVt profiles behaved similarly; both ΔCBVa and ΔCBVt were relatively large at the cortical surface during the initial 10-second period compared with later periods (blue lines). However, the greatest ΔCBVa and ΔCBVt responses for each time period occurred in the middle cortical region of later periods. In contrast, ΔCBVv profiles were very broad across the cortex in all periods of stimulation (Figure 6D; Supplementary Figure S3C), indicating that the CBVv change is not as specific as the CBVa response. Note that the large ΔCBVt and ΔCBVv of the upper cortical area may have been due to the contribution of an extending susceptibility effect from pial vessels.
Discussion
Spatial Distribution of Functional Magnetic Resonance Imaging Versus Myeloarchitecture
In both arterial and total CBV fMRI studies, the highest CBV change within the cat's visual cortex occurred in layer 4, which was anatomically identified by T1-weighted MRI (Figures 1 and 2). Similar studies using human and nonhuman primates also correlated the distinctive laminar myelination pattern of the cortex with fMRI results (Logothetis et al, 2002; Walters et al, 2003). This myeloarchitecture in the cortex has been identified in postmortem brain (Annese et al, 2004), and recently visualized by high-resolution MRI in vivo based on different imaging contrast, T1 (Barbier et al, 2002; Bock et al, 2009; Walters et al, 2003), T2 (Yoshiura et al, 2000), T2* (Logothetis et al, 2002), and proton density (Clark et al, 1992). In our studies, we used the T1 contrast to identify the myelinated stripe of Gennari within the cortex, confirming the location of activation sites.
Technical Concerns of Cerebral Blood Volume Measurements
For ΔCBVa quantification, we assumed that capillary water freely exchanges with tissue water; therefore, the venous contribution to MT-insensitive arterial blood measurement is negligible. Even if this assumption is not valid, the contribution of venous blood to ΔCBVa will be minimal due to the very short T*2 of venous blood at 9.4 T (Kim et al, 2008). We also assumed that the R*2 of arterial blood (R*2,artery) and tissue (R*2,tissue) are similar, and that arterial oxygenation does not change during stimulation (related to ΔR*2,artery). However, the intravascular R*2 of arterial blood has not been reported at 9.4 T, and a recent study showed a small increase in the oxygen saturation level in small pial arterial vessels during somatosensory stimulation in rats (Vazquez et al, 2010). Taking these two conditions into consideration, the intercept will be
In pixels containing CSF, both arterial blood and CSF are MT insensitive; thus, the interpretation of intercepts from ΔSss,MT/S0 versus Sss,MT/S0 fit is complex if the CSF volume fraction changes during stimulation. We found that CSF volume fraction decreases in cats during similar visual stimulation (Jin and Kim, 2010), resulting in negative responses in ΔCBVa maps (Kim and Kim, 2010). Thus, ΔCBVa values were only determined when intercepts were positive and ΔCBVv maps were consequently calculated from only those pixels (Figure 5C). When the intracortical ROI with 173 ± 54 pixels (see yellow area in inserted figure of Figure 3A) was considered, the number of negative pixels was 25 ± 10. These negative pixels were primarily found at the cortical surface, and thus ΔCBVa and ΔCBVv profiles near that region may have larger errors.
ΔCBVt and ΔCBVv were obtained within a range of baseline CBVt values. As CBVt of gray matter is 2 to 5 mL/100 g in the literature (Ibaraki et al, 2008; Kuppusamy et al, 1996; Sourbron et al, 2009), our upper limit of baseline CBVt was set to 5 mL/100 g. As ΔCBVa ≤ ΔCBVt at any time, the lower baseline limit for CBVt (3.76 ± 1.34 mL/100 g) was calculated by assuming that peak ΔCBVt = peak ΔCBVa. In fact, ΔCBVa is dominant during the 15-second stimulation (Kim et al, 2007) and arterial vessel dilation (but not venous dilation) was observed by optical imaging of intrinsic signals with a 20-second stimulation (Vazquez et al). When peak ΔCBVt matched with peak ΔCBVa for each ROI, the baseline CBVt was 4.04 ± 1.67, 3.70 ± 1.61, and 3.68 ± 1.66 mL/100 g for the upper, middle, and lower cortical ROI, respectively. The average ΔR*2,MION value, which is an index of baseline CBVt, was 41.70 ± 20.01, 35.55 ± 17.97, and 28.51 ± 15.88/s for upper, middle, and lower cortical ROI, respectively. Although large standard deviations are due to the different dose of injected MION between animals, baseline CBVt correlates well with ΔR*2,MION. Taken together, the assumption of peak ΔCBVt = peak ΔCBVa appears reasonable.
Dynamics of Functional CBVa and CBVv Responses
The dynamic characteristics of the CBVt response has been previously described in the literature as two components: an early rapid rise followed by a prolonged slower response (Mandeville et al, 1999; Silva et al, 2007). Yet, the origin of these two components remains unclear. Mandeville et al (1999) proposed that the rapid capillary response is followed by the late slow venous vessel dilation, which is referred to as the ‘Windkessel model‘. However, Silva et al (2007) assumed that, based on the gamma fit of the CBVt, the fast rise and fall response originates from arteries, while the slow and delayed response originates from capillaries. Our data imply that fast and slow CBV responses stem from an initial rapid arterial vasodilation followed by slow prolonged venous dilation. Increased venous volume is likely due to passive dilation of high compliance venous vessels, resulting from the increased pressure associated with arteriole vasodilation (Buxton et al, 1998; Mandeville et al, 1999). In our studies, capillary volume change cannot be separately determined, and will contribute to ΔCBVa and ΔCBVv. As capillary dilation is expected to be specific to neural active sites, and ΔCBVv is not specific, capillary dilation, if present, will contribute mostly to ΔCBVa.
As the functional CBVv response is an order of magnitude slower than CBVa change, the contribution of ΔCBVv to ΔCBVt is closely dependent on stimulus duration (Figure 4). A similar dynamic dilation of arterial versus venous vessels was also detected by two-photon microscopic measurements during somatosensory stimulation in awake mice (Patrick Drew, personal communication). Venous vessels dilate passively and slowly; thus, its response time constant is much longer than the expected time constant, which is a sum of the arterial response time and the arterial—venous transit time of 1 to 2 seconds. Under steady-state conditions, ΔCBVv is about half of ΔCBVt (see Table 1). When the stimulus duration is relatively short compared with the ΔCBVv time constant, the CBVa change is dominant. Temporal characteristics of arterial and venous CBV responses may vary under different cerebrovascular conditions (e.g., due to different anesthetics or baseline arterial CO2 level); thus, extrapolation of our data to different anesthetic conditions or awake humans requires a degree of caution. In our previous 15-second stimulation studies in isoflurane-anesthetized rats, we found that CBVa is dominant (Kim et al, 2007). Dilation of arterial, not venous vessels was observed using two-photon microscopic studies with 4 seconds somatosensory stimulation in α-chloralose-anesthetized rats (Hillman et al, 2007) and optical imaging of intrinsic signals with 20 seconds stimulation in isoflurane-anesthetized rats (Vazquez et al). Our finding may explain the substantial ΔCBVv increase with 96 to 240 seconds long visual stimulation in humans (Chen and Pike, 2009; Stefanovic and Pike, 2005), and venous dilation during the 120-second long direct electric stimulation in halothane-anesthetized rats (Akgoren and Lauritzen, 1999).
Spatial Specificity of Functional CBVa and CBVv Responses
To have high specificity of CBV responses to neural active sites, it is crucial to detect the dilation of microvessels, including capillaries. The CBVt response across the visual cortex localizes to the middle of the cortex, where the highest neural activity, as well as metabolic and cerebral blood flow (CBF) changes occur (Jin and Kim, 2008a; Zhao et al, 2006). However, as both fast ΔCBVa and slow ΔCBVv contribute to ΔCBVt, time-dependent spatial specificity of arterial and venous CBV responses can provide insights into further sources of functional CBV changes. During the initial 10 seconds of stimulation, both CBVa and CBVt responses are relatively large at the upper cortical area, indicating the dilation of intracortical feeding arterial macrovessels. Between 10 and 20 seconds after stimulation onset, CBVa and CBVt responses at the middle of the cortex increase, possibly due to further dilation of arterial microvessels. Our high specificity finding can be interpreted that increases of arterial microvessels dominate and improve spatial specificity for CBVt fMRI. Thus, the stimulus period of 10 to 20 seconds induces the dilation of arterial microvessels without significant contribution from venous vessels, resulting in spatially confined CBVt responses. A similar observation was found with optical imaging (Berwick et al, 2008); the CBV response was initially dominated by feeding arteries, and then highly localized to a central area of the activated cortical column, albeit at a much faster time scale, possibly due to different vascular structures in different activated areas (rat barrels versus cat visual cortex) and different neurovascular responses from different anesthesia conditions (urethane versus isoflurane).
Draining venules are connected to highly specific, actively controlled arterioles through capillaries. As passive pressure-driven dilation should start at venous microvessels, we expected ΔCBVv to be specific. The contribution of CSF and pial vessels can cause errors in ΔCBVa and ΔCBVv quantification for the upper cortical area, but not for the middle and lower cortical areas. The spatial specificity of ΔCBVv (see middle versus lower cortical area in Figure 6) is relatively poor compared with ΔCBVa and ΔCBVt. The localization of ΔCBVv may improve with a longer stimulus or more averaging, since 40 seconds duration may not be sufficiently long to reach to steady state and the noise of ΔCBVv is higher than that of ΔCBVa. The firm conclusion of spatial specificity may require a direct measurement of ΔCBVv. To explain the difference of spatial specificity between arterial and venous microvessel responses, determining the number and length of venous vessels drained from a single arteriole is also necessary.
Implication for Blood Oxygenation Level-Dependent Quantification
Relative (rather than absolute) CBVv change is important to determine the change in cerebral metabolic rate of oxygen consumption (CMRO2) from BOLD data. Conventionally, it is assumed that the relative CBVv (rCBVv) change is equal to the relative CBVt (rCBVt) change, which is determined from the measured relative CBF (rCBF) change using the Grubb's CBF—CBV relationship, rCBVt = rCBFα, where α is considered to be 0.38 (Grubb et al, 1974). To calibrate BOLD signals with physiological parameters, BOLD and CBF responses are measured during a hypercapnic challenge, assuming no CMRO2 change. A fundamental assumption of hypercapnic calibration is that hemodynamic changes during hypercapnia and neural stimulation are similar. In our studies, the venous CBV response is relatively slow and sensitive to stimulus duration. In long stimulation studies, typically implemented for a hypercapnic challenge (more than a few minutes (Davis et al, 1998; Hoge et al, 1999; Kim et al, 1999)), ΔCBVv is ~50% of ΔCBVt (see Table 1). In our laboratory's previous CBVa and CBVv measurements with 19F nuclear magnetic resonance (NMR) spectroscopy, ΔCBVv contributes ~36% to ΔCBVt with hypercapnia (Lee et al, 2001), which is similar to our current visual stimulation data. To convert ΔCBVv to the rCBVv change, baseline CBVv is required. In the following estimates, we assume that baseline CBVt of 3.76 mL/100 g consists of 25% to 40% CBVa and 75% to 60% CBVv (Kim et al, 2007; Lee et al, 2001). When ΔCBVv is 36% to 50% of ΔCBVt under steady-state conditions, rCBVv change is ~50% to 60% to ~70% to 80% of rCBVt change. For neural stimulation, stimulus duration is typically in the order of seconds to tens of seconds. In our 40-second visual stimulation studies, ΔCBVv is 31% of ΔCBVt, consequently rCBVv is ~40% to 50% of rCBVt. However, if the stimulation duration is <20 seconds, rCBVv is much smaller and could be even ignored. Thus, short stimulation simplifies the BOLD biophysical model, but a long neural stimulation would be better to match corresponding cerebrovascular responses with a long hypercapnic challenge for the calculation of CMRO2.
The BOLD signal is closely dependent on the alterations in venous oxygenation level (Y) and venous CBV (CBVv), and can be linearly approximated as
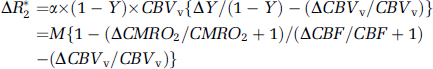
where ΔR*2 is the change in apparent transverse relaxation rate, M is α × (1 – Y) × CBVv (same as α* in Kim et al (1999)), and Δ indicates a change in physiological parameter; the parameter α is closely related to many biological and MR parameters, including vessel size, magnetic field, and pulse sequence. It is also noted that the term β* = 1 (Kim et al, 1999). To determine the effect of slow CBVv change to CMRO2 quantification, we calculated relative CMRO2 changes with three CBVv response conditions from the human visual cortex data reported in Kim et al (1999), which are ΔCBF/CBF and ΔR*2 of 47% and −0.45/s during 4 minutes hypercapnia, and 44% and −0.11/s during 1 minute visual stimulation, respectively. In all conditions, the rCBVt change can be calculated from DCBF/CBF using the Grubb's equation: (1) When it is assumed that the rCBVv change = the rCBVt change, which has been widely used in the fMRI community, the relative CMRO2 change is 17%. (2) If the rCBVv change is half of the rCBVt change in both hypercapnia and visual stimulation, then the relative CMRO2 change is 25%. (3) If the rCBVv change is half of the rCBVt change in hypercapnia and close to zero in visual stimulation, then the relative CMRO2 change is 36%. The ratio of relative CMRO2 to CBF change is 0.39, 0.57, and 0.82, depending on the different rCBF versus rCBVv conditions. The proper estimation of rCBVv changes is important to quantify relative CMRO2 and venous oxygenation level changes from BOLD signals.
Footnotes
Acknowledgements
The authors thank Dr Ping Wang for animal preparation and maintenance during the experiments. We thank Dr Patrick J Drew for helpful discussions and for sharing unpublished data.
The authors declare no conflict of interest.
References
Supplementary Material
Please find the following supplemental material available below.
For Open Access articles published under a Creative Commons License, all supplemental material carries the same license as the article it is associated with.
For non-Open Access articles published, all supplemental material carries a non-exclusive license, and permission requests for re-use of supplemental material or any part of supplemental material shall be sent directly to the copyright owner as specified in the copyright notice associated with the article.