
Abstract
The Bookend technique is a magnetic resonance imaging (MRI) dynamic susceptibility contrast method that provides reliable quantitative measurement of cerebral blood flow (CBF) and cerebral blood volume (CBV). The quantification is patient specific, is derived from a steady-state measurement of CBV, and is obtained from T1 changes in the white matter and the blood pool after contrast agent injection. In the current implementation, the Bookend technique consists of three scanning steps requiring a cumulative scan time of 3minutes 47seconds, a well-trained technologist, and extra time for offline image reconstruction. We present an automation and acceleration of the multiscan Bookend protocol through a self-calibrating pulse sequence, namely Self-Calibrated Epi Perfusion-Weighted Imaging (SCALE-PWI). The SCALE-PWI is a single-shot echo-planar imaging pulse sequence with three modules and a total scan time of under 2minutes. It provides the possibility of performing online, quantitative perfusion image reconstruction, which reduces the latency to obtain quantitative maps. A validation study in healthy volunteers (N = 19) showed excellent agreement between SCALE-PWI and the conventional Bookend protocol (P > 0.05 with Student's t-test, r = 0.95/slope = 0.98 for quantitative CBF, and r = 0.91/slope = 0.94 for quantitative CBV). A single MRI pulse sequence for absolute quantification of cerebral perfusion has been developed.
Keywords
Introduction
Cerebral perfusion is a fundamental physiologic parameter that reflects the severity and progression of pathologic disorders, including central nervous system tumors, stroke, cerebrovascular occlusive disease, and Alzheimer's disease (Cha, 2004; Derdeyn et al, 2002; Sunshine et al, 1999; Tippett and Black, 2008). The current ‘State of the Art’ for quantifying cerebral perfusion is achieved by [15O]-H2O positron emission tomography (PET) (Heiss et al, 1998). However, owing to the limited availability of PET cyclotrons for the production of radiolabeled H2O required for PET perfusion images, PET is not as widely available and accessible as magnetic resonance imaging (MRI) scanners, both in clinical and in research uses.
The American Heart Association has identified the development of quantitative MR-based perfusion (i.e., in mL/100g per min) as a priority for treatment of acute stroke (Latchaw et al, 2003). Dynamic susceptibility contrast (DSC)-MRI methods using an extraneous paramagnetic contrast agent are widely used to produce images of cerebral blood flow (CBF), cerebral blood volume (CBV), and mean transit time. However, absolute quantification of cerebral perfusion using DSC-MRI methods has been elusive and challenging (Calamante, 2005; Kiselev, 2005; Takasawa et al, 2008; van Osch et al, 2001). Various approaches have been proposed to find the rescaling factor for relative CBF (rCBF) and relative CBV (rCBV) for the quantification of cerebral perfusion. Rescaling of the CBF value using a population-averaged value of CBF in normal white matter (WM) (22mL/100g per min) has been performed previously (Leenders et al, 1990; Ostergaard et al, 1996a). However, it is well known that cerebral perfusion varies with age, gender, and physiologic condition. Therefore, the patient-specific correction factor for quantitative DSC-MRI is favored over the population-averaged correction factor method, as shown in the previous work (Mukherjee et al, 2003). Although venous efflux measurement (Lin et al, 2001; van Osch et al, 2001) has been used to determine patient-specific scaling factors, partial volume averaging for venous efflux measurement and nonlinearity between MR signal and the high concentration of the contrast should be considered for accurate quantification. In addition, inaccuracies in CBF measurements also arise in DSC-MRI because of errors in the measurement of the arterial input function (AIF) (Lin et al, 2001; van Osch et al, 2001). Therefore, an AIF-independent steady-state measurement of CBV (Kuppusamy et al, 1996) in each subject, to correct DSC-based measurements of CBV and CBF, alleviates the effects of partial volume averaging and signal saturation of the AIF signal on computed perfusion values.
A quantitative DSC-MRI technique, the multiscan Bookend technique, has been reported previously (Sakaie et al, 2005; Shin et al, 2006). This technique provides quantitative perfusion measurement with patient-specific calibration through an AIF-independent steady-state measurement of CBV, obtained from T1 changes in the WM and the blood pool after contrast agent injection. The conventional implementation of the Bookend technique consists of a set of three MRI scans performed sequentially, requiring a cumulative scan time of 3minutes 47seconds. Two segmented inversion recovery (IR) Look—Locker (LL) echo-planar imaging (EPI) scans are acquired one before and one after a single-shot gradient echo (GRE) EPI DSC scan with contrast agent injection, for T1 mapping of a single calibration slice. In large patient studies (n = 128), the Bookend technique has been shown to provide reliable (Sakaie et al, 2005; Shin et al, 2006) and reproducible (Shin et al, 2007) quantitative CBF (qCBF) and quantitative CBV (qCBV) measurements, using a fully automatic offline image reconstruction algorithm (Carroll et al, 2003; Shin et al, 2007). Perfusion MRI using the Bookend technique has also been shown to be accurate in comparison with gold-standard PET in patients with confirmed Moyamoya disease (Lee et al, 2009). However, special technologist training is required to perform the different Bookend scanning steps adequately, and additional offline postprocessing time is necessary for obtaining the absolute quantitative perfusion images. Simplified scan protocol and automatic, online image postprocessing are greatly required to enable not only a broader dissemination of this technology but also its utilization in emergency settings, such as acute stroke, to obtain immediate and accurate diagnosis.
In this study, we present a new MRI pulse sequence for quantitative cerebral perfusion imaging: Self-Calibrated Epi Perfusion-Weighted Imaging (SCALE-PWI) implementing the Bookend technique, while eliminating the multiple steps in the Bookend scan process. The structure of the SCALE-PWI sequence was best achieved by having a single-shot EPI acquisition over all three modules (two IR LL EPI modules and one GRE EPI DSC module), requiring a total scan time of < 2minutes. The calibration modules were accelerated, because the segmented IR LL EPI sequence of the conventional Bookend protocol was replaced by a single-shot IR LL EPI module in SCALE-PWI with parallel imaging (generalized autocalibrating partially parallel acquisitions (GRAPPA)). The DSC module of SCALE-PWI was also accelerated in comparison with the DSC scan of the conventional Bookend protocol, owing to GRAPPA. This provides the advantage of improving image quality in clinical settings, because a single scan is less prone to motion artifacts than several consecutive scans. Furthermore, SCALE-PWI offers the ability of performing online, quantitative perfusion image reconstruction, which reduces the latency between a Bookend scan and obtaining quantitative perfusion maps. The goal of our study was to validate SCALE-PWI quantitative cerebral perfusion measurements in vivo, in healthy volunteers, against multiscan Bookend measurements, which apply segmented IR LL EPI for T1 mapping, as a reference standard. The validation of the segmented IR LL EPI sequence against the gold-standard IR-GRE sequence for T1 quantification in the range of interest is presented in this study to justify the use of this sequence as a reference.
Materials and methods
This investigation is fully HIPAA (Health Insurance Portability and Accountability Act) compliant and was approved by the Institutional Review Board.
Theory
The conventional multiscan Bookend technique requires the combination of three consecutive image series to produce quantitative perfusion measurements with patient-specific calibration by an AIF-independent steady-state measurement of CBV. Two segmented, multiphase IR LL EPI scans are required, one before and one after the DSC GRE EPI perfusion-weighted scan, to obtain estimates of T1 in a single slice containing normal WM, before and after contrast agent injection. The Bookend technique (Sakaie et al, 2005; Shin et al, 2006) quantifies CBV based on changes in the estimated T1 in normal WM in relation to changes in the blood pool (Kuppusamy et al, 1996; Moseley et al, 1992). This approach relies on careful modeling of the effects of intravascular to extravascular water exchange (Shin et al, 2006), which is a well-known confounding effect in determining CBV from pregadolinium and postgadolinium T1 changes (Kim et al, 2002). To quantify blood volume in the WM, first, the steady-state cerebral blood volume in the WM, CBVssWM, is calculated from T1 changes in the WM and the blood pool, under the fast exchange approximation, as (Shin et al, 2006):
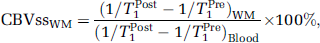
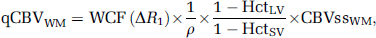
where qCBVWM is the qCBV value in the WM, WCF (Δ R1) the water correction factor determined from the change in 1/T1 of blood after contrast injection, ΔR1, according to equation (3) which is appropriate at 1.5 T (Carroll et al, 2008), ρ the average density of a brain voxel (1.04 g/mL), and HctLV and HctSV the hematocrit levels in large and small vessels, respectively.

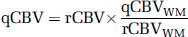
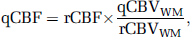
For the DSC-MRI analysis, rCBF is computed by deconvolving individual tissue concentration—time curves by the AIF using singular value decomposition (Ostergaard et al, 1996b), and rCBV is computed from the ratio of the area under the curve of a tissue concentration—time curve to the area under the curve of the AIF, according to Sakaie et al (2005). The final perfusion quantification in a brain voxel is calculated as:
Self-Calibrated Epi Perfusion-Weighted Imaging Sequence Development
We report on the new SCALE-PWI pulse sequence, which produces an absolute scale for the quantification of cerebral perfusion, based on the conventional, multiscan Bookend technique (Sakaie et al, 2005; Shin et al, 2006). The sequence was designed around a single-shot GRE EPI sequence with three separate modules, as shown schematically in Figure 1A: two single-shot IR LL EPI modules before and after a single-shot GRE EPI DSC module, requiring a total scan time of < 2 minutes. The IR LL EPI modules—the ‘calibration modules’—each consist of an IR pulse, followed by a multiphase readout from a single two-dimensional slice of the stack being imaged, specified by the user in the protocol (Figure 1B). This slice is best chosen at a location where the WM tissue is predominant. The segmented IR LL EPI sequence of the conventional Bookend protocol is replaced by a single-shot IR LL EPI module in SCALE-PWI. This reduces scan time by eliminating the acquisition of multiple k-space segments, and by acquiring fewer samples of the T1 relaxation curve while ensuring same time coverage. Parallel imaging (GRAPPA) is used for keeping the echo time (TE) and repetition time (TR) as short as possible, to minimize the T2* decay effects and to ensure adequate sampling of the T1 relaxation curve. As with the original Bookend scan protocol, readout measures T1-mediated regrowth at the TE interval of the sequence. A fat saturation pulse is applied before each EPI block, as shown in Figure 1B, to ensure signal suppression from fat during readout. The calibration modules of SCALE-PWI (Figure 1B) have their own effective TR (TREffective), equal to the TR specified in the imaging protocol divided by the total number of slices being imaged. The TREffective constitutes the time interval separating two consecutive samples of the T1 relaxation curve. A single flip angle (a) is allowed for the entire sequence, and is kept small enough to satisfy the conditions of a LL experiment, while ensuring sufficient signal-to-noise ratio in the acquired single-shot GRE EPI images. Contrast injection occurs during the second module of the SCALE-PWI pulse sequence, whereby a series of dynamic perfusion-weighted images are acquired. An adjustable delay is available between consecutive modules of SCALE-PWI (Figure 1A).
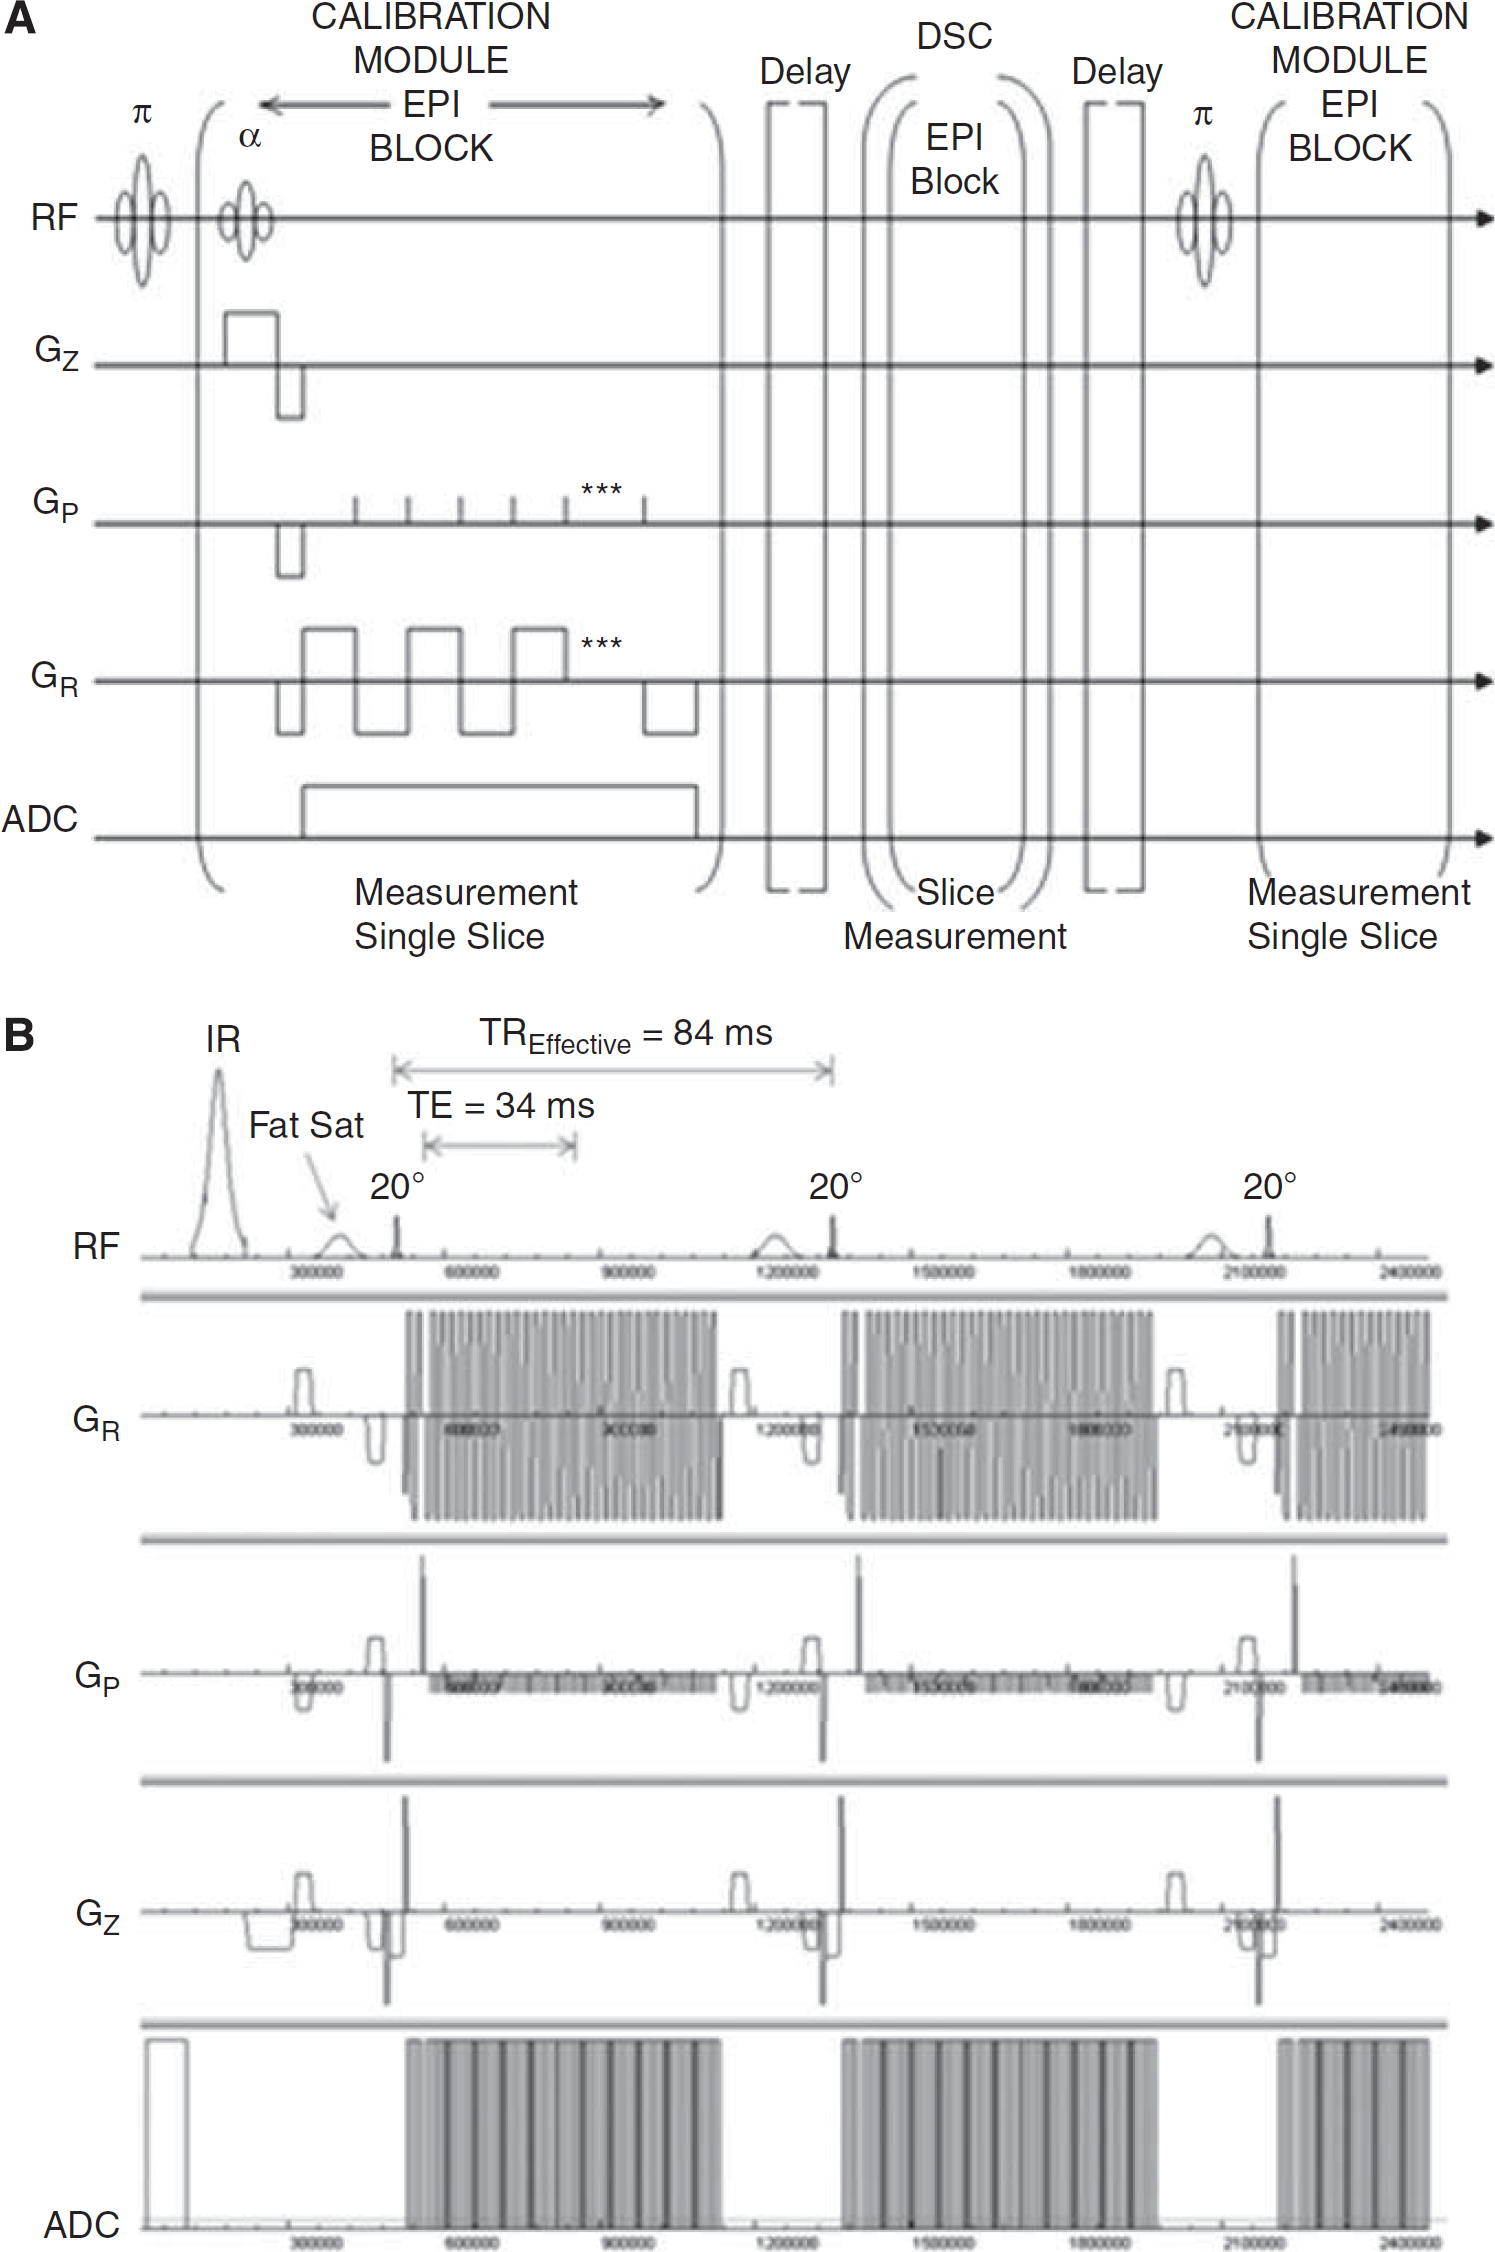
Timing diagram of the SCALE-PWI sequence. (
In Vitro Validation of Segmented Inversion Recovery Look—Locker Echo-Planar Imaging T1 Measurements
We validated the T1 values obtained using the segmented IR LL EPI sequence with the imaging parameters used in this study at 1.5 T, against those obtained using gold-standard IR-GRE with inversion times 30, 100, 200, 500, 1,000, 2,000, 4,000 milliseconds, in 37 solutions of Gd-DTPA and MnCl2 that mimic T1 and T2* effects. Concentrations of gadopentetate dimeglumine (Gd-DTPA) ranged between 0.025 and 1.0 mmol/L, and MnCl2 concentrations ranged between 0.02 and 0.8 mmol/L.
Validation of Self-Calibrated Epi Perfusion-Weighted Imaging in Healthy Volunteers
A total of 19 consecutive healthy subjects (male = 12, female = 7, age = 30 ± 6 years) were scanned on a 1.5-T MR scanner (MAGNETOM Espree, Siemens AG Healthcare Sector, Erlangen, Germany), with a 12-channel receive-only head coil. Subjects were asked to abstain from caffeine for 24hours before each scan, to minimize physiologic fluctuations caused by caffeine intake. Written informed consent was obtained from each subject before being scanned in accordance with the Internal Review Board at our institution.
Magnetic Resonance Imaging Protocols
The purpose of this study was to compare the perfusion measurements obtained with SCALE-PWI with those obtained with the conventional, multiscan Bookend protocol, which served as a reference measurement. Two reference, segmented IR LL EPI T1 mapping scans were acquired, one before and one after the SCALE-PWI scan, with the following imaging parameters: single two-dimensional slice colocalized to the ‘calibration’ slice of the GRE EPI DSC module of SCALE-PWI, TR/TE = 21/9.9 msec, matrix size = 128 × 128, field of view = 220 mm × 220 mm, flip angle = 20°, 15 lines of k-space per acquisition, slice thickness = 5 mm, time points = 120, and scan time = 1 minute. The DSC module of SCALE-PWI was used to compute both conventional Bookend (using the segmented IR LL EPI scans for calibration) and SCALE-PWI measurements, because the first contrast agent injection was required in both cases. The SCALE-PWI scan parameters were: TR/TE = 1,090/34 msec, matrix size = 128 × 128, field of view = 220 mm × 220 mm, flip angle α = 20°, slice thickness = 5 mm, GRAPPA with acceleration factor = 2, 13-slice coverage with a total of 50 measurements. This resulted in a TREffective of 84 milliseconds for the first and third modules, whereby 35 images following the inversion pulse were acquired for T1 estimation in the ‘calibration’ slice. The influence of delay time was studied by comparing scans with delay times of 0 and 20 seconds. There were two sets of subjects: subjects of the first set (N = 11) were scanned with a zero delay time between the different modules of the SCALE-PWI sequence, resulting in a scan time of 1 minute 7 seconds, whereas subjects of the second set (N = 8) were scanned with a delay of 20 seconds between consecutive modules of SCALE-PWI, resulting in a scan time of 1 minute 47 seconds. In both cases, the total scan time of SCALE-PWI was under 2 minutes. A single dose (0.1 mmol/kg body weight) of Gd-DTPA contrast agent (Magnevist, Berlex, Montville, NJ, USA) was injected during the DSC module of SCALE-PWI, followed by a 15 mL saline flush, at a rate of 4 mL/sec. Thus, the amount of contrast injected varied from one subject to another (11 to 20 mL), with a bolus width ranging between 2.75 and 5 seconds.
Image Postprocessing
The multiscan Bookend images were processed using a home-built, fully automatic image reconstruction program (Carroll et al, 2003; Shin et al, 2007) in MATLAB V7.2 (The MathWorks Inc., Natick, MA, USA), implementing the Bookend technique (see equations (1) to (5)). The SCALE-PWI images were processed similar to the conventional Bookend images. In both cases, singular value decomposition deconvolution was performed with a noise reduction threshold to mitigate the effect of noise on the estimated CBF values. A single global threshold of 0.2 was applied to every voxel in the brain (Hill et al, 2002; Sunshine et al, 2001).
The water-exchange rates are considered fast enough to result in a single compartment for T1 quantification (Hazlewood et al, 1974). Therefore, the T1 decay is mono-exponential in the fast water-exchange limit (Donahue et al, 1996), and follows:
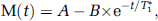
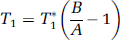
This is illustrated in Figure 2, which shows a mono-exponential T1 relaxation fit in a typical WM region of interest (ROI).
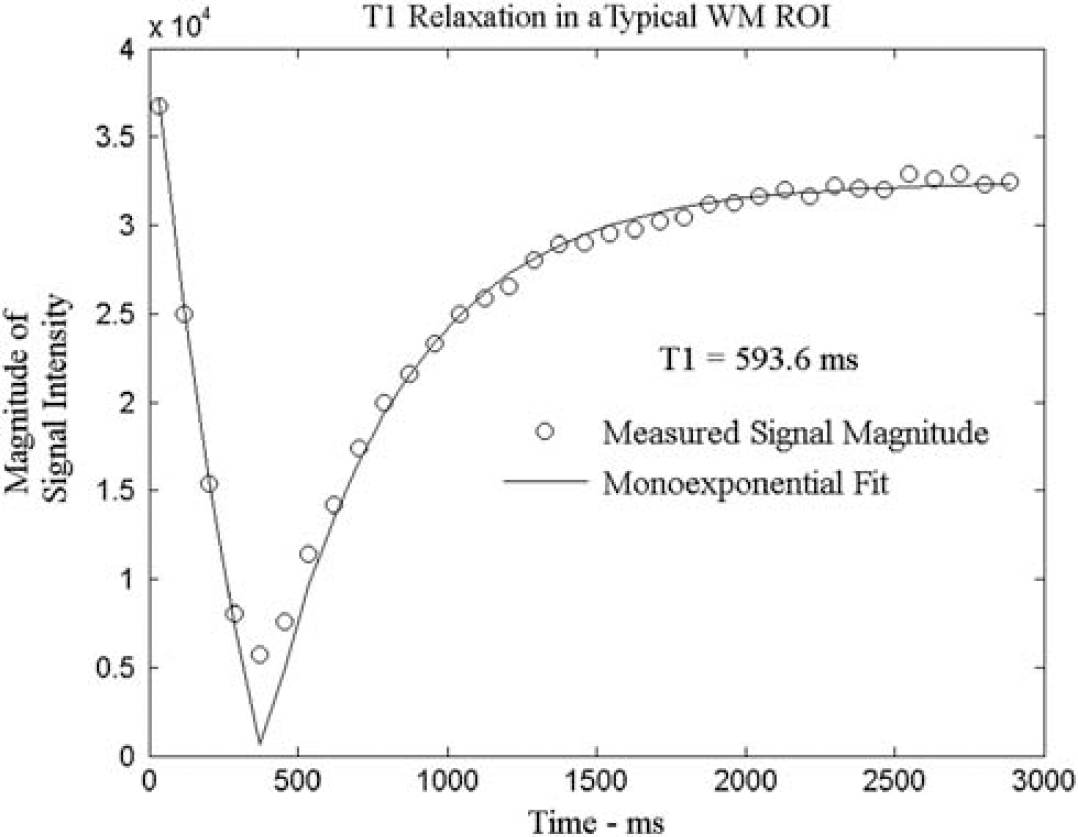
T1 relaxation and its corresponding mono-exponential fit in a typical white matter (WM) region of interest (ROI). T1 was measured to be 593.6 milliseconds.
The TREffective of SCALE-PWI (84 milliseconds) is longer than the TR of the segmented IR LL EPI sequence (21 milliseconds) of the conventional Bookend scanning protocol. In particular, Donahue et al (1996) have shown that water-exchange dependence increases as TR increases. In this study, TR dependence affected the accuracy of T1 measurements. The scaling applied to the relative perfusion values to obtain absolute, quantitative values, depended on two major terms: the value of CBVssWM given by equation (1), and WCF given by equation (3) for the conventional Bookend technique. Both terms depended on the measured T1 values. An alternative method to modifying the imaging protocol for making the T1 values accurate, so that the product of these two terms would be identical on a patient-by-patient basis, was to derive a new WCF parameterization for SCALE-PWI, by fitting the obtained CBVss values versus the ΔR1 values according to the water-exchange model of Hazlewood et al (1974) (Figure 3). This was previously carried out by Shin et al (2006) who performed Monte Carlo simulations of various exchange rates with validation in 125 patients, to derive the current parameterization (see equation (3)). The predicted signal behavior was matched as a function of ΔR1. All three parameters of the quadratic water-exchange model were fitted in Figure 3. The new WCF model is given by:

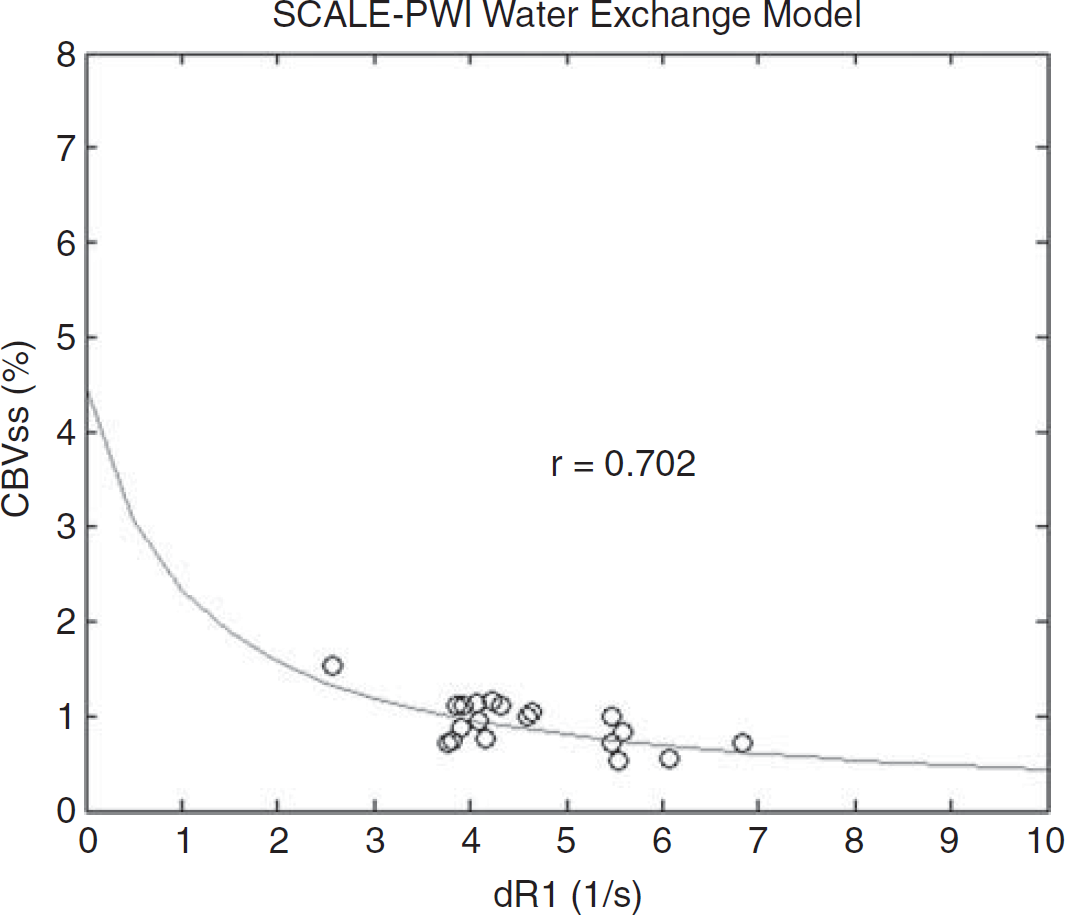
In vivo steady-state cerebral blood volume (CBVss) values in white matter (WM) regions of interest (ROIs) versus change in T1 relaxation rate of blood (ΔR1) for 19 healthy volunteers in the fast-water-exchange limit. The fitted curve was calculated using the Levenberg—Marquardt least-squares curve fitting algorithm in MATLAB V7.2, and the correlation coefficient (r) is given. SCALE-PWI, Self-Calibrated Epi Perfusion-Weighted Imaging.
In fact, these are not simple quadratic parameters of ΔR1, but constitute a complex biophysical model that includes effects caused by water exchange (slow versus fast), CBV, compartmentalization, flip angle, and TR, among others (Donahue et al, 1996; Hazlewood et al, 1974).
The new model (see equation (8)) seems to be highly statistically significant. The correlation value is r = 0.702 with P-value = 0.001, indicating a strong agreement between the statistical model and the experimental CBVssWM values of all volunteers. The χ2 goodness-of-fit test has a P-value > 0.995, indicating that the model is an excellent fit to the data, at the 5% significance level.
No empirical scaling of the WM to ‘normal’ flow was required. Both CBVssWM and WCF were used to calibrate the rCBF and rCBV values in both reference (segmented IR LL EPI) and SCALE-PWI (single-shot IR LL EPI) cases. In this respect, equations (4) and (5) were used to compute the absolute qCBV and qCBF values, for both conventional Bookend (reference) and SCALE-PWI scans.
Data Analysis
The rCBF and rCBV values were measured in WM and gray matter (GM) ROIs to report on the effect size provided by the correction applied in this study for obtaining quantitative perfusion measurements.
A qualitative paired comparison of SCALE-PWI and reference qCBF and qCBV measurements was performed, and a similar quantitative comparison was obtained using Student's t-test in WM and GM ROIs separately. White matter ROIs were automatically segmented using our reconstruction software, and GM ROIs were drawn manually over the putamen areas. Owing to the nature of the sequence, SCALE-PWI and conventional Bookend-calibrated images were identically registered; therefore, no explicit image coregistration was required. To assess the agreement between the two measurements graphically, whole-brain correlational analyses were performed for qCBF and qCBV values: slope, intercept, and r- and P-values were determined. A Bland—Altman test was performed to elucidate any trends in the data. We defined statistical significance at the 5% level.
The entire analysis described in the previous paragraph was performed on all 19 subjects combined. To show the validity of the assumption that the two different delay times of SCALE-PWI resulted in equivalent results, Student's t-test was used to calculate and compare the statistical significance of their results separately.
Results
Validation of the Segmented Inversion Recovery Look—Locker Echo-Planar Imaging Measurements
The measured T1 values of the Gd-DTPA and MnCl2 solutions were in the range 90 to 1,600 milliseconds, which includes T1 values of the WM, GM, and blood, both before and after contrast injection. We found a strong correlation (r = 0.9987, slope = 0.959, P < 0.001) in T1 measurement between the segmented IR LL EPI sequence and the IR-GRE sequence for all 37 solutions.
Validation of Self-Calibrated Epi Perfusion-Weighted Imaging Perfusion Measurements
All 19 imaging experiments were successful, and we reported no adverse reactions to the administration of the contrast agent.
Qualitative Analysis: Figure 4 shows a representative paired comparison between qCBF images acquired with SCALE-PWI and the reference (conventional) Bookend protocol, for a slice chosen to show both the WM and the GM. The images have similar appearance, which indicates good agreement between SCALE-PWI images and those obtained using the reference Bookend protocol. In the representative brain slices shown in Figure 4, mean qCBF in the WM was measured by SCALE-PWI and reference Bookend to be 23.4 ± 7.3 mL/100g per min and 21.4 ± 7.0 mL/100g per min, respectively. In the same slice, mean qCBF in the GM was measured to be 76.8 ± 12.8 mL/100g per min and 69.9 ± 11.7 mL/100g per min, respectively. A tendency toward a slight overestimation of the true perfusion values by SCALE-PWI was observed in these representative images and in other similar images obtained for the healthy volunteers, but quantitative analysis showed that this difference was not statistically significant.
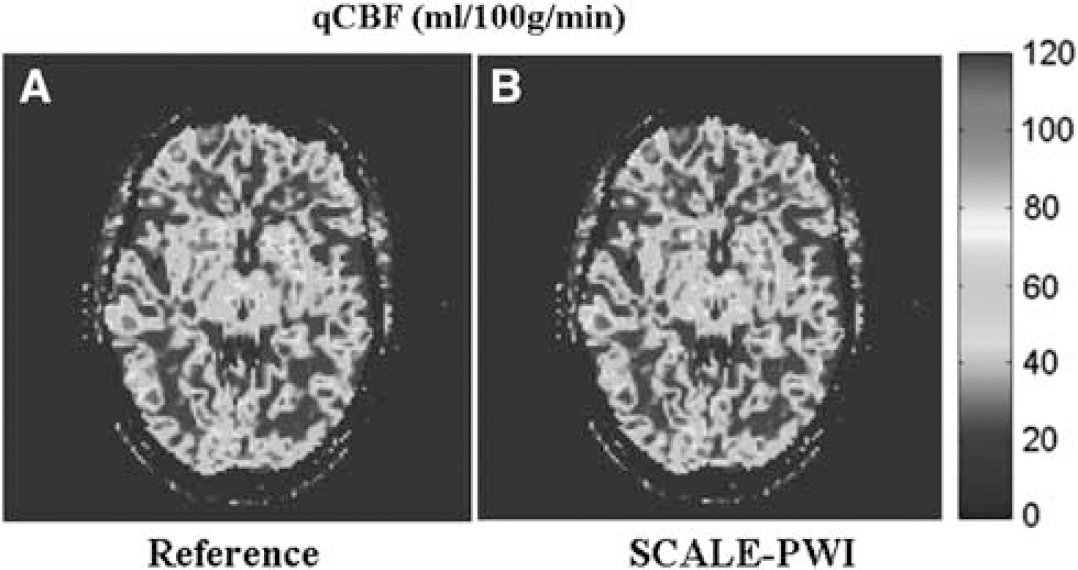
Quantitative cerebral perfusion images. Representative quantitative cerebral blood flow (qCBF) (in mL/100g per min) images for a brain slice obtained with the (
Quantitative Analysis: There is a correction of the rCBV and rCBF values by a factor of 7, meaning that the qCBF and qCBV values obtained with the reference protocol and SCALE-PWI are 7 times smaller than their corresponding relative measurements. What determine the accuracy of the quantification of perfusion values are the IR LL EPI module of SCALE-PWI and the segmented IR LL EPI sequence of the conventional Bookend protocol.
The mean values of qCBF (in mL/100g per min) and qCBV (in mL/100g) for the WM and GM are reported in Table 1, for SCALE-PWI and reference Bookend. Using Student's t-test, and P- and r-values for qCBF and qCBV were also computed and are reported in Table 1, for both the WM and the GM. We found no significant difference in the mean values for qCBF and qCBV measured in the WM and GM, and therefore, an excellent agreement was depicted between SCALE-PWI and reference Bookend perfusion values. In general, correlation values between SCALE-PWI and the reference Bookend measurements were higher in WM than in GM ROIs, for both qCBF and qCBV.
Comparison of quantitative cerebral blood flow (qCBF) and quantitative cerebral blood volume (qCBV) values obtained with SCALE-PWI and reference protocol, in white matter (WM) and gray matter (GM) tissues
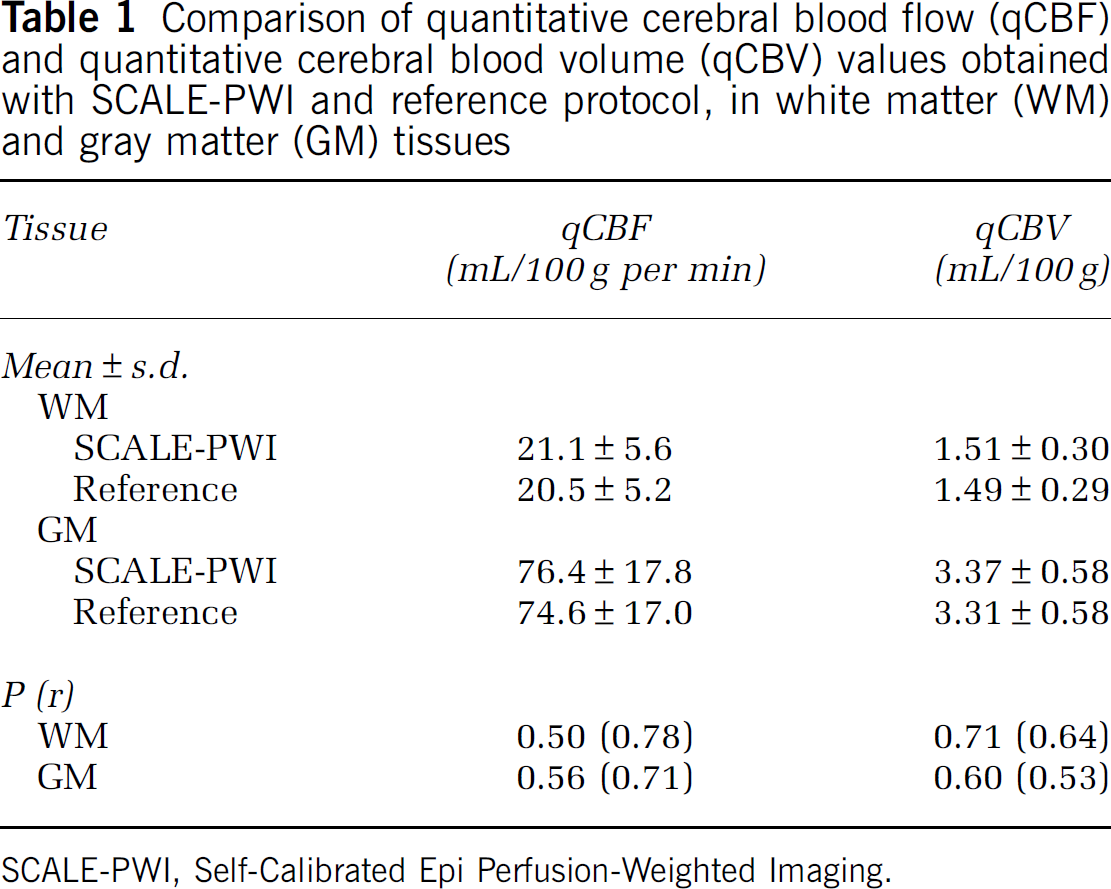
SCALE-PWI, Self-Calibrated Epi Perfusion-Weighted Imaging.
Using Student's t-test, the mean qCBF values analyzed separately for the two different delay times applied in the SCALE-PWI scans showed, individually, a nonstatistically significant difference between SCALE-PWI and reference Bookend. P-values of qCBF for WM ROIs were 0.28 and 0.77, for the zero-delay and the 20-second-delay scans, respectively. For GM ROIs, P-values of qCBF were 0.47 and 0.98, respectively. This justifies combining the results of the two different delay times in this study.
Figures 5A and 5B show whole-brain correlational analysis plots, and Figures 5C and 5D show Bland—Altman analysis plots with bias and s.d. lines (dashed lines) for qCBF and qCBV separately. Values of slope, intercept, and r- and P-values of the correlational plots, as well as bias and s.d. of the Bland—Altman analysis plots are reported in Table 2. A high correlation is depicted in both cases, and the Bland—Altman analysis confirms the good agreement between SCALE-PWI and reference Bookend values, for both qCBF and qCBV, because of the absence of any systematic trends in the plots. The percentage variation observed in the qCBF values of the WM and GM tissues (Figures 5A and 5C)) attributed to the choice of the singular value decomposition parameters were very similar (not > 20%), and in only 2 out of the 19 cases, the amount of variation in GM qCBF was much larger (4 to 6 times) than that in WM qCBF values.
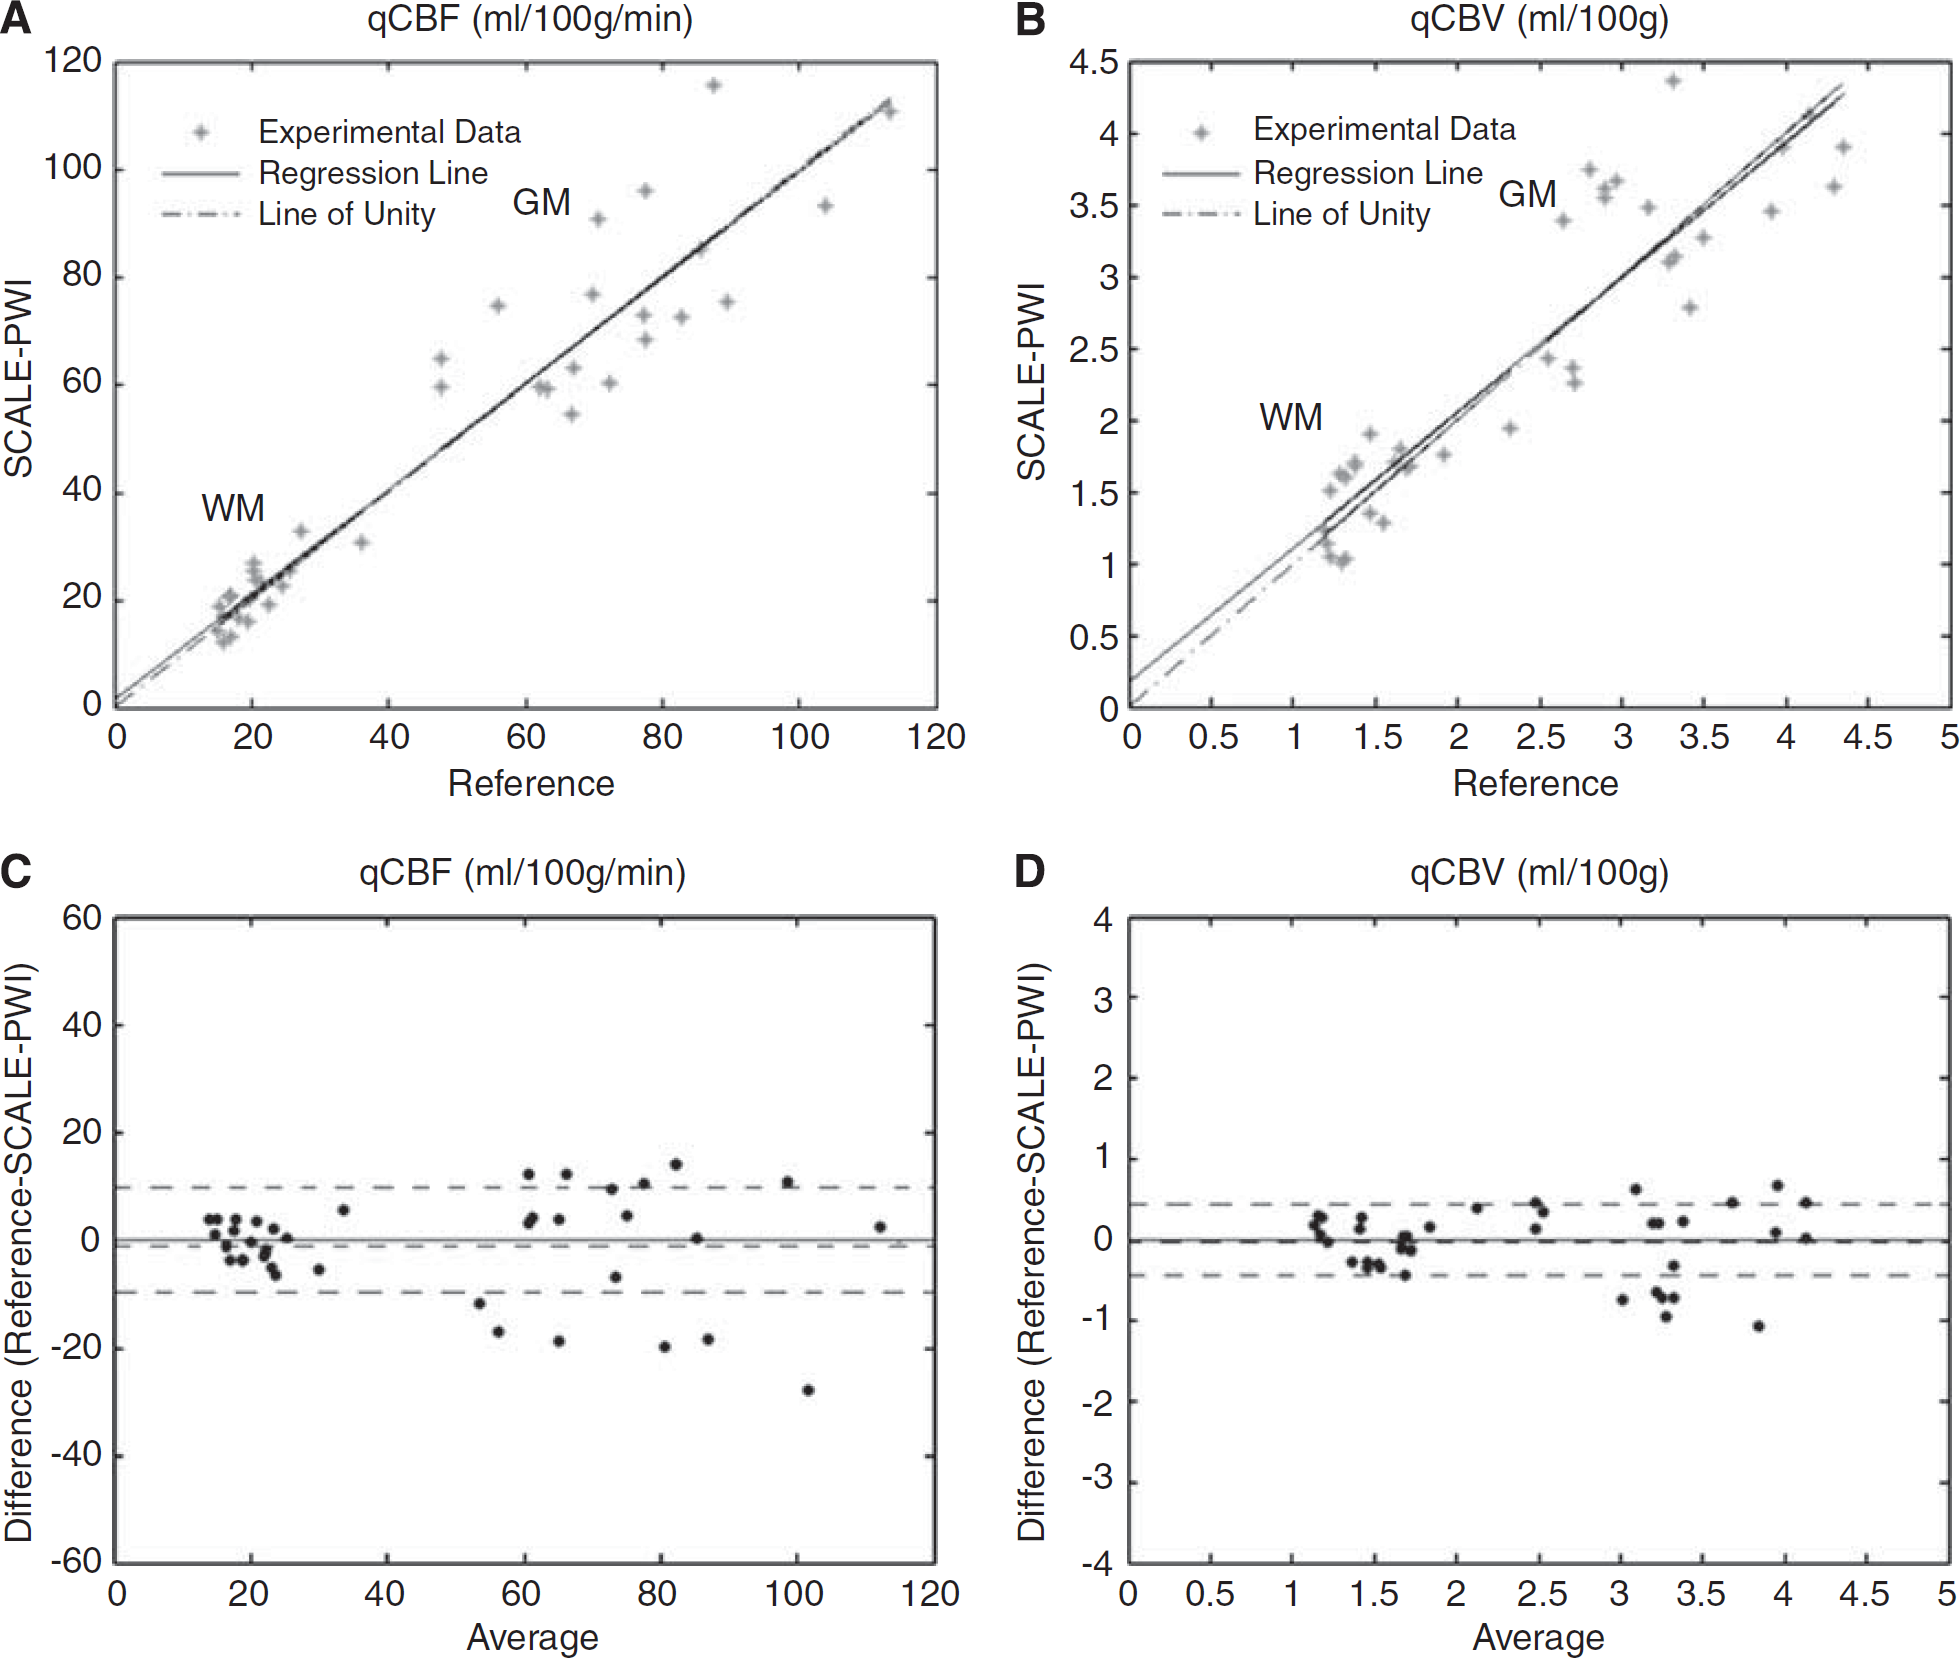
Comparison of SCALE-PWI and reference scans. (
Correlation and Bland—Altman analyses of quantitative cerebral blood flow (qCBF) and quantitative cerebral blood volume (qCBV) values obtained with SCALE-PWI and reference protocol
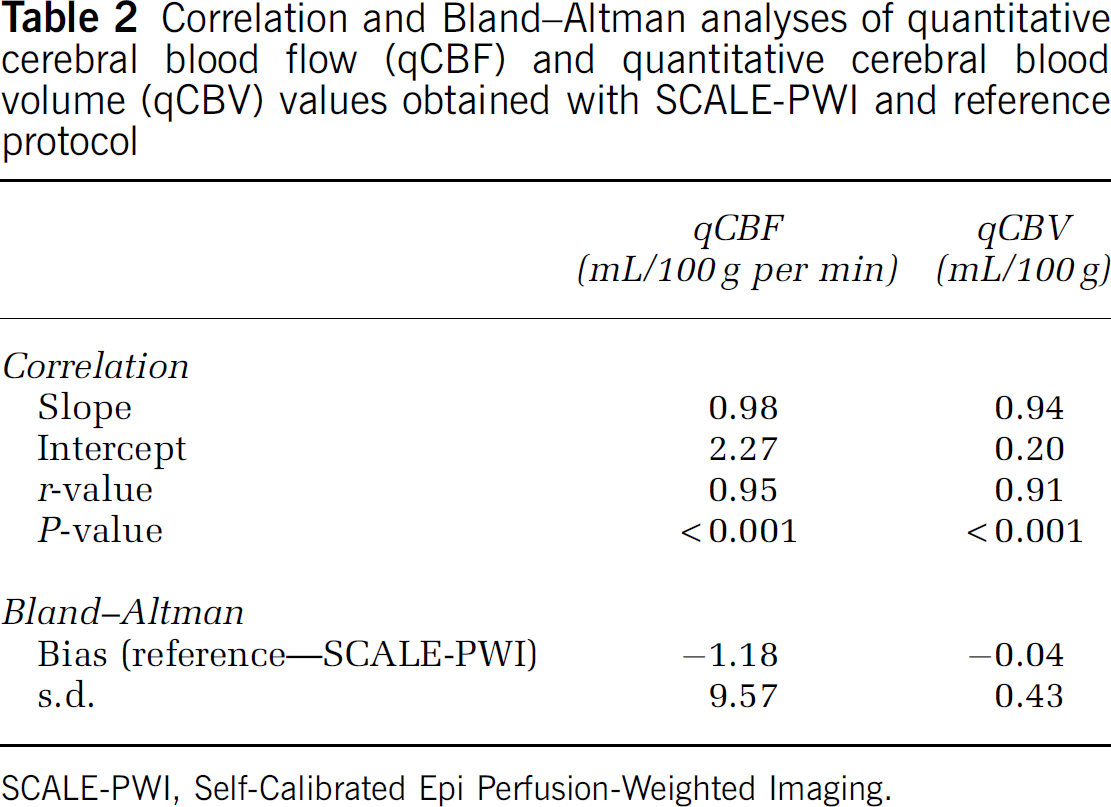
SCALE-PWI, Self-Calibrated Epi Perfusion-Weighted Imaging.
Discussion
We report, for the first time, on a single-scan DSC-MRI sequence for absolute quantification of cerebral perfusion. We measured qCBF and qCBV in the WM and GM (Table 1) and found that SCALE-PWI produced statistically comparable values of cerebral perfusion with the more established multiscan Bookend technique, which has been validated with gold-standard [15O]-H2O PET perfusion measurements (Lee et al, 2009). Correlational and Bland—Altman analysis plots (Figure 5) confirmed the excellent agreement between SCALE-PWI and reference Bookend perfusion values.
The mean values of qCBF and qCBV for the WM and GM obtained by SCALE-PWI were in agreement with previously reported values of cerebral perfusion using radiolabeled PET imaging. Frackowiak et al (1980) measured mean PET qCBF for the WM and GM to be 21.67 ± 2.36 mL/100g per min and 78.44 ± 18.88 mL/100g per min, respectively, in a total of 7 healthy volunteers, aged under 50 years. Pantano et al (1984) reported mean PET qCBF values for the WM and GM to be 24.5 ± 4.1 mL/100g per min and 50.7 ± 10.3 mL/100g per min, respectively, in a similar population of 18 healthy subjects. The mean PET qCBV values for the WM and GM were reported to be 1.91 ± 0.62 mL/100g and 3.85 ± 0.58 mL/100g, respectively (Frackowiak et al, 1980; Pantano et al, 1984). Both studies reported a general trend of decreasing perfusion values, especially in the GM, with aging. Our SCALE-PWI and reference qCBF values in the WM and GM (Table 1) appear to be closer to the values of the study by Frackowiak et al than to the values of the study by Pantano et al. This may be explained by the difference in age between the subjects included in each of these studies. Any difference between PET and MR perfusion values may also be attributed to a major difference in the nature of PET and MR measurements. Although perfusion DSC-MRI measurements rely mainly on the presence of an intact blood—brain barrier and are prone to magnetic field inhomogeneity effects, PET perfusion measurements assume diffusible tracer kinetic models for the semidiffusable radiolabled water.
Despite the close correlation, a slight overestimation of perfusion values by SCALE-PWI, as compared with the conventional Bookend values, was depicted (Figure 4, Table 1). This overestimation is also implied by the Bland—Altman analysis plots (Figures 5C and 5D), having a slightly negative bias for both qCBF and qCBV, although not statistically significant and not revealing a major systemic trend, as reported in Table 2. Ultimately, this discrepancy will be resolved in future studies, through direct comparison of SCALE-PWI with gold-standard [15O]-H2O PET perfusion images, which is beyond the scope of this study.
A TE of 34milliseconds in the SCALE-PWI scan ensures enough susceptibility effects in T*2-weighted DSC perfusion images, while maximizing the accuracy of single-shot T1 measurements. Therefore, the scan time of the DSC module of SCALE-PWI (TE = 34 milliseconds and TR =1,090 milliseconds) is reduced in comparison with the DSC scan of the conventional Bookend protocol (TE = 54 milliseconds and TR = 1,780 milliseconds). The longer scan duration of the conventional Bookend protocol (3 minutes 47 seconds) compared with SCALE-PWI (1 minute 47 seconds) is mainly attributed to the longer TE/TR of the DSC scan, along with the need for acquiring several k-space segments in the segmented IR LL EPI scan of the former protocol. Furthermore, the shorter TE of the SCALE-PWI sequence causes a reduction in signal broadening, saturation, and fluctuations after contrast injection at a given field strength (Kjolby et al, 2009), which makes the DSC measurements more accurate.
Unlike the segmented IR LL EPI scan in the multiscan Bookend protocol, the single-shot EPI approach imposed a minimum TREffective of 84 milliseconds as a sampling interval for T1 relaxation, which was longer than the 21-millisecond interval of the segmented IR LL EPI scan. Therefore, 35 measurements acquired by the IR LL EPI module of SCALE-PWI were enough to sample T1 relaxation over the same time coverage as that provided by 120 measurements in the segmented case. This sampling rate was considered fast enough to sample T1 relaxation curves with relaxation times roughly ranging between 200 milliseconds (blood after contrast injection) and 1,500 milliseconds (blood before contrast injection), including the WM (~600 milliseconds at 1.5 T), as accurately as possible. However, the inaccuracy of SCALE-PWI T1 measurements could be also attributed to the single-shot nature to the EPI acquisition, in which T2* decay effects are greater because of longer TE and TR, especially in the WM where T2* is shortest. Therefore, an important limitation for SCALE-PWI is the single-shot nature of the entire EPI acquisition.
Single-shot GRE EPI with parallel image acquisition and reconstruction is known to experience signal-to-noise ratio reduction. This could affect the accuracy of the Levenberg—Marquardt least-squares fitting method used in this study to determine T1 values. The results shown were obtained by fitting the entire set of data points acquired during magnetization recovery. A truncation method was also implemented to eliminate the noisiest data points from the T1 relaxation curve, usually occurring at the level of the null point (time at which signal intensity is theoretically equal to zero), before the fit; however, the results did not change significantly and, therefore, are not reported in this paper. Another signal-to-noise ratio correction method may be performed based on a look-up table (Kellman and McVeigh, 2005); however, it was not possible in this study because of the absence of noise-only scans in the beginning of the sequence. Therefore, we propose to add an acquisition of noise-only scans in the beginning of the SCALE-PWI sequence.
Other issues related to the GRE EPI acquisition were N/2 ghosting, which was observed in very few of the DSC images, and some geometric distortions, as well as Eddy current effects, which could also affect image quality and final quantification. However, these effects were not significant. Furthermore, the arterial signal in the cortical branches creates a blooming effect on GRE EPI images. This can be the cause of partial volume effects (PVEs) on the measured quantitative perfusion values.
The AIF signal used may often be distorted with PVE because of the relatively low resolution of the perfusion-weighted imaging scan (Hansen et al, 2009; Kjolby et al, 2009; van Osch et al, 2001). Rescaling is valid if the PVEs are not significant, as the general shape of the AIF curve is not affected (Hansen et al, 2009). In cases of vascular disorders of the brain, such as Moyamoya disease, PVEs become significant because of narrowing of the blood vessels in regions affected by the disease. In such cases, a typical perfusion imaging voxel (1.7 mm × 1.7 mm × 5 mm) includes both blood and substantial surrounding tissues, leading to nonlinear corruption of the AIF, which is used to compute rCBF values. Therefore, PVE-induced errors can be brain region and disease dependent. Our home-built postprocessing algorithm, with automatic AIF detection, has been shown to be robust and has provided reproducible and accurate quantitative perfusion values (Carroll et al, 2003; Shin et al, 2007), which minimizes PVE on a normal basis. In addition, van Osch et al (2001) proposed a correction method for PVE on the AIF using complex MR data, which required adequate sampling of the dynamic scan (i.e., ~1 second). In this study, a TR of 1.09 milliseconds was used, which makes SCALE-PWI a good candidate for the implementation of this correction method that could be necessary in a clinical setting.
The change in the concentration of contrast material used in the clinic (van Osch et al, 2001) and the additional nonlinear dependence of the GRE relaxation of whole blood, unlike tissue, on contrast agent concentration (Kjolby et al, 2009; van Osch et al, 2001) are two other major factors that could cause secondary errors in the MR quantitative perfusion estimates. Signal broadening owing to PVE can also be confounded with dispersion effects caused by delay of the AIF signal (Kjolby et al, 2009). In addition, this technique assumes an intact blood-brain barrier, which is not always satisfied in certain disease cases, such as brain tumors or HIV, whereby leakage of contrast agent to the extravascular space can occur. In these cases, additional kinetic modeling is required to quantify perfusion. This can be achieved through another type of correction using Ktrans (Tofts et al, 1995). We agree that these are shortcomings of all DSC perfusions and hope to address them in future work.
From the comparison of results of the two different delay times used in SCALE-PWI, we deduced that a 20-second delay time, with a total scan time of 1 minute 47 seconds, is the optimal imaging protocol for quantitative cerebral perfusion, because of the higher statistical significance of its results. In fact, the delay inserted between consecutive modules of SCALE-PWI provides more time for the tipped magnetization to grow back to equilibrium before the beginning of the following preparation pulses that are played before each module.
This study has direct clinical significance. Quantitative CBF measurements can provide an ischemic threshold that distinguishes the tissue destined for infarct from the salvageable tissue in patients with ischemic stroke (Lin et al, 2003), to improve the triage of patients who can benefit from aggressive thrombolytic therapy. The DEFUSE (Diffusion and Perfusion Imaging Evaluation for Understanding Stroke Evolution) investigators (Albers et al, 2006) showed that MRI scans allowing the computation of a perfusion/diffusion mismatch can identify patient subgroups that will benefit from therapies that lead to reperfusion, during extended time windows, i.e., 3 to 6 hours after the onset of symptoms. It has been shown by PET (Powers et al, 1985) and xenon computed tomography (Kaufmann et al, 1999) although that the duration of stroke symptoms is not as relevant to the success of thrombolysis as knowledge of the quantitative values of CBF in a timely manner. An accurate, more readily available technique, for the quantification of CBF, such as SCALE-PWI, is then an urgent clinical imperative, particularly in the setting of stroke.
The SCALE-PWI provides several advantages in this respect. First, the scanning process is fully automated with SCALE-PWI, which makes the quantitative Bookend technique easier to implement in worldwide clinical settings. The acquisition of T1 and perfusion data in the same GRE EPI sequence minimizes the chance of misregistration. It is true that the use of GRE EPI for perfusion images results in a slightly distorted image resulting from the EPI point spread function. However, our study can serve as proof of principle that approaches using spin echo for quantification are possible (Carroll et al, 2008). The scan time is reduced to < 2 minutes, as compared with the conventional Bookend protocol duration of 3minutes 47 seconds. Second, image quality is improved with SCALE-PWI compared with the conventional Bookend protocol, because motion artifacts are reduced owing to the shorter scan time. On the basis of this, the new sequence is more favorable in a pediatric setting. In addition, the automation of the Bookend acquisition offers the advantage of eliminating the lengthy offline postprocessing time. This is achieved by direct integration of the postprocessing algorithm into SCALE-PWI to provide immediate, on-site image reconstruction of perfusion maps after each scan. This reduces the overall latency in quantitative perfusion image availability to < 1 minute, to get an accurate diagnosis in a timely manner.
Future work will attempt the validation of SCALE-PWI perfusion measurements in patients with compromised hemodynamics. Similar results to those presented in this study are expected based on the results previously obtained with the multiscan Bookend technique (Shin et al, 2007). In addition, the reliability and robustness of SCALE-PWI are to be assessed through a future reproducibility study.
In conclusion, we have developed and validated a single-scan MRI pulse sequence for quantification of cerebral perfusion based on the multiscan Bookend technique in healthy volunteers. We have shown that the implementation of a self-calibrating pulse sequence is possible. In this initial study, we found a strong, statistically significant correlation with a more established approach to perfusion quantification.
Footnotes
Jessy Mouannes Srour, Wanyong Shin, and Anindya Sen have no conflict of interest to declare. Saurabh Shah declares his conflict of interest as an employee of Siemens Medical Solutions USA Inc. Timothy J Carroll receives funding from Bracco for an unrelated project.