
Abstract
The time-to-maximum of the tissue residue function (T max) perfusion index has proven very predictive of infarct growth in large clinical trials, yet its dependency on simple tracer delays remains unknown. Here, we determine the dependency of computed tomography (CT) perfusion (CTP) T max estimates on tracer delay using a range of deconvolution techniques and digital phantoms. Digital phantom data sets simulating the tracer delay were created from CTP data of six healthy individuals, in which time frames of the left cerebral hemisphere were shifted forward and backward by up to ±5 seconds. These phantoms were postprocessed with three common singular value decomposition (SVD) deconvolution algorithms—standard SVD (sSVD), block-circulant SVD (bSVD), and delay-corrected SVD (dSVD)—with an arterial input function (AIF) obtained from the right middle cerebral artery (MCA). The T max values of the left hemisphere were compared among different tracer delays and algorithms by a region of interest-based analysis. The T max values by sSVD were positively correlated with ‘positive shifts’ but unchanged with ‘negative shifts,’ those by bSVD had an excellent positive linear correlation with both positive and negative shifts, and those by dSVD were relatively constant, although slightly increased with the positive shifts. The T max is a parameter highly dependent on tracer delays and deconvolution algorithm.
Keywords
Introduction
Over the past decade, the development of computed tomography (CT) perfusion (CTP) and magnetic resonance perfusion has provided powerful paradigms for the scientific study and clinical evaluation of acute stroke patients. Meanwhile, there is an increasing need to critically evaluate the available perfusion postprocessing techniques and resulting perfusion metrics (Butcher et al, 2005) to identify imaging paradigms and perfusion indices that provide efficient targets for treatment (Wintermark et al, 2008a , 2008b ). The time-to-maximum of the tissue residue function (T max) has been established as an accurate perfusion metric to discriminate the infarct core and penumbra (Shih et al, 2003), and has been applied for the definition of the diffusion—perfusion mismatch in recent multicenter trials such as Diffusion and Perfusion Imaging Evaluation for Understanding Stroke Evolution (Albers et al, 2006) and Echoplanar Imaging Thrombolytic Evaluation Trial (Butcher et al, 2005; Davis et al, 2008).
Perfusion metrics are obtained by deconvolution analysis of raw CTP and magnetic resonance perfusion data (Cenic et al, 1999; Ostergaard et al, 1996). By deconvolution, the brain tissue time—concentration curves are corrected for the shape of the arterial input function (AIF) (the time—concentration curve recorded over a major artery), yielding the tissue impulse response function, the (theoretical) tissue curve resulting from an infinitely sharp bolus injection into the voxel. This curve is given by CBF × R(t), where R(t) is the residue function (the fraction of contrast still residing in the voxel at time t after an infinitely sharp bolus injection) and CBF is the cerebral blood flow. The peak of the impulse response function is hence defined as CBF, and the corresponding time-to-peak of impulse response function and R(t) as T max (Shih et al, 2003). While ideally, T max=0, physiological parameters such as bolus arrival time (BAT) and mean transit time (MTT) of brain tissue affect T max in a complex manner that depend on the mathematical properties of the deconvolution algorithm (Bang et al, 2008; Butcher et al, 2005; Mlynash et al, 2005; Prosser et al, 2005; Shih et al, 2003; Takasawa and Jones, 2008). Here, we determine the dependency of CTP T max estimates on tracer delay using a range of deconvolution techniques and digital phantoms.
Materials and methods
We retrospectively collected CTP data set on six healthy individuals (male, aged 29 to 35 years, mean age=30.7 years), without neurologic deficits or past history of brain disorders. Written informed consent and approval of the institutional review board were obtained. A 4-detector-row CT scanner (Aquilion; Toshiba Medical Systems, Tokyo, Japan) was used for obtaining the data. Nonionic iodine contrast medium (40-mL iopamidol at 370 mgI/mL; Bayer HealthCare, Berlin, Germany) was injected into the right antecubital vein by a power injector at a rate of 5 mL/s. At 5 seconds after initiation of the injection, dynamic scans of four slices with a thickness of 8 mm were started. Scan parameters used were a 22-cm field of view, 1-second gantry rotation speed, 80-kVp tube voltage, 200-mA tube current, and 40 rotations (the total scan time was 40 seconds).
Digital phantom data were created by using a free software package (perfusion mismatch analyzer; available at http://asist.umin.jp/index-e.htm), as described previously (Kudo et al, 2009). In brief, we divided source CTP images into halves at the midline of the cerebral hemispheres, shifted the time frames of the left hemisphere forward or backward by up to 5 seconds, and then exported these data sets (11 in total) with a digital imaging and communication in medicine (DICOM) format, in which the contrast bolus of the left hemisphere was −5, −4, −3, −2, −1, 0, 1, 2, 3, 4, or 5 seconds behind that of the right hemisphere.
The digital phantoms were postprocessed by using the same software. Quantitative T max maps were created by using three kinds of singular value decomposition (SVD) deconvolution techniques: sSVD (Ostergaard et al, 1996), bSVD (Wu et al, 2003), and delay-corrected SVD by BAT (dSVD) (Kudo et al, 2009). We used a cutoff threshold of 20% in both sSVD and dSVD to minimize oscillation of the tissue residue function, and used an oscillation index of 0.095 in bSVD (Wu et al, 2003). In all the phantom analyses, identical AIF and venous output function were obtained from the insular segment of the right middle cerebral artery (MCA) and the right sigmoid sinus, respectively. After vascular pixels were eliminated by using a cerebral blood volume value of 8 mL/100 g as the threshold (Kudo et al, 2003), quantitative color maps were generated.
For quantitative analysis, we measured the T max values using the spherical region-of-interest with a diameter of 15.5 mm (36 pixels). Sixteen regions-of-interest were automatically placed along the entire parenchymal surface of each cerebral hemisphere by using the same software. The absolute T max values of the left hemisphere were averaged and compared. One-way repeated-measures analysis of variance was used to test whether a significant difference was observable in the T max values among the various frame shifts. Further, a post hoc Dunnett test was used to determine which shifts had significantly different values compared with the original data. The α level was set at 0.05.
Results
We obtained T max color maps of the digital CTP phantoms with various bolus arrival timings by three kinds of SVD algorithms (Figure 1). With ‘positive shifts,’ in which the bolus arrival in the left hemisphere was behind that in the AIF of the right MCA, an evident increase in the T max was observed by both sSVD and bSVD, whereas the T max was almost constant by dSVD. With ‘negative shifts,’ in which the bolus arrival in the left hemisphere was ahead of that in the AIF of the right MCA, the T max decreased and became negative only by bSVD.
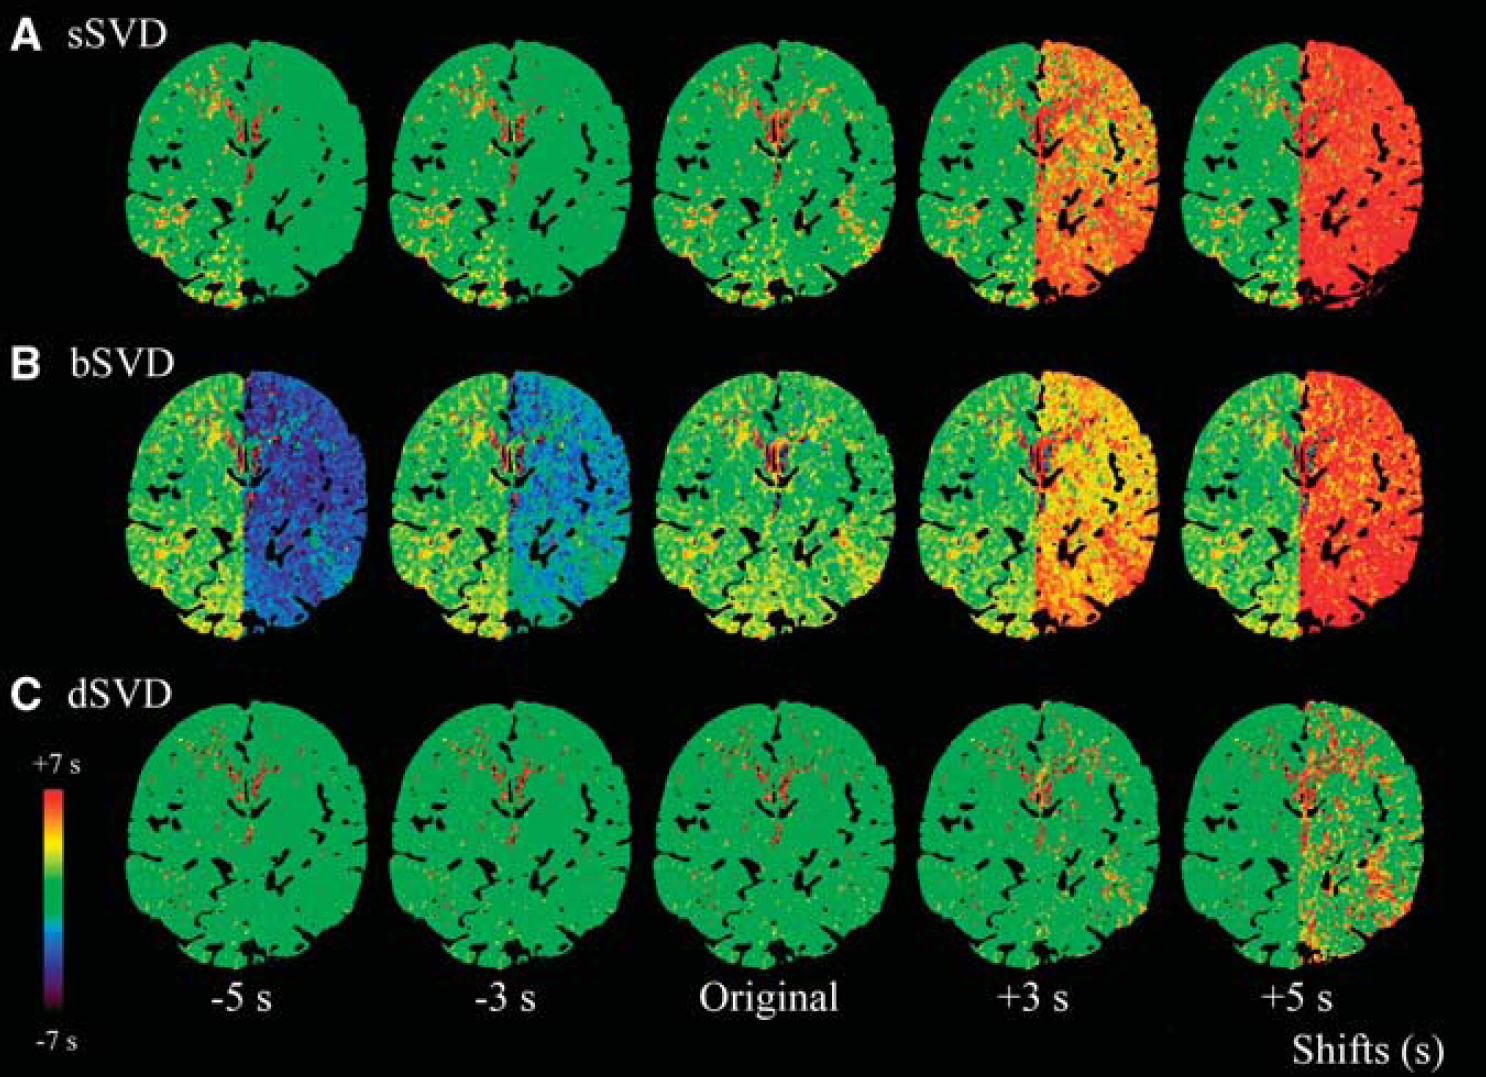
Color maps of time-to-maximum of the tissue residue function (T
max). The T
max color maps of digital computed tomography (CT) perfusion (CTP) phantoms, obtained by different deconvolution algorithms, are shown. Time frames of the left hemisphere were shifted from −5 to +5 seconds compared with the original data. Arterial input function (AIF) was obtained from the identical location at the insular segment of the right middle cerebral artery (MCA). Three kinds of the singular value decomposition (SVD) algorithm, standard SVD (sSVD), block-circulant SVD (bSVD), and delay-corrected SVD (dSVD), were used to obtain the T
max color maps. In sSVD, the T
max is apparently increased with the positive delays (+3 and +5 seconds) but is nearly constant with the negative delays (−3 and −5 seconds) compared with the original image (
Quantitative analysis demonstrated that the T max of the left hemisphere by sSVD was significantly increased in a nearly sigmoid manner under the positive shifts but was nearly zero under the negative shifts (Figure 2). On the other hand, the T max by bSVD was significantly increased and decreased in the positive and negative shifts, respectively, having a linear relationship with the amount of frame shift. The regression line was y=0.98x+1.58, and the correlation coefficient of linear regression was remarkably high (r=0.9999) compared with sSVD (r=0.9012). Correlation coefficient became larger in sSVD with third order polynomial fitting (y=−0.05x 3+0.29x 2+0.96x+0.50; r=0.9996). In contrast, the T max by dSVD was relatively constant, although slightly but significantly increased with the positive shifts.
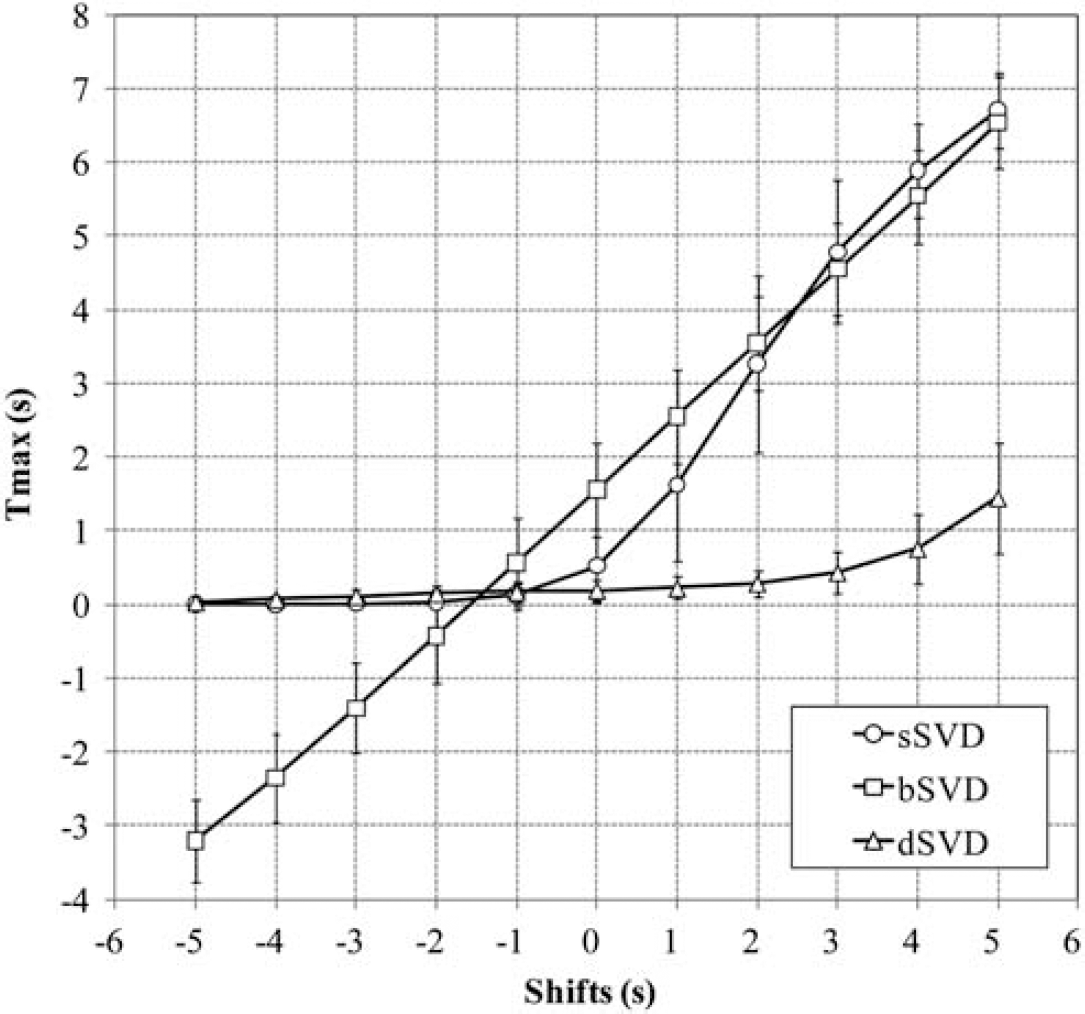
Relationship between time-to-maximum of the tissue residue function (T max) and time shifts. Relationship between the T max and positive and negative shifts of the time frame in the left hemisphere is shown. In standard singular value decomposition (sSVD), the T max is increased in a sigmoidal manner with the positive delays but is constant with the negative delays. In block-circulant SVD (bSVD), the T max is perfectly linear with the positive and negative delays. In delay-corrected SVD (dSVD), the T max is mostly constant with both the delays, but is slightly increased with the positive delays. Plots and error bars represent the average and s.d. of the T max values in the six subjects.
In all three algorithms, there were significant differences in the T max values among the various frame shifts. Further, the post hoc Dunnett test revealed that the T max values in sSVD and bSVD with any time shift had significant differences compared with the original data (Table 1). In dSVD, the T max values with time shifts less than −4 seconds and more than +2 seconds were significantly different from the original data.
P values for post hoc Dunnett test (control=shift 0 seconds)
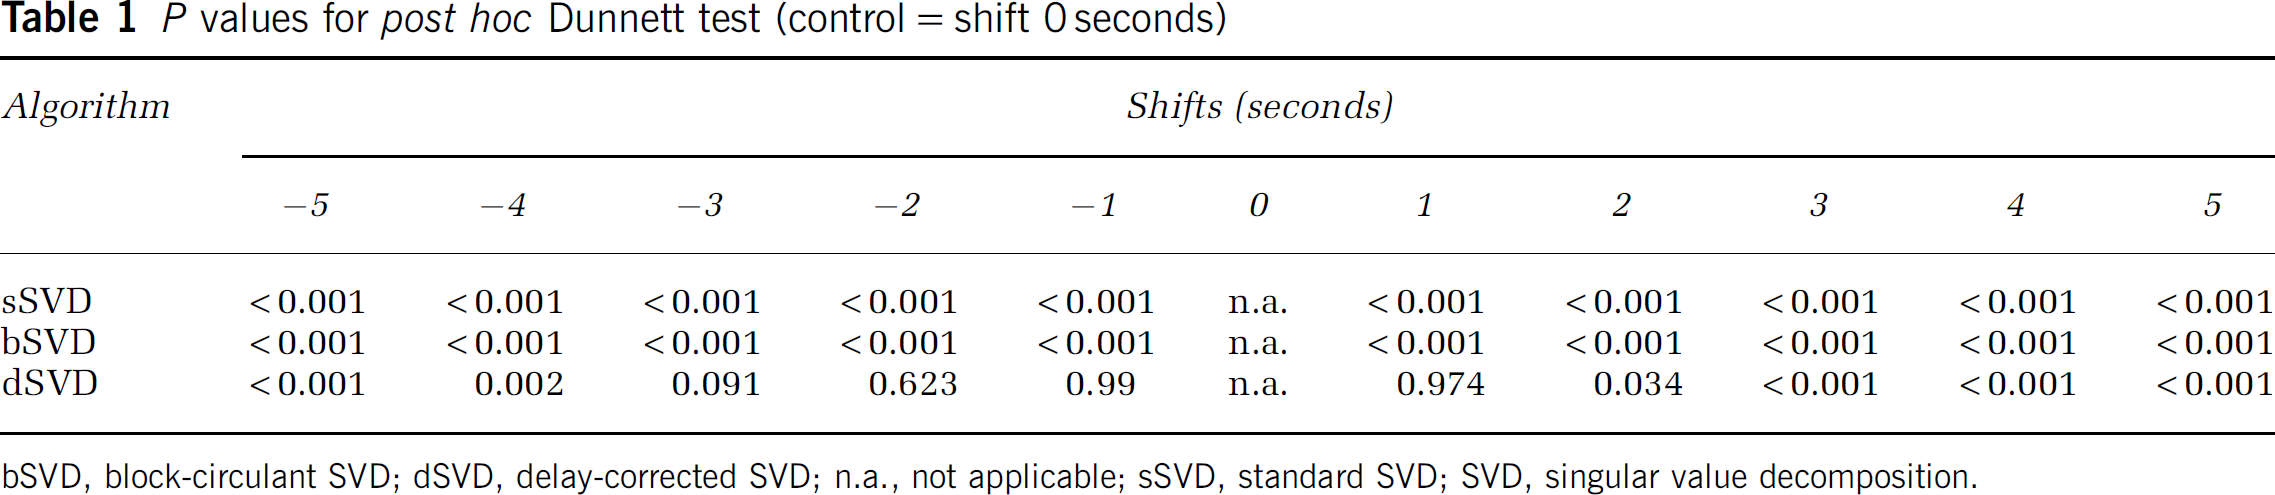
bSVD, block-circulant SVD; dSVD, delay-corrected SVD; n.a., not applicable; sSVD, standard SVD; SVD, singular value decomposition.
Discussion
Although the importance of T max as a perfusion metric has been emphasized in major multicenter trials such as Diffusion and Perfusion Imaging Evaluation for Understanding Stroke Evolution (Albers et al, 2006) and Echoplanar Imaging Thrombolytic Evaluation Trial (Davis et al, 2008), the extent to which these results can be generalized and supported by studies using other perfusion metrics is far from trivial. In particular, the extent to which T max depends on study-specific software or tracer-delay effects caused by collateral supply remain crucial to the convergence of methodology and knowledge. Here, we demonstrate the behavior of T max as a function of tracer arrival delay by three common SVD algorithms using digital CTP phantoms simulating positive and negative shifts of the arrival timing. We found that the T max was positively correlated with the BAT in brain tissue by both sSVD and bSVD in the positive shift domain, suggesting that the T max is a tracer delay-sensitive parameter. Consequently, the behavior of the T max against the tracer delay appears to be similar to that of TTP, although interindividual variation in terms of the bolus of the contrast agents can be normalized in the T max because of the deconvolution. We also noted the difference in dependence on the tracer delay between sSVD and bSVD. The T max by sSVD had a sigmoidal correlation with the positive shifts, whereas that by bSVD had a completely linear correlation. The reason for this difference cannot be completely explained; however, it can be related to the different behavior of CBF against delay. The CBF remains constant against delay, because bSVD has been developed as delay-insensitive deconvolution (Wu et al, 2003), and T max was linear. In sSVD, CBF decreases with delay, but the degree of decrease was not constant (Kudo et al, 2009). These differences can affect the different sensitivity on T max against delay. Further studies will be needed to determine which deconvolution algorithm is suitable to generate the T max for estimating the tissue at risk, because all of the previous articles reporting the usefulness of the T max used sSVD, but the use of bSVD has been recommended for precise CBF quantification (Wu et al, 2003).
An important finding in this study is that the T max calculated by sSVD was constant during the negative shifts and that by bSVD was linearly correlated to these shifts. This result suggests that the T max by sSVD is insensitive to the tracer arrival timing when the AIF precedes tracer arrival in brain tissue. Therefore, the AIF should be obtained from the arteries in the contralateral, nonaffected side when using sSVD to obtain the T max. This issue is one of the potential pitfalls when adopting the T max to determine the tissue at risk.
Theoretically, the T max by dSVD should be unchanged regardless of any positive and negative shifts because of the correction of the tracer arrival timing. In dSVD, BAT was estimated in each pixel, and tissue curve of the pixel was shifted to correct arrival time delay. If the estimation of arrival time was perfect, deconvolution was performed without any delay between AIF and tissue, and T max should be zero. In this study, however, the T max by dSVD was slightly but significantly increased with the positive shifts, suggesting incomplete correction of the delay when using BAT. This phenomenon may be caused by errors in calculating BAT due to image noise, and could become significant in ischemic brain tissue in which the magnitude in the time—density curve is smaller than that in healthy tissue. We speculate that the T max by bSVD can be applied for correcting the tracer delay instead of BAT, because the T max by bSVD has a nearly ideal linear correlation with positive and negative shifts, and is expected to have robustness to image noise because it is obtained after deconvolution.
There are several limitations in this study. First, we used digital phantoms derived from young healthy subjects who have normal CBF and MTT. Characteristics of the T max with regard to the tracer arrival timing might be slightly different between healthy subjects and stroke patients who tend to have low CBF and/or high MTT. Second, we could not investigate the MTT and dispersion effect (Calamante et al, 2000), another source of error in deconvolution analyses, because the tissue curves of our simulation data were derived from real data sets. We found that the tracer delay strongly affects the T max values, but MTT and dispersion of the tissue bolus can also affect these values in sSVD and bSVD (Calamante et al, 2010). Further investigation is needed to clarify the contribution of the MTT and dispersion effects on the T max in various algorithms. Third, although the T max was originally introduced in magnetic resonance perfusion analysis, we used CTP data for evaluating the characteristics of the T max, because there are several advantages in CTP analysis for accurate evaluation: (1) the AIF is easily obtained; (2) a linear relationship exists between the CT number and the tracer concentration; and (3) the source data are ‘isophasic’ (i.e., all the slice data are obtained simultaneously). Among these advantages, the last appears to be crucial for the precision of time-dependent parameters such as the T max. We speculate that our results are applicable to the T max in magnetic resonance perfusion analysis because identical theories and postprocessing techniques are used in both the perfusion analyses.
This study revealed that the T max is tracer delay dependent and varies among the deconvolution algorithms. Further investigations are needed to determine the potential advantages and limitations of the T max in comparison with other perfusion parameters before applying it to clinical practice and future clinical trials concerning acute stroke management.
Footnotes
The authors declare no conflict of interest.