Neurovascular coupling associated with visual and vibrotactile stimulations in baboons anesthetized sequentially with isoflurane and ketamine was evaluated using multimodal functional magnetic resonance imaging (fMRI) on a clinical 3-Tesla scanner. Basal cerebral blood flow (CBF), and combined blood-oxygenation-level-dependent (BOLD) and CBF fMRI of visual and somatosensory stimulations were measured using pseudo-continuous arterial spin labeling. Changes in stimulus-evoked cerebral metabolic rate of oxygen (CMRO2) were estimated using calibrated fMRI. Arterial transit time for vessel, gray matter (GM), and white matter (WM) were 250, 570, and 823 ms, respectively. Gray matter and WM CBF, respectively, were 107.8 ± 7.9 and 47.8 ± 3.8 mL per 100 g per minute under isoflurane, and 108.8 ± 10.3 and 48.7 ± 4.2 mL per 100 g per minute under ketamine (mean ± s.e.m., N = 8 sessions, five baboons). The GM/WM CBF ratio was not statistically different between the two anesthetics, averaging 2.3 ± 0.1. Hypercapnia evoked global BOLD and CBF increases. Blood-oxygenation-level-dependent, CBF, and CMRO2 signal changes by visual and vibrotactile stimulations were 0.19% to 0.22%, 18% to 23%, and 4.9% to 6.7%, respectively. The CBF/CMRO2 ratio was 2.9 to 4.7. Basal CBF and fMRI responses were not statistically different between the two anesthetics. This study establishes a multimodal fMRI protocol to probe clinically relevant functional, physiological and metabolic information in large nonhuman primates.
Nonhuman primates (NHPs) are valuable preclinical models of human diseases because of their similarities to humans. These similarities include large brain size, extensive cortical folding and gyrification, similar genetic makeup, among others. Baboons, in particular, are the largest among Old World monkeys, who are evolutionarily closest to humans besides the Great Apes. As such, baboons are likely to more faithfully recapitulate many human disease characteristics and offer clinically relevant responses to therapeutic interventions compared with the more commonly used rodents. Research using NHP models have significantly advanced our understanding of neuroscience, neurodegerative disorders, aging and development, as well as vaccine, AIDS, and infectious disease research.
Multimodal functional magnetic resonance imaging (fMRI) is commonly used in human studies, but its applications to NHP are sparse. Custom-designed MRI scanners for large NHP have been used, but these scanners are not widely available (Gamlin et al, 2006; Logothetis et al, 1999). The majority of large NHP fMRI studies are performed on clinical scanners that facilitate translation (Duong, 2010). These clinical scanners are often limited by spatial resolution because of their weak magnetic field gradients, given the requirement that voxel size needs to be inversely scaled with brain volume to achieve comparable parcellation of brain structure and function. Despite many challenges, fMRI studies of awake (Dubowitz et al, 2001; Gamlin et al, 2006; Logothetis et al, 1999; Vanduffel et al, 2001) and anesthetized NHPs (Chen et al, 2007; Wibral et al, 2007) have been reported on both custom-NHP scanner and clinical scanners. Quantitative perfusion MRI studies of anesthetized NHP have also been demonstrated (Zappe et al, 2007; Zhang et al, 2007). Although anesthetized NHP models preclude fMRI studies of higher order cognition, fMRI of the primary sensory systems in anesthetized NHPs is valuable for neuroscience research and the studies of cerebral physiology and pathophysiology. The type of anesthetic and its dosage need to be carefully considered. Paralytic agent without attenuating evoked responses may be used to eliminate motion, allowing minimal dose of anesthetic to be applied. In contrast to rhesus monkeys, MRI applications to baboons are limited to a few anatomical MRI reports (Greer et al, 2002; Kochunov and Davis, 2010), and fMRI and physiological MRI of baboon has not been explored to our knowledge.
The aim of this study was to explore the feasibility of performing multimodal MRI on anesthetized baboons using a clinical 3-Tesla scanner with the long-term goals of applying to stroke and epilepsy research. Multimodal MRI included quantitative basal cerebral blood flow (CBF) and combined BOLD and CBF fMRI of visual and vibrotactile stimulations using pseudo-continuous arterial spin labeling (pCASL). Stimulus-evoked changes in cerebral metabolic rate of oxygen (CMRO2) were estimated using calibrated fMRI via the BOLD biophysical model. The couplings among these fMRI parameters were analyzed. To further establish the anesthetized baboon as a model for multimodal fMRI studies, comparisons of multimodal data were performed on baboons anesthetized sequentially with two commonly used anesthetics (isoflurane and ketamine).
Materials and methods
A total of eight MRI sessions were performed on five normal female baboons (Papio hamadryas Anubis, 11 to 19 kg, 15 ± 3 kg) with approval of the Institutional Animal Care and Use Committee. Four groups of experiments were performed: (1) basal CBF at different post-labeling delay (PLD) for estimating arterial transit time (ATT) (six sessions, four animals), (2) basal CBF measurements (eight sessions, five animals), (3) BOLD and CBF fMRI under hypercapnia (five sessions, four animals), and (4) BOLD and CBF fMRI during simultaneous visual and vibrotactile stimulations (five sessions, four animals). All experiments were performed under both isoflurane and ketamine sequentially, except experiment (1) was performed under isoflurane only. Sessions denoted experiments performed on different days.
Anesthesia was initially induced by ketamine (1.0 to 1.2 mg, intramuscular) for intubation and catheterization of a saphenous vein. Animals were mechanically ventilated (Aestiva 5, Datex-Ohmeda, Madison, WI, USA) and maintained with 1.5% to 2.0% isoflurane in air during preparation for MRI. The animal was positioned supine in a custom-made animal holder and stabilized with ear bars, mouth bar, and padding around the head. Both eyelids were kept open for visual stimulation. Phenylephrine and atropine eye drops were applied to dilate the pupils, followed by eye ointment to prevent corneal dryness. A custom-built feedback-regulated circulating warm-air blanket was used to maintain the rectal temperature within normal physiological ranges (37 to 38°C). End-tidal CO2, O2 saturation, heart rate, and respiration rate were monitored continuously using an MRI compatible physiological monitoring equipment (Precess, InVivo, Orlando, FL, USA), and were maintained within normal physiological ranges.
To minimize movement and anesthetic dosage, vecuronium was administered before the start of the MRI acquisition and was maintained throughout the entire study (0.1 mg/kg initial dose, followed by 10% of initial dose every 45 minutes) (Wey et al, 2010). Magnetic resonance imaging studies were performed first under 0.8% to 1.0% isoflurane. The anesthetic was then switched to intravenous ketamine (6 to 8 mg/kg/h, intravenously administered using an MRI-compatible injector, Continuum MR Compatible Infusion System, MEDRAD, New York, NY, USA) and isoflurane was discontinued 15 minutes after ketamine onset. To avoid potential confounds of mixing anesthetics, CBF and fMRI acquisitions under ketamine started 20 to 30 minutes after discontinuing isoflurane. The duration was determined based on previous observations in a separate group of nonparalyzed animals, in which the animal became awake and responsive within 5 to 10 minutes after isoflurane was discontinued. At the end of the MRI experiments, neostigmine (0.5 to 2 mg, intravenously) with atropine (0.6 to 1.2 mg, intravenously) was administered to reverse paralysis.
Stimulations
Each hypercapnic challenge included 3 minutes baseline and 3 minutes 5% CO2 in air inhalation (by premixed tank). Hypercapnia was applied once under each anesthetic. A 10 to 15 minutes break was given to minimize residual effects of hypercapnia. Binocular visual stimulation with achromatic light flickering at 10 Hz was delivered using two fiber optic cables placed in front of the eyes. Somatosensory-motor stimulation was applied to the animal's right hand by a custom-made pneumatic-driven vibrotactile stimulator. Both visual and somatosensory-motor stimulations were applied simultaneously to induce large number of activated pixels in different brain areas at the same time. An fMRI stimulation paradigm consisted of three epochs of (70 seconds OFF and 70 seconds ON), followed by 70 seconds OFF.
MRI Data Acquisition
Magnetic resonance imaging studies were performed on a 3T Siemens TIM Trio (Siemens, Erlangen, Germany) using a body radiofrequency coil for transmission and a Siemens 12-channel human head coil for reception. Anatomical MRI was acquired using the MPRAGE pulse sequence with repetition time (TR) = 2,100 ms, echo time (TE) = 3.1 ms, flip angle = 12°, inversion time (TI) = 1,100 ms, field of view (FOV) = 16 × 19.2 × 19.2 cm, 1 mm isotropic spatial resolution and two averages. Anatomical images were typically acquired during the transition between the two anesthetics.
Pseudo-continuous arterial spin labeling images were acquired using a single-shot gradient-echo EPI with TR/TE = 4,600/16 ms, labeling duration = 2.1 seconds, 10 contiguous slices with 5 mm slice thickness, matrix = 64 × 64, FOV = 12.8 × 12.8 cm (2 × 2 × 5 mm resolution), labeling gradient of 0.6 G/cm. Alternating labeled and nonlabeled images were acquired in pairs. For experiment (1), variable PLD (300, 500, 600, 700, 800, 1,000, 1,200, 1,500, and 2,000 ms) were acquired in random orders. The TR of 4.6 seconds was determined from that of the longest PLD. For experiments (2 to 4), pCASL experiments were performed using the optimal PLD (700 ms, see Results) and TR of 3.5 seconds. BOLD fMRI was taken from the nonlabeled images of the pCASL measurements. Note that BOLD contrast was suboptimal given the short TE used to improve CBF contrast. The advantage is that both BOLD and CBF fMRI were simultaneously measured, minimizing intertrial variations. Typically, two to three repeated baseline and fMRI scans were performed in each session for each anesthetic.
Data Analysis
Images were processed using FMRIB Software Library and custom codes written in MATLAB (MathWorks, Natick, MA, USA). Brain extraction and motion correction were performed using FMRIB Software Library before quantitative analysis. High-resolution T1-weighted images were segmented to generate partial volume gray matter (GM), white matter (WM), and CSF masks using the FAST toolbox in FMRIB Software Library.
ATT Estimation
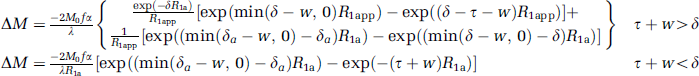
Perfusion-weighted images (ΔM/M0) were fitted with a two-compartment model (Wang et al, 2002):
where ΔM is signal intensity difference between nonlabeled and labeled images, M0 is the equilibrium magnetization of the brain, f is the CBF, α is the labeling efficiency, λ is the water brain–blood partition coefficient, δ is the exchange time, δa is the ATT, R1a is the longitudinal relaxation rate constant of arterial blood, R1app = R1 + f/λ, where R1 is the longitudinal relaxation rate constant of brain tissue, w is the PLD, and τ is the labeling duration. λ of 0.99 and 0.82 for GM and WM, respectively (Herscovitch and Raichle, 1985), α of 0.85 (Wu et al, 2007), τ of 2.1 seconds, δ of 1.5 seconds (Wang et al, 2002), and T1a of 1.66 seconds at 3-Tesla (Lu et al, 2004) were used.
ΔM/M0 was analyzed for GM, WM, and vessel regions of interest (ROIs). Gray matter and WM ROIs were obtained by thresholding the GM and WM partial-volume probability masks to voxels of 0.85 to 1 and 0.95 to 1, respectively. Vessel ROIs were selected manually by visual inspection of the image at short PLD. Post-labeling delay of subsequent imaging slices took into account for the acquisition time of each slice. Group-averaged ΔM/M0 data were plotted against PLD and fitted with equation (1) to determine ATTs for GM, WM, and vessels.
Quantitative CBF
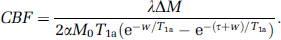
Cerebral blood flow in mL per 100 g per minute was calculated pixel-by-pixel using equation (1), where the PLD was taken to be longer than ATT, reducing to (Wang et al, 2002),
w of 0.7 seconds was determined based on the results of experiment (1) for optimal contrast of the GM. Cerebral blood flow was calculated for a single PLD. Quantitative CBF for the whole brain, GM, and WM were tabulated. The bottom slice was excluded from this analysis because it covered only a small part of the cerebrum.
BOLD and CBF fMRI Percent Changes
Magnetic resonance imaging data were spatially smoothed with a 5 mm FWHM Gaussian filter before statistical analysis. Blood-oxygenation-level-dependent and CBF functional activation maps were generated using general linear modeling (FEAT toolbox, FMRIB Software Library) on a voxel-by-voxel basis and a threshold of Z > 2.3 (P < 0.01). These images were coregistered first to their own anatomical images and then to a high-resolution template (0.4 mm isotropic resolution) from a population-based, pseudo-Talairach, and median-geometry atlas (Kochunov and Davis, 2010).
Hypercapnia-induced BOLD and CBF percent changes were calculated for the whole brain. ROI analysis was performed to quantify BOLD and CBF percent changes in response to functional stimulations. ROIs of the primary visual cortex (V1) and primary somatosensory cortex (S1) were determined manually with reference to the baboon brain atlas (Greer et al, 2002).
Estimating CMRO2 Changes
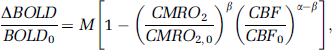
Stimulus-evoked CMRO2 changes were estimated using (Davis et al, 1998)
where M, the maximal possible BOLD change, is a calibration constant; BOLD, CBF, and CMRO2 with subscript zero represent baseline, whereas those without subscripts represent stimulation; α of 0.38 and β of 1.5 reflecting the effects of blood volume and deoxyhemoglobin concentration on the BOLD signal, respectively, were used in the calculation (Davis et al, 1998). The M-values of the V1 and S1 were determined using the data obtained with hypercapnic challenge, which assumed that CMRO2 does not change significantly (Kety and Schmidt, 1948). Using the hypercapnia-derived M-value, CMRO2 percent changes in the V1 and S1 were then calculated.
Statistical Analysis
All results were reported as mean ± s.e.m. if not noted otherwise. Paired t-test was used to compare percent CBF changes between GM and WM and between anesthetics in response to hypercapnia. Two-way analysis of variance with repeated-measures (Prism5, GraphPad Software, La Jolla, CA, USA) was used for comparison between GM and WM, between V1 and S1 during neuronal activations, and between isoflurane and ketamine. P < 0.05 was taken to be statistically significant. Linear regression analysis was applied to investigate the coupling relationship among BOLD, CBF, and CMRO2 fMRI signal changes in response to stimuli.
Results
Under isoflurane and ketamine, respectively, the heart rates were 120 ± 20 and 138 ± 10b.p.m. (mean ± s.d.); respiration rates were 11.0 ± 1.1 and 11.0 ± 1.2 b.p.m.; tidal volumes were 190 ± 14 and 185 ± 10 mL; end-tidal CO2 values were 38 ± 5 and 38 ± 2 mm Hg; and rectal temperatures were 100 ± 2 and 100 ± 1°F. None of the measured parameters was statistically different between the two anesthetics.
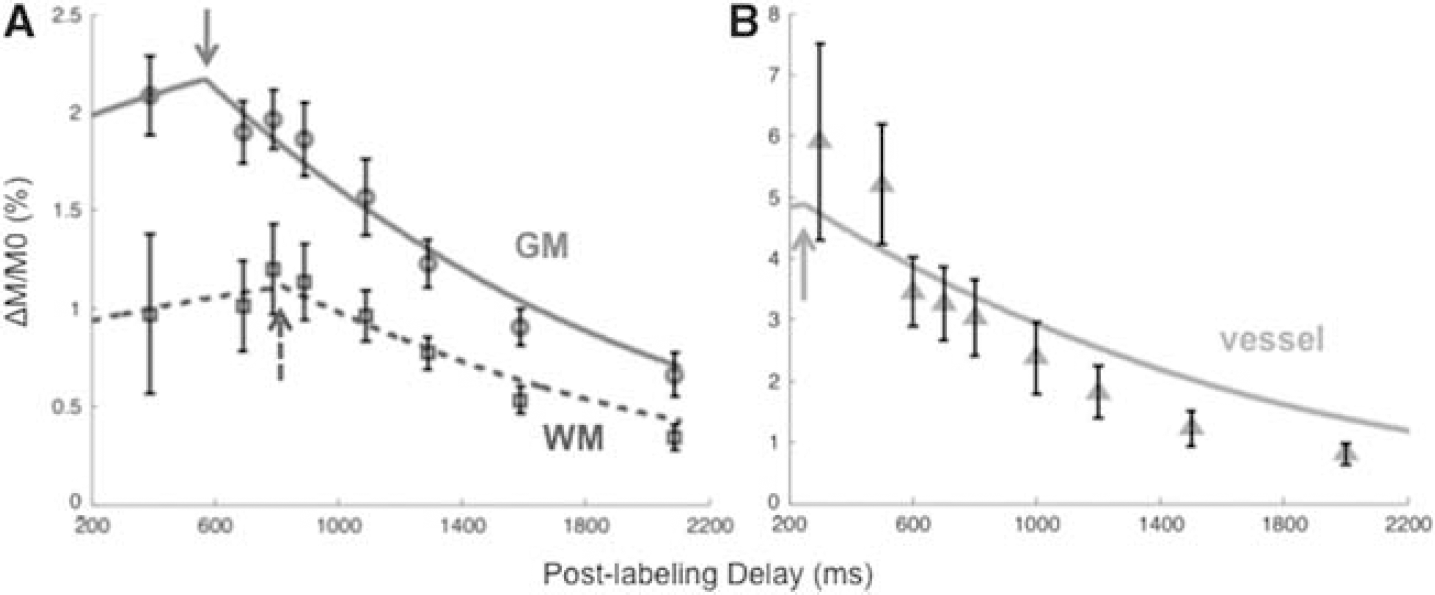
Figure 1 shows the group-averaged ΔM/M0 as a function of PLD. The two-compartment models (equation (1)), shown as lines through the data points, fit the data well with known characteristics pertaining to GM, WM, and vessel ROIs. The ATTs were the turning points as indicated by arrows. ATTs for vessel, GM, and WM were 250, 570, and 823 ms, respectively.
Group-averaged perfusion-weighted arterial spin labeling signal (ΔM/M0) at different post-labeling delays in baboons (mean ± s.e.m., N = 6). Analysis was performed for white matter (WM), gray matter (GM), and vessel regions of interest. The lines are model fits (equation (1)) to the experimental data. The turning points (arrows) indicate arterial transit times (ATTs). The ATT of vessels, GM, and WM were 250, 570, and 823 ms, respectively.
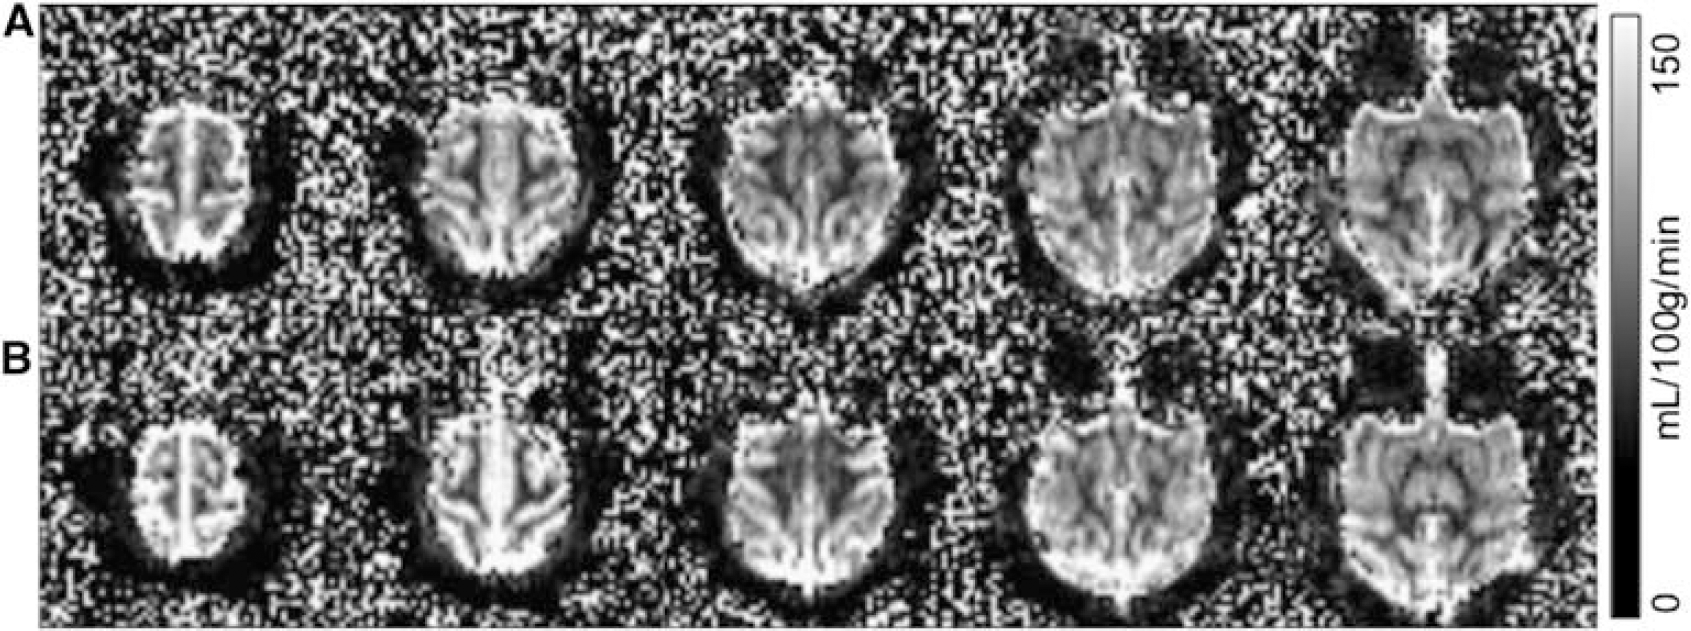
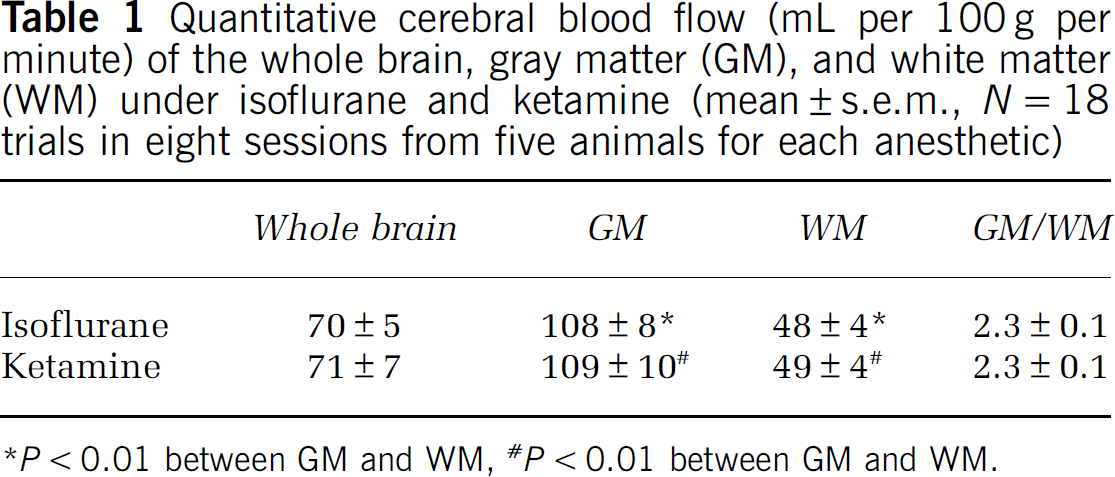
Representative basal CBF images under isoflurane and ketamine showed excellent contrast between GM and WM (Figure 2, 2 × 2 × 5 mm resolution obtained in 3.5 minutes). The group-averaged basal CBF of the whole brain, GM, WM, and the GM to WM CBF ratios for the two anesthetics are summarized in Table 1. CBF values were statistically different between GM and WM for both anesthetics (P < 0.05), but CBF was not statistically different between the two anesthetics (P > 0.05). The GM to WM CBF ratio was also not statistically different between the two anesthetic (P > 0.05).
Baseline quantitative cerebral blood flow images at 2 × 2 × 5 mm resolution under (A) isoflurane and (B) ketamine from a representative baboon (scale bar = 0 to 150 mL per 100 g per minute). The images were acquired in 3.5 minutes with the optimal post-labeling delay of 700 ms.
Quantitative cerebral blood flow (mL per 100 g per minute) of the whole brain, gray matter (GM), and white matter (WM) under isoflurane and ketamine (mean ± s.e.m., N = 18 trials in eight sessions from five animals for each anesthetic)
P < 0.01 between GM and WM, # P < 0.01 between GM and WM.
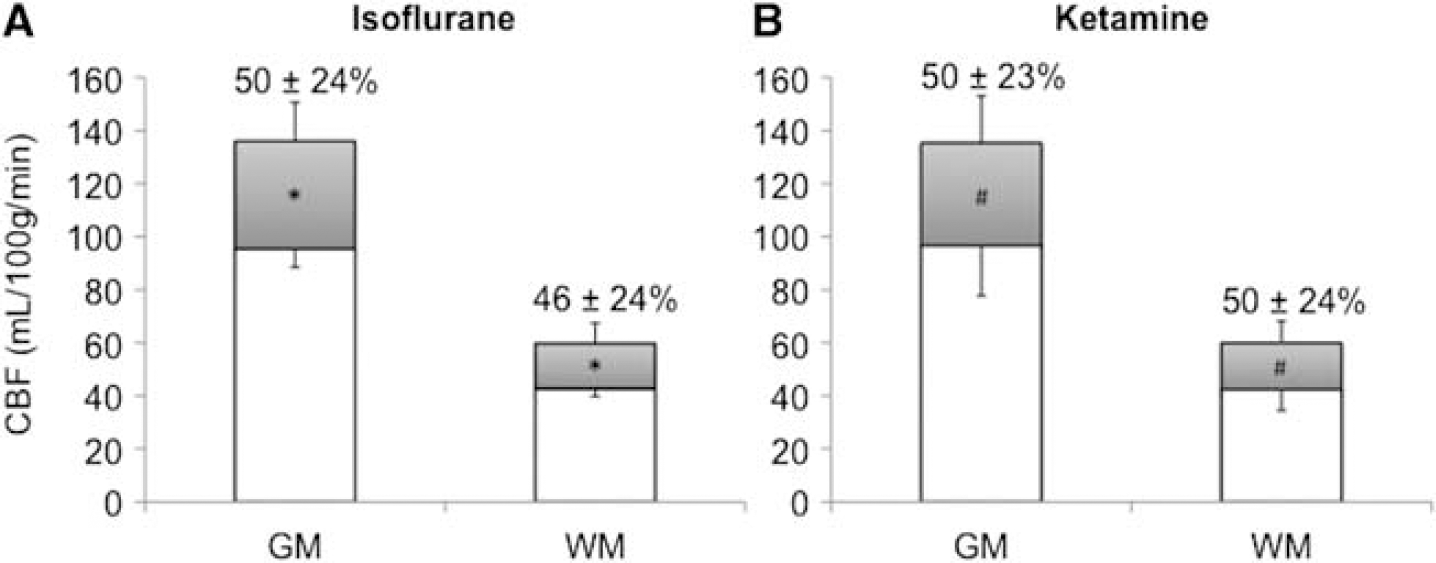
Hypercapnia induced large CBF increases over the entire brain. Group-averaged hypercapnia-induced CBF changes of the whole brain were similar, namely: 48 ± 16% (isoflurane) and 50 ± 14% (ketamine). Hypercapnia-induced CBF changes were not statistical different between the two anesthetics (P > 0.05). In contrast, absolute CBF changes were significantly higher in GM than in WM under both anesthetics (P < 0.05) (Figure 3). Note that the number of trials under hypercapnic challenge was less than those for basal CBF, and the basal CBF in this subgroup was slightly lower than that reported in Table 1. The M-values under isoflurane and ketamine, respectively, were 1.9 ± 0.2% and 1.8 ± 0.1% for V1, and 2.2 ± 0.2% and 2.8 ± 0.5% for S1.
Quantitative cerebral blood flow (CBF) under basal condition and hypercapnia for gray matter (GM) and white matter (WM) in baboons under (A) isoflurane and (B) ketamine (mean ± s.e.m., N = 6 trials in six sessions for each anesthetics from five animals). Hypercapnia-induced CBF magnitude changes are shown in gray color. Hypercapnia-induced percent changes are displayed in numerical values. (*,#P < 0.05).
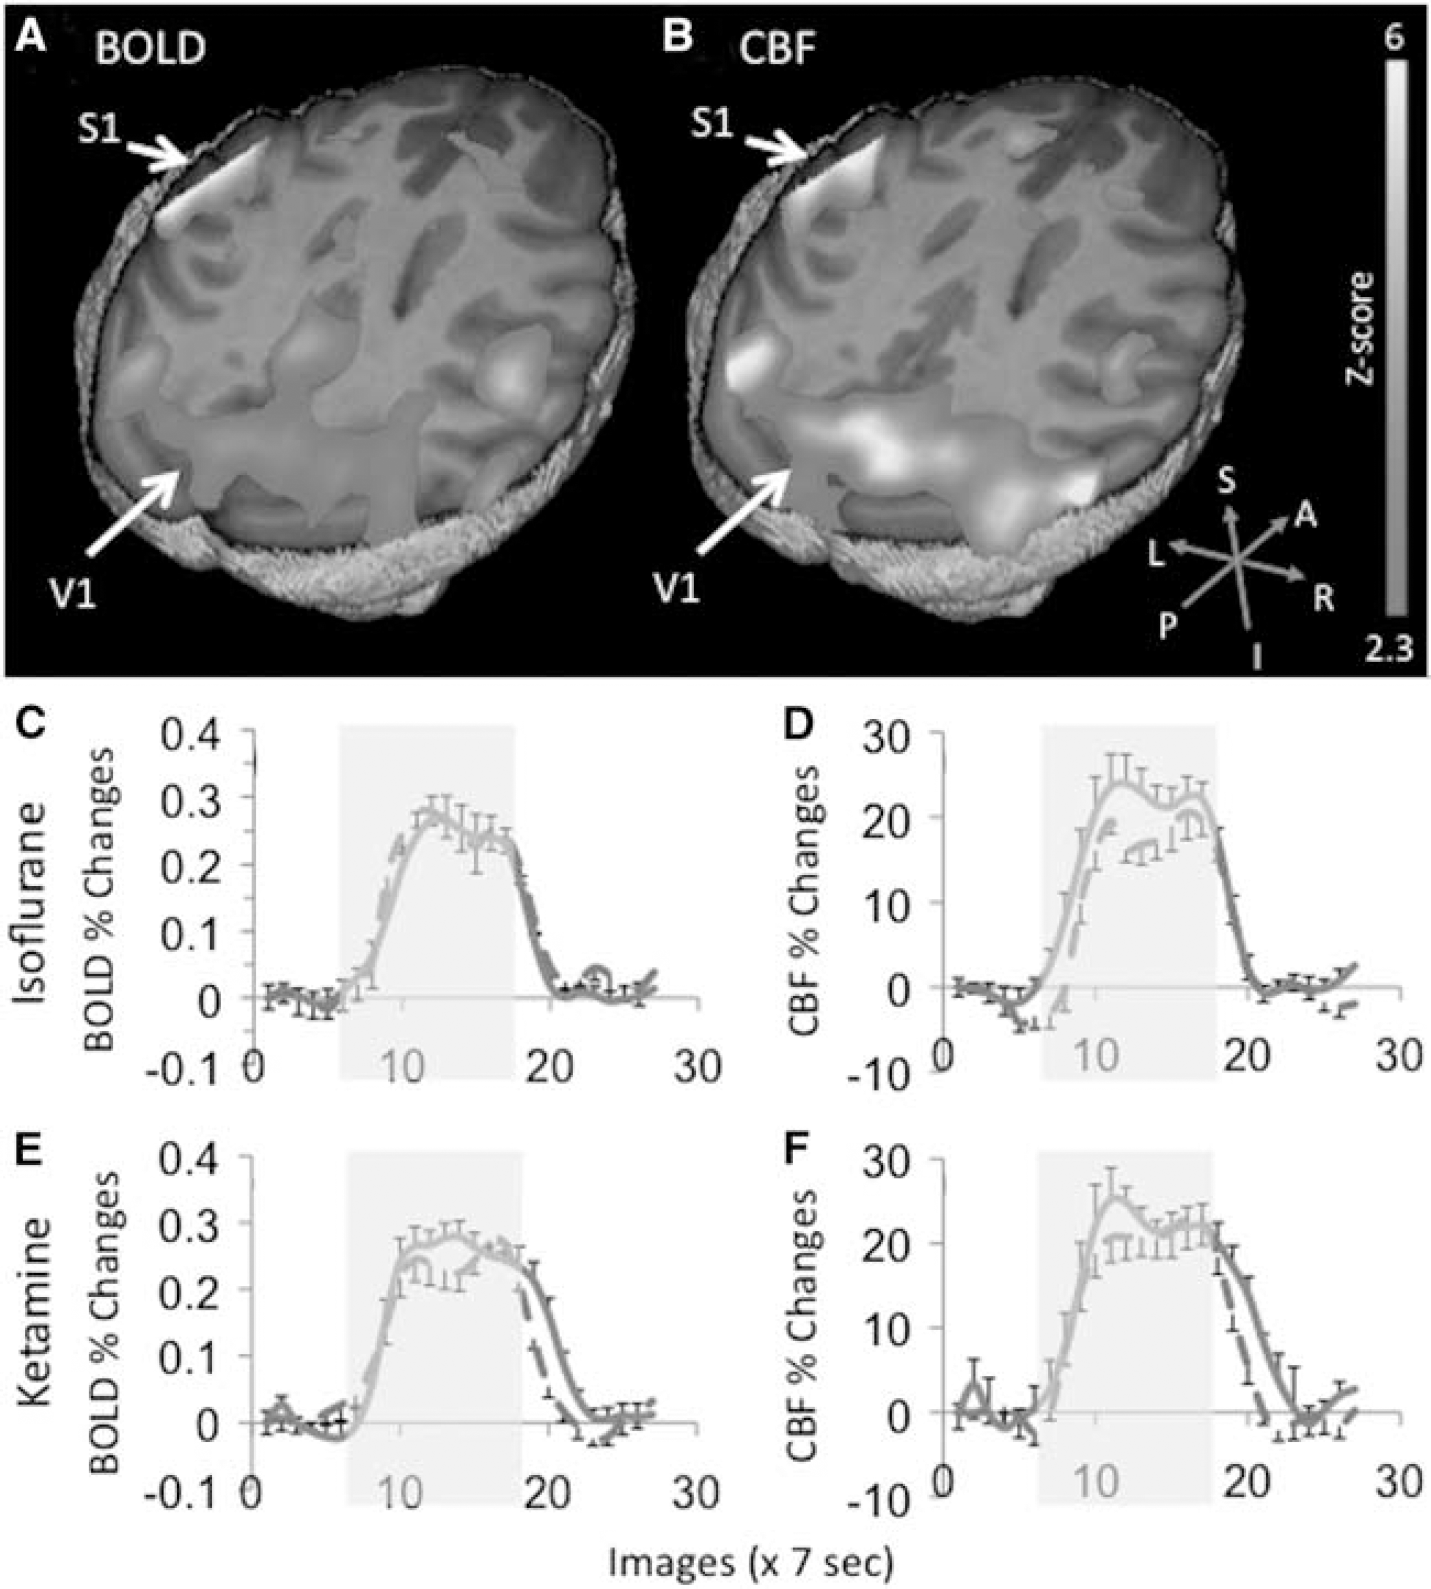
Simultaneous BOLD and CBF fMRI were acquired during binocular visual and unilateral vibrotactile stimulation to the right hand. Robust activations of V1 and S1 contralateral to the stimulus were detected under both anesthetics (Figures 4A and 4B). The group-averaged time courses of the BOLD and CBF fMRI responses for V1 and S1 under both anesthetics are shown in Figures 4C–4F. Activations of the secondary somatosensory cortices, the motor cortex, and the supplementary motor area were often detected. However, these brain structures were not analyzed in this study because of lower detection incidence and small sample size (Wey et al, 2010).
(A) Blood-oxygenation-level-dependent (BOLD) and (B) cerebral blood flow (CBF) activation maps in response to simultaneous binocular visual and unilateral vibrotactile stimulations to the right hand from a representative ketamine-anesthetized baboon. The color scale indicates statistical Z-scores from 2.3 to 6. (C, E) BOLD and (D, F) CBF functional magnetic resonance imaging responses time courses were shown for both isoflurane and ketamine (mean ± s.e.m., N = 9 trials; blue solid line: visual cortex, red dash line: somatosensory cortex).
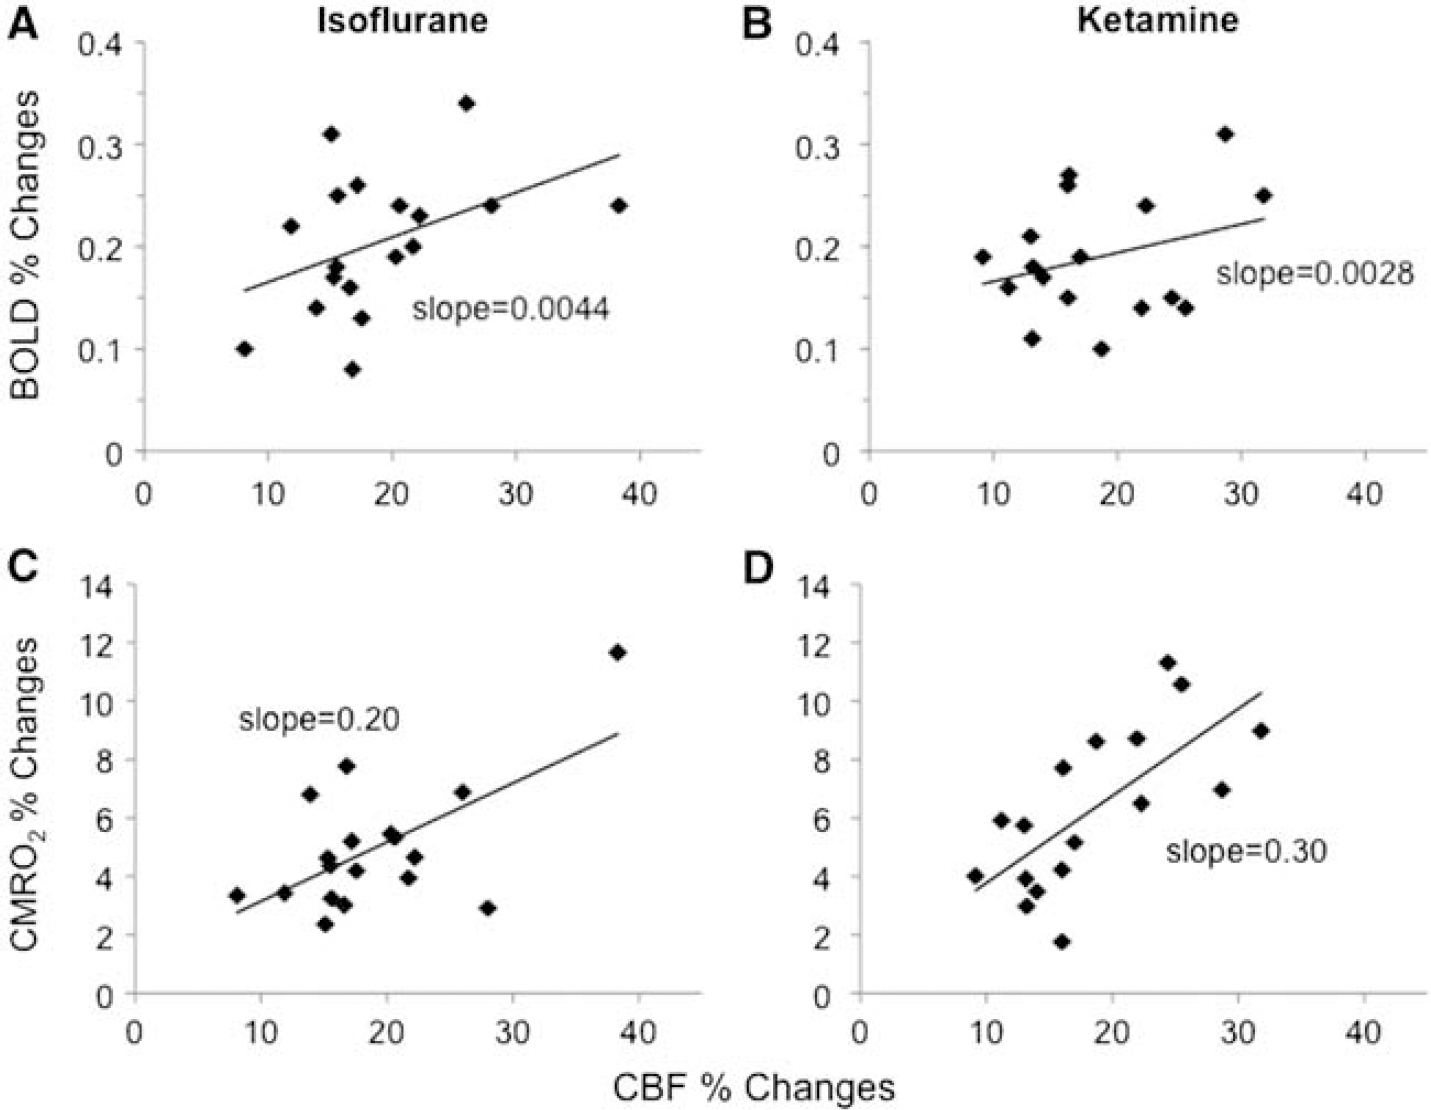
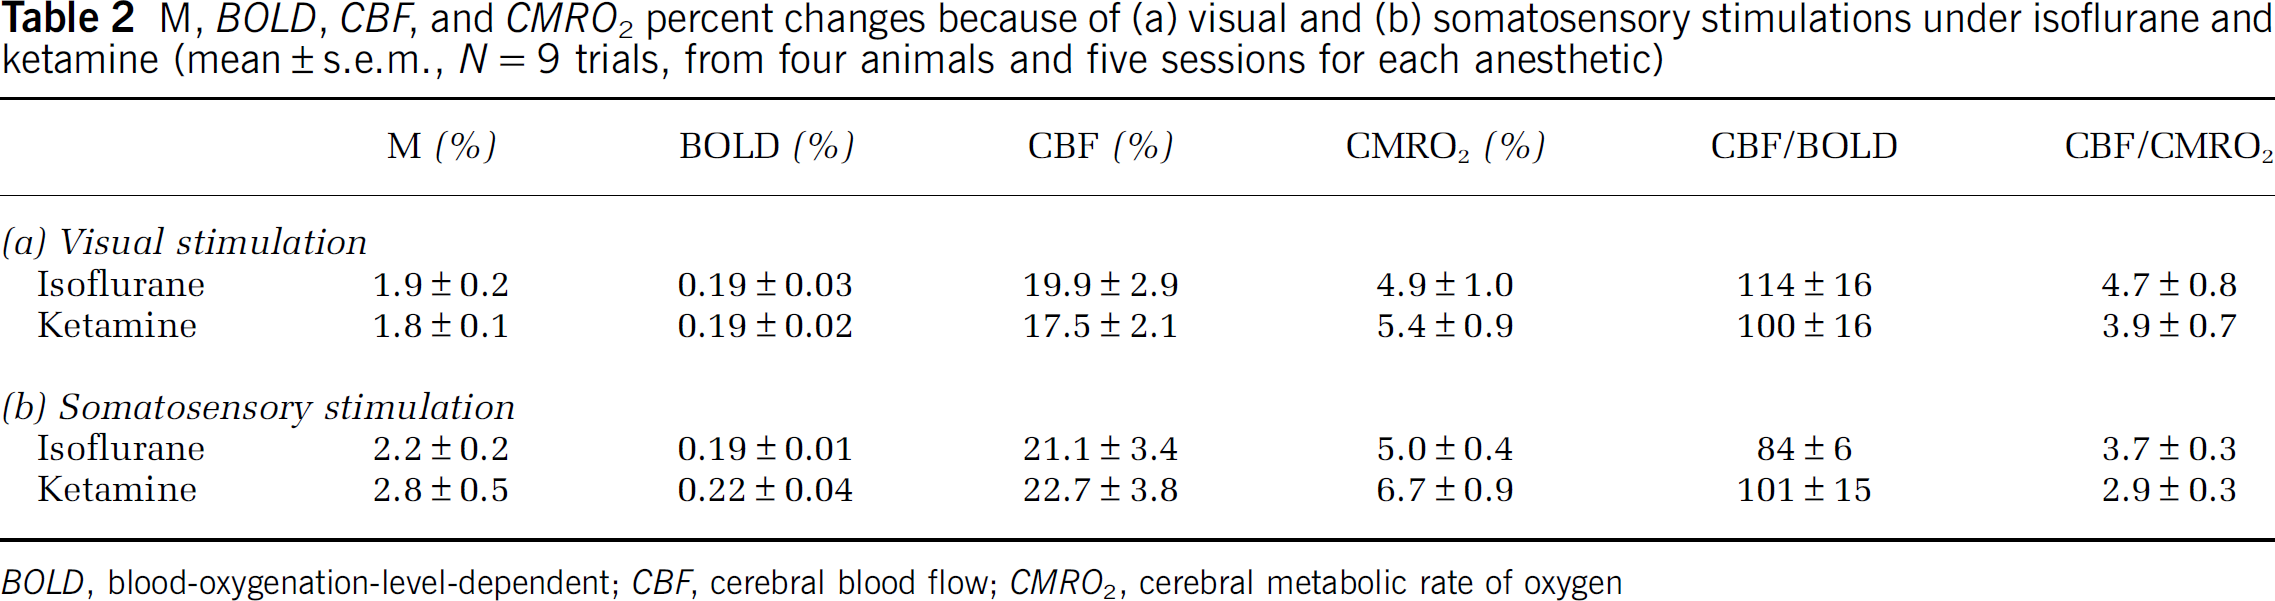
The group-averaged BOLD, CBF, CMRO2 changes are summarized in Table 2. The stimulus-evoked BOLD, CBF, and CMRO2 percent changes in V1 and S1 were not statistically different between the two anesthetics (P > 0.05). However, the CBF/CMRO2 coupling constants were slightly lower in S1 than in V1 under both anesthetics albeit not statistically different (P > 0.05), which could imply differences among different brain structures. The M-values and the percent CMRO2 changes were higher under ketamine than isoflurane in both V1 and S1, although not statistically significant. BOLD and CMRO2 percent changes are plotted against CBF percent changes for the two anesthetics in Figure 5.
Scatter plots of (top) blood-oxygenation-level-dependent (BOLD) versus cerebral blood flow (CBF) changes and (bottom) cerebral metabolic rate of oxygen (CMRO2) versus CBF changes by simultaneous visual and vibrotactile stimulations from individual trials (N = 9 for primary visual cortex and N = 9 for the primary somatosensory cortex).
M, BOLD, CBF, and CMRO2 percent changes because of (a) visual and (b) somatosensory stimulations under isoflurane and ketamine (mean ± s.e.m., N = 9 trials, from four animals and five sessions for each anesthetic)
This study demonstrates a multimodal MRI approach to study a large NHP (baboon) model under isoflurane and ketamine anesthetics on a clinical scanner. Basal quantitative CBF of GM and WM, BOLD and CBF fMRI changes associated with hypercapnic, visual, and vibrotactile stimulations are reliably detected in anesthetized baboons. Stimulus-evoked CMRO2 changes ranges from 4.9% to 6.7%, which are 2.9 to 4.7 times smaller than CBF changes. There are no major difference in baseline CBF, BOLD, CBF, and CMRO2 fMRI responses between the two commonly used anesthetics. This baboon fMRI model and fMRI protocol set the stage for future high-resolution functional, physiological, and metabolic mapping of normal brain functions and dysfunctions in disease states in large nonhuman primates.
Anesthetized Baboon Model
We have previously shown that, at a higher isoflurane dose (1.2% to 1.5%), fMRI responses to visual and vibrotactile stimulations were seldom detected (Wey et al, 2010). At 0.8% to 1.0% isoflurane, the animals remained adequately anesthetized as determined by the absence of pinching responses. Although gross motion was absent, BOLD fMRI at 0.8% to 1.0% isoflurane was often susceptible to signal drifts and large temporal fluctuations, likely because of minor motion and physiological noises. By contrast, with the combination of 0.8% to 1.0% isoflurane and vecuronium paralytic (or 6 to 8 mg/kg/h ketamine with paralytic), BOLD fMRI of visual and vibrotactile stimulations were robustly detected in the expected brain regions and were consistently detected within and across subjects. The mechanically ventilated animals were physiologically stable with normal blood–gas values, heart rate, arterial oxygen saturation, and end-tidal CO2. Paralysis was effectively reversed by neostigmine. Thus, all studies herein used paralytic.
Arterial Transit Time Estimation
The GM and WM ATT were 570 and 823 ms, respectively. These ATT values are consistent with those reported previously of 800 ms for whole brain in isoflurane-anesthetized rhesus (Zhang et al, 2007), and 742 ± 184 ms in GM, and 985 ± 187 ms in WM in remifentanil-anesthetized rhesus (Zappe et al, 2007). The GM and WM ATT in baboons are comparable or shorter than those reported in awake humans (600 to 1,200 ms (Gonzalez-At et al, 2000) and 730 to 970 ms (Yang et al, 2000)). Arterial transit time of NHPs is expected to be shorter than that of humans because of their smaller sizes. For the same reason, ATT in rhesus is expected to be shorter than that in baboons. However, ATT in baboons herein was shorter than that reported in remifentanil-anesthetized rhesus (Zappe et al, 2007). A possible explanation is that different ASL techniques could measure different ATTs. Pulsed ASL techniques, such as Flow-sensitive Alternating Inversion Recovery (FAIR), usually has the labeling slab more proximal to the imaging slices than those of pCASL, resulting in a shorter ATT (Yang et al, 2000). Moreover, the exact ROIs and the ASL model used may partially contribute to this discrepancy. The PLD herein of 0.7 seconds is not a universal optimal PLD across all slices. Three-dimensional scan and faster parallel imaging can be used to obtain the universal optimal PLD for CBF measurements.
Basal CBF
The literature on quantitative CBF in NHP is sparse and, to our knowledge, none has been reported in baboons using MRI. An early quantitative CBF study using positron emission tomography (PET) with 15O-H2O tracer on nitrous oxide sedated baboons reported a whole-brain CBF value of 54.7 mL per 100 g per minute (Kaufman et al, 2003). The apparent difference between our and this PET result may be because of different anesthetics and/or technical differences. Baseline CBF of GM and WM in this study was lower than those reported in isoflurane- (Zhang et al, 2007) and remifentanil-anesthetized (Zappe et al, 2007) macaques, but higher than those in awake human (Talagala et al, 2004). We were surprised to find no significant difference in basal CBF between isoflurane and ketamine, given that isoflurane is a known vasodilator (Sicard et al, 2003, 2005). However, the effect of ketamine on CBF is controversial. Either increase or no changes of CBF together with minor change in CMRO2 have been reported under ketamine (Långsjö et al, 2003; Lei et al, 2001), depending on the dosage, methods of ventilation, species, and so on. It is also possible that the comparatively low dose of isoflurane used herein has minimal vasodilatory effects (Sicard et al, 2003, 2005).
The CBF GM to WM ratios were 2.3 for both anesthetics studied, which are within the ranges of 1.7 to 3.0 reported previously using MRI (Pedersen et al, 2004; Talagala et al, 2004; Zhang et al, 2007) and 2.0 using PET (Ye et al, 2000) in human. This ratio may also be dependent on partial-volume effects and WM–GM segmentation methods.
Hypercapnic Responses and M-Values
Hypercapnia-induced percent BOLD changes were small because of the short TE (16 ms) used in the present study for simultaneous BOLD and CBF fMRI acquisition. Hypercapnia-induced CBF changes are in reasonable agreement with those reported in isoflurane-anesthetized rhesus (59 ± 10% (GM) and 37 ± 4% (WM)) (Zhang et al, 2007) and higher than those in awake humans (Davis et al, 1998; Hoge et al, 1999). The higher CBF percent changes in WM reported herein might be because of partial-volume effect.
The average M-values for the V1 were 1.9 ± 0.2% and 1.8 ± 0.1% and for S1 were 2.2 ± 0.2% and 2.8 ± 0.5% under isoflurane and ketamine respectively. Note that the percent BOLD changes and M-values were smaller than those typically reported in the literatures (that is, 3% to 22%) because a short TE was used. Short TE was chosen to obtain comparable BOLD and CBF fMRI contrast while minimizing inter-trial variations by avoiding separate acquisitions of BOLD and CBF fMRI data. However, stimulus-evoked CMRO2 changes should not be affected by the short TE used in calibrated fMRI. Although the isometabolic assumption of hypercapnia has been questioned recently by a few studies (Jones et al, 2005; Zappe et al, 2008), it remains widely used and many studies found no or negligible changes in CMRO2 with brief mild hypercapnia.
Neurovascular Coupling
Cerebral blood flow increased 20% (isoflurane) and 18% (ketamine) in response to visual stimulation and 21% (isoflurane) and 23% (ketamine) in response to vibrotactile stimulation. Cerebral blood flow fMRI associated with visual stimulation on rhesus monkeys reported 38% CBF changes using the FAIR (PASL) technique (Pfeuffer et al, 2004) and 24% using CASL (Zappe et al, 2007). We found no other CBF fMRI studies on large NHPs.
CBF/CMRO2 percent change ratios ranged from 2.9 to 4.7 under both isoflurane and ketamine, suggesting that the coupling relationship between CBF and CMRO2 is independent of the different anesthetic regimes used in this study. The CBF/CMRO2 coupling ratios are in reasonable agreement with those reported in recent MRI literatures on awake humans (2.8:1 (Davis et al, 1998) and 2.0:1 (Hoge et al, 1999)) and anesthetized rodents (3.2:1 (Mandeville et al, 1999) and 2.2:1 (Liu et al, 2004)). Our results show lower coupling ratios than those reported using PET (Fox and Raichle, 1986) which reported little CMRO2 changes during increased neural activity. However, it has been suggested that CMRO2 estimation with only BOLD and CBF measurements might result in an overestimation of CMRO2, which results in a smaller CBF/CMRO2 coupling constant of ~2 compared with the constant of ~5 to 10 estimated with different modeling methods, because of some assumptions made, such as the blood volume changes in response to stimuli (Lin et al, 2008). Calibration of the BOLD signal and the coupling relationship between CBF and CMRO2 remain as active areas of research. Our findings partly support the hypothesis of oxygen diffusion limitation proposed by Buxton and Frank (1997), although it remains plausible that the imbalance of stimulus-evoked increase in CBF is not to supply oxygen for oxidative metabolism, but rather predominantly to remove metabolic by-products or other functions. Stimulus-evoked CMRO2 changes may also depend on the types of stimuli, brain regions, and anesthetics, among others (Lin et al, 2010; Liu et al, 2004). Hoge et al (1999) and Lin et al (2010) estimated the adenosine triphosphate yield under stimulus-evoked oxidative metabolism in the brain and concluded that the magnitude of increased CMRO2, although smaller than CBF changes, was sufficient to fuel the increased neuronal activity because of the efficient oxidative pathway. The disproportionally large stimulus-evoked increase in glucose consumption, which has been consistently reported in the literature (Fox et al, 1988), remains to be accounted for if such increase was not driven by metabolic demand and/or fueled the inefficient nonoxidative metabolism.
Isoflurane Versus Ketamine
For the dosages herein, both anesthetics yielded similar fMRI percent changes, although there were some trends toward differences. Basal CBF was overall similar under isoflurane and ketamine. Cerebral blood flow and BOLD fMRI percent changes were also similar between cortices and between anesthetics. Stimulus-evoked CMRO2 changes because of both visual and vibrotactile stimuli were smaller under isoflurane than ketamine, but without statistical difference. It has been suggested that ketamine slightly increases global metabolism relative to awake condition (Alkire et al, 2008), whereas CMRO2 decreases under isoflurane with increased level of anesthesia (Cucchiara et al, 1974). These observations appear to support the notion that isoflurane suppresses the neuronal activity more than ketamine, as demonstrated in a PET study on anesthetized rats (Matsumura et al, 2003).
Multimodal fMRI, including imaging oxygen consumption changes, in a single setting over the entire brain could have many important applications on large NHPs, where noninvasive, longitudinal imaging is preferred or necessary. One application is in fMRI of disease states, in which neural-vascular coupling is perturbed, such as in stroke and epilepsy. In disease states, BOLD response may become more difficult to interpret. Cerebral blood flow and CMRO2 changes could be a better indicator of the underlying changes in brain dysfunctions. It could also offer a means to resolve disease-related perturbations in hemodynamic coupling and oxygen metabolism. Another application of CMRO2 imaging is in pharmacological fMRI. After drug administration, the baseline physiological states of the brain are likely to be different regionally or globally because of drug-induced changes in respiration rates, blood pressure and/or volume, and drug-induced vasodilation or vasoconstriction. These alterations, which are independent of the drug-induced changes in neural activity, could markedly affect the BOLD fMRI signals. Cerebral metabolic rate of oxygen imaging could provide a means to differentiate nonneural from neural drug effects in pharmacological fMRI.
In conclusion, this study established a multimodal fMRI protocol on a large baboon model for investigating basal CBF, and BOLD, CBF, and CMRO2 fMRI changes on a clinical scanner. To our knowledge, this is the first report of quantitative CBF and multimodal fMRI measurements on baboons. The magnitude of stimulus-evoked CMRO2 changes is consistent with partial uncoupling of CBF and oxygen consumption during increased neural activity. Cerebral metabolic rate of oxygen imaging has the potential to provide valuable insight into the underlying neural-vascular coupling and the BOLD signal sources. This model and imaging protocol are also expected to have important applications in fMRI of disease states and pharmacological fMRI in large NHPs, in which the baseline physiology is dynamically perturbed. Future studies will include improvement of spatial resolution and applications to neuroscience research, stroke, and epilepsy.
Footnotes
Acknowledgements
The authors thank Dr Jinqi Li, Dr Michelle Leland, and Ms Lisa Jones for technical supports.
The authors declare no conflict of interest.
References
1.
AlkireMTHudetzAGTononiG (2008) Consciousness and anesthesia. Science322:876–80
2.
BuxtonRBFrankLR (1997) A model for the coupling between cerebral blood flow and oxygen metabolism during neural stimulation. J Cereb Blood Flow Metab17:64–72
3.
ChenLMTurnerGHFriedmanRMZhangNGoreJCRoeAWAvisonMJ (2007) High-resolution maps of real and illusory tactile activation in primary somatosensory cortex in individual monkeys with functional magnetic resonance imaging and optical imaging. J Neurosci27:9181–91
4.
CucchiaraRFTheyeRAMichenfelderJD (1974) The effects of isoflurane on canine cerebral metabolism and blood flow. Anesthesiology40:571–4
5.
DavisTLKwongKKWeisskoffRMRosenBR (1998) Calibrated functional MRI: mapping the dynamics of oxidative metabolism. Proc Natl Acad Sci USA95:1834–9
6.
DubowitzDJBernheimKAChenDYBradleyWGJrAndersenRA (2001) Enhancing fMRI contrast in awake-behaving primates using intravascular magnetite dextran nanopartieles. Neuroreport12:2335–40
7.
DuongTQ (2010) Diffusion tensor and perfusion MRI of non-human primates. Methods50:125–35
8.
FoxPTRaichleME (1986) Focal physiological uncoupling of cerebral blood flow and oxidative metabolism during somatosensory stimulation in human subjects. Proc Natl Acad Sci USA83:1140–4
GamlinPDWardMKBoldingMSGrossmannJKTwiegDB (2006) Developing functional magnetic resonance imaging techniques for alert macaque monkeys. Methods38:210–20
11.
Gonzalez-AtJAlsopDDetreJ (2000) Cerebral perfusion and arterial transit time changes during task activation determined with Continuous Arterial Spin Labeling. Magn Reson Med43:739–46
12.
GreerPJVillemagneVLRuszkiewiczJGravesAKMeltzerCCMathisCAPriceJC (2002) MR atlas of the baboon brain for functional neuroimaging. Brain Res Bull58:429–38
13.
HerscovitchPRaichleME (1985) What is the correct value for the brain-blood partition coefficient for water?J Cereb Blood Flow Metab5:65–9
14.
HogeRDAtkinsonJGillBCrelierGRMarrettSPikeGB (1999) Linear coupling between cerebral blood flow and oxygen consumption in activated human cortex. Proc Natl Acad Sci USA96:9403–8
15.
JonesMBerwickJHewson-StoateNGiasCMayhewJ (2005) The effect of hypercapnia on the neural and hemodynamic responses to somatosensory stimulation. NeuroImage27:609–23
16.
KaufmanJAPhillips-ConroyJEBlackKJPerlmutterJS (2003) Asymmetric regional cerebral blood flow in sedated baboons measured by positron emission tomography (PET). Am J Phys Anthropol121:369–77
17.
KetySSSchmidtCF (1948) The effects of altered arterial tensions of carbon dioxide and oxygen on cerebral blood flow and cerebral oxygen consumption of normal young men. J Clin Invest27:484–91
18.
KochunovPDavisMD (2010) Development of structural MR brain imaging protocols to study genetics and maturation. Methods50:136–46
19.
LångsjöJWKaistiKKAaltoSHinkkaSAantaaROikonenVSipiläHKurkiTSilvantoMScheininH (2003) Effects of subanesthetic doses of ketamine on regional cerebral blood flow, oxygen consumption, and blood volume in humans. Anesthesiology99:614–23
20.
LeiHGrinbergONwaigweCIHouHGWilliamsHSwartzHMDunnJF (2001) The effects of ketamine-xylazine anesthesia on cerebral blood flow and oxygenation observed using nuclear magnetic resonance perfusion imaging and electron paramagnetic resonance oximetry. Brain Res913:174–9
21.
LinA-LFoxPTYangYLuHTanL-HGaoJ-H (2008) Evaluation of MRI models in the measurement of CMRO2 and its relationship with CBF. Magn Reson Med60:380–9
22.
LinALFoxPTHardiesJDuongTQGaoJH (2010) Nonlinear coupling between cerebral blood flow, oxygen consumption, and ATP production in human visual cortex. Proc Natl Acad Sci USA107:8446–51
23.
LiuZMSchmidtKFSicardKMDuongTQ (2004) Imaging oxygen consumption in forepaw somatosensory stimulation in rats under isoflurane anesthesia. Magn Reson Med52:277–85
24.
LogothetisNKGuggenbergerHPeledSPaulsJ (1999) Functional imaging of the monkey brain. Nat Neurosci2:555–62
25.
LuHClingmanCGolayXvan ZijlPC (2004) Determining the longitudinal relaxation time (T1) of blood at 3.0 Tesla. Magn Reson Med52:679–82
26.
MandevilleJBMarotaJJAyataCMoskowitzMAWeisskoffRMRosenBR (1999) MRI measurement of the temporal evolution of relative CMRO2 during rat forepaw stimulation. Magn Reson Med42:944–51
27.
MatsumuraAMizokawaSTanakaMWadaYNozakiSNakamuraFShiomiSOchiHWatanabeY (2003) Assessment of microPET performance in analyzing the rat brain under different types of anesthesia: comparison between quantitative data obtained with microPET and ex vivo autoradiography. NeuroImage20:2040–50
28.
PedersenMKlarhöferMChristensenSOualletJ-COstergaardLDoussetVMoonenC (2004) Quantitative cerebral perfusion using the PRESTO acquisition scheme. J Magn Reson Imaging20:930–40
29.
PfeufferJMerkleHBeyerleinMSteudelTLogothetisNK (2004) Anatomical and functional MR imaging in the macaque monkey using a vertical large-bore 7 Tesla setup. Magn Reson Imag22:1343–59
30.
SicardKShenQBrevardMESullivanRWFerrisCFKingJADuongTQ (2003) Regional cerebral blood flow and BOLD responses in conscious and anesthetized rat under basal and hypercapnic conditions: implication for functional MRI studies. J Cereb Blood Flow Metab23:472–81
31.
SicardKMDuongTQ (2005) Effect of hypoxia, hyperoxia and hypercapnia on baseline and stimulus-evoked BOLD, CBF and CMRO2 in spontaneously breathing animals. Neuroimage25:850–8
32.
TalagalaSLYeFQLeddenPJChesnickS (2004) Whole-brain 3D perfusion MRI at 3.0 T using CASL with a separate labeling coil. Magn Reson Med52:131–40
33.
VanduffelWFizeDMandevilleJBNelissenKVan HeckePRosenBRTootellRBOrbanGA (2001) Visual motion processing investigated using contrast agent-enhanced fMRI in awake behaving monkeys. Neuron32:565–77
34.
WangJAlsopDCLiLListerudJGonzalez-AtJBSchnallMDDetreJA (2002) Comparison of quantitative perfusion imaging using arterial spin labeling at 1.5 and 4.0 Tesla. Magn Reson Med48:242–54
35.
WeyH-YLiJSzabóCAFoxPTLelandMMJonesLDuongTQ (2010) BOLD fMRI of visual and somatosensory-motor stimulations in baboons. NeuroImage52:1420–7
36.
WibralMMuckliLMelnikovicKSchellerBAlinkASingerWMunkMH (2007) Time-dependent effects of hyperoxia on the BOLD fMRI signal in primate visual cortex and LGN. NeuroImage35:1044–63
37.
WuWCFernandez-SearaMDetreJAWehrliFWWangJ (2007) A theoretical and experimental investigation of the tagging efficiency of pseudocontinuous arterial spin labeling. Magn Reson Med58:1020–7
38.
YangYEngelienWXuSGuHSilbersweigDASternE (2000) Transit time, trailing time, and cerebral blood flow during brain activation: measurement using multislice, pulsed spin-labeling perfusion imaging. Magn Reson Med44:680–5
39.
YeFQBermanKFEllmoreTEspositoGvan HornJDYangYDuynJSmithAMFrankJAWeinbergerDRMcLaughlinAC (2000) H(2)(15)O PET validation of steady-state arterial spin tagging cerebral blood flow measurements in humans. Magn Reson Med44:450–6
40.
ZappeACReicholdJBurgerCWeberBBuckAPfeufferJLogothetisNK (2007) Quantification of cerebral blood flow in nonhuman primates using arterial spin labeling and a two-compartment model. Magn Reson Imaging25:775–83
41.
ZappeACUludağKOeltermannAUğurbilKLogothetisNK (2008) The influence of moderate hypercapnia on neural activity in the anesthetized nonhuman primate. Cerebral Cortex18:2666–73
42.
ZhangXNagaokaTAuerbachEJChampionRZhouLHuXDuongTQ (2007) Quantitative basal CBF and CBF fMRI of rhesus monkeys using three-coil continuous arterial spin labeling. Neuroimage34:1074–83