
Abstract
Nicotinamide adenine dinucleotide (NADH) imaging can be used to monitor neuronal activation and ascertain mitochondrial dysfunction, for example during hypoxia. During neuronal stimulation in vitro, NADH normally becomes more oxidized, indicating enhanced oxygen utilization. A subsequent NADH overshoot during activation or on recovery remains controversial and reflects either increased metabolic activity or limited oxygen availability. Tissue Po2 measurements, obtained simultaneously with NADH imaging in area CA1 in hippocampal slices, reveal that during prolonged train stimulation (ST) in 95% O2, a persistent NADH oxidation is coupled with increased metabolic demand and oxygen utilization, for the duration of the stimulation. However, under conditions of either decreased oxygen supply (ST-50% O2) or enhanced metabolic demand (K+-induced spreading depression (K+-SD) 95% O2) the NADH oxidation is brief and the redox balance shifts early toward reduction, leading to a prolonged NADH overshoot. Yet, oxygen utilization remains elevated and is correlated with metabolic demand. Under these conditions, it appears that the rate of NAD+ reduction may transiently exceed oxidation, to maintain an adequate oxygen flux and ATP production. In contrast, during SD in 50% O2, the oxygen levels dropped to a point at which oxidative metabolism in the electron transport chain is limited and the rate of utilization declined.
Introduction
The mitochondrial NADH/NAD+ redox pair is the source of electrons for cell respiration and can be monitored in situ because the reduced form (nicotinamide adenine dinucleotide (NADH)) is fluorescent when excited by UV light at 360 nm (Aubin, 1979). Its fluorescence cannot be distinguished from that of nicotinamide adenine dinucleotide phosphate (NADPH), but NADH dominates the autofluorescence of brain tissue during resting conditions and with increased metabolic activity (Foster et al, 2005). Measurements of activity-dependent changes in NADH/NAD+ redox state, with real-time fluorescence imaging of NADH in vivo as well as in vitro, can estimate the rate of oxidative energy metabolism, especially work expended in ion transport (Chance et al, 1962; Kann et al, 2003; Lewis and Schuette, 1975; Rosenthal and Jobsis, 1971; Shuttleworth et al, 2003).
Physiological stimulation, seizure-like discharges, and normoxic spreading depression (SD) all lead to an NADH fluorescence decrease in well-oxygenated tissue (in vitro and in vivo), followed by either recovery to baseline or an increase (i.e., overshoot) above baseline (Lothman et al, 1975; Rosenthal and Jobsis, 1971; Rosenthal and Somjen, 1973; Schuchmann et al, 2001; Shuttleworth et al, 2003; Takano et al, 2007). The initial NADH decrease represents enhanced NADH oxidation in the electron transport chain, accompanied by increased oxygen utilization (Foster et al, 2005; Turner et al, 2007).
However, the presence of a subsequent NADH overshoot, either during the activation or on recovery, remains controversial. Reports from numerous laboratories suggest that the reduction phase of the NADH biphasic response occurs as a result of the stimulation of metabolic pathways that generate NADH (Galeffi et al, 2007) such as the tricarboxylic acid (TCA) cycle (Kann et al, 2003) and glycolysis (Kasischke et al, 2004). However, increased reduction may also signal the presence of an imbalance between oxygen supply and demand (Mayevsky and Chance, 2007) and limited mitochondrial oxidative capacity (Foster et al, 2005; Huchzermeyer et al, 2008). For example, during cerebral hypoxia NADH fluorescence increases in response to stimulation, indicating predominant reduction (Chance et al, 1962; LaManna et al, 1984).
Simultaneous monitoring of tissue PO2 and NADH fluorescence can reveal the rate of O2 utilization during increased neuronal activity, in addition to the redox state of the NADH/NAD+ system (Foster et al, 2005). After 25 seconds train stimulation, the onset of the reduction phase of the NADH response usually coincides with the maximal decrease in tissue PO2 (Foster et al, 2005; Galeffi et al, 2007), suggesting that limited cellular oxygen availability causes a transient shift of the mitochondrial redox state toward reduction (Chance et al, 1973; LaManna et al, 1984; Mayevsky and Weiss, 1991; Turner et al, 2007). In addition, differences in the profile of redox responses of NADH/NAD+ in hippocampal slices, compared with the intact brain, have been related to the lack of increased oxygen supply (Turner et al, 2007) normally provided by neurovascular coupling during neuronal activation (Leniger-Follert, 1985; Offenhauser et al, 2005).
However, changes in tissue PO2 and its relationship with the NADH signal and neuronal evoked activity have not been investigated in detail under conditions of either decreased oxygen supply or enhanced metabolic demand (such as normoxic spreading depression (K+-SD)), in hippocampal slices. We now investigate energy metabolism associated with the NADH response to determine if the enhanced NADH reduction phase under these conditions represents either reduced oxidative capacity in the mitochondria or simply a transient shift of the cellular redox balance to maintain an adequate rate of ATP production. We varied the metabolic load by either increasing the intensity of electrical stimulation or by inducing SD with microinjection of KCl solution, and also varied ambient oxygen levels, while simultaneously measuring NADH fluorescence, tissue oxygen levels, DC potential, and field excitatory postsynaptic potential (fEPSP).
Materials and methods
Tissue Slice Preparation
All animal use was approved by the Duke University and Durham VAMC Animal Care and Use Committees. Adult male Fischer 344 rats (2 to 3 months old, Harlan, Indianapolis, IN, USA) were anesthetized with isofluorane (Hospira Inc., Lake Forest, IL, USA) in an anesthesia induction chamber until respirations ceased. After the animal was decapitated, the brain was removed from the skull and placed in ice-cold artificial cerebrospinal fluid, then the hippocampus was rapidly dissected. Transverse hippocampal slices (400 μm) were obtained using a tissue chopper, and allowed to recover for 2 h at 22°C in an oxygenated chamber (Foster et al, 2005). Slices were then transferred to a recording interface chamber, continuously perfused (1.5 mL/min) with artificial cerebrospinal fluid solution consisting of (in mM): NaCl, 124; KCl, 3.0; NaH2PO4, 1.25; NaHCO3, 24; CaCl2, 2.00; MgSO4, 2.00; dextrose, 10; pH 7.4, and aerated with 95% O2−5% CO2 (Fayuk et al, 2002). The temperature in the chamber was kept at 36.5°C to 37°C for all experimental conditions.
Electrophysiological Recording and Synaptic Stimulation
The Schaffer collateral/commissural pathway was stimulated with a bipolar electrode situated in the stratum radiatum of the CA1 hippocampal region using single pulses (100 microseconds, 0.1 to 0.3 Hz) in the range of 60 to 150 μA. Extracellular glass microelectrodes filled with 0.2 mol/L NaCl (4 to 8 MΩ) were coupled to a DC amplifier and placed in CA1 stratum radiatum, to record both evoked fEPSP and DC (V0) potential. Stimulation of the Schaffer collateral/commissural bundle evokes in CA1 stratum radiatum a predominantly negative extracellular wave of mixed composition. The largest contribution to this signal results from EPSPs of the population of pyramidal neurons, conventionally designated as fEPSP (Chebabo et al, 1995). After plotting an I/O curve to establish the stimulus required for saturation values for fEPSP, the stimulus current was adjusted to evoke an fEPSP of ~60% of maximal amplitude. To generate the biphasic NADH fluorescence response, a stimulus train (ST) of 25 to 90 seconds (100 microseconds pulses at 10 Hz) was delivered.
K+-Induced Spreading Depression
To induce a normoxic SD (K+-SD) wave in the CA1 region, 1 mol/L KCl was microinjected (pressure: 20 to 60 lb/in2; 20 to 100 milliseconds) using a Picospritzer (General Valve) via a glass micropipette at the subiculum border (at ~100 μm depth) in the slice, away from the region of interest (Aitken et al, 1998).
NADH Fluorescence Imaging and Analysis
NADH fluorescence in hippocampal slices was monitored using a 290 to 370 nm excitation filter and a 420-nm long pass filter for the emission (Omega Optical, Brattleboro, VT, USA) as previously described by our laboratory (Foster et al, 2005). The light source was a Lambda DG-4 (Sutter Instruments, Novato, CA, USA) equipped with a stabilized xenon arc lamp. Slices were epiilluminated with an incident angle of 45° and imaged through an upright microscope with a × 4 objective (N.A. 0.13) (UM-2, Nikon, Melville, NY, USA). Slices were imaged using a linear, cooled 12-bit CCD camera (Cooke Instruments Sensicam QE, Auburn Hills, MI, USA) with 1280 × 1024 digital spatial resolutions. NADH images were acquired every 5 seconds as 8 × 8 binned images (160 × 128 pixels) to obtain stable digital images of fluorescence intensity between 1000 and 2000 OD (camera gain of 4 photons/level) with high-quality signal/noise ratios, as well as shorter exposure time (~300 milliseconds) to avoid tissue damage. The images were stored on a computer as 12-bit files (4096 intensity level). Each binned pixel corresponded to a slice region of 144 μm2. Only those slices with a stable baseline (≤ 5% drift of fluorescence over 10 minutes) were used for data analysis. Changes in NADH calculated for region of interest were expressed as the percentage changes in fluorescence over the baseline levels before experimental manipulation ((ΔF/Fb) × 100). The baseline fluorescence drift was corrected using a curve fitting program and linear regression (Prism; Graph Pad, San Diego, CA, USA). To measure the integrated effect of the stimulation on the NADH fluorescence change over the baseline over time, we calculated the area of the NADH oxidation and reduction phase: values are expressed as ((ΔF/Fb) × 100) × duration in seconds. Data were analyzed for statistical significance using, t-test or analysis of variance followed by Tukey's multicomparison test and are presented as the mean ± s.d.
Oxygen Recording
A Clark-style oxygen microsensor (model 737gc, tip diameter 10 μm, Diamond General, Ann Arbor, MI, USA; or OX10, Unisense, Aarhus, Denmark) was used to measure brain tissue PO2 (Foster et al, 2005). The sensor consisted of a glass-insulated Ag/AgCl reference anode with guard cathode. The sensor was connected to a polarographic amplifier (Chemical Microsensor II, Diamond General or PA2000 picoammeter, Unisense) and the cathode was polarized at −800 mV before use. To determine the Po2 values in mm Hg, the sensor was calibrated before and after every experiment using saline solution (at ~36°C) equilibrated either with 95% O2−5% CO2 or 21% O2; and 0% O2 (medical grade). For tissue Po2 measurements, the sensor was positioned in the stratum radiatum close to the recording electrode, and manually lowered into the tissue at 50 μm intervals using a micrometer to a depth at which the Po2 was at the minimum (nadir) (Foster et al, 2005). Signals were A/D converted and recorded at 1 Hz. As induction of K+-SD results in a large drop in [Cl−]0 (Somjen, 2001), we also calibrated the oxygen sensor using a chloride-free solution, where Cl− was substituted with SO−4; the calibration readings at 21% and 0% O2 were not different than in saline solution. The oxygen sensor response time was of 216 ± 17 milliseconds and of 235 ± 22 milliseconds for 10 to 90% drop of Po2 during abrupt changes in ambient oxygen from 21% O2 to 0% O2 and from 21% O2 to 95% O2, respectively (n = 12). The oxygen sensors from both Diamond-General and Unisense had comparable response times.
The amplitude of the Po2 transients evoked by synaptic stimulation or SD was calculated by the equation: ΔPo2 = (Po2(baseline)–Po2(stim)), where ‘baseline’ refers to the Po2 measured before the stimulation. The initial slope of the tissue Po2 decrease (the rate of oxygen disappearance) has been reported to be an indicator of local oxygen utilization (Leniger-Follert, 1977; Offenhauser et al, 2005). Because of technical limitations we did not attempt to calculate the actual rate of oxygen consumption from the initial slope, which requires the determination of O2 solubility. Here, we estimate the rate of oxygen disappearance in the tissue, by calculating the initial slope of tissue Po2 response (ΔPo2/Δt; expressed as mm Hg/sec) after onset of the stimulation (Buerk and Nair, 1993). Data are presented as the mean ± s.d.
Results
Tissue Po2 Response, NADH Biphasic Response, and Field Potentials During Various Lengths and Intensities of Train Stimulation
As previously shown (Foster et al, 2005), stimulation of Schaffer collaterals in hippocampal slices (10 Hz, 25 seconds, ~60% of the maximum fEPSP) resulted in a reproducible tissue Po2 and NADH biphasic response consisting of an initial fluorescence decrease, which is followed by an NADH fluorescence overshoot, recorded in stratum radiatum of the CA1 region (Figures 1A and 1C). Tissue Po2 dropped rapidly at the onset of the stimuli during a 25-second train, because of a rapid increase in mitochondrial oxygen utilization, and reached the minimum levels at the end of the stimulation. It is possible that in hippocampal slices local oxygen availability may decrease below a threshold level either during or after the stimulation, shifting the redox balance toward reduction and therefore contributing to the appearance of the NADH overshoot. To test this hypothesis, we increased both the duration and then the intensity of the train. When the stimulation was extended to 90 seconds, the time to minimum for tissue Po2 was 52 ± 5.8 seconds. In both cases, the tissue Po2 recovered rapidly at the end of the stimulation (Figure 1B). The drop in tissue Po2 during a train stimulation of 90 seconds duration was significantly larger than with 25 seconds duration (171.4 ± 56.3 mm Hg and 119.4 ± 52.15 mm Hg for 90 and 25 seconds stimulation, respectively) (Figure 1E). The Po2 level dropped on average from the 347 ± 51 mm Hg baseline Po2 level at the center of the slice to a minimum of 175 ± 91 mm Hg (90 seconds train) (n = 11), indicating there was still sufficient oxygen available for utilization.
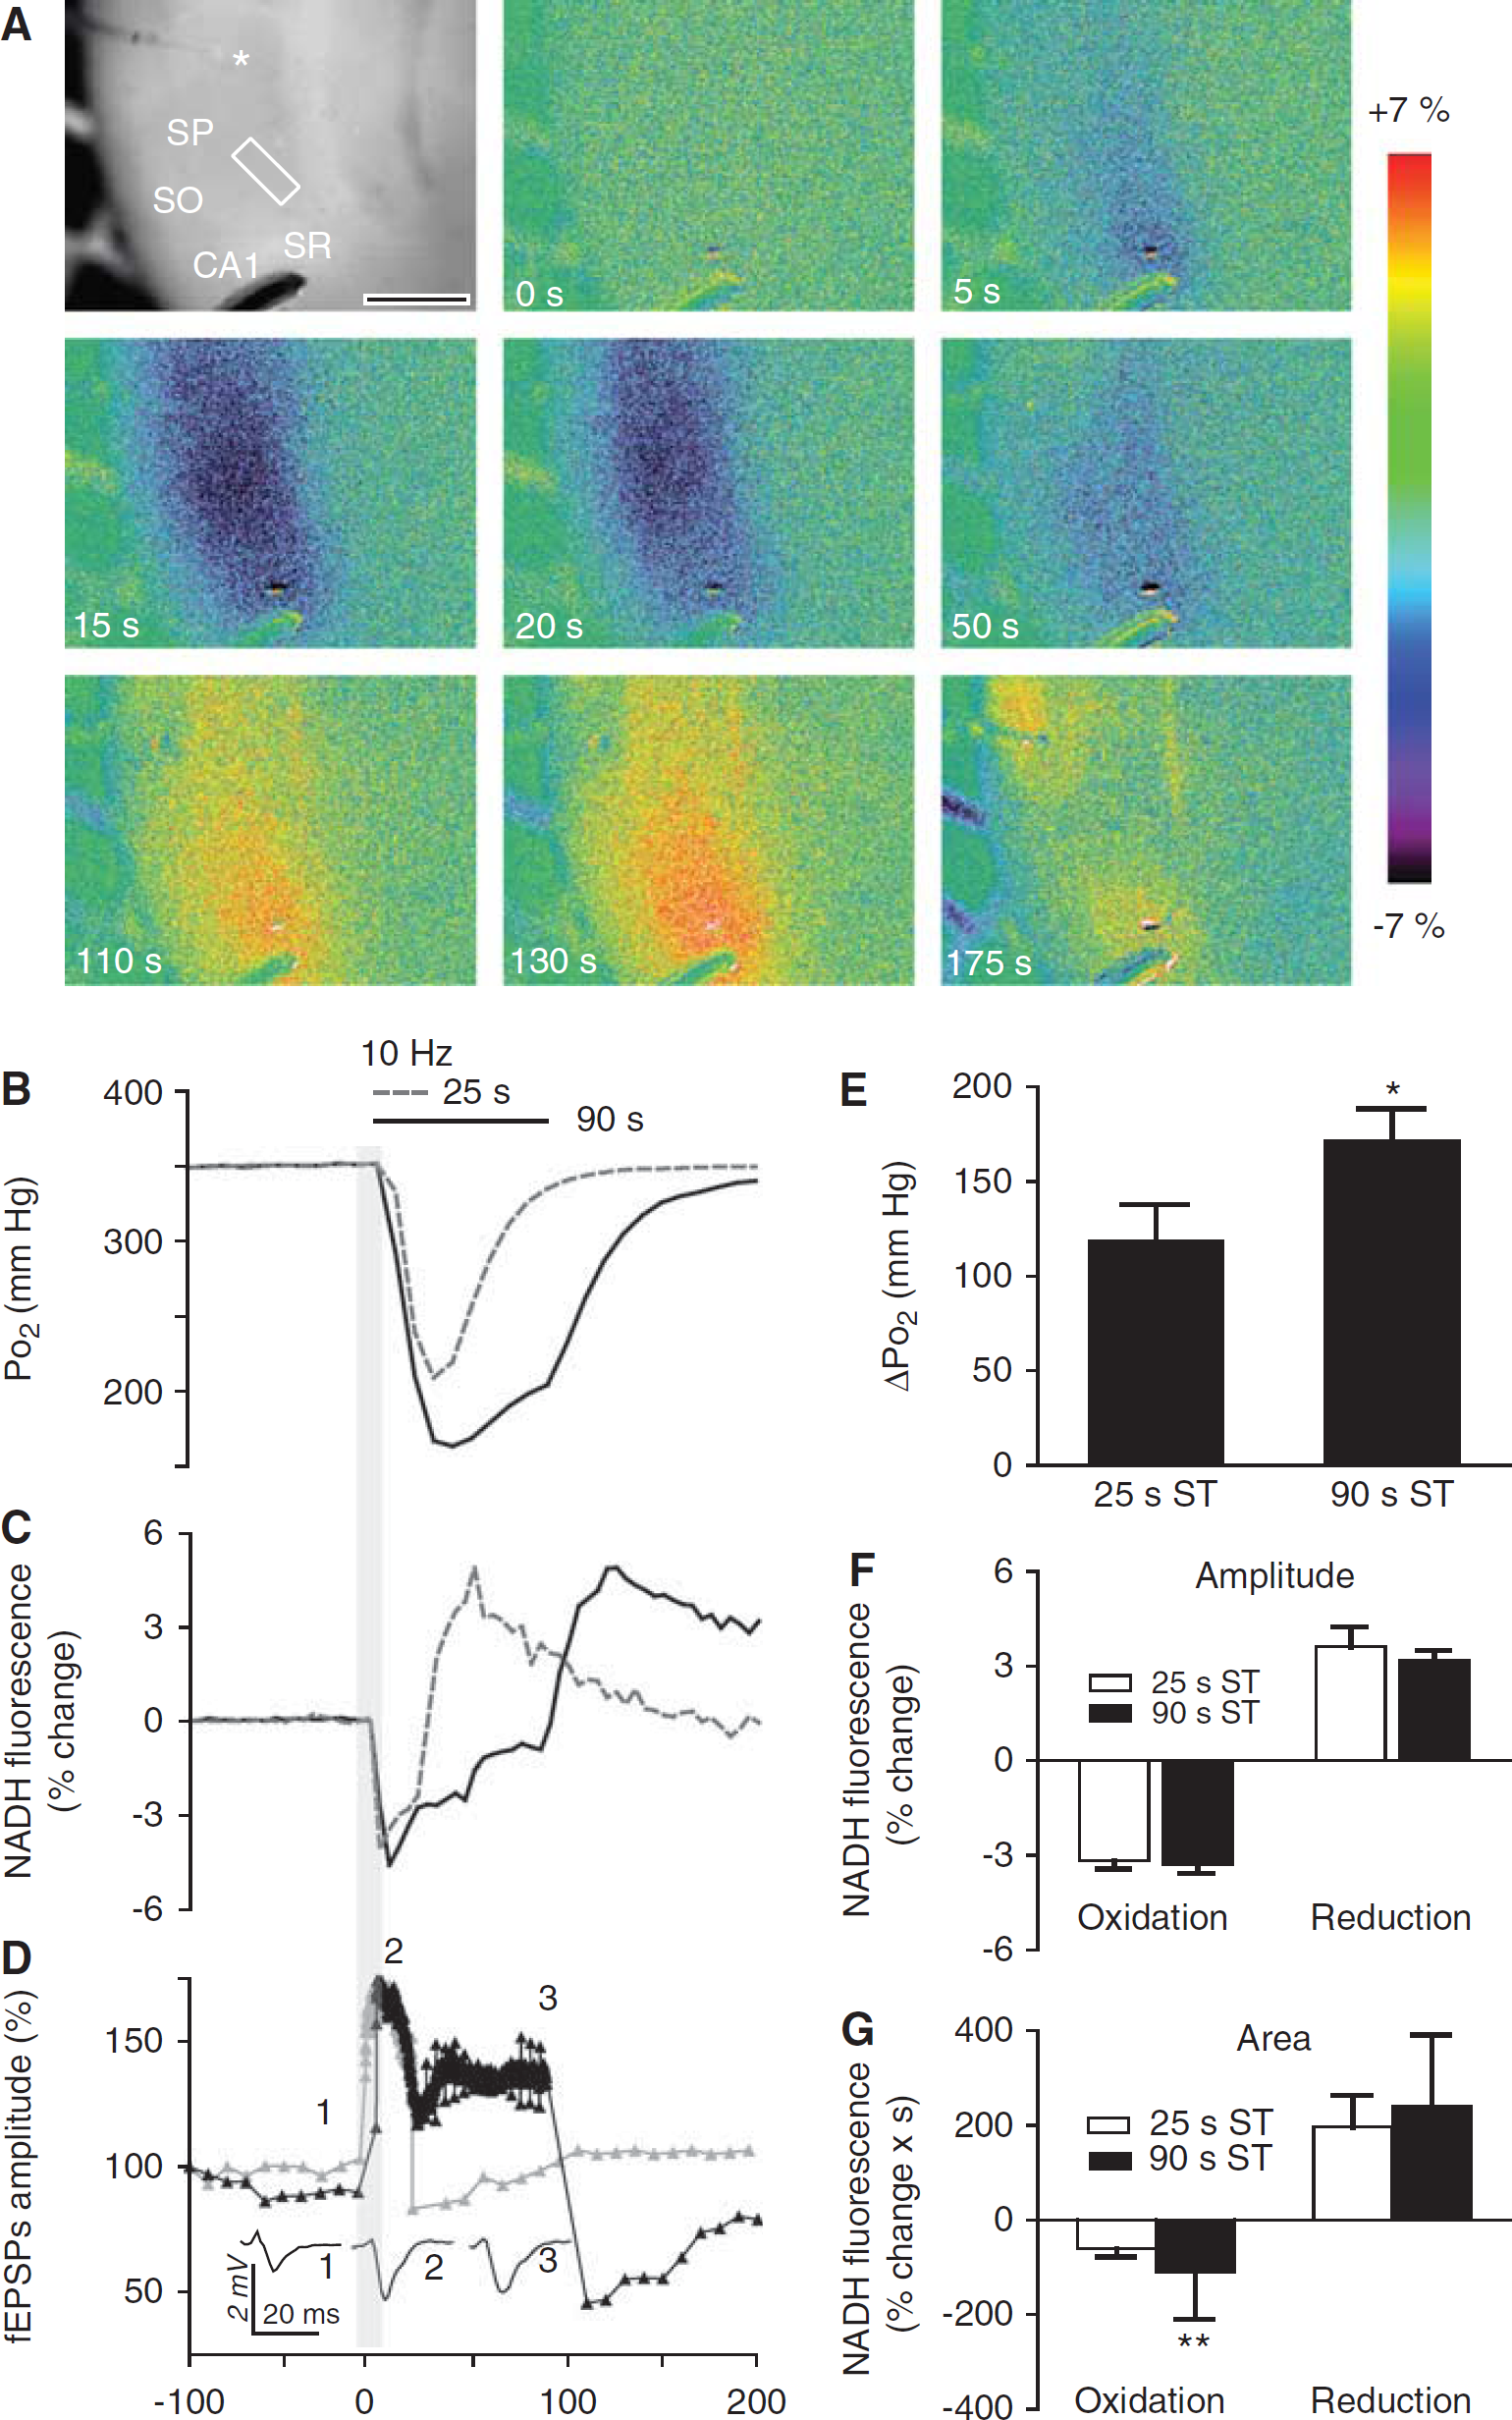
Simultaneous recording of tissue Po2, nicotinamide adenine dinucleotide (NADH) fluorescence, and field excitatory postsynaptic potential (fEPSP) during synaptic train stimulation. (
In contrast to the tissue Po2 response, the peak amplitude of the NADH oxidation was not significantly different during the more prolonged stimu lation (ΔF/F = −3.2% ± 0.73% for 25 seconds and −3.3% ± 0.1.7% for 90 seconds train stimulation) (Figure 1F); the NADH fluorescence reached a minimum within 10 to 15 seconds during both 25 seconds stimulation and 90 seconds trains, despite the continued decrease of tissue Po2 recorded at this time (Figure 1B). This was similar to observations in hippocampal slice cultures (Huchzermeyer et al, 2008) and in the intact brain (Lothman et al, 1975; Rosenthal and Somjen, 1973), all of which indicate that when stimulation continued longer than 15 seconds the time to minimum for NADH was independent of the train duration. As the NADH fluorescence remained below baseline levels (i.e., oxidized) during the stimulation (Figures 1A and 1C), the area of the oxidation phase was significantly larger during the more prolonged stimulation (ΔF/F × seconds = 60.58 ± 16.8 for 25 seconds and 110.5 ± 40.6 for 90 seconds train stimulation) (Figure 1G).
It appears that oxygen availability in 95% O2 was sufficient to maintain the redox balance shifted toward oxidation during both train durations. In contrast to previous observations (Kasischke et al, 2004), we have found that the time course of the NADH overshoot was dependent on the stimulus duration. That is, the time to peak for the reduction phase of the NADH response was 57.3 ± 6.8 seconds (n = 8) for the 25 seconds and 123 ± 6.9 seconds (n = 11) for the 90 seconds stimulation. However, neither the amplitude (ΔF/F = 3.6% ± 0.9% and 3.2% ± 1% after 25 and 90 seconds train stimulations, respectively) nor the area of the NADH overshoot (ΔF/F × s = 196.2 ± 68.8 for 25 seconds and 245.1 ± 67.90 for 90 seconds train stimulation) were significantly different after 25 and 90 seconds train (Figures 1F and 1G).
Consistent with similar observations (Pitler and Landfield, 1987), the amplitudes of the fEPSP (Figure 1D) during the train increased initially to 130.8% ± 22.3% of baseline values, but then declined to a lower plateau level and were maintained at 108.8% ± 23.7% of pretrain values by the end of the stimulation (n = 7). Therefore, the attenuated synaptic activity during prolonged trains together with other factors may contribute to the lessening of the Po2 deficit by 16.6 ± 10.1 mm Hg (n = 11) from its peak value observed during the last 30 seconds of the train (Figure 1B), possibly indicating a decreased oxygen demand before the end of the stimulation.
In the foregoing experiments, fEPSPs were elicited using ~60% of the stimulation intensity required for a maximal response. To determine the effect of increasing metabolic load on the NADH biphasic responses and tissue Po2 responses, hippocampal slices were exposed to trains with varying stimulation intensities. With stimulation delivered at intensities increasing from 50% to 90% of maximal fEPSP response, there was a progressive increase of the amplitude and the slope of the tissue Po2 response (Figures 2A and 2B). During stimulation at 90% of maximal intensity, the peak amplitude of the tissue Po2 response was 238.3 ± 45 mm Hg (n = 7), causing the tissue Po2 to drop to an average to a minimum level of ~45 mm Hg with values ranging between 180 and 4 mm Hg. The rate of oxygen drop in the tissue increased in correlation with the intensity of the stimulation, which is shown by the increasing slope of the tissue Po2 response from an average of −4.95 ± 2.6 mm Hg/sec (at 50% of maximal stimulation intensity) to −11.05 ± 3.7 mm Hg/sec (at 90% of maximal stimulation intensity) (Figure 6C). Parallel to the tissue Po2 transient, the peak amplitude of the NADH oxidation phase after stimulation increased from −3.87% ± 2% to −7.9% ± 4.6% (at 50% and 90% of maximal stimulation intensity, respectively) (Figures 2C and 2D). Consistent with this finding, the area of NADH oxidation became larger with increasing energy demand (ΔF/F × s ranged from 188 ± 92 to 618 ± 717 (n = 7) with 50% to 90% maximal stimulation intensity).
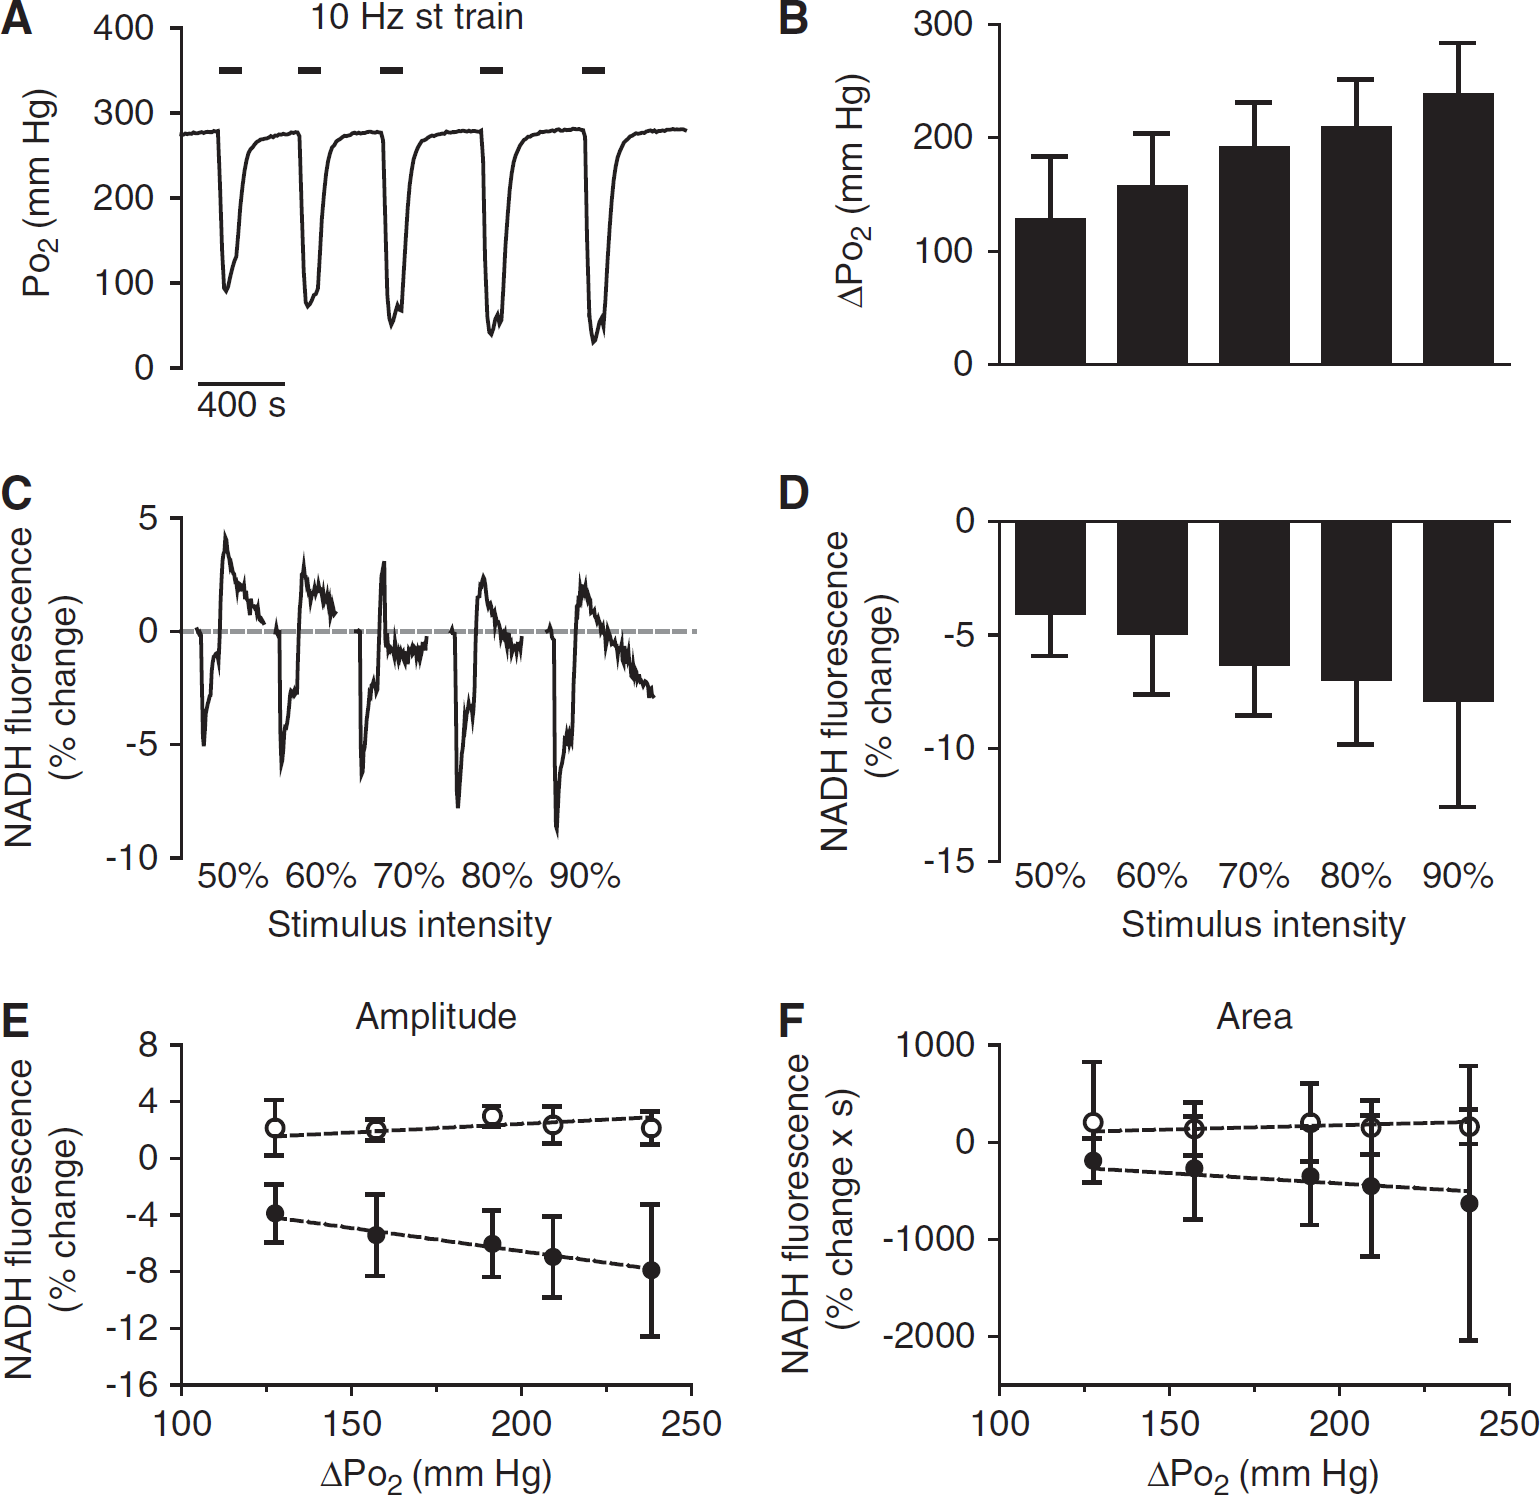
Stimulation intensity-dependent changes of tissue Po2 and nicotinamide adenine dinucleotide (NADH) biphasic response in the presence of 95% ambient oxygen. (
There was a positive correlation between the tissue Po2 response and the maximal amplitude (R = 0.989, P < 0.01) and the area (R = 0.97, P < 0.01) of the NADH oxidation phase. This correlation suggested that oxidative energy turnover as well as oxygen utilization was not compromised despite the profound drop in tissue Po2. In contrast, the time to onset and both the amplitude and the area of the delayed NADH overshoot were not correlated with increasing stimulation intensity or with the drop in tissue Po2 (Figures 2E and 2F); indicating that the appearance of the NADH overshoot is not dependent on the transient drop in tissue Po2 during the train stimulation.
Synaptic Stimulation at Various Ambient Po2 Levels
To further explore how changes in oxygen tension affect the NADH response during neuronal activation, we lowered ambient oxygen to 50%. When ambient oxygen concentration was lowered from 95% to 50%, tissue Po2 declined from 318 ± 27 to 142.7 ± 29 mm Hg (Figures 3A and 3B), still in excess compared with values recorded in the intact animal in vivo inspiring room air (21% O2) (Offenhauser et al, 2005; Takano et al, 2007). Under these conditions, resting NADH fluorescence remained stable; however, it became more reduced when the oxygen gas phase was decreased to 25% (Figure 3A). This is consistent with the observations from previous studies reporting that in excess oxygen (Po2 > 30 mm Hg) the redox state is less sensitive to changes in Po2 (Kreisman et al, 1981).
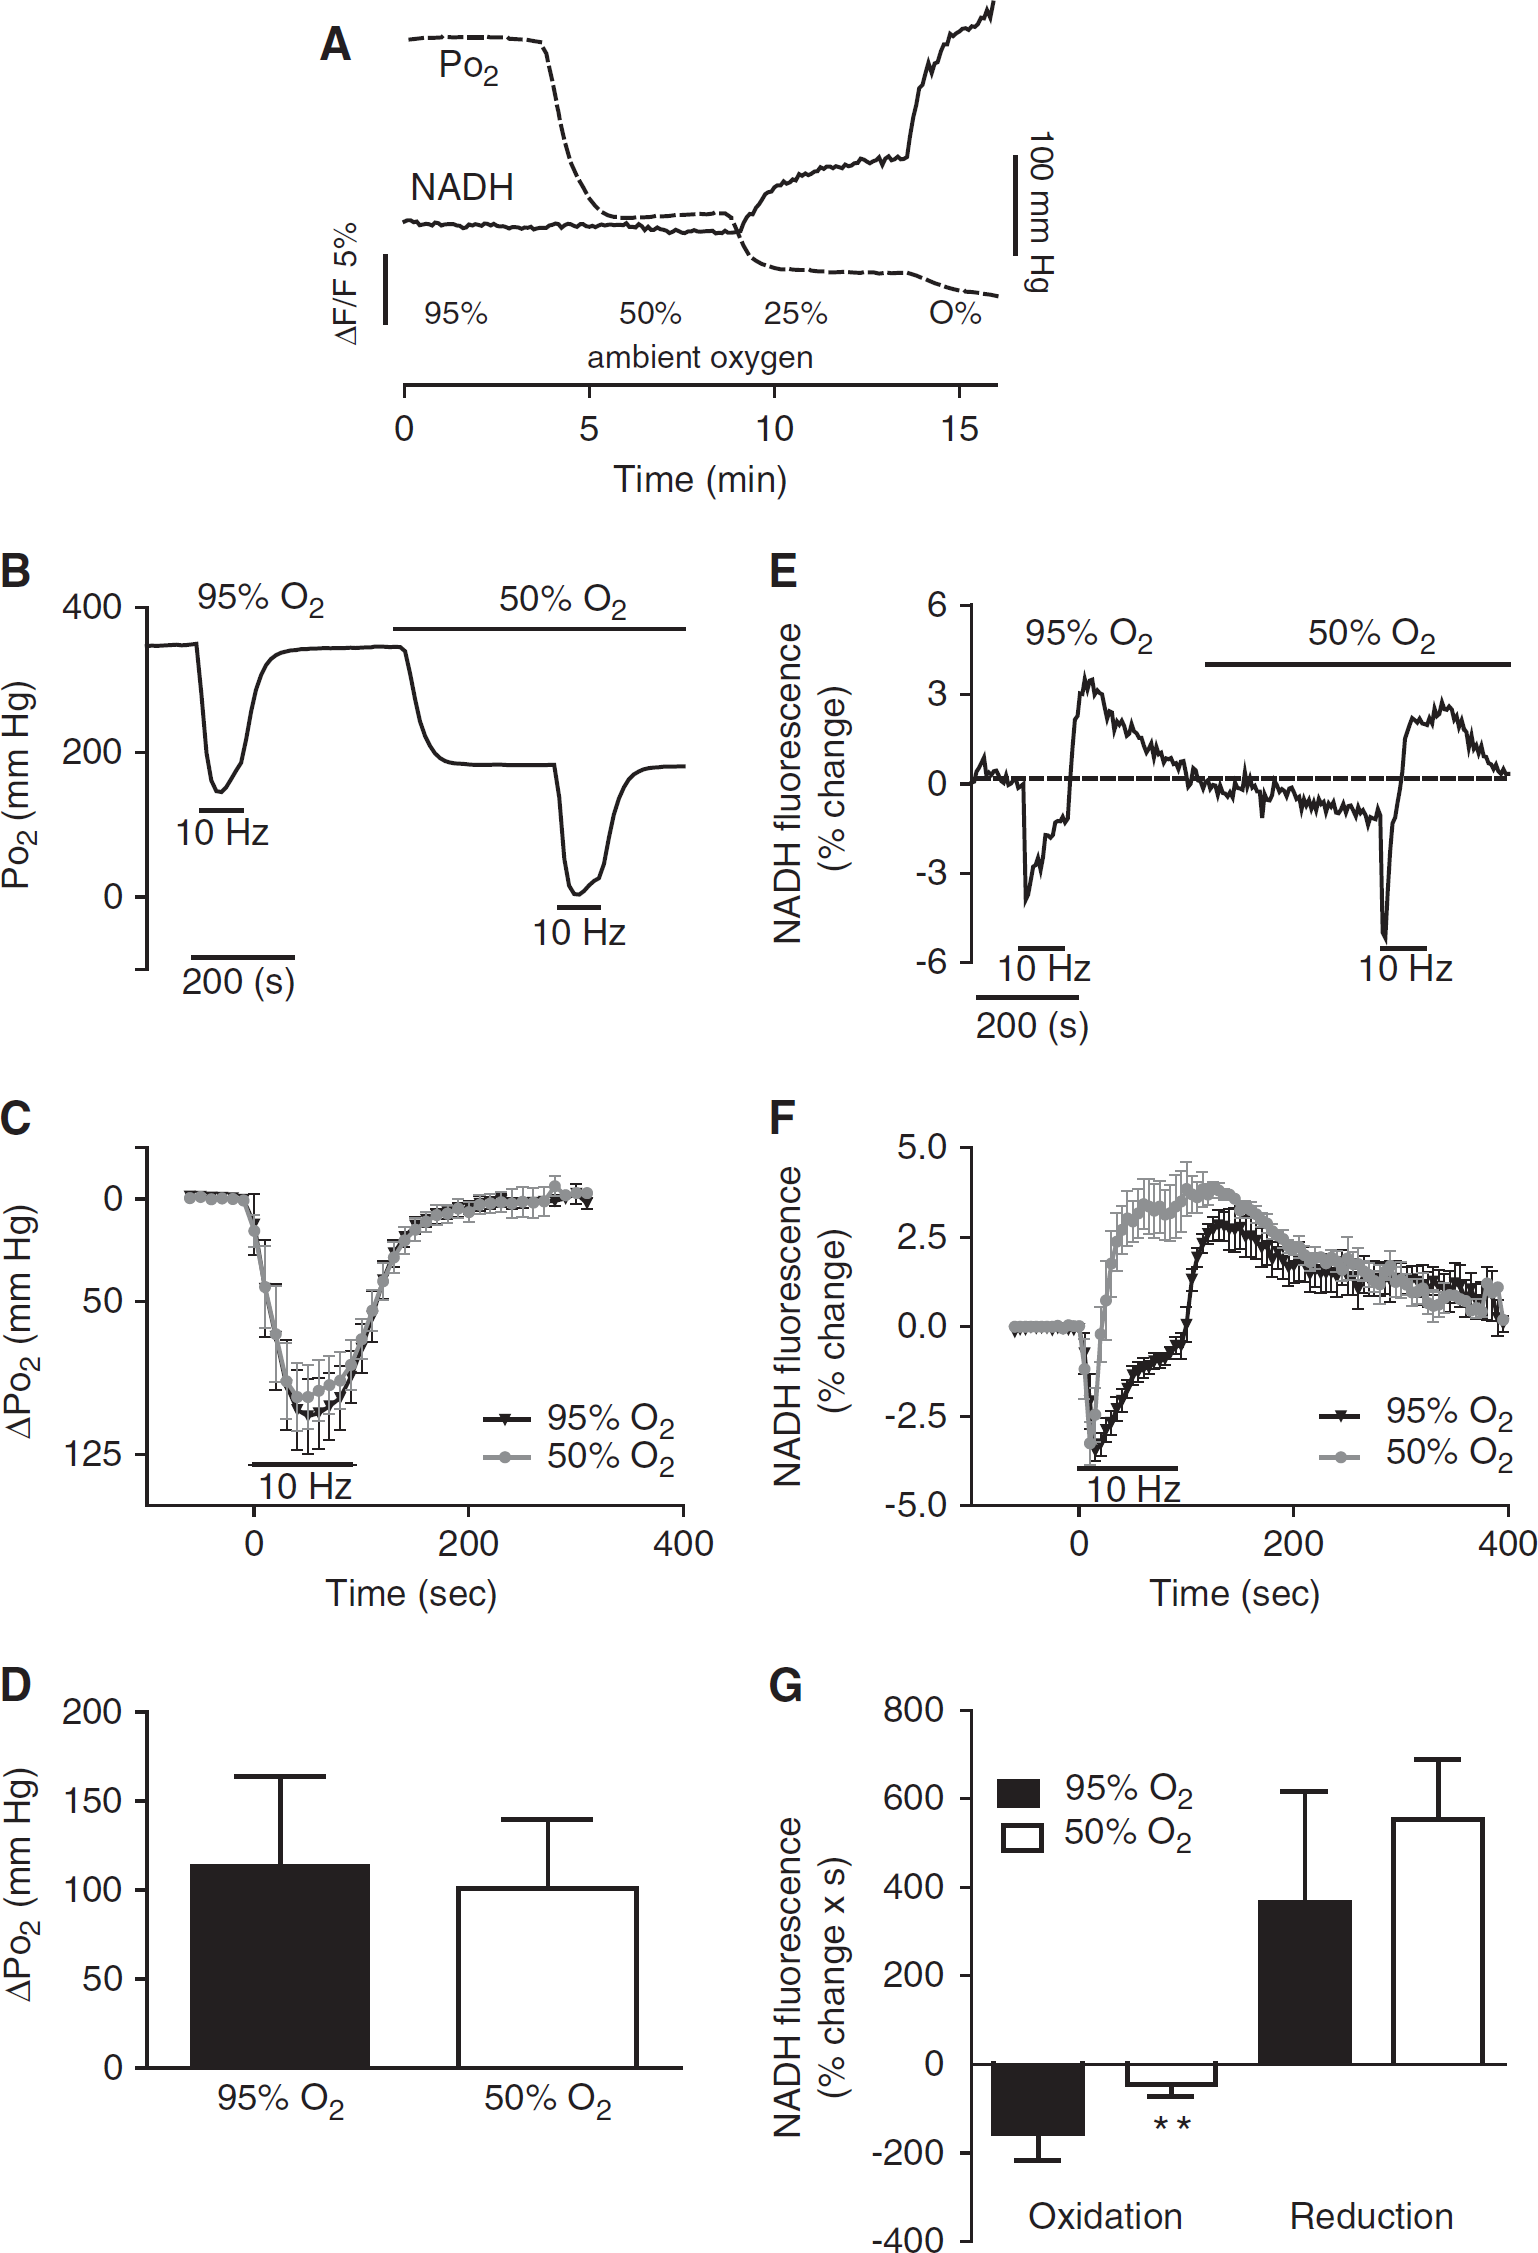
Tissue Po2 and nicotinamide adenine dinucleotide (NADH) responses at various ambient oxygen levels. (
During 90 seconds stimulation, tissue Po2 dropped from its baseline level to an average of 42 ± 2.25 mm Hg. The time course and the amplitude of the tissue Po2 response were similar in slices exposed to 50% compared with 95% ambient oxygen (Figures 3B–3D). The initial rate of oxygen drop in the tissue was not significantly altered by the change in oxygen supply (ΔPo2/Δt = 3.95 ± 1.93 mm Hg/sec versus ΔPo2/Δt = 3.61 ± 1.5 mm Hg/sec, at 95% and 50% O2, respectively; paired t-test P = NS, n = 6), indicating that the consumption of oxygen was similar in the two conditions in spite of the very different prevailing baselines. Synaptic activity was also maintained during the train in 50% O2, as the amplitudes of the fEPSP were 128% ± 17.6% of baseline value, then toward the end of the train the amplitude of the fEPSP dropped approximately by 20% (n = 6).
In contrast, the time course of the NADH biphasic response in slices exposed to 50% O2, was markedly different from that under 95% O2 (Figures 3E and 3F). The NADH oxidation in 50% oxygen lasted on average 17 ± 4.6 seconds and was considerably shorter than in 95% O2 and the relative NADH/NAD+ ratio shifted earlier toward reduction, resulting in a longer lasting NADH overshoot (177.5 ± 45.4 seconds versus 236.7 ± 44 seconds for 50% and 95% O2, respectively).
Although the peak amplitudes of both the oxidation phase and the reduction phase of the NADH response were similar at both oxygen levels (Figure 3F), in 50% O2 the area of the negative NADH response was significantly smaller than in 95% O2 (ΔF/F × s = 44.5 ± 27. and 155 ± 62, for 50% and 95% O2, respectively), but not the area of the NADH overshoot (Figure 3G).
These results indicate a certain degree of dissociation between the mitochondrial redox state and the rate of oxygen utilization. Although the NADH redox level shifted early toward a reduced state as a result of a decrease in oxygen supply the actual oxygen utilization and metabolic demand were not significantly altered, suggesting that oxygen availability was not limiting at the electron transport chain.
Measurements of the Tissue Po2 Response at Various Depths in the Hippocampal Slice
Changes in oxygen tension were measured at the nadir, which usually occurs at depths between 180 and 250 μm. The Po2 gradient within slices (in 95% O2; Foster et al, 2005) declined from ~688 mm Hg at the slice surface, to 512 ± 84 mm Hg (~176 mm Hg drop) at ~100 μm depth and further decreased to 352 ± 77 mm Hg at the nadir (157 ± 20 mm Hg drop) (n = 6).
The tissue was stimulated within the middle of the slice, evoking responses throughout the slice, as evident from fEPSP depth profiles (Figures 4A and 4B). By contrast, the NADH signal may perhaps be biased in favor of the more superficial layers. As there might be a discrepancy between the focal tissue oxygen measurements in the middle of the slice and the averaged NADH responses, we also measured tissue Po2 responses at more superficial levels. However, when the sensor was placed at ~100 μm depth, the stimulus-induced changes of tissue Po2 were not significantly different from the changes measured at the nadir (Figures 4C and 4D). These results indicate that stimulus-induced tissue oxygen consumption, fEPSP and tissue NADH fluorescence responses effectively average across much of the slice depth, and are not necessarily confined to a limited region of the slice.
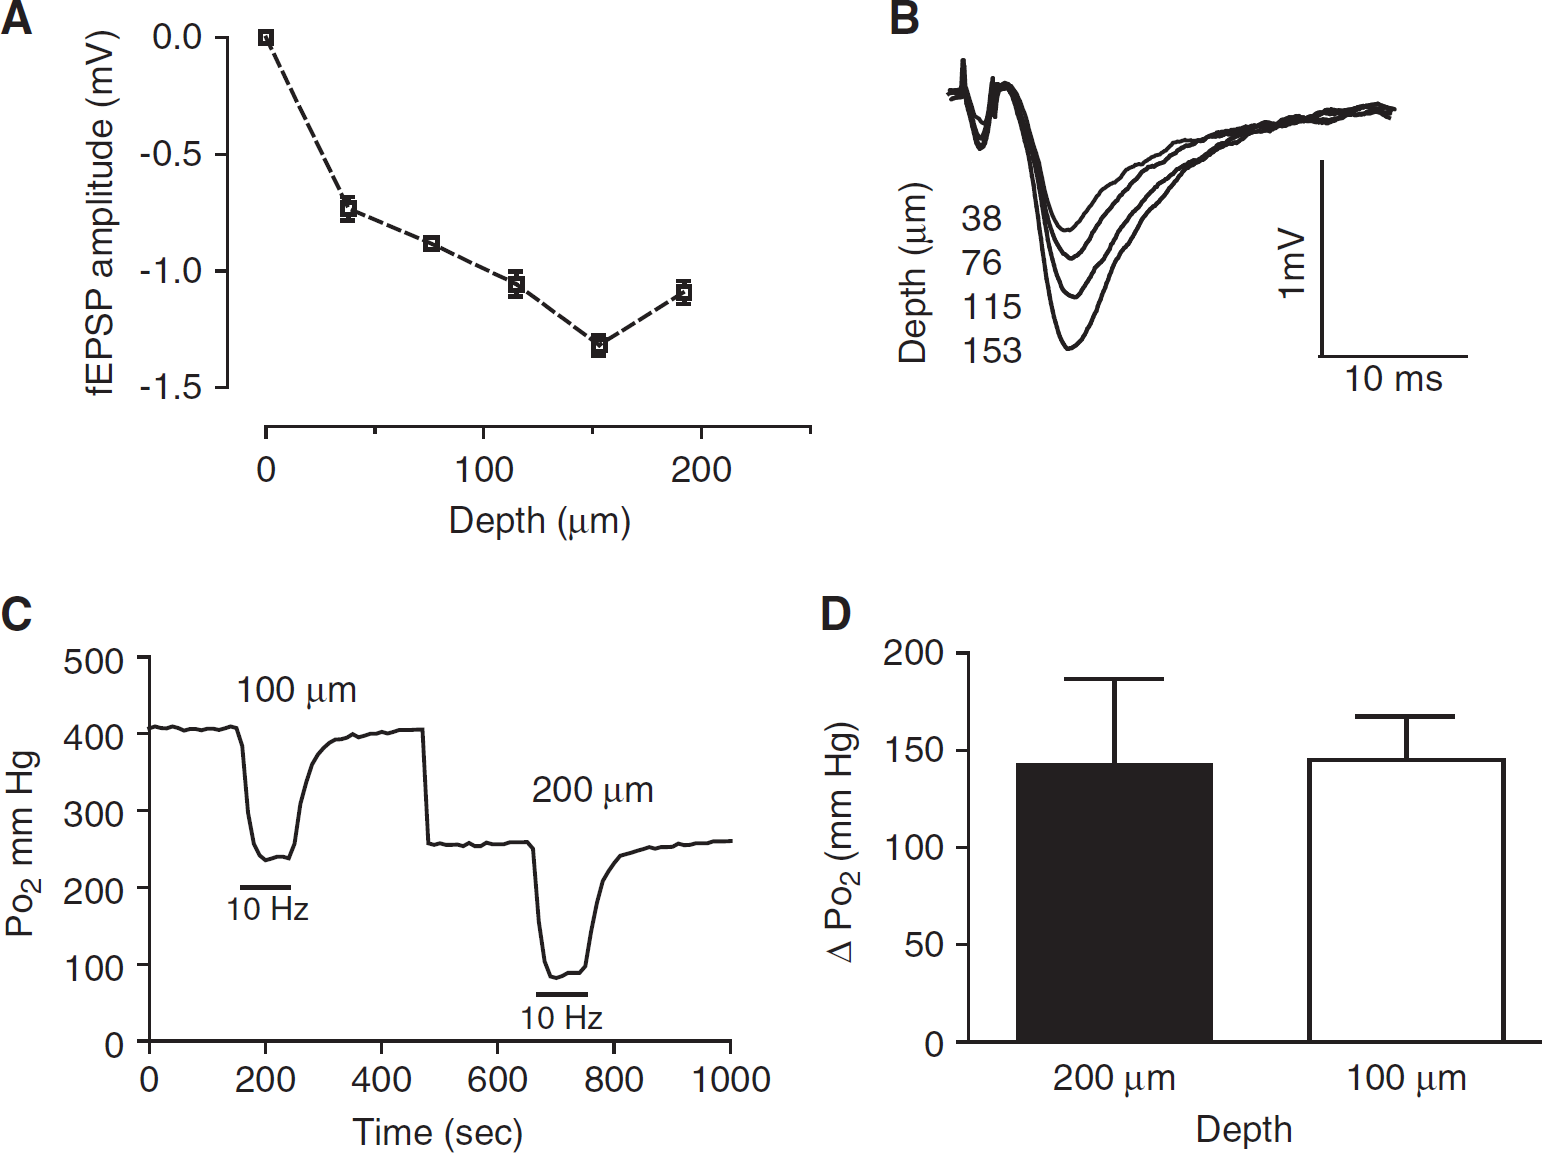
The tissue Po2 responses were similar near the surface of the slice compared with the center of the slice (nadir). (
K+-Induced Spreading Depression Results in a Prolonged Decrease in Tissue Po2 and Curtailed NADH Oxidation
Variables affecting the NADH signal include the intensity of the stimulation and related degree of metabolic demand, relative tissue oxygen availability, the degree of neuronal depolarization, and ATP depletion (ADP levels) (Mayevsky and Chance, 2007; Turner et al, 2007). We therefore investigated the relationship between the tissue Po2 and the biphasic NADH response after normoxic SD induced by K+ microinjection, which leads to an intense increase in metabolic demand.
After 1 mol/L KCl injection into the slice at the subiculum/CA1 border, a depolarizing wave accompanied by a large extracellular negative DC potential shift leads to a marked fluorescence change that spreads across the hippocampal CA1 region (Figure 5A). The cellular response is an intense neuronal depolarization associated with depletion of ion gradients and channel inactivation throughout the entire CA1 volume (Somjen, 2001), resulting in complete suppression of synaptic transmission until metabolic recovery ensues. As shown in Figure 5, immediately after the onset of the DC shift, the tissue Po2 decreased sharply. On average, Po2 dropped from a baseline of ~300 to 15 ± 21 mm Hg (ΔPo2 = 285.6 ± 50 mm Hg; n = 8). Tissue Po2 reached its minimum level rapidly, within ~14 seconds, and remained depressed, within 20 mm Hg of its minimum level for 96.3 ± 60 seconds during the negative voltage shift, which lasted 98.8 ± 60 seconds. Tissue Po2 then began to recover and finally returned to baseline after ~256 ± 105 seconds. When the duration of the DC potential shift was plotted as a function of the time during which tissue Po2 remained close to the minimum level, and the time for recovery of tissue Po2 to baseline, we found a clear positive correlation (DC shift duration versus tissue Po2 decrease, R = 0.87, P < 0.05; DC shift versus tissue Po2 recovery, R = 0.98, P < 0.001; n = 8). This correlation shows that the large drop in tissue Po2 during SD directly reflects the extreme increase in demand for oxygen as cells activate membrane ion pumps to restore membrane potential, indicating nearly complete utilization of all available oxygen. The recovery of synaptic responses began about the same time as that of Po2, and then its amplitude overshot the control level (Figure 5E).
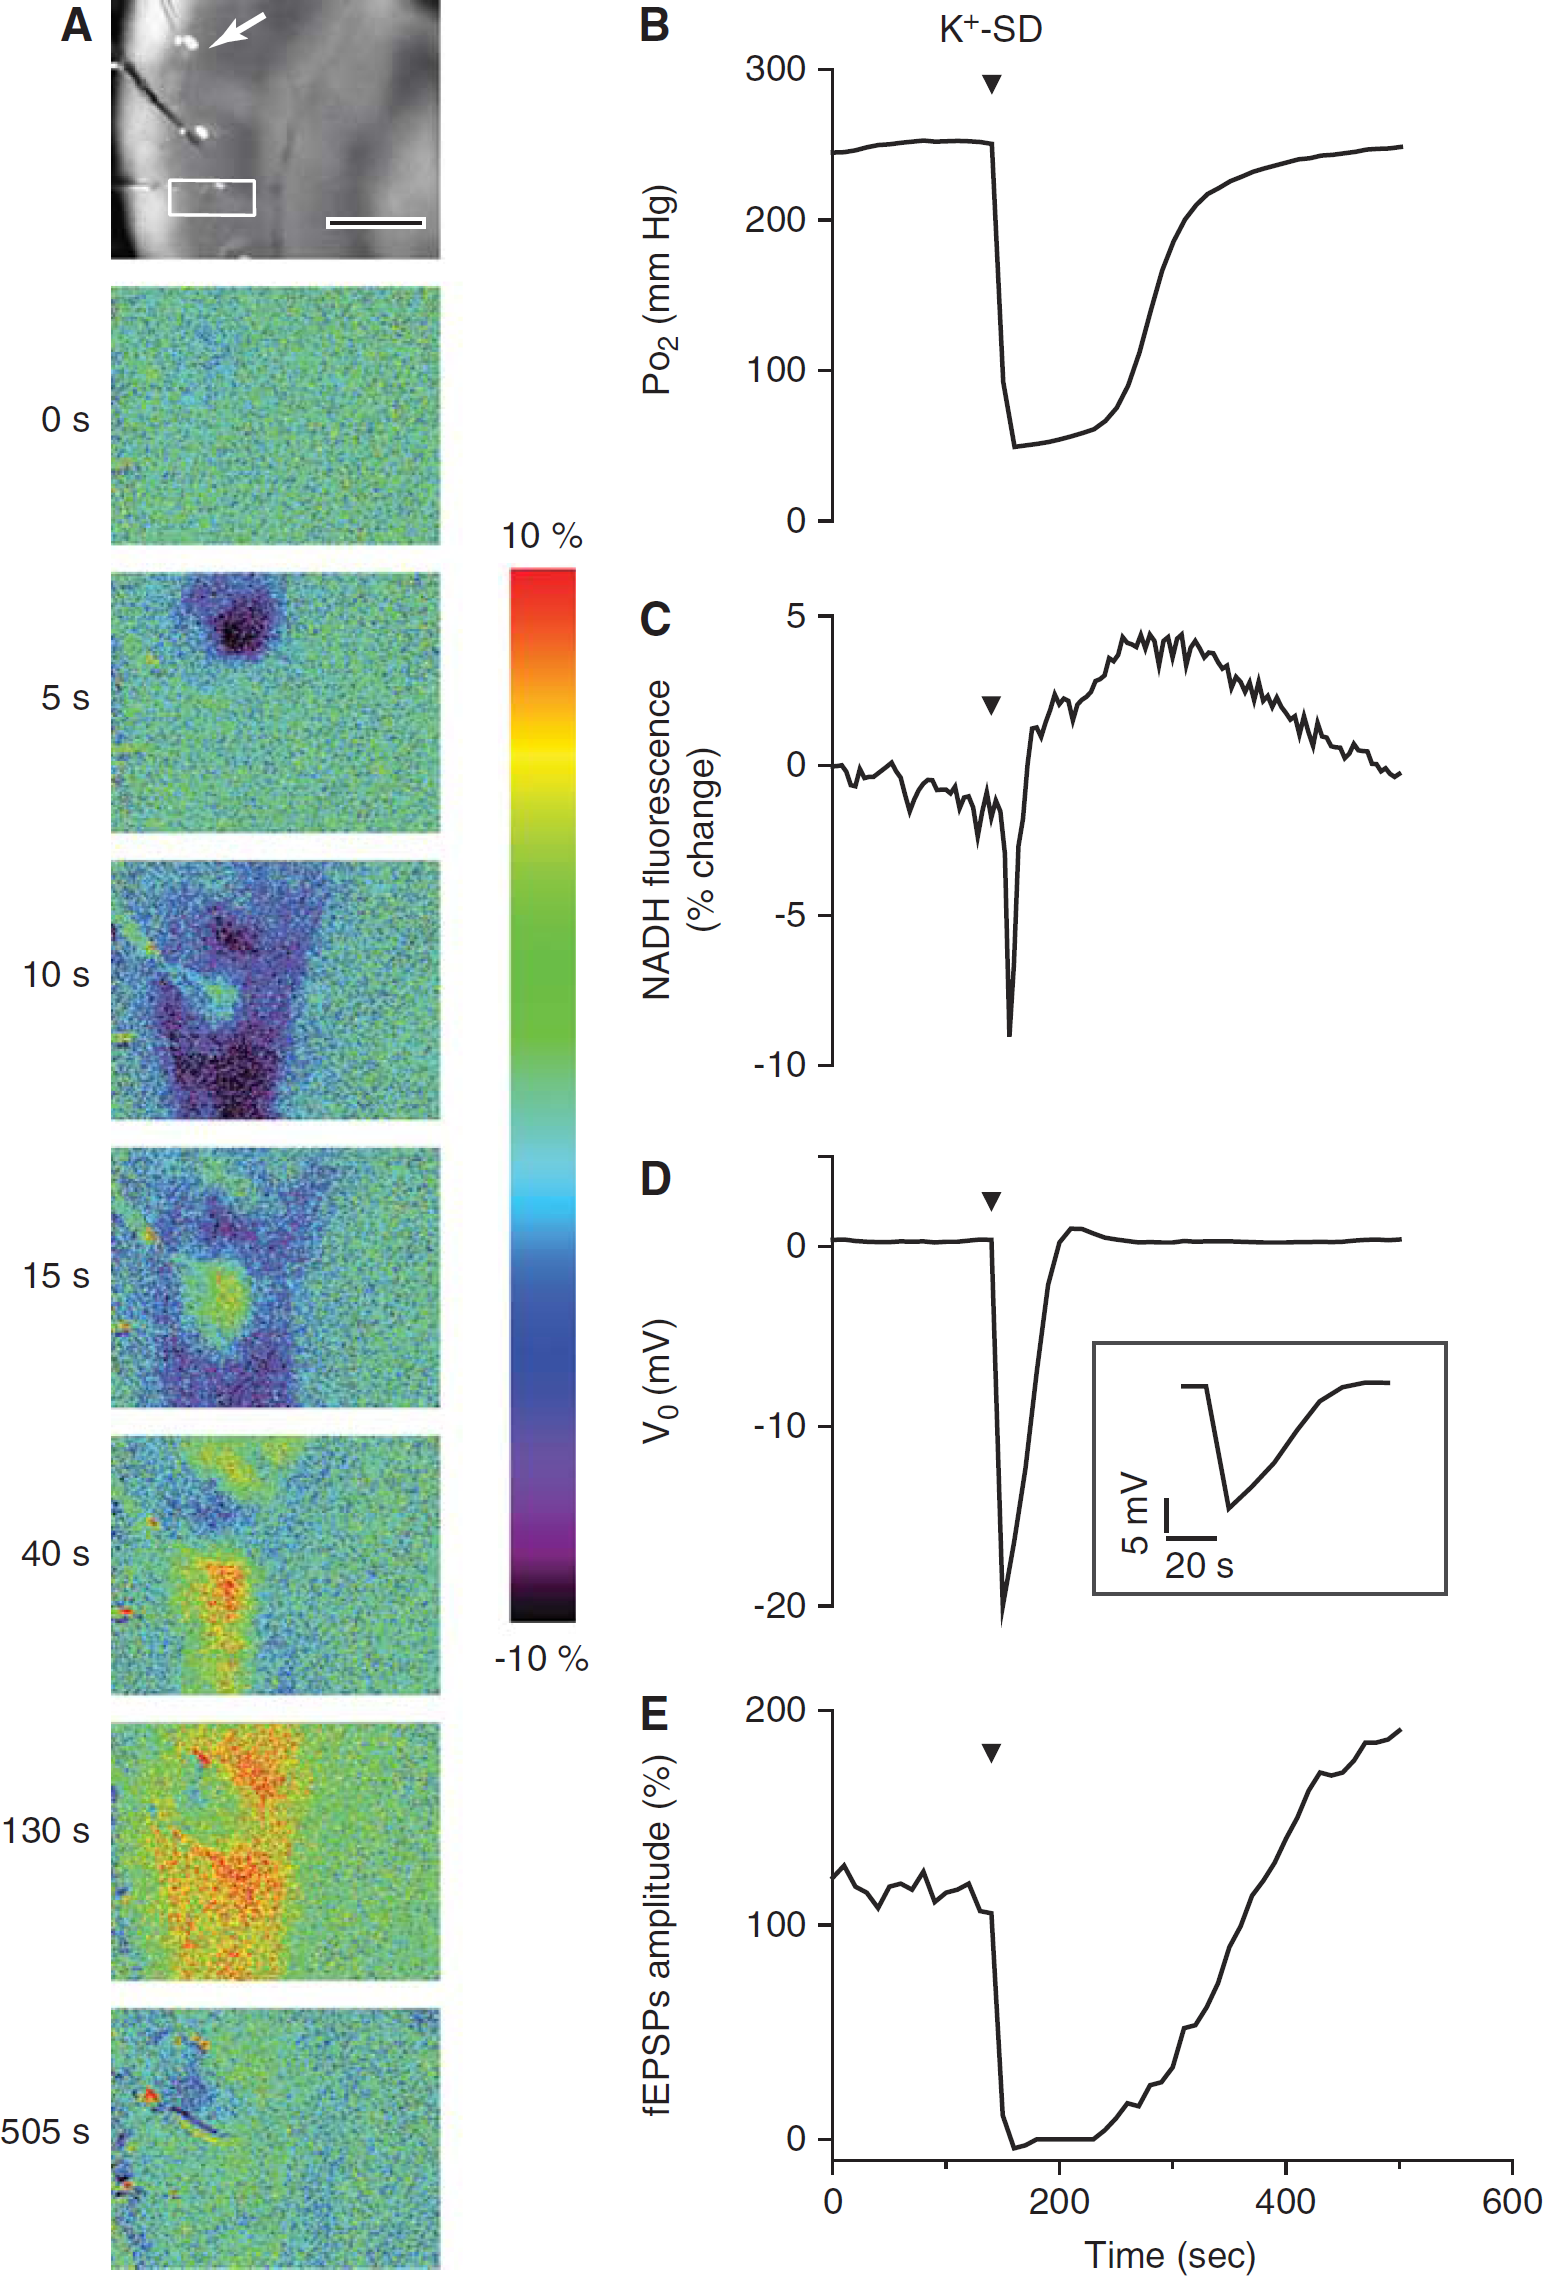
The extreme cellular oxygen demand during K+-induced spreading depression (SD) shifted the mitochondrial redox state toward reduction. (
During SD there was an immediate, profound drop in NADH fluorescence (Figures 5A and 5C) because of the rapid increase in oxidative metabolism (ΔF/F = −9.95% ± 2.6%). But, the duration of the oxidation phase was limited (30 ± 13 seconds), shorter than either the DC potential shift or the Po2 maximum decrease, and was followed by a prolonged NADH fluorescence increase (Figures 5A and 5C). Interestingly, the duration of the NADH oxidation phase was positively correlated with both the duration of the DC potential shift (R = 0.88, P < 0.01) (Figure 6) and tissue Po2 recovery time (R = 0.84, P < 0.01; n = 8). This observation suggests that oxygen was not completely depleted despite the apparent low level. In the absence of oxygen, NADH fluorescence rapidly increases regardless of the persistent metabolic demand (Foster et al, 2005).
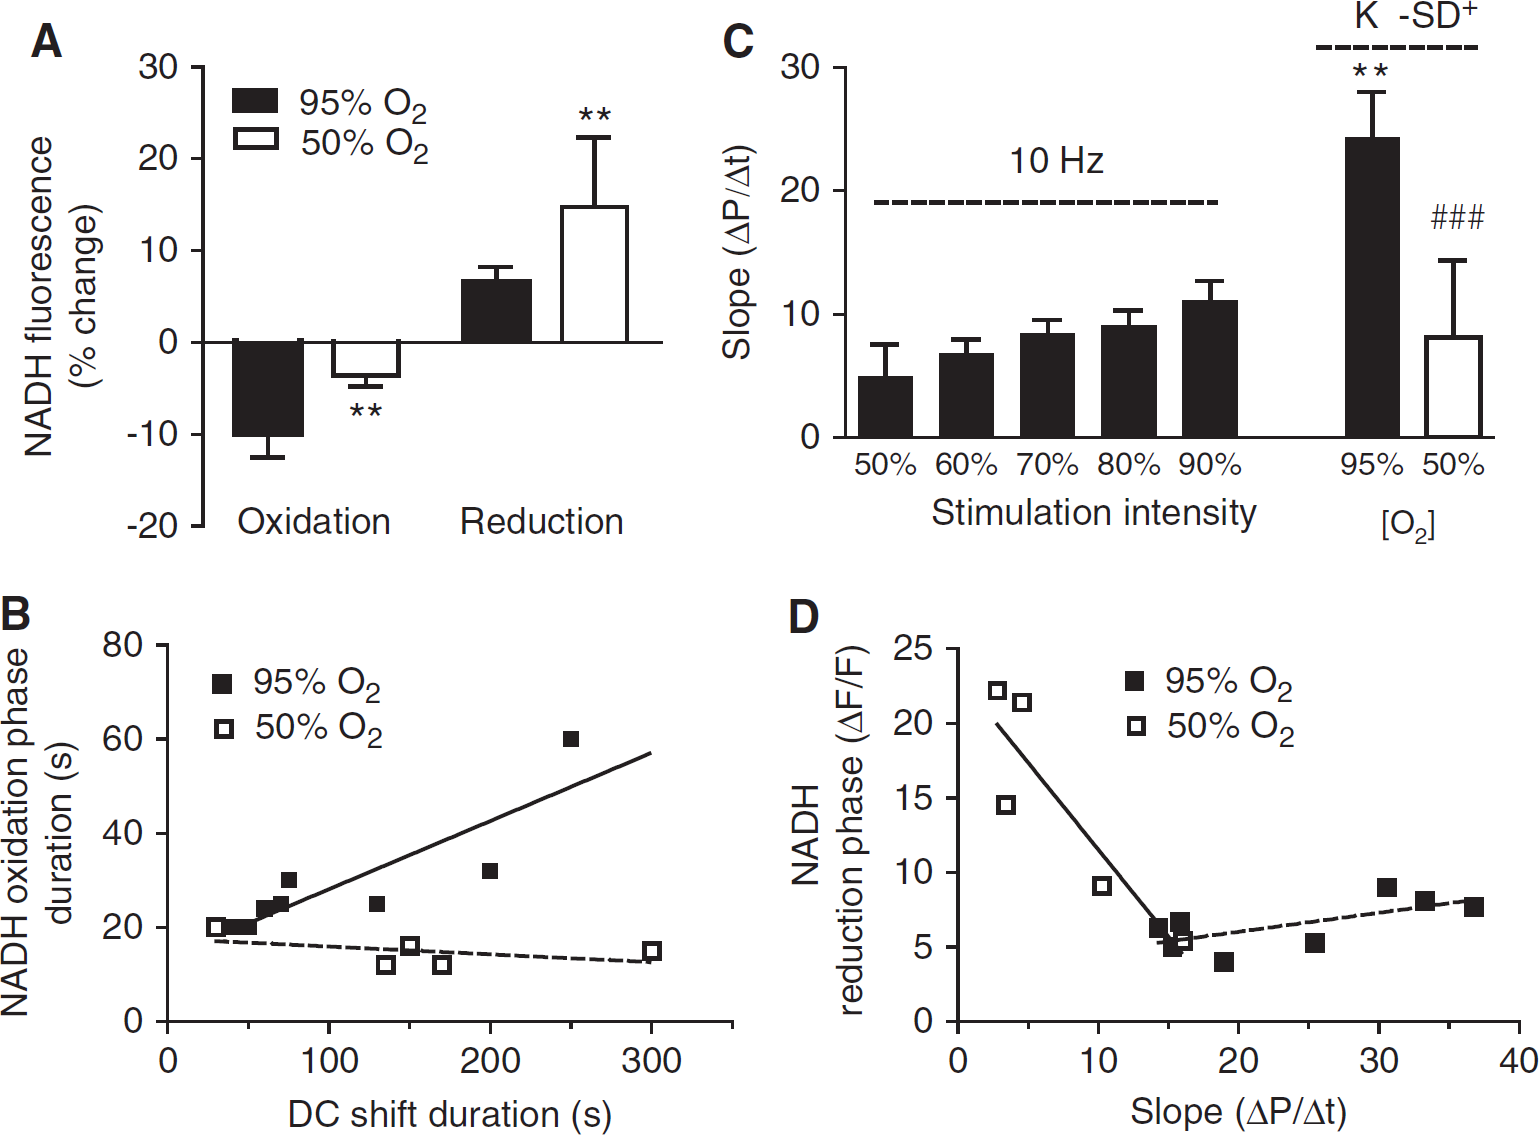
Comparison of the nicotinamide adenine dinucleotide (NADH) biphasic responses and tissue Po2 responses during a K+-induced spreading depression (SD) in 95% and 50% O2). (
To further investigate the oxygen dependence of the mitochondrial redox state during increased metabolic demand, we have induced K+-SD in hippocampal slices exposed to 50% O2. In 50% O2 because of lower tissue Po2 levels during SD, the oxygen response was limited (ΔPo2 = 129.5 ± 30 mm Hg) and tissue Po2 levels remained close to the minimum for a longer period of time (349 ± 360 seconds) and recovered to baseline later (time to recovery = 780 ± 509 seconds) (n = 6) compared with SD in 95% O2. Similar to the 95% O2 condition, in 50% O2 after the DC shift onset there was also an immediate drop in NADH fluorescence, followed by a prolonged NADH fluorescence increase; however, the maximal amplitude of the NADH oxidation phase was 62% ± 5% smaller in 50% O2 (Figure 6). Similarly, the negative area was decreased from 115.6 ± 50 to 26.5 ± 15 during K+-SD in 95% and 50% O2, respectively (P < 0.01). Under these conditions of lower oxygen levels, we did not find a positive correlation between the duration of the NADH oxidation and either the DC shift duration (R = −0. 6; P = 0.2) (Figure 6B) or the tissue Po2 recovery time (R = −0.57, P = 0.3; n = 5). In addition, the amplitude of the subsequent NADH overshoot was larger and persisted for a longer time leading to a larger area of the reduction phase (ΔF/F × s = 7012 ± 4981 versus 1757 ± 885 in 50% and 95% O2, respectively, P < 0.05 n = 5 and 8) (Figures 6A and 6D).
The rate of oxygen disappearance in the tissue, which was greatly increased during K+-SD in 95% O2 compared with synaptic train stimulation, was instead slower in 50% O2 during K+-SD (24.27 ± 9 versus 8.15 ± 6.2 mm Hg/sec during K+-SD in 95% and 50% and O2, respectively) (Figure 6C) demonstrating that the rate of oxygen utilization in the electron transport chain had declined. Only in the presence of 50% O2 did we find negative correlation between the rate of oxygen disappearance and both the maximal amplitude (R = −0.89, P < 0.05) (Figure 6D), and the area (R = −9.4, P < 0.05) of the NADH reduction phase possibly indicating that oxidative metabolism in mitochondria was limited by low oxygen levels, hence causing a rapid increase of NADH fluorescence.
Discussion
Our data show that in acutely isolated hippocampal slices from adult rats the amplitude of the early NADH oxidation clearly correlates with oxygen utilization, but both the oxidation duration and the transition into the NADH reduction phase relate more to the balance between oxygen supply and demand, leading to dissociation between oxygen utilization and NADH redox state. Although the NADH imaging shows increased reduction during either moderately reduced oxygen supply (i.e., 50% O2) or increased metabolic demand (i.e., SD versus synaptic stimulation), the underlying oxygen flux during activation more accurately predicts physiological function and recovery.
With the prolonged (90 seconds) train stimulation we have extended earlier observations (Foster et al, 2005; Huchzermeyer et al, 2008; Takano et al, 2007) showing that, in hippocampal slices in the presence of high ambient oxygen, NADH remains in a relatively oxidized state through the entire duration of the prolonged train stimulation. Under this condition, NADH oxidation is highly correlated to metabolic demand (Figure 2). A similar relationship between the rate of oxygen utilization and electrical activity was found in the cerebellar cortex in rats in vivo; however, the full extent of Po2 response was attenuated and reached a plateau at 10 Hz stimulation rate because of the increase in blood supply (Offenhauser et al, 2005), leading to the conclusion that the coupling of oxygen consumption and electrophysiological activity was not completely linear (Korf and Gramsbergen, 2007). Here, we have found a progressive nearly linear increase of the amplitude and the slope of the tissue Po2 response and NADH oxidation phase, with increasing stimulation intensities. The relationship between stimulation intensity and the rate of oxygen disappearance in the absence of blood flow also confirms that there is a proportional increase of oxygen consumption with increasing neuronal activation.
Increased metabolic energy demand will accelerate NADH oxidation in complex I of the electron transport chain as well as the reduction of NADH/NAD+ in the cytosol and in the TCA cycle.
The profile of the NADH biphasic response results from the temporal integration of the ongoing oxidation and reduction reactions signals originating from different cellular compartments in neurons and glia (Turner et al, 2007). Even though, in the presence of abundant oxygen, during stimulation, NADH oxidation transiently exceeds reduction, the appearance of the NADH overshoot likely caused the full NADH oxidation to be curtailed (Shuttleworth et al, 2003), contributing to the early peak of the NADH oxidation observed both in vitro (Huchzermeyer et al, 2008) and in vivo (Lothman et al, 1975). For example, the inhibition of the transport of critical substrates into neuronal cells resulted not only in the suppression of the NADH overshoot, but also in a more prolonged NADH oxidation phase during a 25-second ST (Galeffi et al, 2007).
Judging by the time course of the extracellular oxygen levels, little oxygen is used during the recovery phase (i.e., NADH reduction) that follows stimulation either in vitro or in vivo preparations, as the oxygen levels have recovered by this time (Duchen, 1992; Lewis and Schuette, 1975). At the end of the stimulation, after ADP has been largely phosphorylated, the activity of the dehydrogenases, which supply NADH, most likely remains elevated, leading to the NADH overshoot (Denton, 2009).
Interface hippocampal slices exposed to 95% ambient oxygen (Foster et al, 2005) show a surplus of oxygen even at the nadir (~350 mm Hg). After adjusting the ambient oxygen to 50%, the oxygen level at the nadir (~150 mm Hg) was still in excess of what is measured in vivo (~27 mm Hg) in mouse cortex (Takano et al, 2007) and in rat cerebellar neocortex (~38 mm Hg) (Offenhauser et al, 2005), resulting in stable resting NADH levels and synaptic responses. During 90 seconds stimulation, the tissue Po2 dropped transiently to significantly lower levels and the NADH response turned from brief oxidation to reduction. Yet the amount of O2 consumed, as judged from the Po2 response, was similar to that measured under 95% ambient oxygen (Figure 3B). In this instance, the alteration of the evoked NADH response toward reduction does not appear to be associated with reduced oxidative capacity in the mitochondria.
In contrast, when the oxygen levels were further decreased to 20% during synaptic stimulation, oxygen tension likely reached critical levels in the intracellular microdomains; as demonstrated by the decline of the oxygen transient coupled with a larger amplitude of the NADH overshoot (Foster et al, 2005; Huchzermeyer et al, 2008).
Under condition of excess oxygen, the rate of oxygen utilization is primarily regulated by metabolic ATP demand (Chance and Williams, 1955). The reaction of cytochrome-c oxidase with molecular oxygen is a function of both the level of reduction of cytochrome-c and of the energy state and oxygen pressure throughout the physiological range (at least up to 25 to 30 torr). As the oxygen concentration decreases and the [ATP]/[ADP][Pi] drops, both NAD+/NADH and cytochrome-c become progressively reduced to maintain an adequate flux in the electron transport chain and ATP production (by increasing the affinity of cytochrome-c oxidase for oxygen) (Wilson et al, 1979). The respiratory chain redox reactions are freely reversible and near to thermodynamic equilibrium with ATP synthesis, with which they are tightly coupled. At constant energy state, reduction of the NAD+/NADH couple will also result in reduction of cytochrome-c (Wilson and Ereciñska, 1985).
Mitochondrial dehydrogenases are activated by small increases in intercellular calcium, because their sensitivity to calcium increases as [ATP]/[ADP][Pi] declines, their enzymatic activity is regulated continuously to meet ATP demand (Denton, 2009). In addition to be sensitive to the decrease in energy state, the TCA cycle enzymes and the other dehydrogenases that ‘feed’ mitochondrial oxidative phosphorylation are highly sensitive to a decrease in oxygen levels and can easily be activated to increase the NADH/NAD+ ratio (Wilson and Ereciñska, 1985).
Increased neuronal activation (Chih and Roberts Jr, 2003) stimulates glycolysis in neurons and astrocytes to maintain synaptic activity, contributing to the cellular ATP and NADH pool (Cerdán et al, 2006); however, in 50% oxygen it does not appear that anaerobic glycolysis compensates for the drop in oxygen levels because the rate of oxygen utilization was not significantly altered.
As metabolic demand increases with SD waves, the degree of tissue oxygen utilization also increases, as assessed by rate of oxygen disappearance from the tissue and the amplitude of the NADH oxidation phase. During SD in slices, the duration of the NADH oxidation phase was shorter than that of the drop in tissue Po2; tissue Po2 remained severely depressed for the duration of the V0 shift. The reduction phase was also prolonged during SD and continued even as the fEPSP recovered. Nevertheless, the cellular oxygen availability appeared to remain above critical levels as the NADH oxidation phase was highly correlated with the increased metabolic demand associated with SD. Similarly, in well-oxygenated areas close to the microvessels in the mouse neocortex in vivo during an K+-SD, the mitochondrial redox response show a biphasic oxidation–reduction sequence (Takano et al, 2007).
In contrast to previous observations, we do not find a specific tissue Po2 threshold associated with development of an early NADH overshoot (Huchzermeyer et al, 2008), because NADH remained relatively oxidized for the duration of the ST duration (90 seconds) even after reaching low tissue Po2 levels comparable to the levels reached during SD. In addition, neither the average amplitude of the tissue Po2 response nor its duration during SD was significantly different from that during synaptic train stimulation elicited at 90% of the maximal fEPSP amplitude. Our data indicate that it is the balance between oxygen demand and supply that ultimately affects the shape of the NADH imaging response (Mayevsky and Chance, 2007).
For example, during train stimulation in 95% oxygen because of the moderate increase in demand, intracellular oxygen levels appear to remain above the level at which the redox changes are associated with the rate of oxygen consumption (Kreisman et al, 1981). However, a shift in the balance between oxygen supply and demand, due either to a decrease in supply or to a dramatic increase in demand such as during SD, can lead to a transient but more severe decrease in oxygen levels in the cellular microdomain especially near the mitochondria. The oxygen gradient between the mitochondria and the extracellular space (Mik et al, 2006) becomes steeper as a result of either increased oxygen uptake or a decreased oxygen supply (Gleichmann et al, 2009). Under these conditions, a transient dissociation of the changes of redox state with the increase in oxygen utilization (Kreisman et al, 1981) may occur as a result of a larger activation of mitochondrial dehydrogenases shifting of the NADH/NAD+ redox state toward reduction to compensate for the decrease in tissue Po2 and to meet the increased energy demand (Wilson et al, 1979).
However, during SD in 50% O2 in vitro or in poorly oxygenated areas far away from the capillaries in the intact brain (Takano et al, 2007), changes in the mitochondria redox state cannot compensate for the decrease in oxygen levels; at this point oxidative metabolism becomes limited (Wilson et al, 1988), resulting in a significant decline in oxygen utilization.
Footnotes
Acknowledgements
The authors are grateful to Professor CA Piantadosi for a critical reading of the manuscript and Professor DF Wilson for very helpful discussion.
The authors declare no conflict of interest.