
Abstract
Lactate is a potential energy source for the brain. The aim of this study was to establish whether systemic lactate is a brain energy source. We measured in vivo cerebral lactate kinetics and oxidation rates in 6 healthy individuals at rest with and without 90 mins of intravenous lactate infusion (36 μmol per kg bw per min), and during 30mins of cycling exercise at 75% of maximal oxygen uptake while the lactate infusion continued to establish arterial lactate concentrations of 0.89 ± 0.08, 3.9 ± 0.3, and 6.9 ± 1.3 mmol/L, respectively. At rest, cerebral lactate utilization changed from a net lactate release of 0.06 ± 0.01 to an uptake of 0.16 ± 0.07 mmol/min during lactate infusion, with a concomitant decrease in the net glucose uptake. During exercise, the net cerebral lactate uptake was further increased to 0.28 ± 0.16 mmol/min. Most 13C-label from cerebral [1-13C]lactate uptake was released as 13CO2 with 100% ± 24%, 86% ± 15%, and 87% ± 30% at rest with and without lactate infusion and during exercise, respectively. The contribution of systemic lactate to cerebral energy expenditure was 8% ± 2%, 19% ± 4%, and 27% ± 4% for the respective conditions. In conclusion, systemic lactate is taken up and oxidized by the human brain and is an important substrate for the brain both under basal and hyperlactatemic conditions.
Introduction
Blood-borne glucose represents the main fuel for the human brain and can support its energy demand. However, this does not exclude the fact that other substrates can be used. For example, when ketone body concentrations are increased during long-term fasting, ketone bodies replace glucose as the primary energy source for the brain (Owen et al, 1967). Whether lactate can fulfill a similar role and is part of normal human brain metabolism is still much debated. In cell cultures, neurons metabolize lactate that has been suggested to originate from astrocytic glycolysis, i.e., the astrocyte-to-neuron lactate shuttle (Pellerin and Magistretti, 1994). However, it has been shown that also astrocyte are able to oxidize (Peng et al, 1994). Whether the brain takes up lactate from the circulation and accumulates or oxidizes it remains unclear. In humans, the brain takes up lactate when arterial lactate is increased during insulin-induced hypoglycemia (Lubow et al, 2006), cardiopulmonary resuscitation (Rivers et al, 1991), and high-intensity exercise (Ide et al, 2000). Moreover, during hypoglycemia, cognitive function is improved when lactate is infused in a similar manner to hyperketonemia (King et al, 1998, 1997; Maran et al, 1994; Veneman et al, 1994).
The research on brain lactate metabolism lags behind that of muscle. Yet, there are many parallels between the two tissues. For the brain, neuron and astrocyte metabolism may interact, and in skeletal muscle, the slow and fast twitch muscle fiber may supplement each other (Gladden, 2004). In support, for both tissues, the different cell types show a different distribution pattern of the monocarbylate transporters and lactate dehydrogenase (LDH) isoforms (Bergersen, 2007). Moreover, skeletal muscle is the sleeping giant that can increase more than 50-fold its energy requirements from rest to high-intensity exercise and also increase lactate production many fold. The increase in arterial lactate concentration during intense exercise makes lactate available to the brain, and the brain switches from a net producer of lactate to an importer (Ide et al, 2000) and glucose uptake is reduced (Kemppainen et al, 2005). Therefore, the aim of this study was to establish whether systemic lactate is an energy source for the human brain in vivo and compare its metabolism with that of skeletal muscle. For this purpose, we quantified simultaneously brain and skeletal muscle lactate kinetics and oxidation rates by a combination of arterial, jugular and femoral venous differences and tracer dilution methodology at rest with and without intravenous lactate infusion to increase lactate levels, and during exercise while the lactate infusion was maintained.
Materials and methods
Subjects
Six male subjects participated in the study (age: 25 ± 2 years, weight: 71 ± 4 kg, and height: 175 ± 6 cm). Earlier to the study, the subjects underwent a medical examination and blood analyses, which were all normal. The subjects were normally physically active individuals; none were taking any medications or had any known history of disease. They were informed about the risks and discomfort associated with the experimental protocol, both orally and in writing as approved by the Ethical Committee for Copenhagen and Frederiksberg (KF 01305335) in accordance with the Declaration of Helsinki.
Protocol
Seven days before the experiment, the subjects performed incremental exercise to exhaustion on a cycle ergometer (Monark Ergomedic 839e, Stockholm, Sweden) for assessing maximal exercise capacity and maximal oxygen uptake. On the day of the experiment, the subjects reported to the laboratory at 0800 hours after an overnight fast, although intake of water was permitted. Under local anesthesia (2% lidocain) and using the Seldinger technique with guidance from an ultrasound, a catheter was placed retrograde in the right internal jugular vein (1.6 mm, 14 gauge, Arrow International, Erdingen, Germany) and advanced into the jugular bulb. Additional catheters were placed in the brachial artery (1.1 mm, 20 gauge) of the nondominant arm, in a cubital vein (1.3 mm, 18 gauge) of the arm opposite to the arterial line, and 2 cm below the inguinal ligament in the right femoral vein (1.6 mm, 14 gauge, Arrow International).
After catheterization, a primed continuous infusion of sodium [1-13C]lactate (Cambridge Isotope Laboratories, Andover, MA, USA) was started (prime 13, 0.8 μmol per kg per min) (Figure 1). In addition, a priming bolus of H13CO3 was given to prime the bicarbonate pool for accurate lactate oxidation measurements. After a baseline period of 2 h, an intravenous sodium lactate (Pharmacy of the Rigshospitalet, Copenhagen, Denmark) infusion was started for increasing systemic lactate levels to ∼4mmol/L. The sodium lactate infusion rate was 50 μmol per kg per min for the first 20mins, thereafter the infusion rate was reduced to 36 μmol per kg per min for the remainder of the study. On the start of the sodium lactate infusion, the continuous infusion rate of sodium [1-13C]lactate was increased 3- and 10-fold during the 30mins of exercise at 75% VO2max to minimize changes in lactate enrichment. The arterial lactate enrichment was on average 0.0550 ± 0.0041, 0.0485 ± 0.0020, and 0.0433 ± 0.0065 tracer-to-tracee ratio at rest, rest and lactate infusion, and exercise and lactate infusion period, respectively. Blood samples were obtained simultaneously from the artery and the jugular and femoral veins before and 90, 105, and 120mins after the start of the primed continuous [1-13C]lactate infusion. Immediately after the last sample, a 90-min sodium lactate infusion was started and blood samples were obtained after 60, 75, and 90mins. This was followed by 30mins of cycling exercise at 75% VO2max, during which blood samples were obtained every 10 mins. Blood was collected in ice-cold tubes, which contained 10 μL of 0.33mol/L EDTA/mL of blood. Furthermore, a separate blood sample was collected anerobically into preheparinized syringes (Radiometer, Copenhagen, Denmark), rotated, and kept on ice until analyzed for blood gas variables, including hemoglobin, oxygen (PO2) and carbon dioxide tensions (PCO2) and oxygen saturation (SO2), as well as lactate, glucose, potassium, sodium, and calcium (ABL 725, Radiometer). Furthermore, during blood sampling, respiratory variables were assessed breath-by-breath (Medgraphics, St Paul, MN, USA), and a separate breath sample was collected in a 5-L air bag (Hans Rudolph, Kansas City, MO, USA) from which 10 mL was aspirated into a vacutainer (BD Systems, Plymouth, UK) to determine expired 13C-labeled CO2.
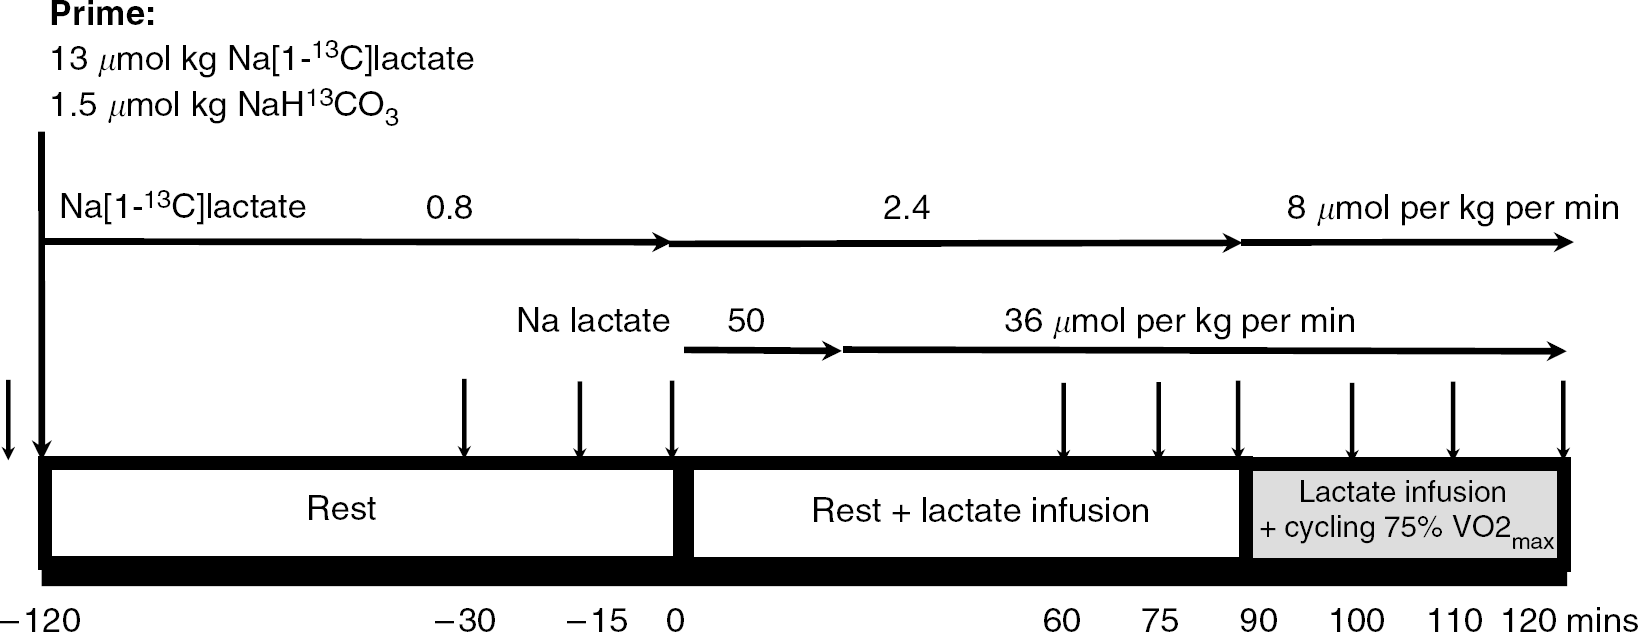
Flow scheme of the study protocol. The arrow above period squares signifies sample points.
The mean arterial pressure was measured using a transducer (Edwards Life Sciences, Irvine, CA, USA) placed at the level of the heart and interfaced using Dialogue 2000 (IBC-Danica, Rødovre, Denmark) sampled at 200 Hz (DI-720, Dataq, OH, USA), and variables were stored in a computer hard disk. Cerebral perfusion was evaluated using transcranial Doppler sonography (Multi-dop X4, DWL, Sipplingen, Germany) of the right middle cerebral artery. Depending on the position with the best signal-to-noise ratio, the proximal part of the middle cerebral artery was insonated at a depth of 40 to 60 mm from the temporal bone and the probe was secured with a headband. Data were continuously sampled using the DI-720 and stored on hard disk. The changes in transcranial Doppler flow were accounted for in the calculation of blood flow assuming a baseline resting cerebral blood flow of 1 L/min.
Analytical Procedures: Blood samples were vortex mixed and centrifuged at 4°C for 10 mins and stored at −40°C until analyzed for the enrichment of lactate and for the concentrations of glucose (Roche Unikit, Nuess, Germany) and lactate with an enzymatic method using LDH on an automatic analyzer (Cobas Fara, Roche, Basel, Switzerland). Lactate enrichment was measured using GC-MS (gas chromatography-mass spectrometry) (Automass II, Finnigan, France). For the GC-MS analysis, samples were processed to prepare a trimethylsilyl derivative of lactate, for which 1 mL of ethanol was added to 200 μL of plasma, centrifuged for 10 mins, and the supernatant was transferred into a new screw-capped tube, and evaporated to dryness under a stream of nitrogen. The dried material was redissolved in 50 μL of pyridine and 50 μL of Ar-(O-bistrimethylsilyl)-trifluoroacetamide with 1% trimethylchlorosilan (Pierce, Rockford, IL, USA) and incubated for 30mins at room temperature. The lactate enrichments were determined using split injection (ratio 1:25) of 1 μL into the GC-MS (GC column, CP-SIL 8CB, Chrompack, Middelburg, The Netherlands). The isotopic enrichment was determined using electron impact ionization. Ions at mass-to-charge ratio (m/z) 219 and 220 representing the molecular ions of unlabeled and labeled derivatives, respectively, were determined. Samples of arterial and venous blood and expired breath for measurement of 13CO2 enrichment were determined using GC-IRMS (gas chromatography-isotope ratio mass spectrometry) (Deltaplus, Finnigan MAT, Bremen, Germany). Ten milliliters of expired air was collected in a vacutainer. The 13C- to 12C ratio was determined using split injection (ratio 1:4) of 20 μL of the expired air on the GC-IRMS (GC-column, poraplot Q, Chrompack, Middelburg, The Netherlands). For the determination of blood CO2 enrichment, 0.5 mL of 2.5mol/L phosphoric acid was added to 0.5 mL of blood in a 10-mL vacutainer to release CO2. The tubes were brought to pressure with pure helium. The 13C- to 12C ratio was determined using split injection (ratio 1:10) of 20 μL of the headspace on the GC-IRMS.
Calculations
Whole Body Measurements: The total carbohydrate was calculated using stoichiometric equations (Frayn, 1983; Péronnet and Massicotte, 1991). Carbohydrate oxidation in μmol per min per kg body weight was determined by converting the rate of carbohydrate oxidation to its molecular equivalent by dividing it by the glucose molecular weight of 180g/mol.

The whole body lactate rate of appearance (Ra) at rest was calculated using the steady-state equation

where F is the isotopic infusion rate (μmol per min per kg body weight) and Ea the arterial isotope enrichment of lactate in the tracer–tracee ratio.
The whole body rate of lactate appearance (Ra) and disappearance (Rd) during exercise was calculated using the nonsteady-state equations of Steele, 1959 adapted for stable isotopes (Wolfe, 1992)


where E1 and E2 are the arterial isotope enrichments at sample times 1 (t1) and 2 (t2) (mins), respectively; Ca,1 and Ca,2 the arterial concentrations at times 1 and 2 (mmol/L), respectively; and pV the volume of distribution for lactate, 0.10 L/kg body weight (Stanley et al, 1985). Although a pV of 0.1 L/kg has been used earlierin studies of lactate kinetics, the assumption that this value is appropriate for resting and exercise conditions is obviated by the presence of near steady-state conditions.
Endogenous Ra = Total Ra—intravenous lactate infusion rate (36 μmol per kg per min).
Lactate oxidation rates were calculated as
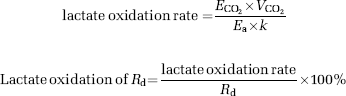
where ECO2 is the breath 13C-to-12C ratio, VCO2 the volume of CO2 (μmol per min per kg body weight), the conversion factor is 1 mol CO2 = 22.4L. k is the correction factor for retention of 13CO2 in the bicarbonate pools (0.80 at rest and 1.00 during exercise).
Cerebral and Leg Calculations: The net lactate and glucose uptake were calculated as

A positive value means a net uptake of glucose or lactate by the tissue, whereas a negative value means a net release.

Unidirectional lactate uptake = Fractional lactate extraction/100 × Ca × blood flow
Unidirectional lactate release = lactate uptake—net lactate balance

where CV,CO2, Ca,CO2, and Ev,CO2, Ea,CO2 are the blood CO2 concentration and enrichment in the tracer-tracee ratio in the veins and artery, respectively. Ca, Cv and Ea, Ev are the lactate concentration and enrichment in the tracer-tracee ratio in the artery and veins, respectively.
Statistics
All data are presented as mean ± s.e. of the mean. To determine the statistical significance of differences between interventions, a paired Student's t-test was performed. The level of significance was set at P < 0.05.
Results
Whole Body Lactate Kinetics
Arterial lactate increased from the basal resting concentration of 0.8 ± 0.08 to 3.9 ± 0.3 mmol/L with intravenous lactate infusion (36 μmol per kg per min), and to 6.9 ± 1.3 mmol/L with lactate infusion and bicycle exercise at ∼ 75% VO2max (Figure 2A). The intravenous lactate infusion, at a rate ∼2.5-fold higher than the basal endogenous lactate production, did not cause any change in the endogenous production. In contrast, the rate of lactate clearance increased in accordance with the intravenous lactate infusion rate (Figure 2B) by an increase in oxidation (Figure 2C), but even more so by an increase in the nonoxidative lactate disposal (Figure 2D). Lactate appearance and disappearance increased many fold during 30 mins of bicycle ergometer exercise at a workload of 75% VO2 with oxidation being the primary route of lactate clearance.
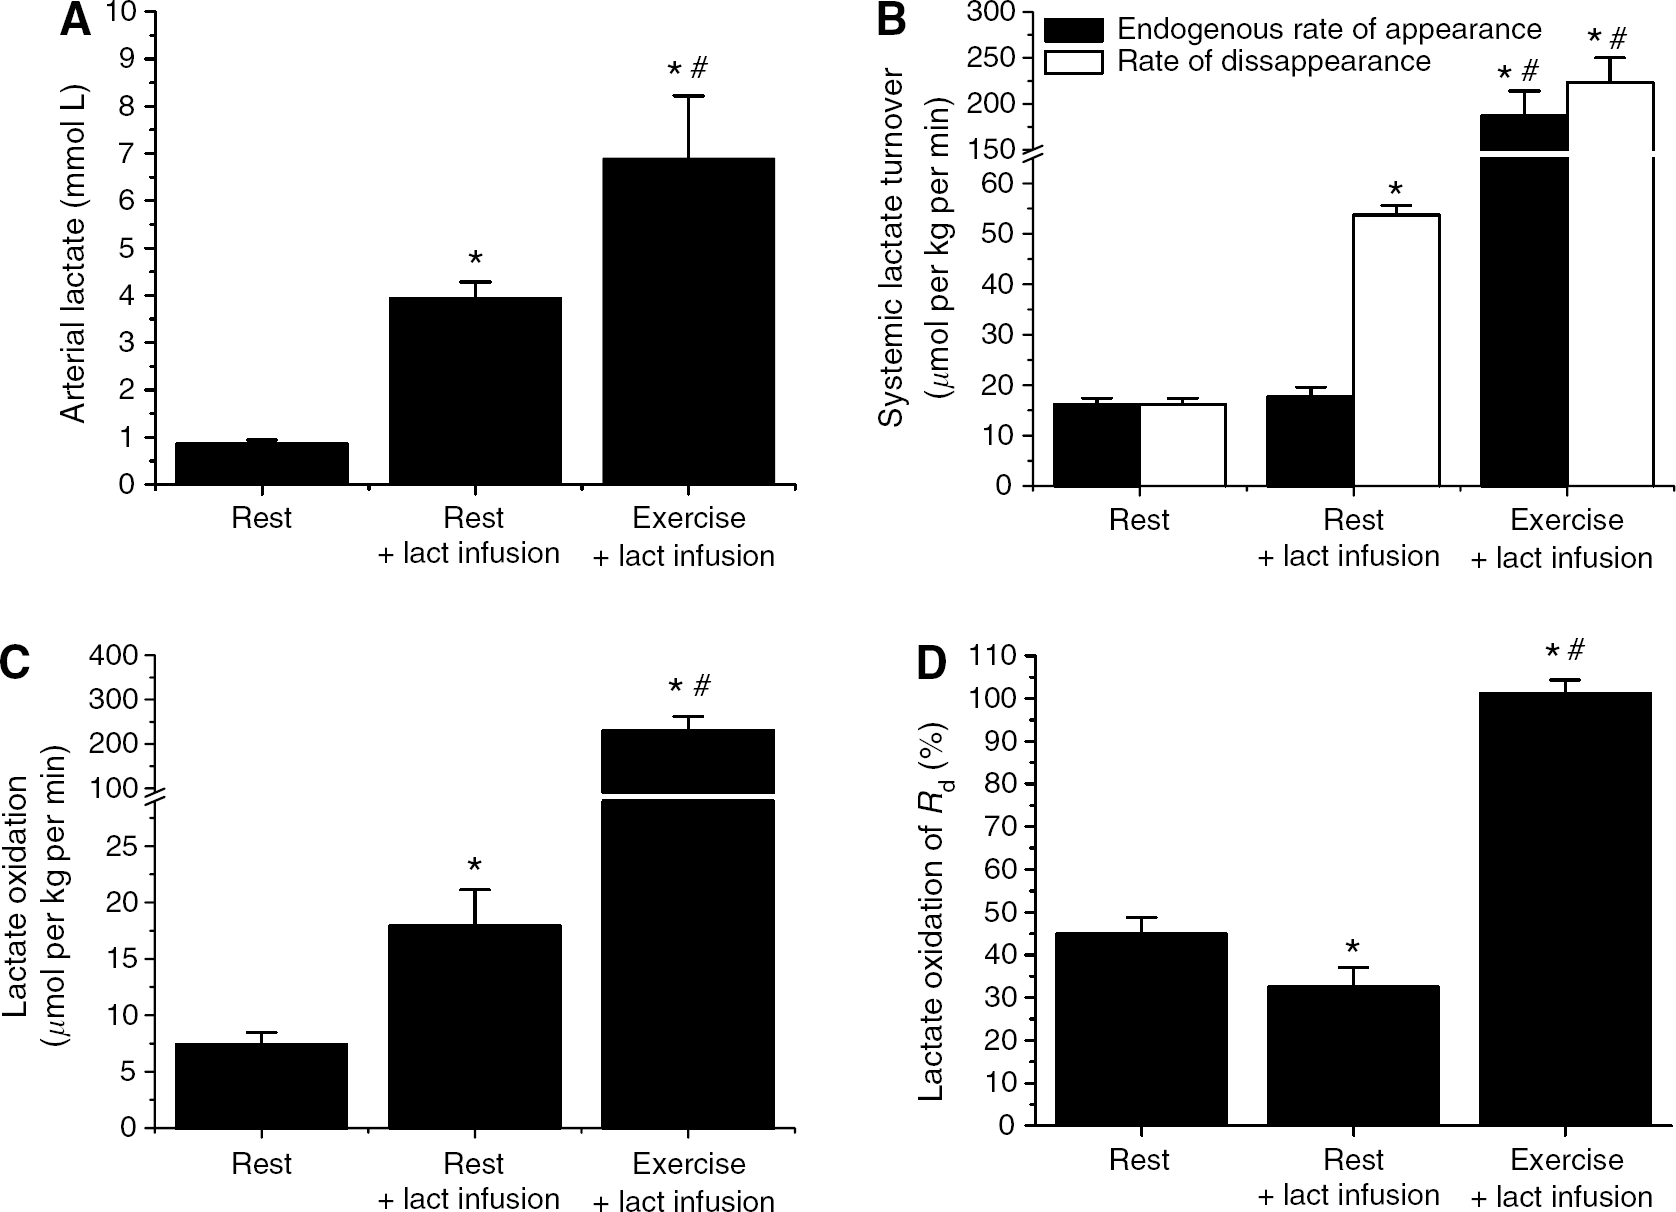
Whole body arterial lactate (Lact) concentration (
Tissue Lactate Kinetics
Under resting condition, the brain and skeletal muscle released small quantities of lactate (Figure 3A). However, both tissues continuously took up lactate but in lesser quantities than that were simultaneously released, resulting in the small net lactate release (Figure 3C and 3D). Under basal resting condition, 10% of the lactate delivered to the brain was extracted (Figure 3B). During intravenous lactate infusion, fractional extraction was reduced in both tissues; however, as arterial lactate was more than four-fold increased, the absolute quantity of lactate taken up was considerably increased. A further increase in brain lactate uptake occurred with exercise (Figure 3C). It is equally clear for both tissues that an increase in arterial lactate did not cause any change in lactate release (Figure 3D). During exercise, a small increase in brain lactate release, relative to lactate uptake, was observed which might be related to increased neural activity. The lactate taken up by the brain was almost completely oxidized, which is remarkably different from skeletal muscle in which near complete oxidation was only observed during exercise (Figure 3E and 3F).
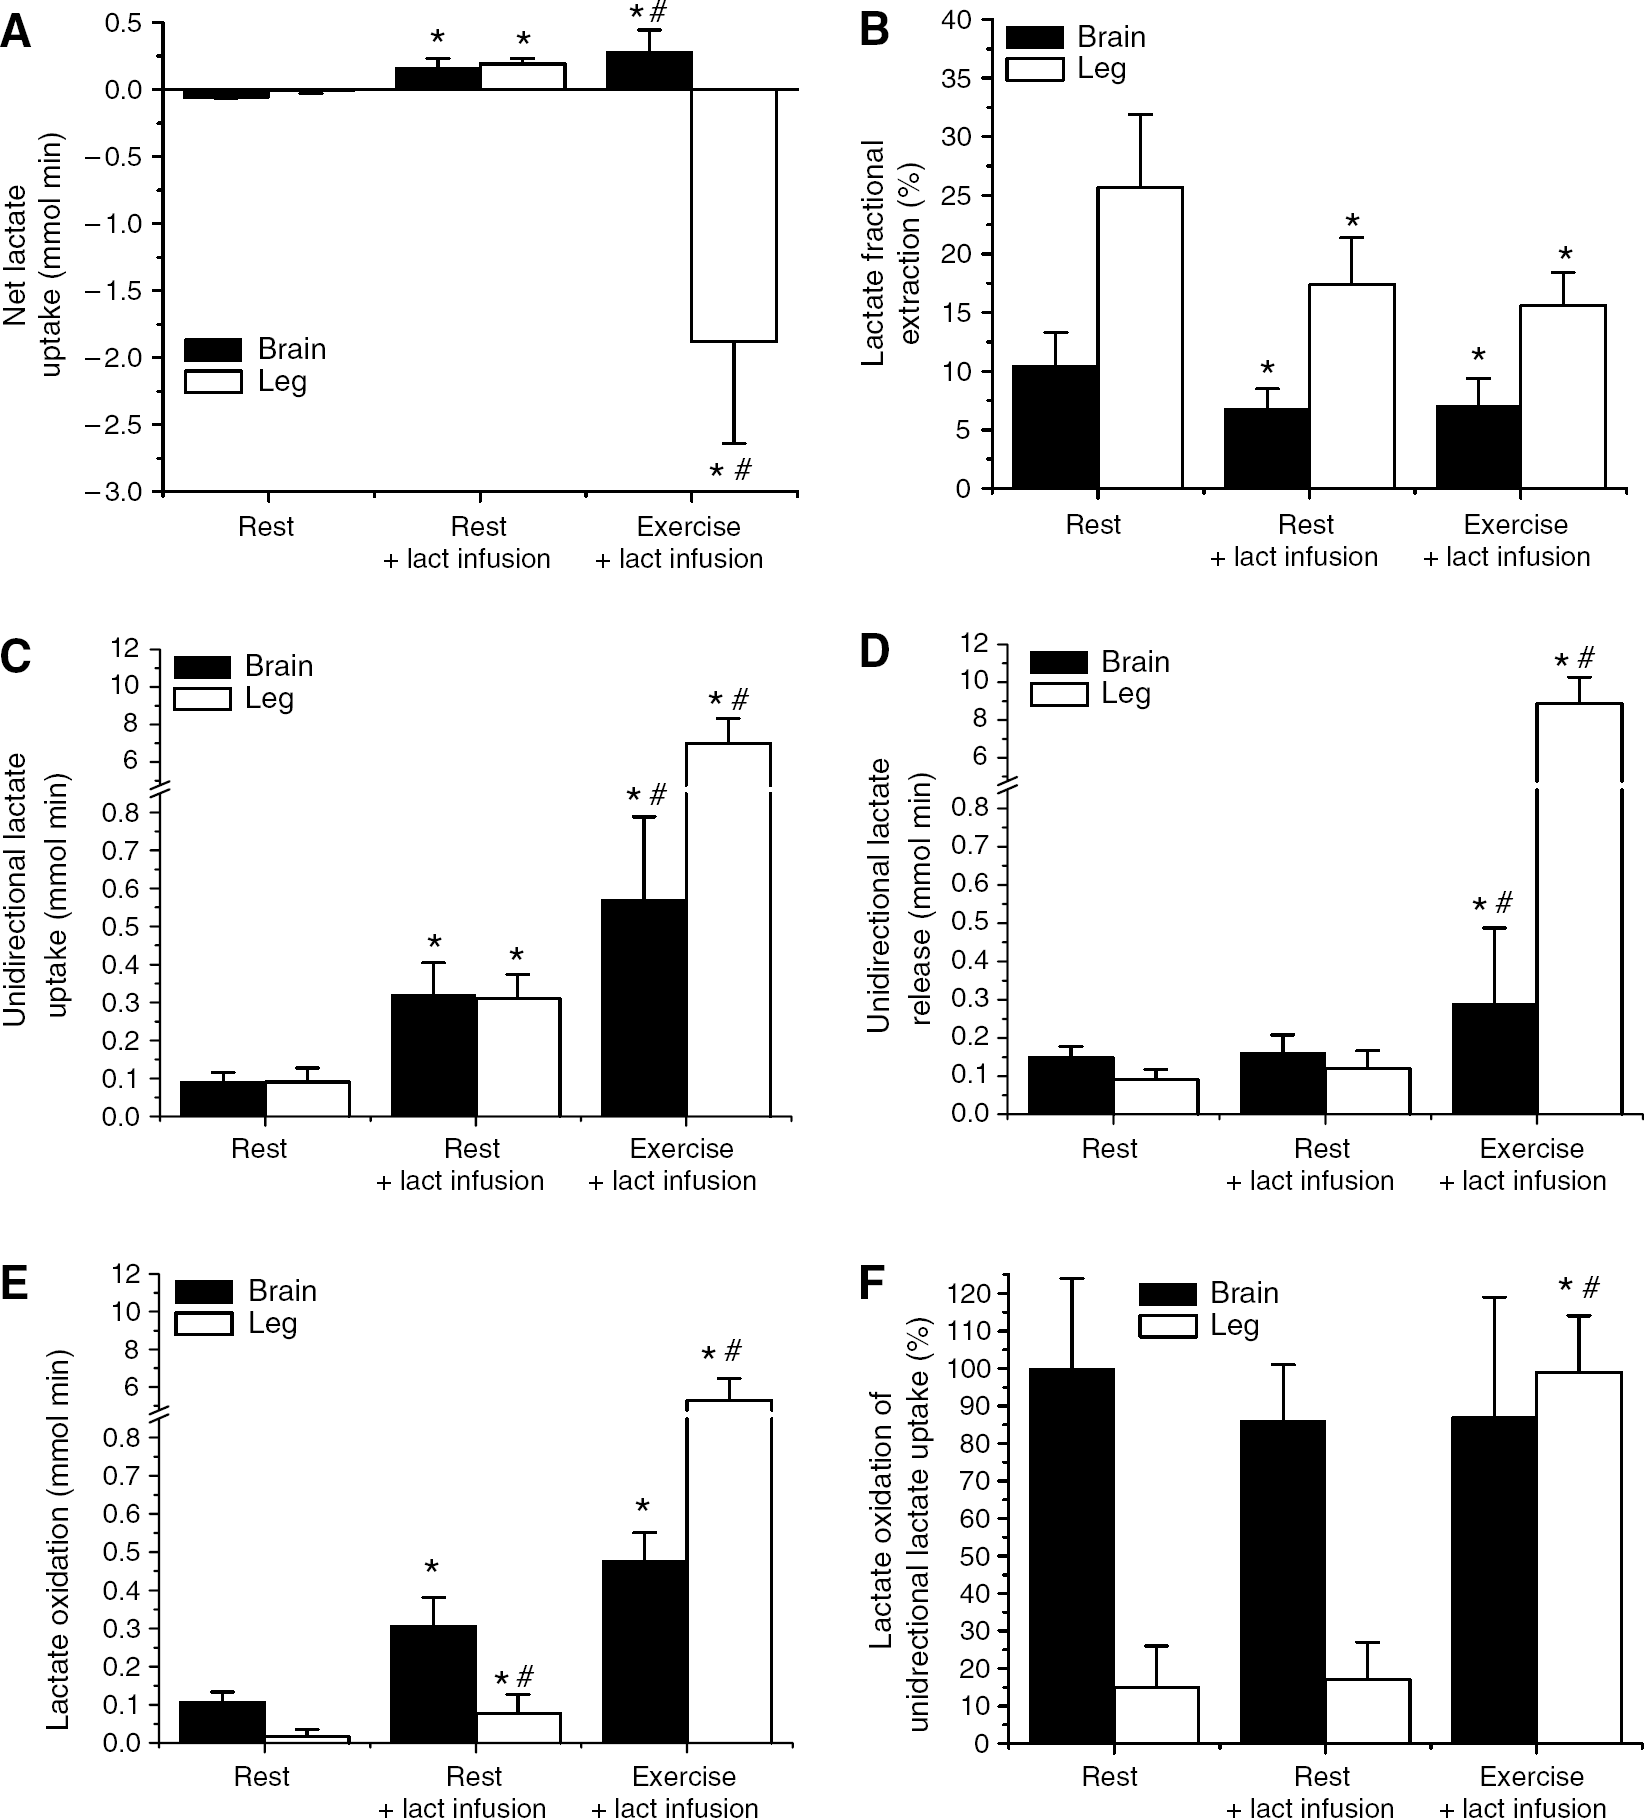
Tissue lactate (Lact) kinetics. Tissue net lactate uptake and release (
Tissue Glucose, Carbohydrate, and Lactate Interaction
The net glucose uptake by the brain was decreased during intravenous lactate infusion (Figure 4A). Under all conditions, the brain respiratory quotients were ∼1.0 suggesting a 100% carbohydrate oxidation, i.e., glucose, glycogen, or lactate. However, as oxygen uptake was somewhat increased during lactate infusion and further with exercise, the total carbohydrate utilization increased. In contrast, during lactate infusion, a shift in whole body fuel utilization from fat to carbohydrate was observed. Obviously, a large increase in total carbohydrate utilization of ∼ 60-fold was observed during exercise to meet the increased energy demand (Figure 4B). Under basal condition, lactate oxidation was responsible for ∼8% of the brain energy requirements and increased to ∼ 20% during intravenous lactate infusion. Exercise with even further increase in lactate delivery to the brain did not cause any further increase in the contribution of lactate to energy requirements of the brain. The contribution of lactate oxidation to the resting skeletal muscle carbohydrate oxidation was somewhat increased with lactate infusion, albeit far less than observed for the brain, whereas its contribution during exercise diminished because of the large contributions of both blood glucose and, in particular, muscle glycogen (Figure 4C).
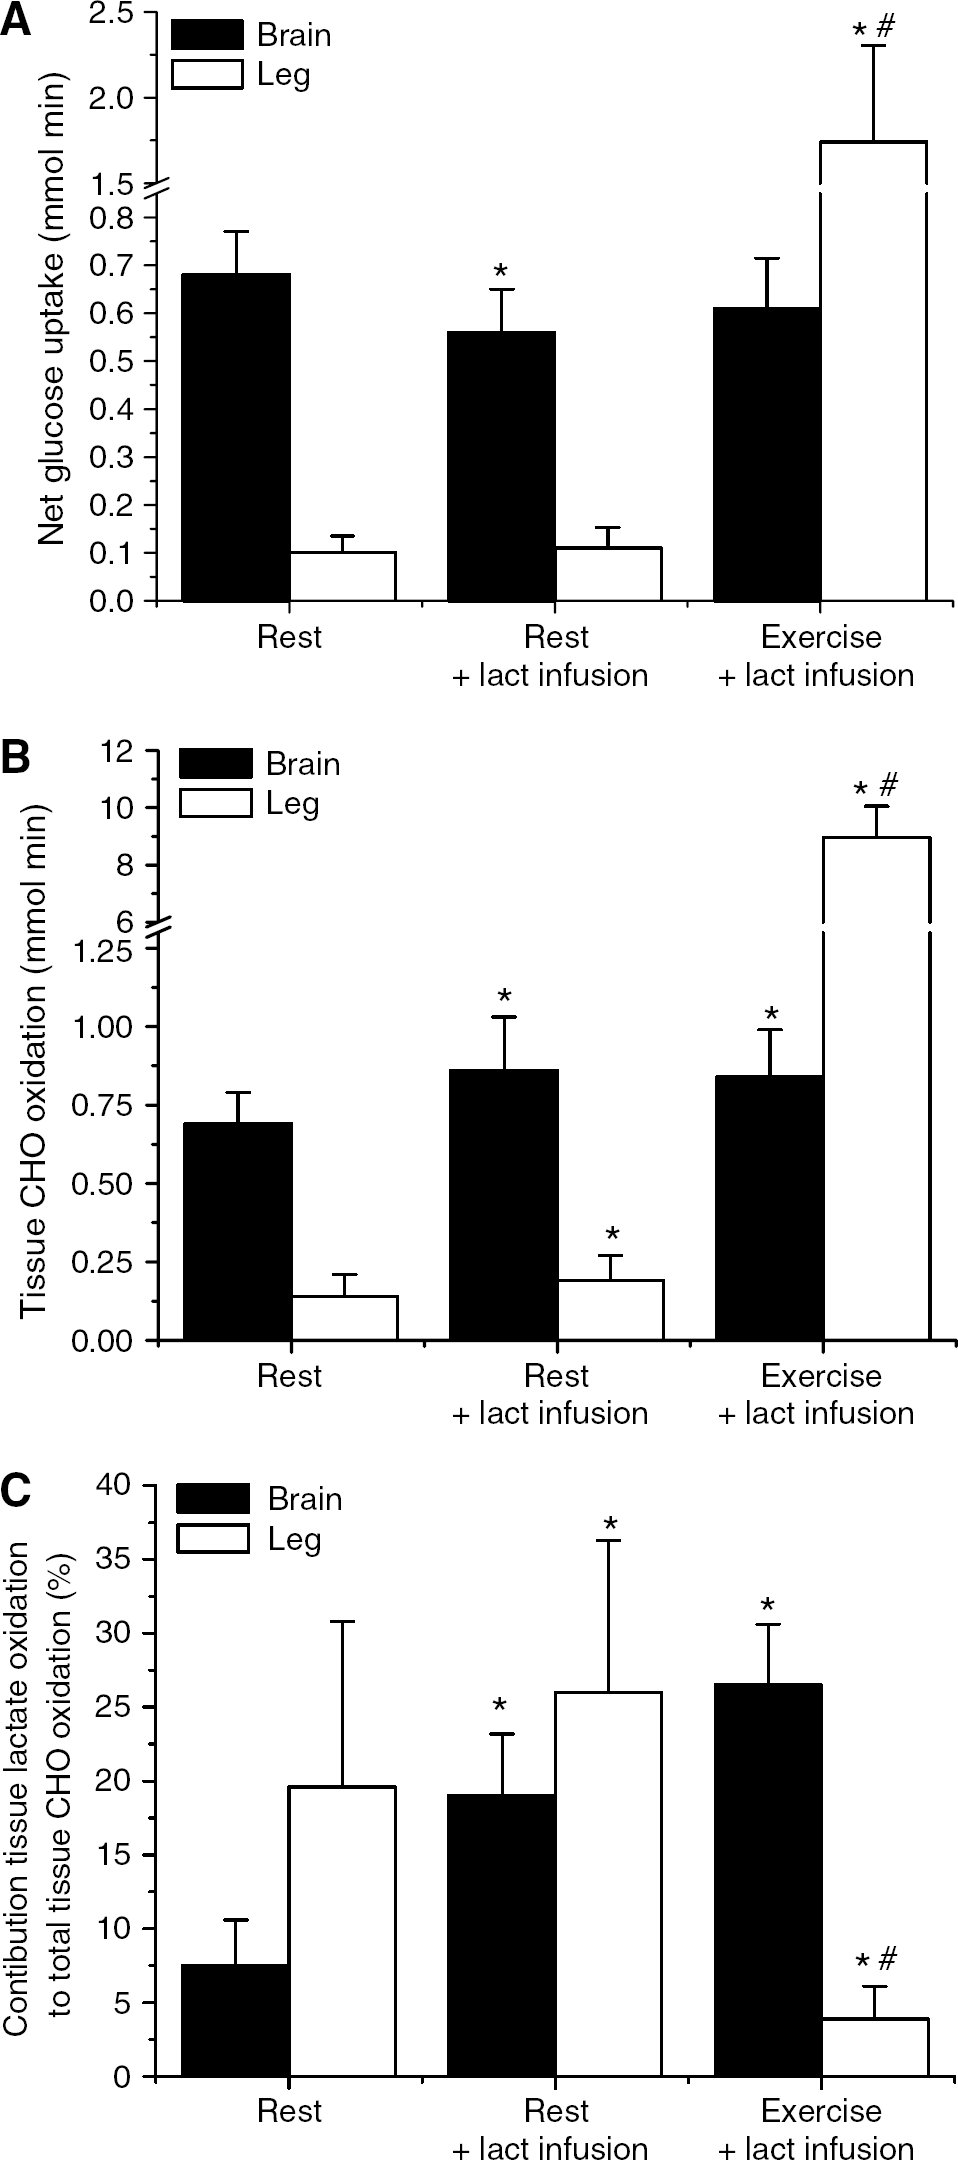
Tissue glucose uptake (
Discussion
The most important finding of this study is that the conscious healthy human brain uses blood lactate next to glucose as a substrate. We showed that virtually all lactates taken up by the brain were oxidized accounting for ∼ 8% of its energy requirements. Moreover, it was shown that the brain is flexible in its use of lactate as an energy source as increased lactate availability through intravenous lactate infusion or exercise made the brain to take up and oxidize even more lactate with a simultaneous decrease in glucose uptake. Cerebral lactate oxidation could cover up to 20% to 25% of total energy demand. Moreover, it was shown that lactate does not accumulate in the brain under the various conditions in contrast to what has been suggested earlier (Leegsma-Vogt et al, 2004).
The fractional brain lactate extraction at rest was ∼10%, which is quite similar to the 15% found in a variety of cerebral disorder patients using another technique (Knudsen et al, 1991). The fractional extraction of lactate decreased during intravenous lactate infusion, which caused a four- to five-fold increase in the plasma lactate concentration. However, the absolute unidirectional lactate uptake increased. In fact, the arterial lactate concentration is highly correlated with the unidirectional brain lactate uptake (Figure 5). In contrast, no association existed between arterial lactate and unidirectional lactate release. These observations are similar to those in skeletal muscle (van Hall et al, 2003). It has been suggested that brain lactate utilization is limited because of a low lactate transport capacity of the blood–brain barrier (Cremer et al, 1976). However, from the linear relationship between arterial lactate concentration and unidirectional uptake, it seems that no limitation exists in the blood–brain barrier lactate transport capacity within the physiologic range, confirming the observation by Quistorff et al (2008) that brain net lactate uptake during exercise increases with arterial lactate concentrations up to 15mmol/L. Another suggestion for a low brain lactate uptake was a limited lactate blood–brain barrier diffusion capacity owing to a low lactate concentration gradient (Dienel and Hertz, 2001). At first, this seems to be confirmed by our correlation of arterial lactate and unidirectional lactate uptake. However, we infused lactate for 90mins, and the only way to maintain a high lactate gradient across the blood–brain barrier is for the brain to clear the incoming lactate for maintaining low brain lactate levels compared with plasma. Thus, the driving force for lactate uptake would be brain lactate metabolism, i.e., oxidation. However, before lactate can be oxidized, it has to be converted to pyruvate by the equilibrium enzyme, LDH. Most likely, an increase in intracellular brain lactate drives the LDH reaction to pyruvate formation and to subsequent oxidation and limits the formation of pyruvate from blood-borne glucose, or potentially from glycogen in the astrocytes. In support, the brain extracellular lactate level was found to be similar, or even higher, as compared with the plasma concentrations of conscious patients with a tendency for higher extracellular concentration with increased plasma lactate (Abi-Saab et al, 2002). In contrast, Dalsgaard et al (2004) did not find a change in cerebrospinal fluid lactate concentration (1.2mmol/L) after exhaustive exercise with arterial lactate levels of ∼14mmol/L. Therefore, there exists the possibility of relatively small increases in the brain local lactate concentration that drives lactate utilization by shifting the LDH reaction to pyruvate formation and to subsequent oxidation. This enhanced lactate oxidation prevents brain lactate accumulation and is thus, the driving force for maintaining a high blood–brain lactate gradient and hence lactate uptake.
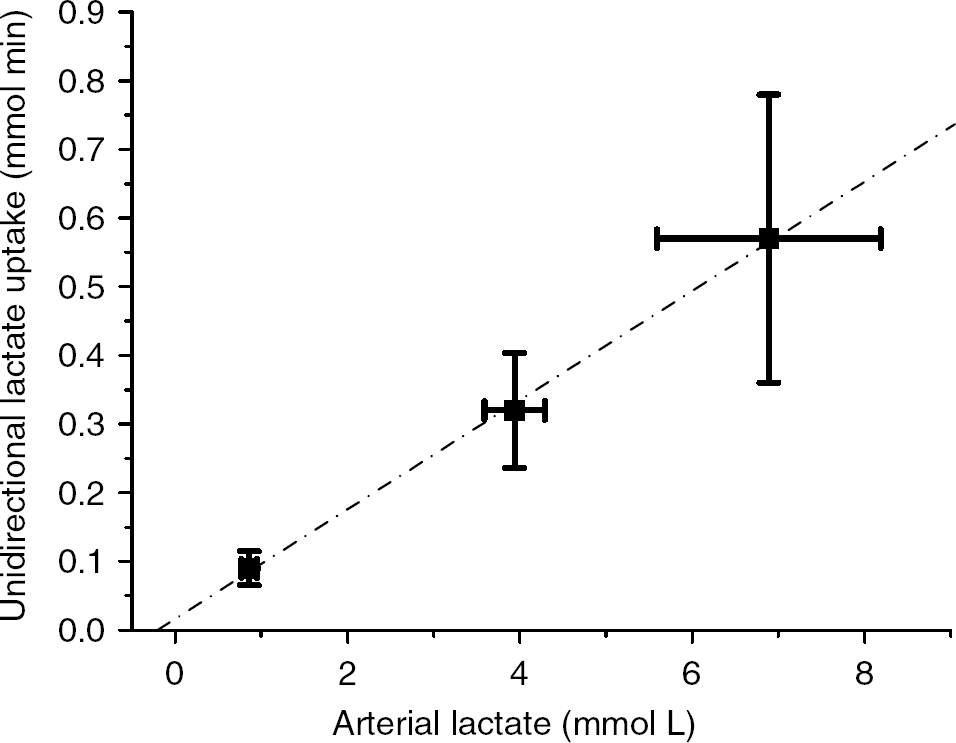
Relation between arterial lactate concentration and unidirectional brain lactate uptake. Linear fit Y= 0.080X–0.017, r = 0.993, P = 0.023.
Virtually all 13C-label from the [1-13C]lactate taken up by the brain was recovered in CO2,similar to what was found in the near-term fetal sheep (Turbow et al, 1995). This suggests little mixing from blood-borne lactate with brain formed lactate and little carbon being exchanged from lactate to other metabolites. Owing to the structural organization of brain tissue, it may be that lactate is rapidly transferred from astrocyte to neurons, through the extracellular space before being exchanged with the glycolytic pool. However, as mentioned above, the conversion of lactate to pyruvate depends on pyruvate and lactate concentrations and on redox conditions in the LDH microenvironment. For skeletal muscle, it is suggested that the simultaneous processes of lactate uptake and release is not taking place in different muscle cell types, the oxidative slow twitch fibers, and the glycolytic fast twitch fibers, respectively. However, the lactate uptake and subsequent oxidation versus production takes place in the same cell depending on the local intracellular milieu, myocellular compartmentalization (Brooks, 1991; van Hall, 2000). In addition, the overall picture on skeletal muscle LDH activity and isoform patterns is that the heart type LDH (1) does not necessarily favor pyruvate production and the muscle type LDH (5) lactate production, but that all LDH isoforms in vivo have the ability to produce or consume lactate depending on local lactate and pyruvate concentrations and on redox state (Newsholme, 2003; van Hall, 2000). There is convincing evidence that patients with only the heart type LDH (1) isoform in skeletal muscles do accumulate lactate during ‘semiischemic’ exercise and, in fact, in excess of their absolute LDH activity (Kanno and Maekawa, 1995; Miyajima et al, 1995), and that skeletal muscle can quickly switch from lactate release to an uptake depending on lactate concentration and activity (Richter et al, 1988; van Hall et al, 2003). The question is whether these suggestions for skeletal muscle lactate metabolism are helpful for interpreting our findings on brain lactate metabolism. Astrocyte and neuron localization, astrocytic compartmentalization, and LDH activity and isoforms suggests that a typical astrocyte has three major anatomic areas, namely the soma (cell body), the larger processes (including those associated with arterioles and venules as endfeets), and the very fine surface extensions lamellae and filopodia, also called peripheral astrocytic processes, which are in close apposition with neuronal elements (including synapses) (Nedergaard et al, 2003; Hertz et al, 2007). Therefore, in analogy with the suggestions for skeletal muscle, subcellular regions within astrocytes may differ in their spatial and temporal dependence on the glycolytic and oxidative pathways. The astrocytic oxidative capabilities reside in the soma and larger cell processes that contain the mitochondria (Wolff and Chao, 2004). The threadlike peripheral astrocytic processes cannot accommodate mitochondria that are approximately twice as wide. However, they may respond rapidly to an increase in energy demand from glycolytic or glycogenolytic-derived ATP because they have access to glucose and contain glycogen deposits in contrast to neurons (Hertz et al, 2007). Moreover, O'Brien et al (2007) have shown that the primary culture of rat astrocytes and neurons contain all LDH isoforms with small differences in the relative presence of different isoforms. They suggested differences in activity and isoform between synaptosol and cytosol from neurons and astrocytes. Moreover, Hertz and Dienel (2005) concluded that in both cells the facilitated diffusion is fast enough that, under most conditions, lactate fluxes will be determined by the rate of metabolism-driven uptake. However, astrocytes have a higher rate of facilitated transport and can increase the rate of uptake to a much greater extent than neurons when the lactate concentration increases. Therefore, in vivo blood-borne lactate may cross the capillary endothelial barrier into the astrocytic endfeet causing an increase in the local lactate concentration that, together with a relative low local concentration of pyruvate because of the large demand for pyruvate by astrocytic endfeet and possibly soma mitochondria to cover the high energy demands of astrocytes, pushes the LDH reaction to pyruvate formation and to subsequent oxidation. Simultaneously, in the narrow astrocytic peripheral astrocytic processes, devoid of mitochondria, glycolysis/glycogenolysis is required for additional local ATP production and in order not to rely fully on ATP diffusion or convection (Hochachka, 2003; Kaasik et al, 2003) from endfeet or soma mitochondrial ATP. This would cause a relative high local pyruvate and NADH concentration driving LDH to lactate formation and release into the extracellular space. The released lactate can be either taken up by neurons, neighboring astrocytes, or released into the circulation. On activation, an acute demand for energy in the peripheral astrocytic processes may cause an enhanced glycolytic rate, but more likely a far more pronounced increase in glycogenolytic rate, and hence an increase in lactate release as observed in brain activation and in this study during exercise. Several observations support our hypothesis of astrocytes as a potential primary site of a simultaneous brain lactate uptake and subsequent oxidation and lactate production. Primary cultures of astrocytes have a higher rate of oxygen utilization and lactate oxidation as compared with neurons (Peng et al, 1994). The incorporation of 13C-label from lactate into glutamate was much lower in astrocytes than in neurons (Waagepetersen et al, 1998), suggesting less active tricarboxylic acid-cycle exchange reactions in astrocytes. This may explain our observation of near complete recovery of 13C-label from lactate in CO2, taking into account that the 13C-label in position 1 of lactate is far less prone to be lost in exchange reactions compared with label in the position 2 or 3 of lactate (van Hall, 1999). In addition Zielke et al (2007), by in vivo microdialysis of rat hippocampus, found an equally high rate of interstitial lactate oxidation by astrocytes and neurons, and increased interstitial lactate levels caused a decrease in astrocyte glucose oxidation. The suggested astrocyte metabolic compartmentalization is supported by the observation that lactate originating from glycogen is compartmentalized from that of glucose in cultured astrocytes (Sickmann et al, 2005). However, in contrast to our hypothesis was this metabolic compartmentation attributed to astrocytic mitochondrial heterogeneity (Waagepetersen et al, 2001). The proposed model for astrocytes, with a simultaneous blood-borne lactate oxidation and lactate production, may be equally applicable for neurons in case blood lactate diffuses through the basal lamina and interstitium to neurons as suggested for glucose (Simpson et al, 2007).
Inherent to the proposed model is that a substantial glycolytic-glycgenolytic rate is mandatory for brain function. Such a scenario might explain why lactate, or ketone bodies, does not seem to be able to cover the energy requirement of the brain completely. The highest value reported is after long-term fasting when ketone bodies replace glucose by 60% of total brain energy demand. In that respect, it is clear that quantitatively ketone bodies are more important than lactate as an alternative energy source because it is impossible to maintain for a long time, increased lactate levels to increase its contribution from the 8% as reported in this study.
We conclude that blood lactate is taken up and subsequently oxidized by the conscious healthy human brain, and that the contribution of lactate as a brain energy source increases under conditions of increased lactate concentrations at the expense of blood glucose. Moreover, we suggest that next to the potential astrocyte-neuron lactate shuttle, an astrocyte, and possibly a neuron, intracellular lactate shuttle exists in analogy to the suggestions made for skeletal muscle.