
Abstract
We investigated microvascular reactivity to synaptic train stimulation after induction of subarachnoid hemorrhage in adult rats, analyzing tissue oxygen levels [pO2] in intact hippocampus. In control rats, hippocampal pO2 averaged 11.4 mm Hg whereas hemodynamic responses averaged 13.1 mm Hg (to a 25 s train). After subarachnoid hemorrhage (at 2 days), we recorded a dramatic elevation in baseline pO2 in the hippocampus (to 68.4 mm Hg) accompanied by inverted pO2 responses to synaptic train stimulation (−9.46 mm Hg). These significant changes in baseline hippocampal pO2 and inverted pO2 responses after subarachnoid hemorrhage indicate severe alterations of neurovascular coupling and neuronal viability.
Keywords
Introduction
Despite treatment of subarachnoid hemorrhage (SAH) to obliterate the offending aneurysm, 1 recovery may be complicated by delayed cerebral vasospasm (DCV) 2 and delayed cerebral ischemia (DCI), including hippocampal damage. 3 Though nimodipine improves clinical outcome 4 targeting angiographically defined cerebral vasospasm in proximal vessels with endothelin receptor antagonists did not demonstrate clinical improvement, 5 suggesting that DCI also arises from pathophysiology of the microcirculation.6,7 Thus, altered microvascular reactivity after SAH may compromise tissue substrate delivery at a critical time during recovery, causing delayed cell death in vulnerable brain regions such as the hippocampus.
We investigated microvascular reactivity in an intact hippocampal preparation after induction of SAH,6,8 using tissue oxygen recordings [pO2] to estimate neurovascular coupling following neuronal stimulation trains. 9 Compared to control preparations, at 2 days after SAH, we observed a dysregulation of both baseline pO2 and stimulus-induced tissue pO2 neurovascular coupling response.
Methods
In vivo hippocampal preparation
All animal experiments were approved by the Duke University Institutional Animal Care and Use Committee, which follows all statutes of the Animal Welfare Act (Public Law 98-198, USA), and were fully compliant with the ARRIVE guidelines. Adult Sprague-Dawley rats (of either gender) were induced with isofluorane 1.8–2.0%, maintained with isofluorane 1.2% after intubation, temperature controlled at 37℃, and a small, right craniotomy was performed (Figure 1) to expose the neocortex.
10
Tail blood pressure was rigorously maintained at >65 mm Hg mean and the animal ventilated at 1 Hz with 30% inspired O2, using a respirator linked to the imaging. A small section of the overlying neocortex was gently removed (i.e. 1.5 × 2 mm), peeling this thin layer (i.e. <1 mm) away from the ventricular hippocampal surface with gentle suction and hemostasis (Figure 1).
10
In vivo hippocampus imaging and oxygen responses. (a) The left image shows a lateral view of the rodent brain with the underlying hippocampus outlined and the opened box indicating the craniotomy and neocortical exposure of the ventricular surface of the right hippocampus, with an example of a typical evoked field response following synaptic stimulation (calibration 5 ms horizontal and 0.5 mV vertical). (b) It shows an image of the exposed, ventricular surface of the hippocampus indicating the position of the stimulation, recording and oxygen electrodes (scale = 1 mm); medial is to the left and anterior to the top. The subtraction images shown in (c) are from the control in vivo hippocampus, with images at 0, 1, 7 and 36 s during and after a 25 s train. Note the large blue (decreased reflection) patch occurring temporally and laterally following the stimulation (c). The scale bar on the right shows ±2% difference compared to control, with green as no difference. (d) It shows an example of the IOS response at 2 days after SAH: note that the stimulus-induced changes in IOS are attenuated after SAH compared to control (c). (e) and (f) show a superimposed time course of both IOS and tissue pO2 responses, with the IOS showing a shorter time to peak than the hemodynamic response. In contrast to control rats, the critical difference noted in SAH rats is the significantly higher resting tissue pO2 level and a negative tissue pO2 response to the synaptic train (f).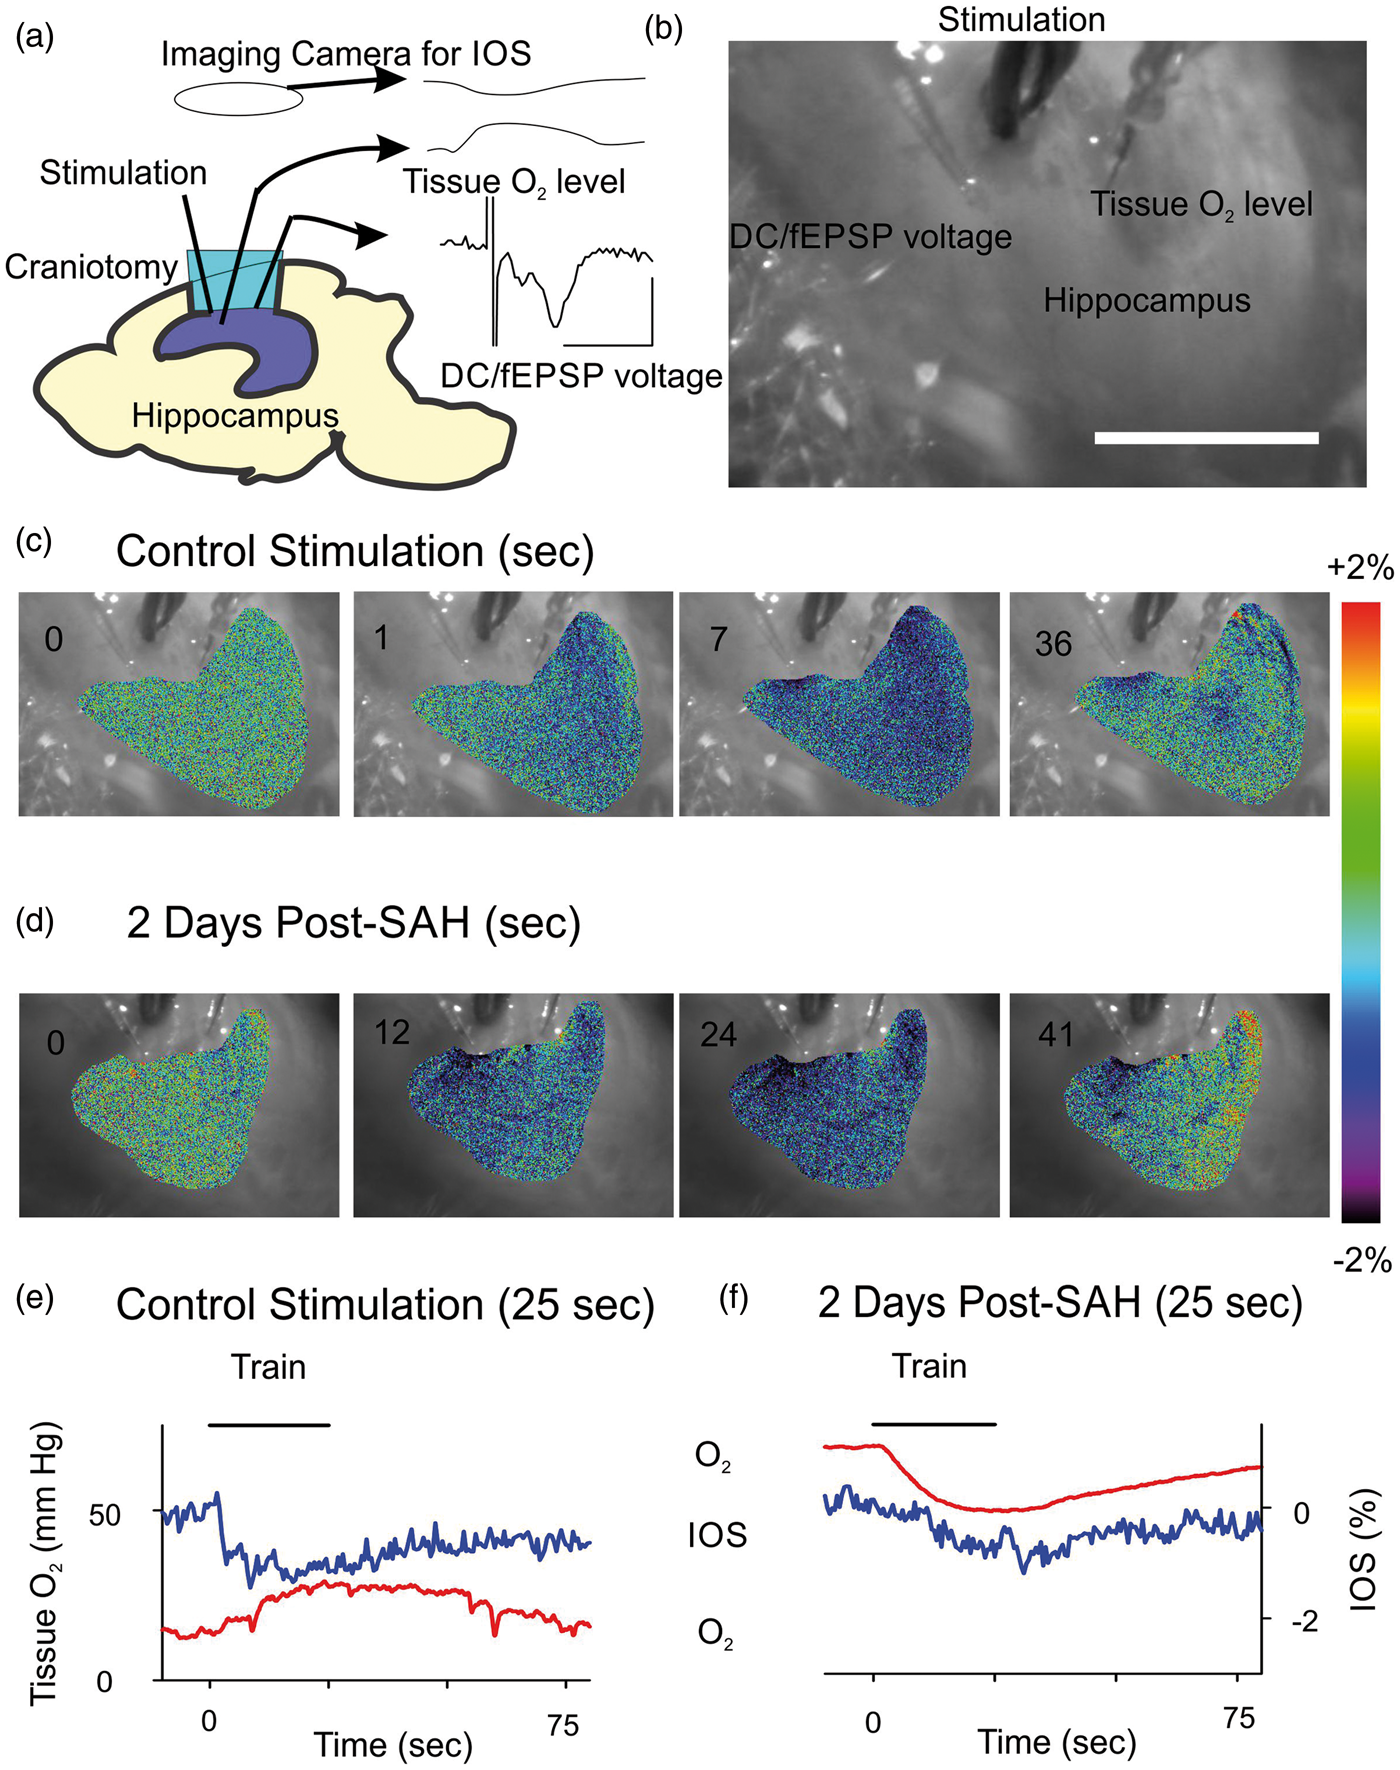
Physiological measurements
The Schaffer collateral/commissural pathway was stimulated (150 µs, 0.1–0.3 Hz) with a bipolar electrode with the stimulus intensity adjusted to evoke a postsynaptic field potential in CA1 stratum radiatum, which was recorded using extracellular glass microelectrodes filled with 0.2 mol/L NaCl (4–8 MΩ). The glass oxygen electrode (Unisense, 10 µm) was inserted into stratum radiatum (Figure 1(a) and (b)); the electrode was calibrated both before and after each experiment using 0 and 21% O2. Clampex (Digidata 1440 digitizer, Axon Instruments) was used for recording blood pressure, physiological responses and pO2. Values are shown as Mean ± Standard Deviation.
Intrinsic optical signal recording
Intrinsic optical signal (IOS) was monitored using illumination at a 45° incident angle, with scattering detected by a 12-bit digital cooled CCD camera (Sensicam, 40 ms exposure, acquired at 2 Hz) via a dissecting microscope. 11 The percent change in IOS was calculated by the equation [100 × (ΔF/F)].
Induction of SAH
We used the filament puncture model in the rat, which involves exposure of the right carotid artery and inserting a small suture into the right carotid artery, which is then used to perforate the intracranial carotid artery. 6 These physiological experiments were performed at 2 days after the induction of SAH, which is the peak of the delayed vasoconstriction in rats. 6 At the end of the experiment, the basal cisterns were directly inspected to confirm presence of residual SAH.
Results
Figure 1(a) shows a lateral diagram of the rat brain and the experimental setup, indicating the craniotomy and the underlying right hippocampus, with neocortex removed. 10 Figure 1(b) is a direct camera image of the hippocampus, showing the electrode placement in the CA1 region. A typical evoked field excitatory postsynaptic potential (fEPSP) response was obtained (Figure 1(a)) in response to stimulation pulses at 50% maximum response (i.e. ∼150 µA).
Control experiments
Control animals were un-operated prior to the physiological experiment. A short train of stimulation pulses (10 Hz, 25 s) was applied while recording tissue pO2 and IOS imaging, shown as difference subtraction images (Figure 1(c)). The IOS imaging response varied but was typically an irregular pattern, with an initial decrease of light scattering and a slow return to baseline, defining the area of neuronal activation (n = 10 control animals). Figure 1(e) compares the time course of the IOS changes with the tissue pO2 response. A transient increase in pO2 above the baseline level in control animals was routinely observed in response to the synaptic trains, confirming a hemodynamic response with excess vascular delivery of O2 to the tissue (Figure 1(e)).
The baseline oxygen level within the stratum radiatum averaged 11.4 ± 9.29 mm Hg (n = 36 baseline measurements) and the net, positive tissue pO2 response following the train stimulation averaged 13.1 ± 7.8 mm Hg above the baseline (n = 36 stimulation trials) (Figure 2(e)). The time course of the tissue pO2 response consisted of a rapid increase that peaked just at the end of the stimulation train, followed by an immediate tissue pO2 decline toward baseline levels (Figure 1(e)). These results confirm intact neurovascular coupling (n = 36 different trials from n = 10 animals). Tissue pO2 can provide a surrogate marker for cerebral blood flow
9
though there can be differences between oxygen and blood flow hemodynamic responses (since O2 is a critical substrate if not in excess), particularly if the oxygen supply is insufficient to meet tissue metabolic demand resulting in lowered tissue oxygen. Note that the IOS peaked at an earlier time point compared to the blood flow, indicating that the IOS showed stimulation-dependent tissue swelling.
12
Correlation of baseline tissue oxygen and hemodynamic responses. (a) It shows a comparison of the control (positive) and post-SAH (negative) responses to train stimulation. There was no significant difference between the absolute value of the amplitude of the values (SEM shown). (b) It shows the relationship between baseline tissue pO2 and the amplitude of the positive responses in the control situation (as a percent of the baseline × 10 for clarity), showing that above 10 mm Hg the positive responses may decrease (as a percentage) whereas below 10 mm Hg, there is an increased response. This was best fit with a nonlinear, polynomial regression (R = 0.88), shown as a dashed line. (c) The negative pO2 synaptic train response at 2 days after SAH was of similar amplitude across different experiments, independent of baseline tissue oxygen levels (R = 0.08 with a linear fit, shown as a dashed line).SAH: subarachnoid hemorrhage.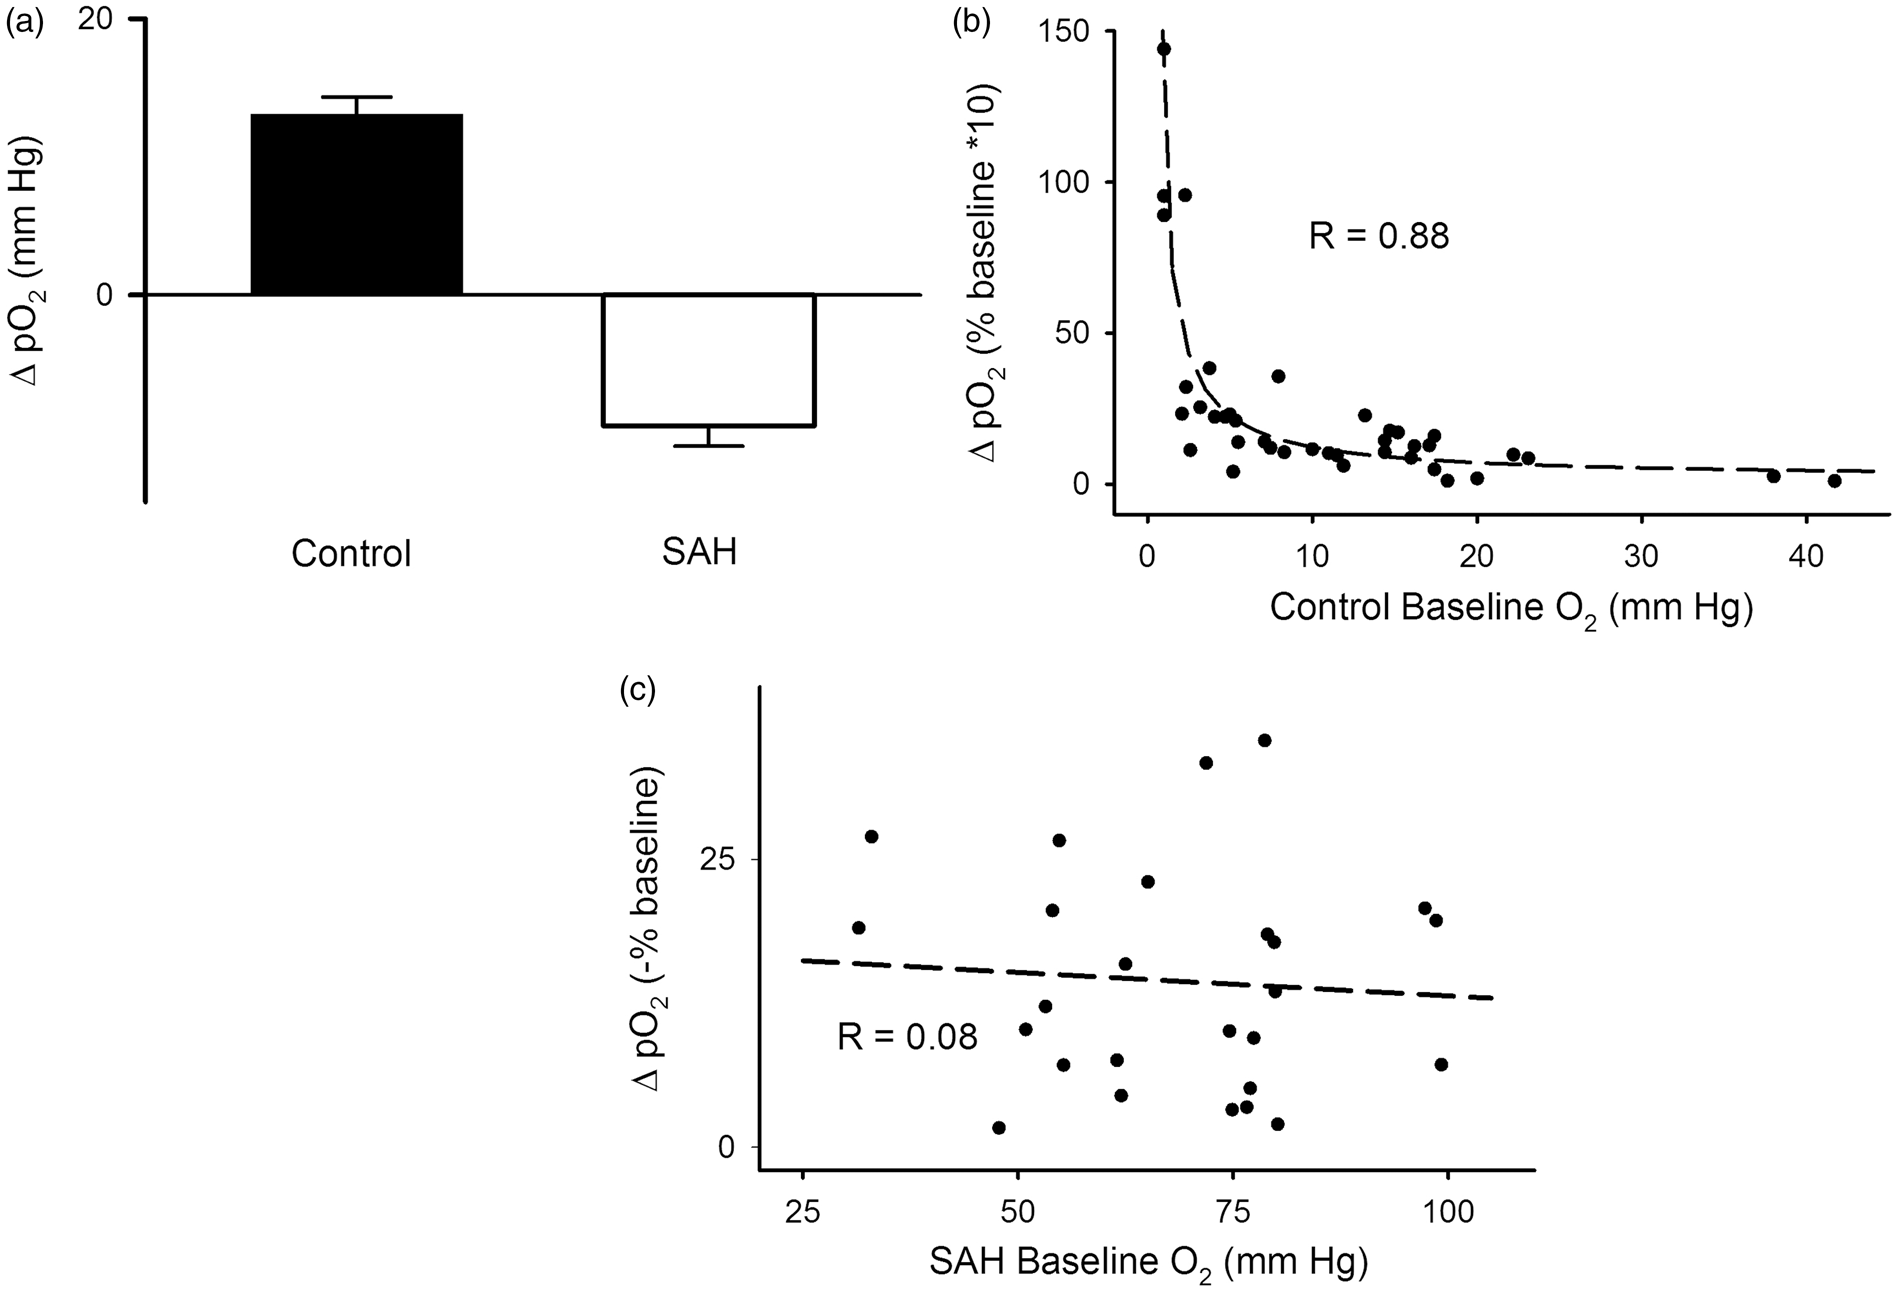
Post-SAH experiments
Rats were prepared for electrophysiological experiments at 48 h after the induction of SAH (n = 4 animals, n = 26 stimulation trials). In SAH-treated rats, the stimulation intensity required to evoke a fEPSP (i.e. >0.5 mV) was higher (400–500 µA) than in the control animals (150–200 µA), suggesting reduced neuronal viability in the hippocampus after SAH. Consistent, with this observation we found that the stimulation-dependent IOS response (Figure 1(d) and (f)) in the hippocampus after SAH showed a slower onset and smaller amplitude than in the control rats (Figure 1(c) and (e)).
A significantly higher resting pO2 level within the stratum radiatum was observed after SAH compared to control hippocampus: baseline pO2 averaged 68.4 ± 17.8 mm Hg (p < 0.001 different than control by Mann–Whitney U test; n = 26). Following train stimulation the pO2 response showed a highly consistent, transient decrease of pO2 from the elevated baseline oxygen levels, averaging a net decrease of −9.46 ± 7.53 mm Hg (n = 26 responses; Figures 1(f) and 2(a)). At the end of each physiological experiment, detailed brain inspection revealed dense subarachnoid hemorrhagic within the basal cisterns on the ventral surface of the brain, confirming successful induction of SAH (four/six animals). A subgroup (two/six animals) did not show successful SAH induction and physiologically these animals demonstrated similar hemodynamic responses to control animals; these two animals were excluded from further analysis.
Comparison of control and post-SAH hemodynamic responses
Figures 1(e), (f) and 2(a) show a comparison of the tissue oxygen transients in the control and post-SAH experiments, confirming the different polarity of response. Note that the pO2 hemodynamic response to the synaptic train stimulation in the control animals shows a nonlinear (polynomial with the best fit of R = 0.88) relationship to the baseline tissue pO2 (Figure 2(b)); below 10 mm Hg baseline levels, the hemodynamic response becomes larger. However, after SAH there appeared to be little correlation between baseline pO2 levels and the amplitude of the negative tissue oxygen response to neuronal stimulation (Figure 2(c)).
Discussion
Intact neurovascular coupling and an elevated tissue pO2 response to neuronal stimulation were confirmed in the control animals, indicating transient, excess O2 supply to the hippocampus. However, after SAH there appeared a robust dysregulation of baseline tissue oxygen levels and an inverted oxygen response to neuronal stimulation, suggesting tissue O2 depletion with neuronal activation (as in brain slices) rather than the typical hemodynamic response with excess substrate delivery in the control animals. 13 In addition, we observed a consistent increase in the stimulation intensity needed to evoke a stimulus-induced pO2 response after SAH (compared to control animals) suggesting neuronal dysfunction and impaired synaptic responses.
Mechanisms of neurovascular coupling have been studied in intact neocortex using sensory input or direct cortical stimulation, which lead to direct pial arteriolar diameter changes. 12 IOS responses in intact neocortex depend partly upon hemoglobin changes and blood oxygenation levels as well as tissue swelling. 12 Though mechanisms of arteriolar reactivity have been intensively studied in hippocampal tissue slices, 8 the use of in vitro brain slices poses questions about appropriate levels of oxygenation and oxygen flux. 13 This in vivo hippocampal model will be helpful to study mechanisms of neurovascular coupling and microvascular reactivity within the intact animal, extending beyond brain slices.8,10
The inverted neurovascular coupling noted after SAH when studied in brain slices may be due to elevated tissue K+ levels and changes in Ca2+ channel responsiveness, as suggested by Koide et al. 8 The higher level of resting oxygen we observed after SAH also suggests that small penetrating arterioles are maximally vasodilated (in spite of the likely vasoconstriction of the larger proximal vessels) and that tissue demand is decreased (but still clearly present due to the pO2 decrease with stimulation) due to the development of neuronal dysfunction resulting from hippocampal ischemia after SAH. Though we have not directly measured cerebral blood flow due to the small size of the hippocampal exposure, the high levels of baseline pO2 after SAH and the rapid recovery from the negative pO2 response to neuronal stimulation indicate persistent blood flow. In some instances, the oxygen response may not fully mirror the hemodynamic changes invoked by neuronal stimulation, since tissue oxygen uptake for metabolism must also be considered, rather than simply blood flow. 9
Neurovascular coupling is critical to maintain neuronal metabolism. 8 However, after SAH both large vessel 5 and microvascular reactivity are directly affected. 7 Alteration of large vessel reactivity has been routinely clinically documented after SAH but pharmacological treatment of the large vessel vasoconstriction may not improve outcome. 5 However, treatment of impaired microvascular reactivity, clearly abnormal after SAH, may provide new therapeutic targets to reduce delayed ischemia, 7 such as enhancing vascular cholinergic function (since there is decreased cholinergic vascular tone after SAH), 14 which can lead to increased vasodilation and vascular reactivity. Intravenous nimodipine improves outcome but can be dose-limited by systemic low blood pressure. 4 Alternatively, nimodipine given intrathecally in high doses may directly affect vascular calcium channels to also improve microvascular reactivity with less systemic side effects, now in trials.8,15 We have demonstrated that this in vivo hippocampal preparation can extend the physiological analysis of microvascular function to other brain areas beyond neocortex. 12 These techniques of directly assessing microvascular function through tissue oxygen analysis may help determine the effectiveness of these treatment schemes and understanding mechanisms in an in vivo, intact model.
Footnotes
Funding
The author(s) disclosed receipt of the following financial support for the research, authorship, and/or publication of this article: Grant support provided by American Heart Association and DVAMC Merit Review.
Acknowledgements
We thank Zhengfeng Wang for his help with the in vivo preparation and technical assistance.
Declaration of conflicting interests
The author(s) declared no potential conflicts of interest with respect to the research, authorship, and/or publication of this article.
Authors’ contributions
F. Galeffi was involved with design and execution of all experiments, data acquisition and analysis, drafting and revising the article and final approval. S. Degan was involved with analysis and interpretation of data, revising the article for intellectual content and final approval. G. Britz was involved with conception and design of the experiments, acquisition and analysis of the data, revising the article for intellectual content and final approval. D. A. Turner was involved with all aspects of the article, including all conception and design of the experiments, all acquisition and analysis of the data, drafting and revising the article and final content approval.