
Abstract
Recent studies have proposed an interrelation between the brain-derived neurotrophic factor (BDNF) val66met polymorphism and the serotonin system. In this study, we investigated whether the
Introduction
Brain-derived neurotrophic factor (BDNF) belongs to the family of neurotrophins and is primarily produced in neurons and glia cells and to a lesser extent in endothelial cells (Leventhal et al, 1999), leucocytes (Kerschensteiner et al, 1999), and satellite cells in skeletal muscles (Mousavi and Jasmin, 2006). Brain-derived neurotrophic factor is important for growth of the central nervous system during fetal development, whereas in adults, BDNF is primarily involved in synaptic plasticity, neurogenesis, and neuronal survival (for review, see Waterhouse and Xu, 2009). Moreover, BDNF also affects synthesis and release of several neurotransmitters, including serotonin (Messaoudi et al, 1998).
Several studies point toward an involvement of BDNF in neuropsychiatric and neurologic disorders, such as depression and Alzheimer's disease (Connor et al, 1997; Karege et al, 2005). For example, serum BDNF levels are lower in patients with depression (Brunoni et al, 2008) and in women, genetically predisposed to depression and exposed to recent stressful life events (Trajkovska et al, 2008). In a recent meta-analysis study, it was shown that serum BDNF levels increased after antidepressant treatment (Brunoni et al, 2008).
Another method to investigate effects of perturbed BDNF signaling on the serotonin system is to study individuals carrying polymorphisms in the
A close interaction between BDNF and the serotonergic system has previously been described (for review, see Mattson et al, 2004). Brain-derived neurotrophic factor provides neurotrophic support for serotonergic neurons and changes in BDNF levels affect the function of serotonin transporter (SERT) (Guiard et al, 2008), 5-hydroxytryptamine (5-HT)1A (Hensler et al, 2007), and 5-HT2A receptors (Rios et al, 2006). Functional studies of SERT function in heterozygous BDNF knockout mice showed a decreased rate of serotonin uptake in the ventral hippocampus (Daws et al, 2007; Guiard et al, 2008). In line with this, a positron emission tomography (PET) study of 25 healthy individuals showed that the val/val genotype was associated with increased SERT binding in men (Henningsson et al, 2009). In addition, a val66met interaction with the 5-HTTLPR (5-HT-transporter-linked promoter region) polymorphism in relation to neuroticism (a risk factor for developing major depression) has been reported (Terracciano et al, 2010).
Interactions with BDNF have also been reported for the 5-HT2A receptor. For example, conditional BDNF knockout mice have severe impairment of cortical 5-HT2A receptor function and decreased protein levels of the receptor in the frontal cortex (Rios et al, 2006). Furthermore, recent studies from our group showed that frontolimbic 5-HT2A receptor binding was positively correlated with neuroticism score and that this association was particularly strong in individuals with high familial risk for developing depression (Frokjaer et al, 2008, 2010). These studies are suggestive of an interaction between BDNF and frontal cortex 5-HT2A receptors, a claim which has been further substantiated by the finding of a direct regulatory effect of BDNF on the density of 5-HT2A receptors
In this study, we investigated a large cohort of healthy individuals to determine whether the met allele of the
Materials and methods
Subjects
A total of 133 individuals (88 men, median age 34 years, range, 18–81 years) were recruited from newspaper announcements and were included in the study after medical screening. The absence of psychiatric and neurologic disorders was ensured by obtaining a detailed interview, and by clinical evaluation. Subsets of the sample were included in previous publications (Frokjaer et al, 2008, 2009; Erritzoe et al, 2009).
Imaging
All subjects were PET scanned using an 18-ring GE-Advance scanner (General Electric, Milwaukee, WI, USA) in a three-dimensional acquisition mode, producing 35 image slices with an interslice distance of 4.25 mm. [18F]altanserin was injected into the cubital vein as a combination of a bolus and a continuous infusion (ratio 1.75 hours) to obtain tracer steady state in blood and tissue according to Pinborg et al (2003). A maximal dose of [18F]altanserin of 3.7 MBq/kg bodyweight, was administered with an average dose of 270 MBq. Dynamic three-dimensional emission scans (5 frames of 8 minutes each) started 120 minutes after administration of [18F]altanserin. Blood samples were collected at mid-PET frame times and analyzed with high-performance liquid chromatography for determination of the activity of the nonmetabolized tracer in the plasma. Visual inspection of the time–activity curves was performed to ensure constant blood and tissue levels. The plasma metabolites of [18F]altanserin were determined using a modification of previously published procedures (Pinborg et al, 2003).
For [11C]DASB, a dynamic 90-minute-long emission recording was initiated during intravenous injection during 12 seconds of 485 ± 86 MBq (range, 279–601 MBq) [11C]DASB, with specific activity of 29 ± 16 GBq/μmol (range, 9–82 GBq/μmol).
Magnetic resonance imaging (MRI) was performed on all subjects; magnetization prepared rapid gradient echo sequences were acquired on either a 1.5-T Vision scanner (
Image Analysis
The MRI images were coregistered with the PET images using a Matlab-based (Mathworks, Natick, MA, USA) interactive program, which is based on visual identification of the transformation as described in the study by Adams et al (2004). The MRIs were segmented into gray matter, white matter, and cerebrospinal fluid tissue classes using SPM2 (Welcome Department of Cognitive Neurology, University College London, London, UK). A total of 35 regions of interest were automatically delineated on MRI slices (Svarer et al, 2005) and transferred to PET images using the identified rigid body transformation. These PET images were partial volume corrected by means of the segmented MRI. A three-compartment model based on gray matter, white matter, and cerebrospinal fluid tissue was used (Quarantelli et al, 2004). The white matter value was extracted as the average voxel value from a white matter region of interest (midbrain) in the uncorrected PET image.
The volume of distribution (
A volume-weighted mean of cortical 5-HT2A binding was subsequently calculated and used as a measure of average brain cortical binding because we primarily tested the hypothesis that the association between the val66met polymorphism and
Assessment of Neuroticism Score
On the same day as the PET scanning, subjects completed the Danish version of the 240-item NEOPI-R (Neuroticism-Extraversion-Openness Personality Inventory Revised) self-report personality questionnaire as described previously (Costa and McCrae, 1992; Frokjaer et al, 2008). The neuroticism score is calculated as the sum of the score in each of the six subdimensions (facets) comprised in this personality trait.
Single-Nucleotide Polymorphism Genotyping
Blood samples for DNA analysis and BDNF measurements were collected at the day of the PET scanning and immediately frozen and stored at −20°C until further analysis. DNA was extracted from the blood with a Qiagen Mini kit using the guidelines included in the kit (Qiagen, Valencia, CA, USA).
Brain-derived neurotrophic factor val66met genotyping was performed using a TaqMan 5′-exonuclease allelic discrimination assay according to the instructions provided by the manufacturer (Applied Biosystems, Foster City, CA, USA, Assay-on-Demand single-nucleotide polymorphism product: C_11592758_10). The ABI 7500 multiplex PCR machine (Applied Biosystems) was used for this analysis.
Brain-Derived Neurotrophic Factor Measurements
To measure the blood BDNF concentration, blood samples were obtained at the day of the PET scanning session and 1.5 mL of whole blood was sampled in EDTA-containing tubes and immediately frozen at −20°C. On the day of analysis, blood samples were thawed on ice and 3% Triton-X 100 (Sigma-Aldrich, Copenhagen, Denmark) were added to the samples. Samples were then sonicated and centrifuged (12,000 ×
Statistical Analysis
A genotype equilibrium test was performed using Pearson's χ2 test. Correlation analyses between whole-blood BDNF and binding were performed using multiple regression analysis, including the covariates, age, neuroticism, body mass index, as well as free fraction of the radiotracer for [18F]altanserin and gender, age, daylight minutes, and openness for [11C]DASB data. Comparisons between val/val and met carriers were made using Student's
Results
The genotype distributions for subjects scanned with [18F]altanserin and [11C]DASB study are shown in Tables 1 and 2, respectively. The val/val and met frequencies were in Hardy–Weinberg equilibrium and correspond to those previously reported for Caucasians (Egan et al, 2003).
Data on healthy subjects PET scanned with [18F]altanserin
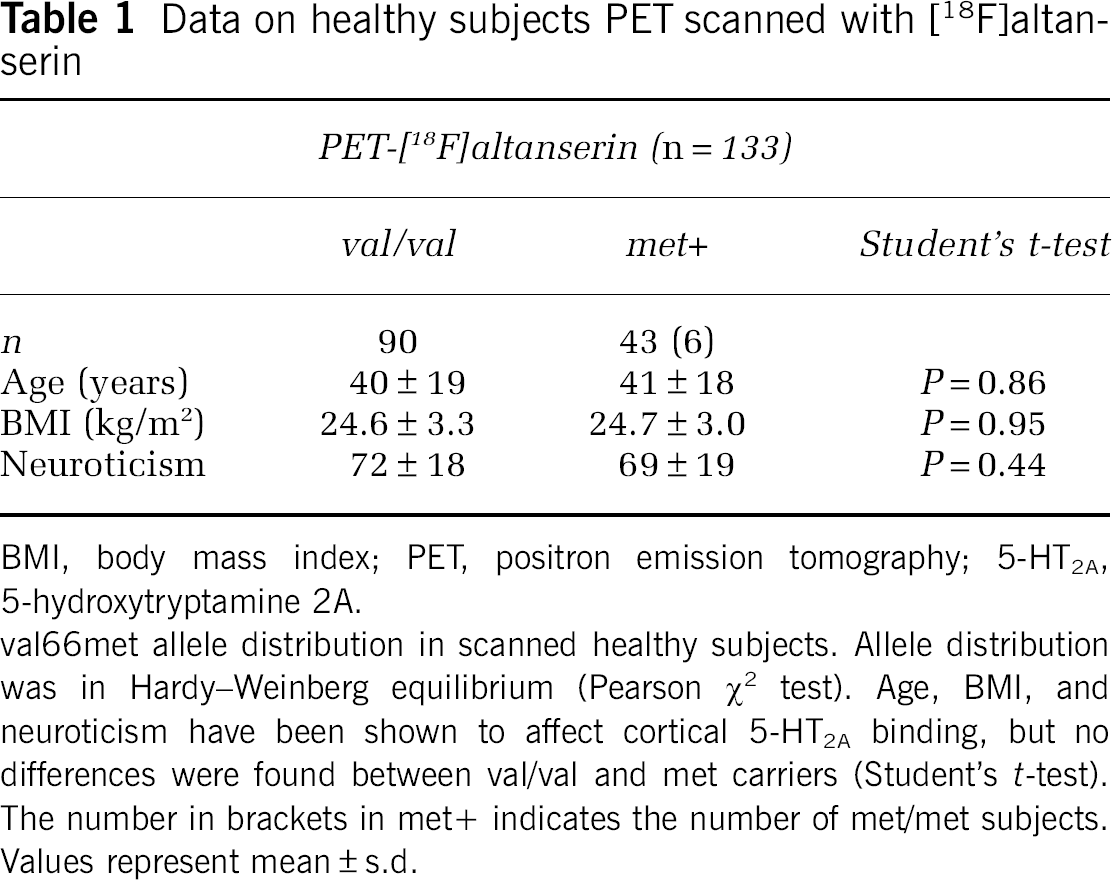
BMI, body mass index; PET, positron emission tomography; 5-HT2A, 5-hydroxytryptamine 2A.
val66met allele distribution in scanned healthy subjects. Allele distribution was in Hardy–Weinberg equilibrium (Pearson χ2 test). Age, BMI, and neuroticism have been shown to affect cortical 5-HT2A binding, but no differences were found between val/val and met carriers (Student's
Data on healthy subjects PET scanned with [11C]DASB
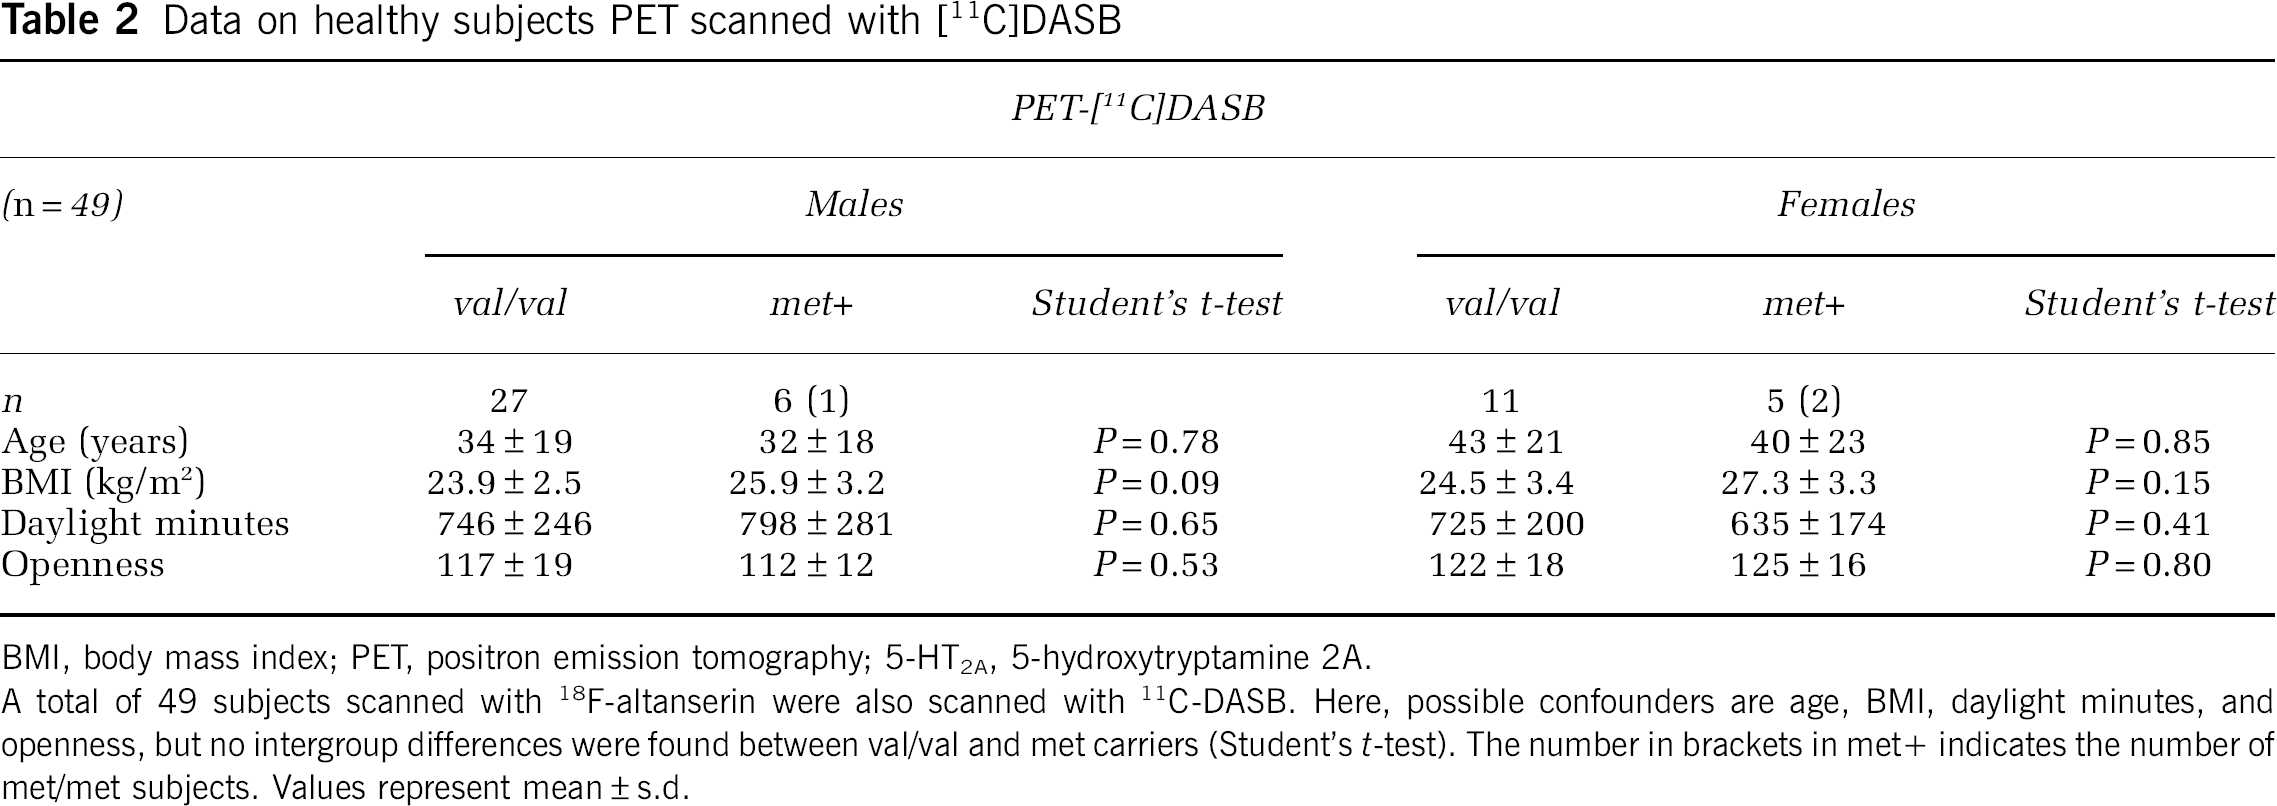
BMI, body mass index; PET, positron emission tomography; 5-HT2A, 5-hydroxytryptamine 2A.
A total of 49 subjects scanned with 18F-altanserin were also scanned with 11C-DASB. Here, possible confounders are age, BMI, daylight minutes, and openness, but no intergroup differences were found between val/val and met carriers (Student's
No differences were found in neocortical 5-HT2A receptor binding between the val/val and met carrier groups (1.41 ± 0.43 versus 1.35 ± 0.43, respectively,
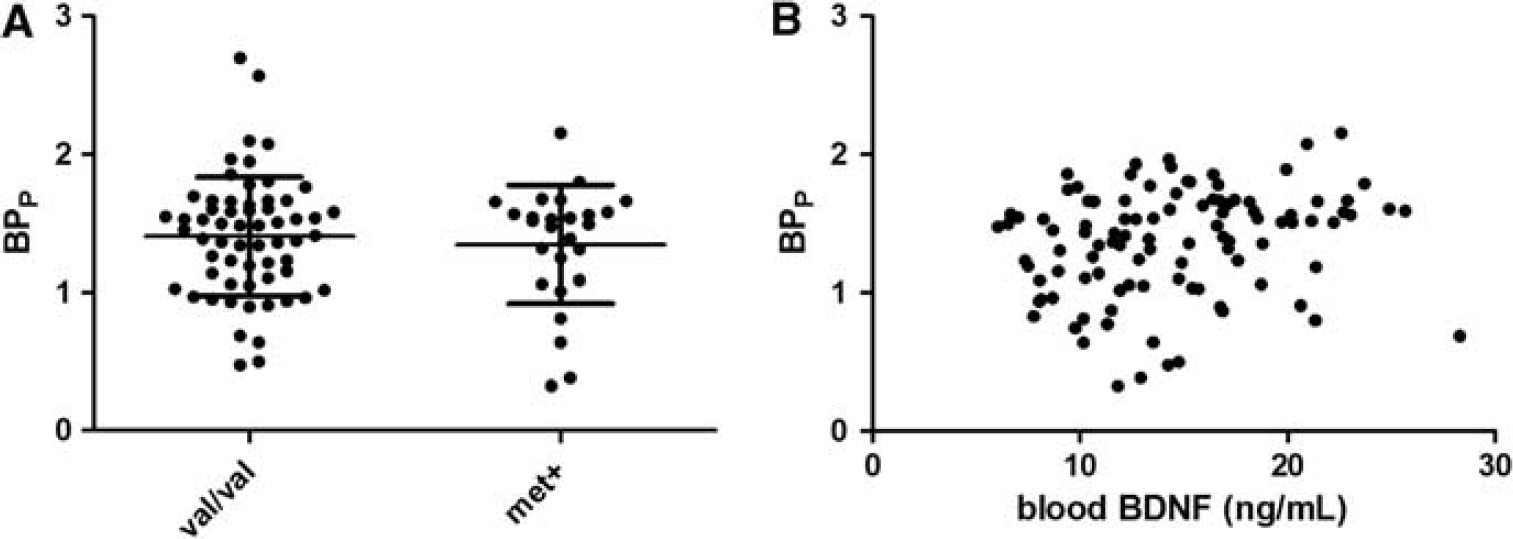
Neocortical 5-HT2A binding in the val/val and met groups. (
No differences in mean subcortical SERT binding were found between val/val and met carriers (1.66 ± 0.20 versus 1.62 ± 0.16, respectively,
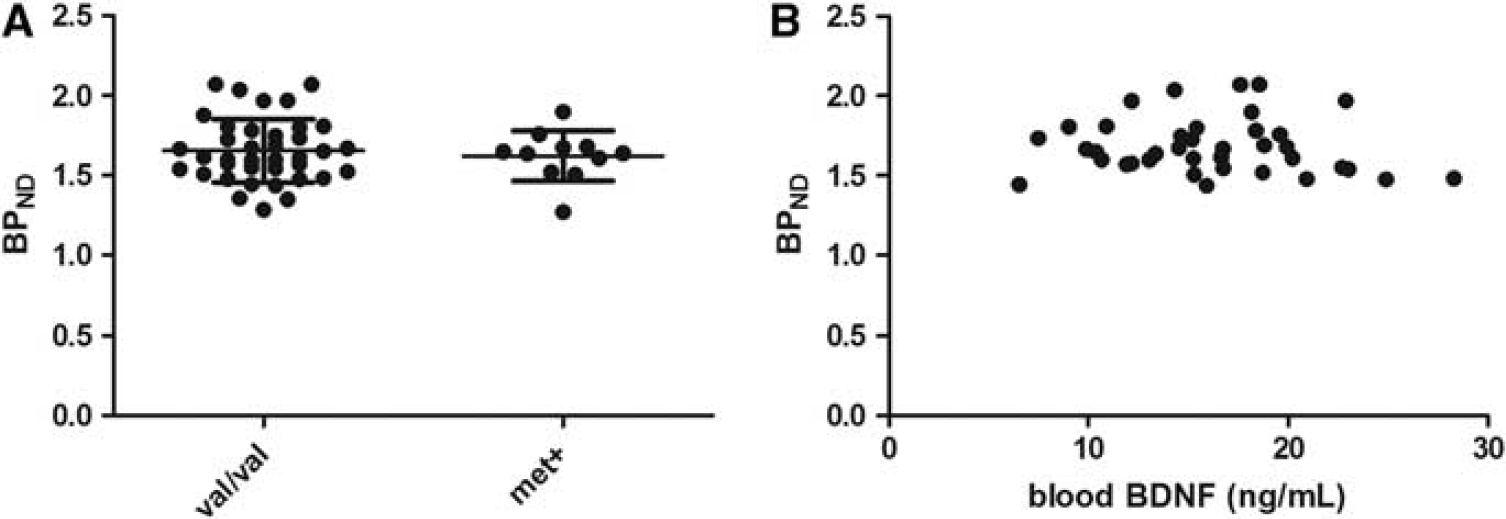
Mean SERT binding in the subcortical high-binding region in val/val and met carriers. (
We controlled for differences between groups regarding age (Adams et al, 2004), body mass index (Erritzoe et al, 2009), and neuroticism (Frokjaer et al, 2008), both of which factors have earlier been shown to correlate with cerebral 5-HT2A binding, but the val66met status was not associated with any of these (Table 1). In addition, there was no correlation between total BDNF levels in blood and the neuroticism score (
To exclude possible confounders affecting SERT binding in the subcortical high-binding region (such as the caudate, putamen, and thalamus), we controlled for differences between groups regarding daylight minutes and openness, which was recently shown to be associated with SERT binding (Kalbitzer et al, 2009, 2010). No genotype-associated differences were found for these parameters (Table 2). All [11C]DASB scanned subjects for SERT were MR scanned using the 3-T Trio MR scanner type.
Discussion
To the best of our knowledge, no studies have investigated the effect of val66met on 5-HT2A binding. This is the first study examining the associations in healthy individuals between the val66met
The close interaction between BDNF and the 5-HT2A receptor is illustrated by a pronounced effect on the cortical 5-HT2A receptor levels in conditional BDNF knockout mice during embryonic development and the first postnatal weeks (Chan et al, 2006; Rios et al, 2006). Furthermore,
One other study has investigated cerebral 5-HT1A receptor and SERT binding and the BDNF val66met polymorphism in 53 and 25 healthy individuals, respectively (Henningsson et al, 2009). They found that whereas BDNF genotypes did not affect 5-HT1A receptor binding in the entire population, male val/val carriers (
We did not see any association between serum BDNF levels and SERT binding, although experimental studies have shown an interaction between BDNF and SERT. However, a decrease in SERT efficiency in heterozygous BDNF knockout mice without concomitant changes in SERT binding has been reported (Daws et al, 2007). This may suggest a role of BDNF levels and val66met on SERT function rather than SERT expression. Alternatively, the BDNF–SERT interaction may be different if BDNF levels are decreased, e.g., during extended periods of major depression (Brunoni et al, 2008). Indeed, an investigation of SERT and val66met interaction in patients with major depression could be an interesting area of future research.
Decreased BDNF levels have also been associated with high neuroticism score in healthy subjects (Lang et al, 2004). We were unable to replicate this finding in our study. One explanation for this discrepancy could be that Lang et al (2004) measured BDNF in serum samples, whereas we measured BDNF in whole blood. However, we have previously shown that serum and whole-blood BDNF values correlate if storage time of the serum samples is <12 months, and that BDNF in whole blood is better preserved during storage (Trajkovska et al, 2007). Moreover, the carrier status of the BDNF val66met polymorphism in our cohort was not associated with the neuroticism score. This result is in accordance with results from a large meta-analysis (Terracciano et al, 2010) and suggests that changes in activity-dependent BDNF secretion in the brain is not linked to risk factors for developing depression
In conclusion, we did not find evidence for an interaction between the val66met polymorphism in the BDNF gene, 5-HT2A receptor binding, and SERT binding in healthy subjects or between total BDNF levels and 5-HT2A receptor binding, even when gender-specific analyses were included. We suggest that the val66met polymorphism has a minor impact on the serotonin system in healthy subjects, but has a more significant role when the brain is exposed to stress or when val66met is present together with other polymorphisms in SERT or in serotonin receptors.
Footnotes
The authors declare no conflict of interest.