
Abstract
Monocarboxylate transporters (MCTs) are essential for the use of lactate, an energy substrate known to be overproduced in brain during an ischemic episode. The expression of MCT1 and MCT2 was investigated at 48 h of reperfusion from focal ischemia induced by unilateral extradural compression in Wistar rats. Increased MCT1 mRNA expression was detected in the injured cortex and hippocampus of compressed animals compared to sham controls. In the contralateral, uncompressed hemisphere, increases in MCT1 mRNA level in the cortex and MCT2 mRNA level in the hippocampus were noted. Interestingly, strong MCT1 and MCT2 protein expression was found in peri-lesional macrophages/microglia and in an isolectin B4+/S100β+ cell population in the corpus callosum. In vitro, MCT1 and MCT2 protein expression was observed in the N11 microglial cell line, whereas an enhancement of MCT1 expression by tumor necrosis factor-α (TNF-α) was shown in these cells. Modulation of MCT expression in microglia suggests that these transporters may help sustain microglial functions during recovery from focal brain ischemia. Overall, our study indicates that changes in MCT expression around and also away from the ischemic area, both at the mRNA and protein levels, are a part of the metabolic adaptations taking place in the brain after ischemia.
Introduction
During the period of reperfusion after transient brain ischemia, several mechanisms are set in motion to promote recovery. Removal of necrotic tissue through phagocytosis by macrophages/microglia, formation of glial scar by astrocytes, elimination of dead cells by apoptosis and restoration of normal function in surviving cells are examples of recovery processes occurring over the first hours/weeks after a stroke (Lipton, 1999; Schaller and Graf, 2004). It is clear that most of these processes are dependent on energy reserve and supply. For instance, if the intracellular energy pool is low, many cells will die by necrosis, whereas if some energy is left, apoptosis ensues (Kass et al, 1996; Leist et al, 1997). During ischemia, disruption of cerebral energy metabolism occurs because of glucose and oxygen deprivation, which favours neuronal necrosis in the core of the lesion, whereas in peri-lesional areas (the so-called ischemic penumbra), some energy is still available, which favours neuronal apoptosis (Lipton, 1999; Schaller and Graf, 2004). In parallel, processes such as macrophage phagocytosis and astrogliosis are mechanisms requiring energy (Abbracchio et al, 1994; Neary et al, 1994). A potential energy substrate present in large amounts in the extracellular space after an ischemic episode is lactate. Lactate is known to be a neuroprotective energy substrate clearly used by the injured nervous tissue (Chen et al, 2000a, b). Moreover, it has been suggested that lactate represents an obligatory energy substrate for surviving neurons during the recovery period after ischemia (Schurr et al, 1997, 2001). In order to take advantage of this energy substrate during the recovery period, changes in the expression of specific transporters for lactate might be necessary in various cell types.
Monocarboxylate transporters (MCTs) are proton-dependent carriers that facilitate the uptake and release of energy substrates that include lactate (Halestrap and Price, 1999). Although 14 members belonging to the MCT family have been identified so far, only three of them have been clearly shown to be expressed in the central nervous system (Pierre and Pellerin, 2005). MCT1 is predominantly found on endothelial cells forming cerebral blood vessels as well as on astrocytes (Gerhart et al, 1997; Hanu et al, 2000; Pierre et al, 2000). MCT4 is exclusively expressed by astrocytes (Rafiki et al, 2003; Pellerin et al, 2005), whereas MCT2 constitutes the main neuronal MCT (Pierre et al, 2002; Debernardi et al, 2003). So far, few studies have investigated the cellular changes of cerebral MCT expression occurring after ischemia. In this work, we have examined the changes in the expression of both MCT1 and MCT2 at 48 h of reperfusion in a rat model of compression-induced brain ischemia. Furthermore, as microglia emerged as a cell type exhibiting changes in MCT1 and MCT2 expression in this condition, we have used a microglial cell line to investigate in vitro the putative effect on MCT expression of tumor necrosis factor-α (TNF-α), a proinflammatory cytokine known to be produced after an ischemic episode (Barone and Feuerstein, 1999; Hallenbeck, 2002).
Materials and methods
Rat Extradural Compression Ischemia Model
A total of 19 male Wistar rats (10 to 12 weeks old and weighing 308.2 ± 12.3 g) were used (B&K Universal, Sollentuna, Sweden). The rats were housed in a temperature-, humidity- and light-controlled animal facility (24°C, 50% humidity and 12-h light/12-h dark). Handling and habituation to the experimenter was allowed for 3 days before starting experiments and after about 1 week of room acclimatization. Weight gain and food intake were measured daily both before and after surgery. Food and water were available ad libitum. All experiments were approved by the Ethical Committee at the Karolinska Institutet (Swedish Animal Welfare Act SFS 1998:56 and EU Directive 86/609/EEC).
Animals were weighed and anesthetized with a mixture of 1 mL of Hypnorm (fluanisone 10 mg/mL and fentanyl citrate 0.315 mg/mL; Janssen, Beerse, Belgium), 2 mL of sterile water and 1 mL of midazolam (5 mg/mL; AstraZeneca, Södertälje, Sweden). The administered dose of the mixture was 2.7 mL/kg intraperitoneally. Anesthesia was maintained by injecting 0.1 mL of the Hypnorm mixture intraperitoneally every 30 to 40 mins. For soft tissue analgesia, Marcain (5 mg/mL; AstraZeneca, Södertälje, Sweden) was injected subcutaneously in the soft tissues of the skull and tail vein (1 mL per rat). The rats were placed in a stereotaxic apparatus (David Kopf Instruments, Tujunga, CA, USA). The flat skull position was achieved by lowering the incisor bar to 3.3 ± 0.4mm (Paxinos and Watson, 1998). A Plexiglas piston (8 × 6 mm with the rostral part shortened by 2 mm) was positioned at an angle of 20° over the right sensorimotor cortex. The defined area of the skull was cut out using a fine drill and gently removed from the dura mater. The compression piston was lowered to touch the surface of the dura mater and then slowly lowered another 3 mm at the rate of 1 mm/min (0.25 mm every 15 secs). To avoid increased intracranial pressure and contra-coup contusive effects, a space of 1 mm was allowed between the drilled bone edges and the surface of the piston to allow the brain to adjust smoothly to the compression. Cortical regional cerebral blood flow (rCBF) was measured with a laser–Doppler probe (PeriFlux 4001 Master, Perimed, färfälla, Sweden) inserted in the Plexiglas piston. After 30 mins of compression, the piston was removed at the same speed rate of 0.25 mm every 15 secs. The skull bone was repositioned and the cranial skin sutured with polyethylene filament (Ethilon 3/0, Johnson & Johnson, Dilbeek, Belgium). Body temperature was monitored using a rectal probe (Temperature Control Unit HB 101/2, Letica Scientific Instruments, Barcelona, Spain) and maintained constant using a digitally controlled heating pad throughout the compression protocol. Brain temperature was measured with a probe connected to a thermometric device (Physitemp Instruments, Clifton, NJ, USA) by inserting the probe 1 cm deep between the muscle temporalis and the skull anteriorly and laterally to the bregma suture. Sham operations were conducted as described earlier (Kundrotiene et al, 2002).
Real-Time Reverse Transcriptase Polymerase Chain Reaction
The rats were rapidly decapitated at 48 h after sham operation (n = 4) or extradural compression (EC, n = 5), brains were removed and the two hemispheres separated. The ipsilateral and contralateral cortices, hippocampi and thalami were dissected and homogenized in the TRIzol Reagent (Invitrogen Life Technologies, Carlsbad, CA, USA). Total RNA was extracted according to the manufacturer's protocol. To remove residual genomic DNA from the samples, a DNase I treatment (Ambion, Austin, TX, USA) was carried out using the manufacturer's instructions. The concentration of RNA in each sample was measured with a spectrophotometer (Ultrospec III, Pharmacia LKB, Uppsala, Sweden) at 260 nm.
RNA (2 μg) from each sample was used for cDNA synthesis in a 25 μL reaction volume containing random hexamer primers (pd(N)6; Pharmacia Biotech, Uppsala, Sweden), 200 U Moloney murine leukemia virus (M-MLV) reverse transcriptase (Promega, Madison, WI, USA), RNase inhibitor (Promega) and equimolar (2.5 mmol/L) deoxynucleotide triphosphates (dNTPs) incubated for 60 mins at 37°C. Resulting cDNA samples were diluted to 50 μL using RNase-free water. The first samples (cortex, hippocampus or thalamus) of compressed and sham (uncompressed) Wistar rats were chosen for the standard curves in each PCR experiment. These samples were serially diluted (1:1, 1:4 and 1:16), whereas all the other samples were diluted 1:4 so that their values would distribute within the range of the standard curve. For the PCR, 2 μL of the standard curve cDNA dilutions and the target samples were mixed with 2 μL of dNTPs, Hot-start Taq polymerase, reaction buffer and SYBR Green I dye (LightCycler DNA Master SYBR Green I kit, Roche, Mannheim, Germany) and placed into individual LightCycler glass capillaries. The reactions were supplemented with 3 or 4 mmol/L Mg2+ (depending on the primer specifications) and either 0.5 μmol/L of MCT1 or of MCT2 gene-specific primers (forward and reverse, Table 1) or of ribosomal 18S primer. Sequences for MCT1 and MCT2 were confirmed by Basic Local Alignment Search Tool (BLAST) search in the GenBank database (NCBI, Bethesda, MD, USA). Reaction mixtures were diluted to 20 μL with sterile water and capillaries were sealed. Samples of both ipsilateral and contralateral cortex, hippocampus and the thalamus of compressed rats were run with the respective brain region of sham-operated rats (comparison of changes in gene expression between sham and compressed animals). The cycles of PCR were run using automatic fluorescence emission following each PCR cycle (see Table 1 for details). Melting curve analyses were carried out after the completion of cycling to control for the specificity of the PCR products obtained (data not shown). Sequences and LightCycler parameters for the RT-PCR primers are shown in Table 1. Primers were custom-synthesized by TAG Copenhagen AS (Copenhagen, Denmark). The primer pair for the QuantumRNA Universal 18S reference gene (315 bp) was purchased from Ambion.
Forward and reverse oligonucleotide sequences of target gene primers
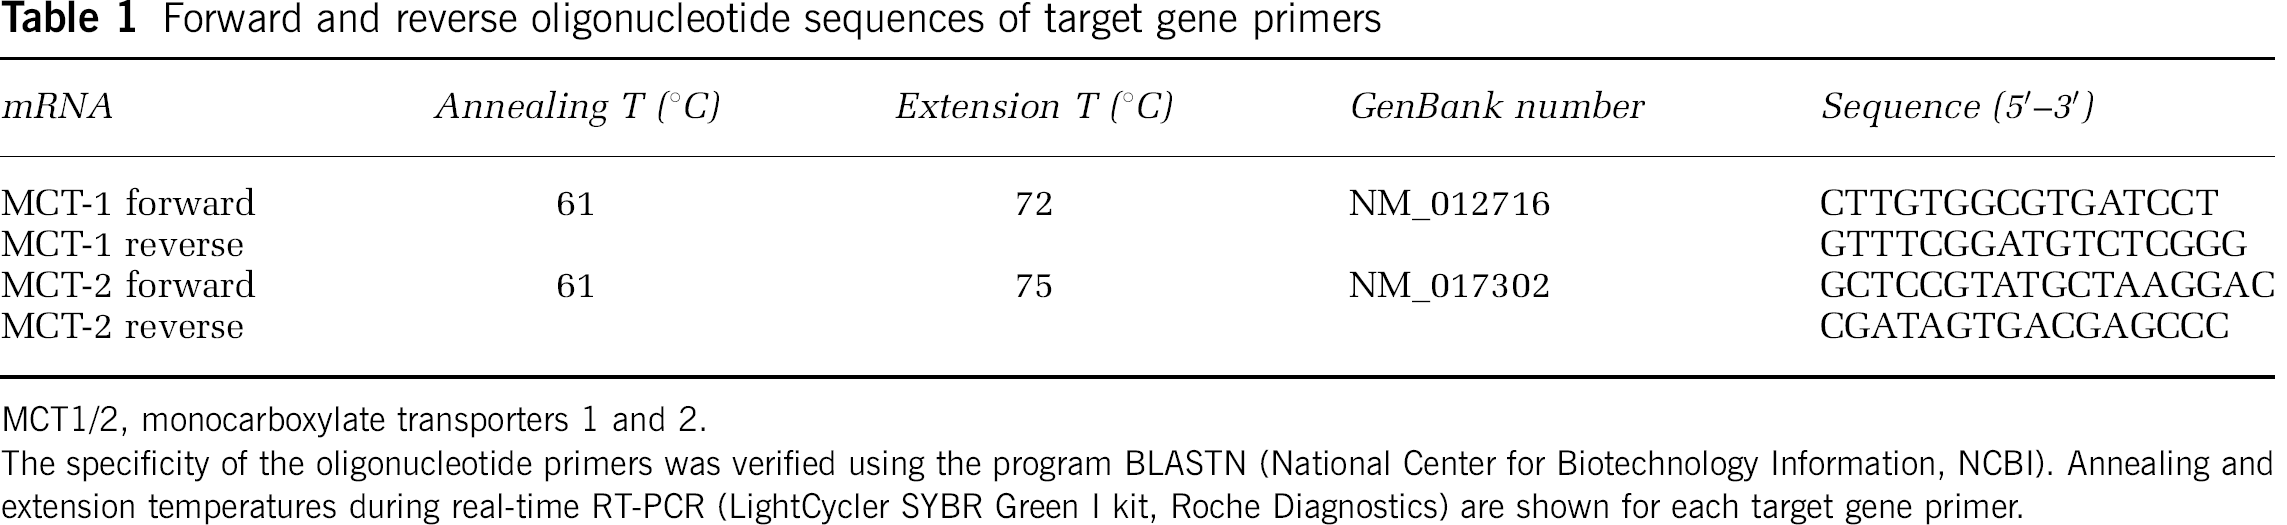
MCT1/2, monocarboxylate transporters 1 and 2.
The specificity of the oligonucleotide primers was verified using the program BLASTN (National Center for Biotechnology Information, NCBI). Annealing and extension temperatures during real-time RT-PCR (LightCycler SYBR Green I kit, Roche Diagnostics) are shown for each target gene primer.
Immunohistochemistry
A separate group of rats was subjected either to EC or sham operation for immunohistological studies at 48 h after sham operation (n = 4) and at 48 h of reperfusion (n = 6). Briefly, animals were anesthetized with sodium pentobarbital and perfused via the ascending aorta with phosphate-buffered saline (PBS), followed by 4% paraformaldehyde. The brains were cryoprotected by transferring them to 10, 20 and 30% sucrose in PBS solutions. Both cerebral hemispheres were cut in 12− μm-thick sagittal sections on a freezing microtome (Zeiss Microm, Feldbach, Germany) at −24°C, starting 1, 200 μm from the lateral surface of the brain. Distance between the collected sections was 100 μm. Brain slices from the sham-operated rats were collected for control purposes. The sections were mounted onto Superfrost Plus glass slides (Fisher Scientific, Pittsburgh, PA, USA).
Standard immunoperoxidase and immunofluorescence techniques were carried out according to earlier described procedures (Pierre et al, 2000). The sections were immunostained with rabbit antisera raised against MCT1 and MCT2 (Pierre et al, 2000) to detect and localize the expression of MCTs, in combination with (1) monoclonal glial-fibrillary acid protein antibody (mouse anti-rat GFAP, Sigma, Buchs, Switzerland) to detect intermediate cytoskeleton filaments of astrocytes; or (2) S100β antibody (mouse anti-rat S100β, Sigma, Buchs, Switzerland) to detect the β-subunit of the calcium-binding protein S100; or (3) monoclonal antibody OX42 (mouse anti-rat CD11b, #MCA275R, Serotec, Oxford, UK) to detect the complement receptor 3 (CR3; CD11b) expressed by microglial cells; or (4) isolectin B4 conjugated with fluorescein isothiocyanate (FITC, Sigma) to detect the galactose-containing, membrane-associated glycoconjugate expressed by activated microglia (Streit and Kreutzberg, 1987). Briefly, after rehydration in PBS solution for 40 mins at room temperature (RT), the sections were treated with the permeabilizing solution (0.1% Triton X-100 in PBS) for 10 mins and incubated in the blocking solution (0.5% casein in PBS) for 1 h at RT to block nonspecific sites. Primary antibodies were diluted in PBS, 0.1% Tween, 1% bovine serum albumin (MCT1 and MCT2, 1:200; GFAP, 1:500; S100β, 1:500; OX42, 1:100; and Isolectin B4-FITC, 1:100) and sections incubated with them overnight at 4°C. For immunohistochemistry using peroxidase staining, sheep anti-rabbit immunoglobulins (Igs, 1:200; Jackson ImmunoResearch Laboratories, West Grove, PA, USA) followed by rabbit peroxidase-antiperoxidase complexes (1:500, Sigma) were used as immunolabels. The peroxidase reaction product was revealed with the DAB + chromogen kit from Dako (Carpinteria, CA, USA). Fluorescent double labelings were performed by incubating sections in a solution of secondary fluorescent antibodies, anti-rabbit Cy-3 and anti-mouse FITC-conjugated Igs (1:200, Jackson ImmunoResearch Laboratories) for 2 h at RT in the dark. After rinsing with PBS (3 × 5 mins), the sections were mounted in the Vecta-Shield mounting medium (Vector Laboratory, Burlingame, CA, USA). The preparations were examined using a Zeiss axioplan2 microscope (Zeiss, Carl Zeiss AG, Feldbach, Germany) using bright-field optics or epifluorescence and using an SP5 AOBS confocal microscope (Leica, Leica Microsystems, Heerbrugg, Switzerland) using the Argon 488 nm and He/Ne 543 nm laser illumination. Controls included omission of the primary serum or its substitution by nonimmune rabbit serum. No specific staining was visible on such preparations.
Cell Cultures, Immunocytochemistry and Western Blotting
N11 microglial cells (Righi et al, 1989) and Neuro2A neuroblastoma cells were maintained in Dulbecco's modified Eagle's medium with 1 g/L glucose, glutamax I and pyruvate (#21885-025, Gibco, Invitrogen, Basel, Switzerland) containing 10% fetal calf serum and incubated at 37°C in 95% air/5% CO2. Culture medium was renewed every 2 to 3 days, and cell confluence was prevented by re-suspension. Cells were plated either in 35 × 10 mm Petri dishes for western blotting or on glass coverslips for immunocytochemical labeling 2 days before the experiments. Cultured cells on glass coverslips were fixed with a solution of 4% paraformaldehyde in PBS (0.1 mol/L, pH 6.5 to 6.9 for 15 mins at RT) and treated with casein (0.5% in PBS) for 1 h to block nonspecific binding of antibodies. Cultures were incubated overnight with a primary antibody solution (anti-MCT1 or anti-MCT2, 1:400 in PBS containing 0.5% of bovine serum albumin) at 4°C. After rinsing in PBS, the cultures were incubated with goat FITC-conjugated anti-rabbit IgG (diluted 1:400 for 2 h at RT). After rinsing in PBS, the cultures were mounted using Vectashield (Reactolab SA; Sigma) with 4, 6-diamidino-2-phinylindole (DAPI) and examined with an Axioplan2 microscope (Zeiss), using epifluorescence with an appropriate filter.
Three different concentrations of TNF-α (2, 10 and 20 ng/mL) were applied to separate culture dishes, whereas untreated dishes were used as controls. After 3 h of incubation, the content of each dish was homogenized in 80 βL of a buffer containing 62.5 mmol/L Tris-HCl (pH 6.8), 50 mmol/L dithiothreitol (DTT), 0.3% sodium dodecyl sulfate (SDS, Bio-Rad, Reinach, Switzerland), 77% distilled water and 40 μL of a mixture of protease inhibitors (Complete 11257000; Roche, Rotkreuz, Germany). Protein samples were sonicated and heated at 95°C for 5 mins in half the final volume of the SDS-PAGE sample buffer (62.5 mmol/L Tris-HCl, 50 mmol/L dithiothreitol, 2% SDS, 10% glycerol and 0.1% bromophenol blue). The samples were loaded onto Polyacrylamide gels composed of a 10% acrylamide/bisacrylamide running gel and a 4.5% acrylamide/bisacrylamide stacking gel. After electrophoresis, proteins were transferred onto nitrocellulose membranes (Trans-Blot Transfer Medium 162-0115, Bio-Rad) using a Trans-Blot SD Semi-Dry Transfer cell (Bio-Rad). For protein detection, the membranes were incubated in a blocking solution of TBST (50 mmol/L Tris-HCl pH 7.5, 150mol/L NaCl and 0.1% Tween-20) containing 5% non-fat milk for 1 h at 20°C. The membranes were incubated overnight at 4°C with rabbit anti-MCT1 (1:2, 000) and mouse monoclonal anti-β-actin (1:10, 000, #A5441; Sigma). After three washes in TBST, the membranes were incubated with the secondary antibodies, Alexa Fluor 680 goat anti-rabbit IgG (Juro, Lucerne, Switzerland) and IRDye 800 anti-mouse IgG (Rockland, Gilbertsville, PA, USA), diluted at 1:5, 000 in TBST containing 1% non-fat milk for 2 h at 20°C in the dark. The membranes were washed in TBST three times for 5 mins and scanned in the ODYSSEY Infrared Imaging System (LI-COR Biosciences, Lincoln, NE, USA), which permits simultaneous imaging of both fluorophores and quantitative comparison of protein expression (Olive, 2004). β-Actin, shown in green, was used for normalization and the proteins of interest were shown in red. The integrated intensities of luminescence of both β-actin and target protein were calculated using Odyssey analysis software (LI-COR Biosciences, Lincoln, NE, USA). MCT1 and MCT2 protein expression levels were quantified for each TNF-α concentration using the ratio MCT/β-actin fluorescence normalized to the ratio MCT/β-actin fluorescence of control cultures.
Data Analysis
One-way analysis of variance (ANOVA) was used to evaluate rCBF, followed by Bonferroni's test for multiple comparisons. A two-tailed unpaired t-test, 95% confidence interval, was used to compare average brain and body temperature during EC and microglial cell counts.
For RT-PCR, all samples were run in duplicate owing to the relative variation that could be expected from instrumentation, primer efficiency and sample preparation. Duplicates with larger variation than expected were repeated so that the expression level could then be determined from four values. Calculation of the crossing point for each sample using the LightCycler data analysis software has been discussed earlier (Kovacs et al, 2002) and a mean of the replicate values was used for the subsequent calculations. For each brain area, expression levels of the ribosomal 18S were determined in each brain area per hemisphere of each rat and used to normalize values for the target genes (target gene/18S ratio) for each brain region. A one-way ANOVA followed by Bonferroni's test was used to compare target gene/18S ratios of sham-operated (nonischemic) and ipsilateral (ischemic) hemispheres, as well as target gene differences at baseline, in each brain region. A one-way ANOVA followed by Dunnett's test was used to compare MCT1 and MCT2 protein expression in N11 microglial cell cultures after TNF-α stimulation. Statistical calculations were carried out using GraphPad-Prism 4.0 (GraphPad Software, San Diego, CA, USA). Data are presented as mean ± s.e.m.
Results
Extradural Compression Model Variables
On the day of EC, rats weighed about 324.4 ± 10.7 g. On D2 after EC, weight loss of about 4.8% was detected (308.8 ± 8.8 g, P < 0.05 versus day of EC). Body weight recovered to 320.2 ± 9 g on D5 after EC. Body temperature during EC was 37.4 ± 0.24°C. Brain temperatures varied from 34.4 to 34.6°C. Cortical blood flow was significantly reduced by EC. When the compression piston was lowered 3 mm into the cortical surface, rCBF decreased to 5.8 ± 0.8% of baseline. During compression, rCBF remained low but gradually increased to 15.8 ± 4.5% by the end of the 30-min period of EC. Immediately upon reperfusion, rCBF increased to 115.4 ± 13.1%. After 5 mins of reperfusion, rCBF values returned to 101.7 ± 7% of baseline. These findings are in agreement with earlier reports from our laboratory (Moreira et al, 2007a).
MCT1 and MCT2 mRNA Expression in Sham and Compressed Hemispheres at 48 h of Reperfusion
In the cortex, MCT1/18S relative mRNA expression ratios were significantly increased in ipsilateral, ischemic (1.28 ± 0.10) and contralateral, nonischemic (1.09 ± 0.04) hemispheres compared to sham hemispheres (0.66 ± 0.13) (Figure 1A). In the hippocampus, MCT1/18S ratios were significantly higher in the ipsilateral hemispheres (1.33 ± 0.10) than in sham hemispheres (0.87 ± 0.09), whereas it was enhanced in the contralateral hemispheres but did not reach significance. In the thalamus, no significant differences were detected between hemispheres. No significant differences for MCT2/18S ratios in the cortex were detected between hemispheres (Figure 1B). In the hippocampus, MCT2/18S ratios were significantly augmented in the contralateral, nonischemic hemisphere (1.52 ± 0.19) when compared with those in sham hemispheres (0.75 ± 0.12), whereas the increase in the ipsilateral hemisphere did not reach significance (1.34 ± 0.10). In the thalamus, no significant differences in MCT2 mRNA expression were detected between hemispheres.
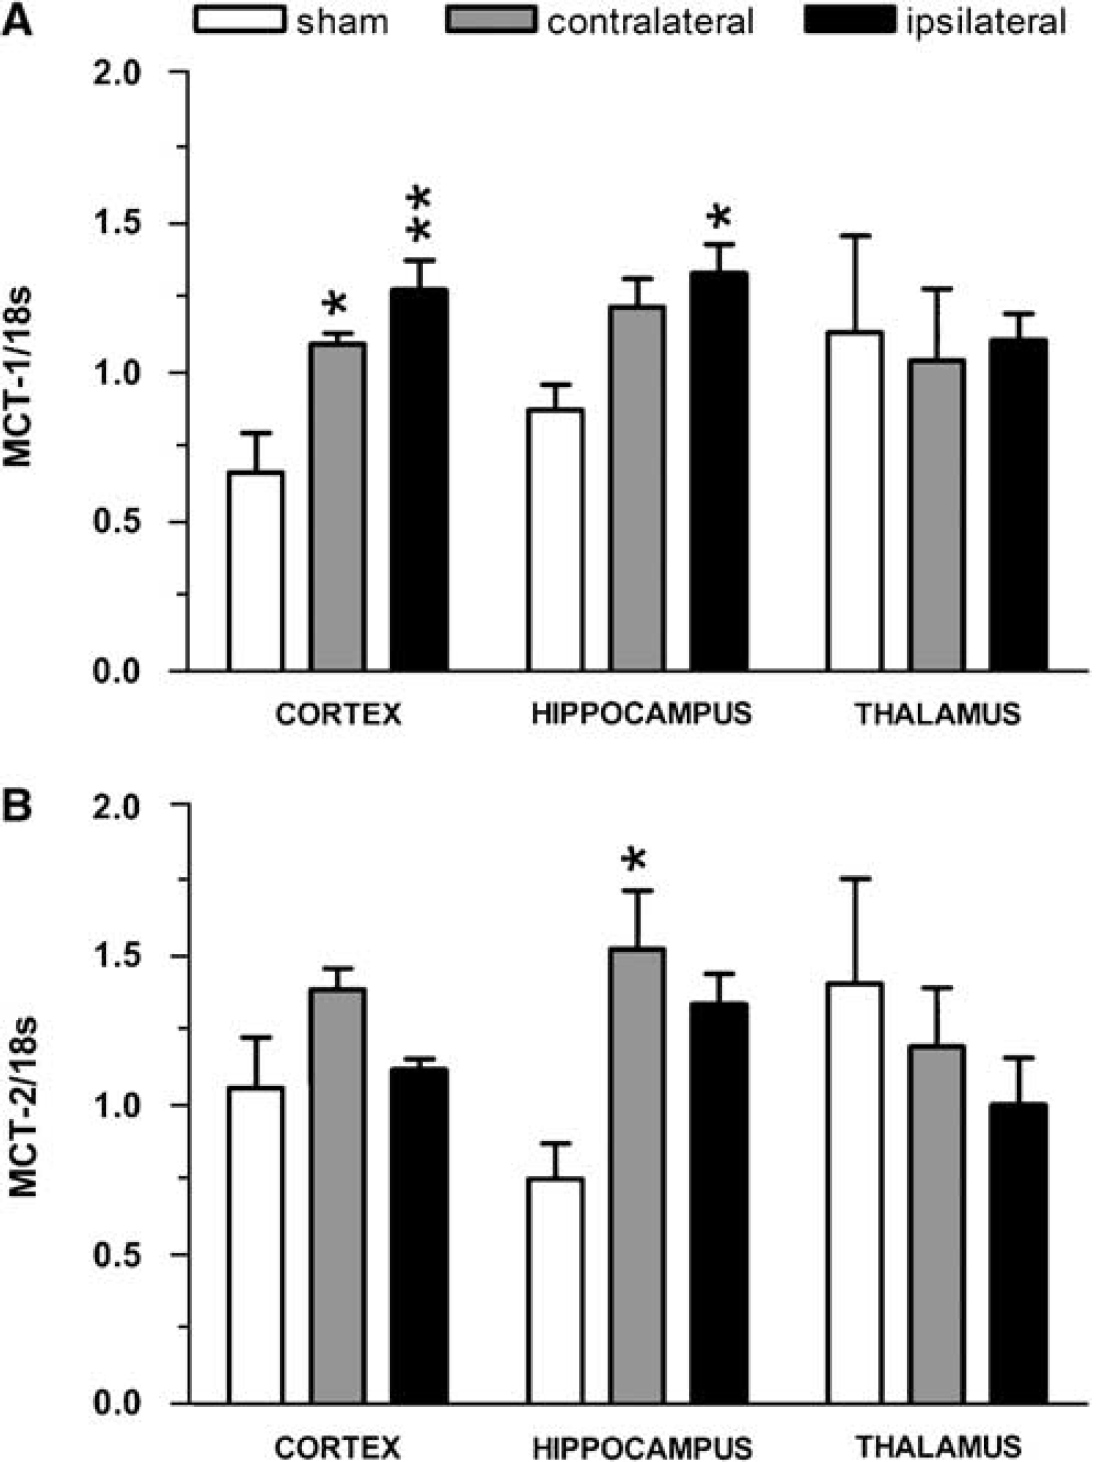
Changes in MCT1 and MCT2 mRNA expression after 48 h of reperfusion in compressed Wistar rats. (
MCT1 and MCT2 Protein Expression in Activated Microglia after Compression-Induced Ischemia
In the cortex of sham-operated animals, MCT1 immunoreactivity occurred essentially in the neuropil as well as on endothelial cells of capillaries (Figure 2A) as described earlier (Pierre et al, 2000). A neuropil staining for MCT2 immunoreactivity was also observed as reported earlier (data not shown). Extradural compression induced a pattern of cortical neurodegeneration in the sensorimotor cortex at 48 h of reperfusion, in agreement with earlier studies of compression-induced ischemia (Watanabe et al, 2001; Kundrotiene et al, 2002; Moreira et al, 2005; Andersson et al, 2006). At 48h of reperfusion, a few cells in the vicinity of the cortical lesion showed strong labeling for both MCT1 (Figure 2B) and MCT2 (Figure 2C) as compared with sham controls. Using double immunofluorescence labeling, it could be observed that both MCT1 (Figure 2D, red) and MCT2 (Figure 2E, red) immunolabelings colocalized (yellow) with the general microglial marker, OX-42 (green), in the cortical lesion core. Additional double labeling with isolectin B4 (green), a marker of activated microglia, confirmed microglial expression of both MCT1 (Figure 2F, red) and MCT2 (Figure 2G, red), as evidenced by the colocalization (yellow-orange coloration). No other specific cellular alteration in protein expression could be observed for either MCT1 or MCT2 at 48 h of reperfusion in this region (data not shown). In the corpus callosum, an area of strong isolectin B4 immunoreactivity (green) was detected in the vertical axis of the cortical lesion (Figure 2H). A few callosal elements in this area showed colocalization (yellow) of isolectin B4 (green) with MCT1 (Figure 2I, red) and MCT2 (Figure 2J, red). MCT1 (green) and GFAP (red) labelings did not colocalize in the corpus callosum (Figures 3A1 to A3) whereas colocalization of either MCT1 or MCT2 (green) with the β-subunit of the calcium-binding protein S100 (S100β, Figures 3B and 3C, red) was detected in a subpopulation of cells in the corpus callosum (Figures 3B and 3C, yellow-orange). Interestingly, double labeling with isolectin B4 (Figure 3D1, green) and S100β (Figure 3D2, red) showed that isolectin B4+-reactive microglia in the corpus callosum of compressed rats coexpressed S100β (Figure 3D3 inset, yellow).
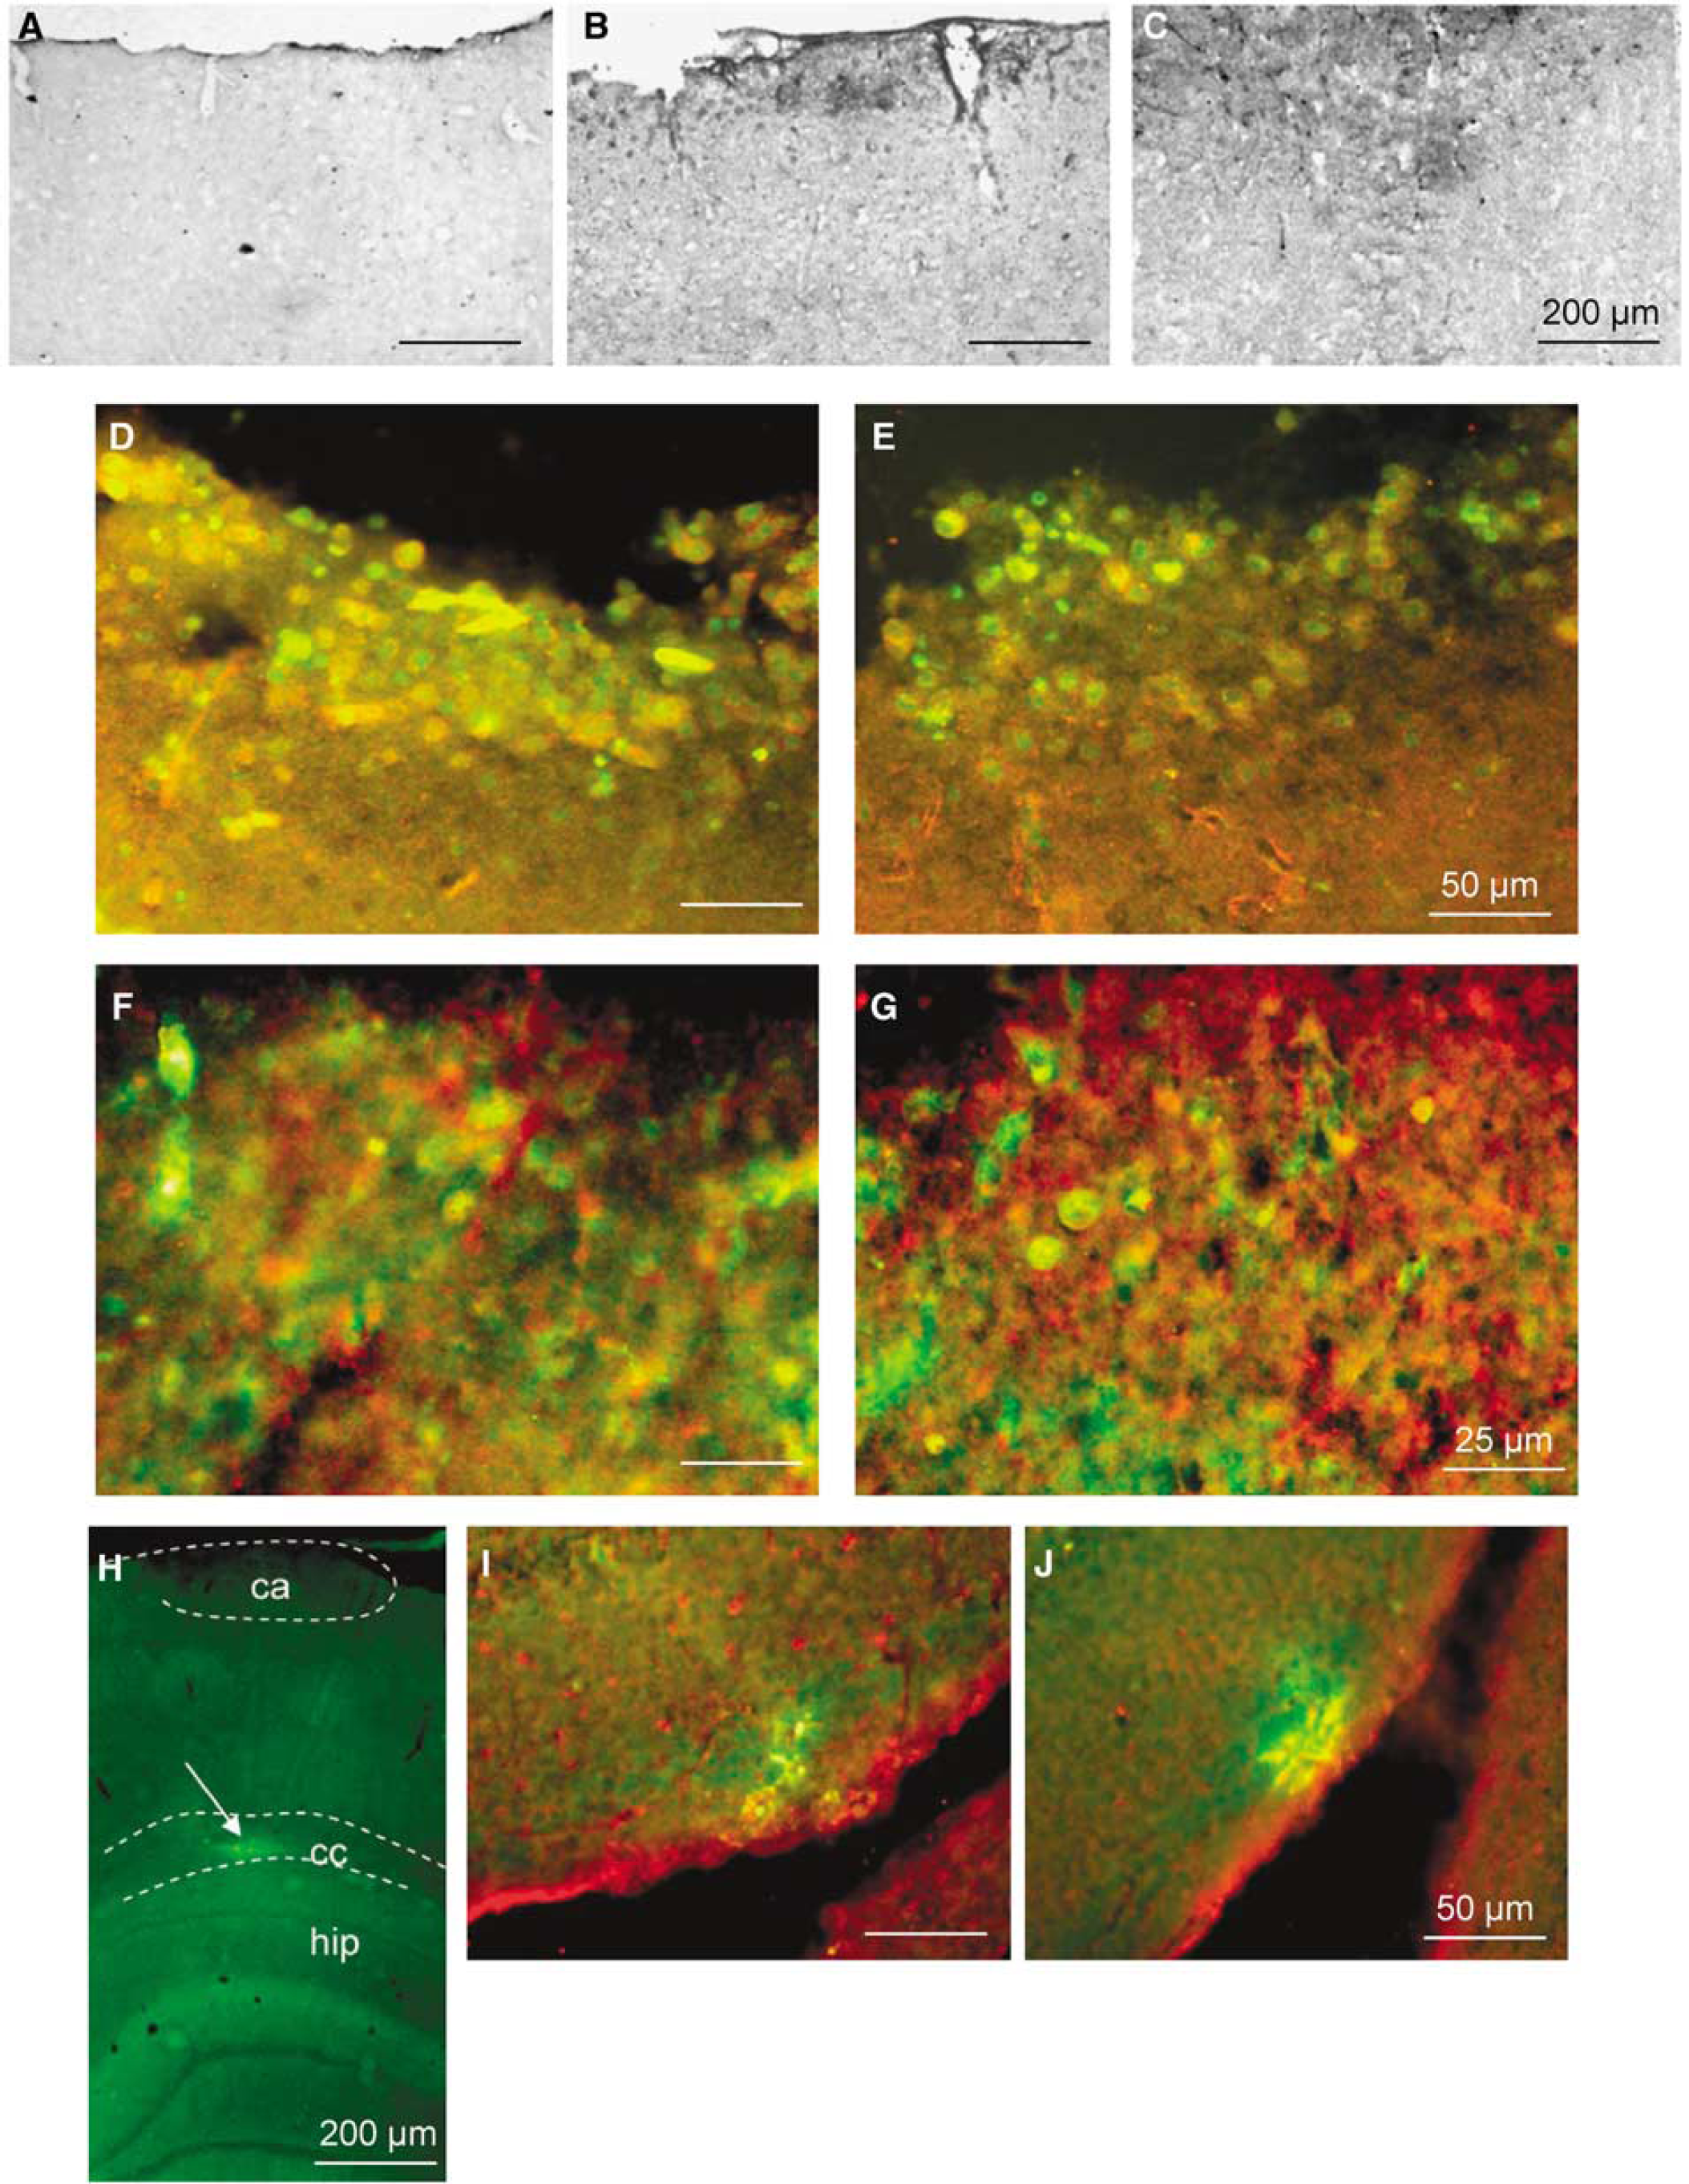
Colocalization of MCT1 and MCT2 with microglial markers at 48 h of reperfusion after cortical compression. Immunoperoxidase stainings for MCT1 in the cortex of (
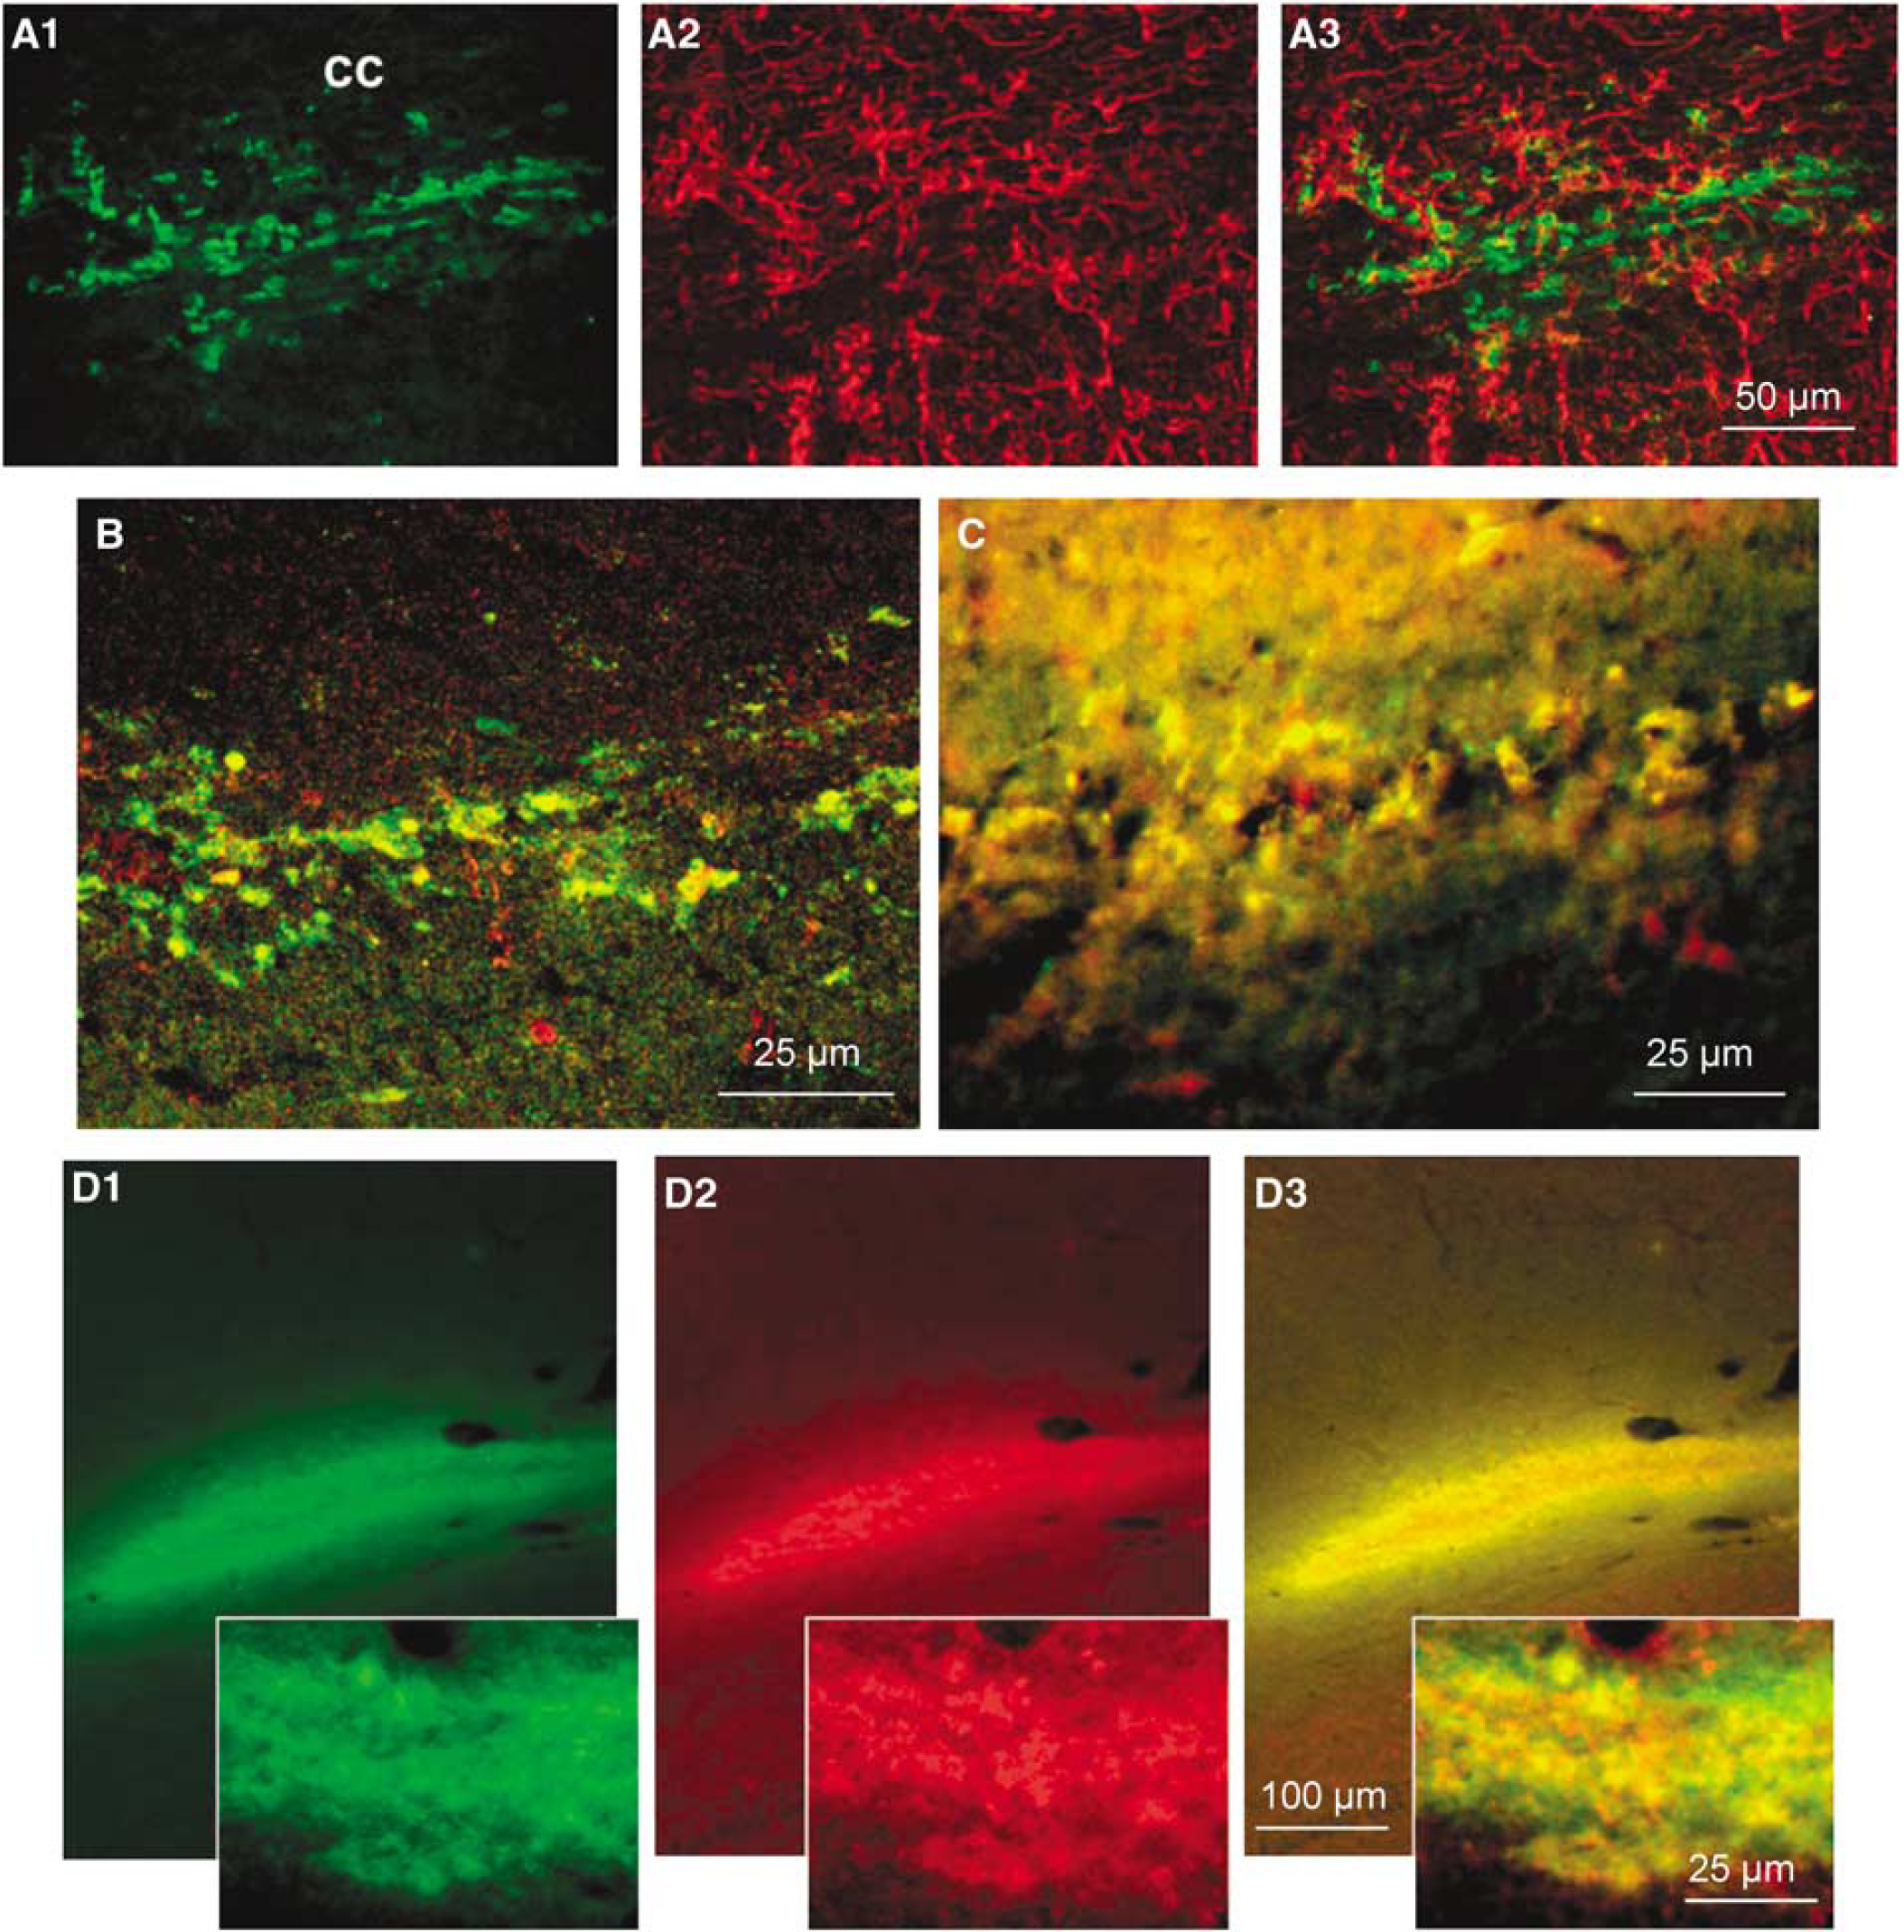
Unusual cell type marker expression for MCT1 and MCT2 immunopositive cells in the corpus callosum at 48h of reperfusion. Double labeling with MCT1 (
MCT1 and MCT2 expression in the N11 Microglial Cell Line
Using fluorescence microscopy, both MCT1 and MCT2 immunoreactivities were found in cultured N11 cells, a microglial cell line (Figures 4A and B, respectively). In both cases, immunoreactivity was closely associated with the plasma membrane (Figures 4A and 4B, insets), although part of it is also present in the cytoplasm. Immunoreactivity for MCT1 appeared stronger than for MCT2. Immunoblotting for MCT1 showed a band with a molecular mass of ~43kDa in N11 cells corresponding to the expected molecular weight of MCT1. The level of MCT1 expression in N11 cells is similar to the one found in Neuro2A cells, a classical neuroblastoma cell line (Figure 4C). Immunoblotting for MCT2 in N11 cells showed a faint band with a molecular mass of ~40kDa, corresponding to the expected molecular weight of MCT2. The presence of MCT2 in N11 cells is unique, as it was not detected in Neuro2A cells (Figure 4D). As TNF-α is a cytokine released within the brain parenchyma as a consequence of ischemia and is known to activate microglia, we investigated its effect on N11 cells. Stimulation with TNF-α at 2 or 10 ng/mL (data not shown) caused no alteration in the morphology of N11 cells, which maintained their round circular shape similar to untreated cells (Figure 4E). In contrast, morphology of N11 cells became enlarged, triangular or fusiform in shape after 3 h of stimulation with 20 ng/mL of TNF-α (Figure 4F). Interestingly, TNF-α caused a concentration-dependent increase of MCT1 protein expression in N11 cells that became significant at 10 ng/mL (Figure 4G; +60.6 ± 8.1% at 10 ng/mL). No significant change in the MCT2 protein expression was detected upon stimulation with 2, 10 or 20 ng/mL of TNF-α (Figure 4H).
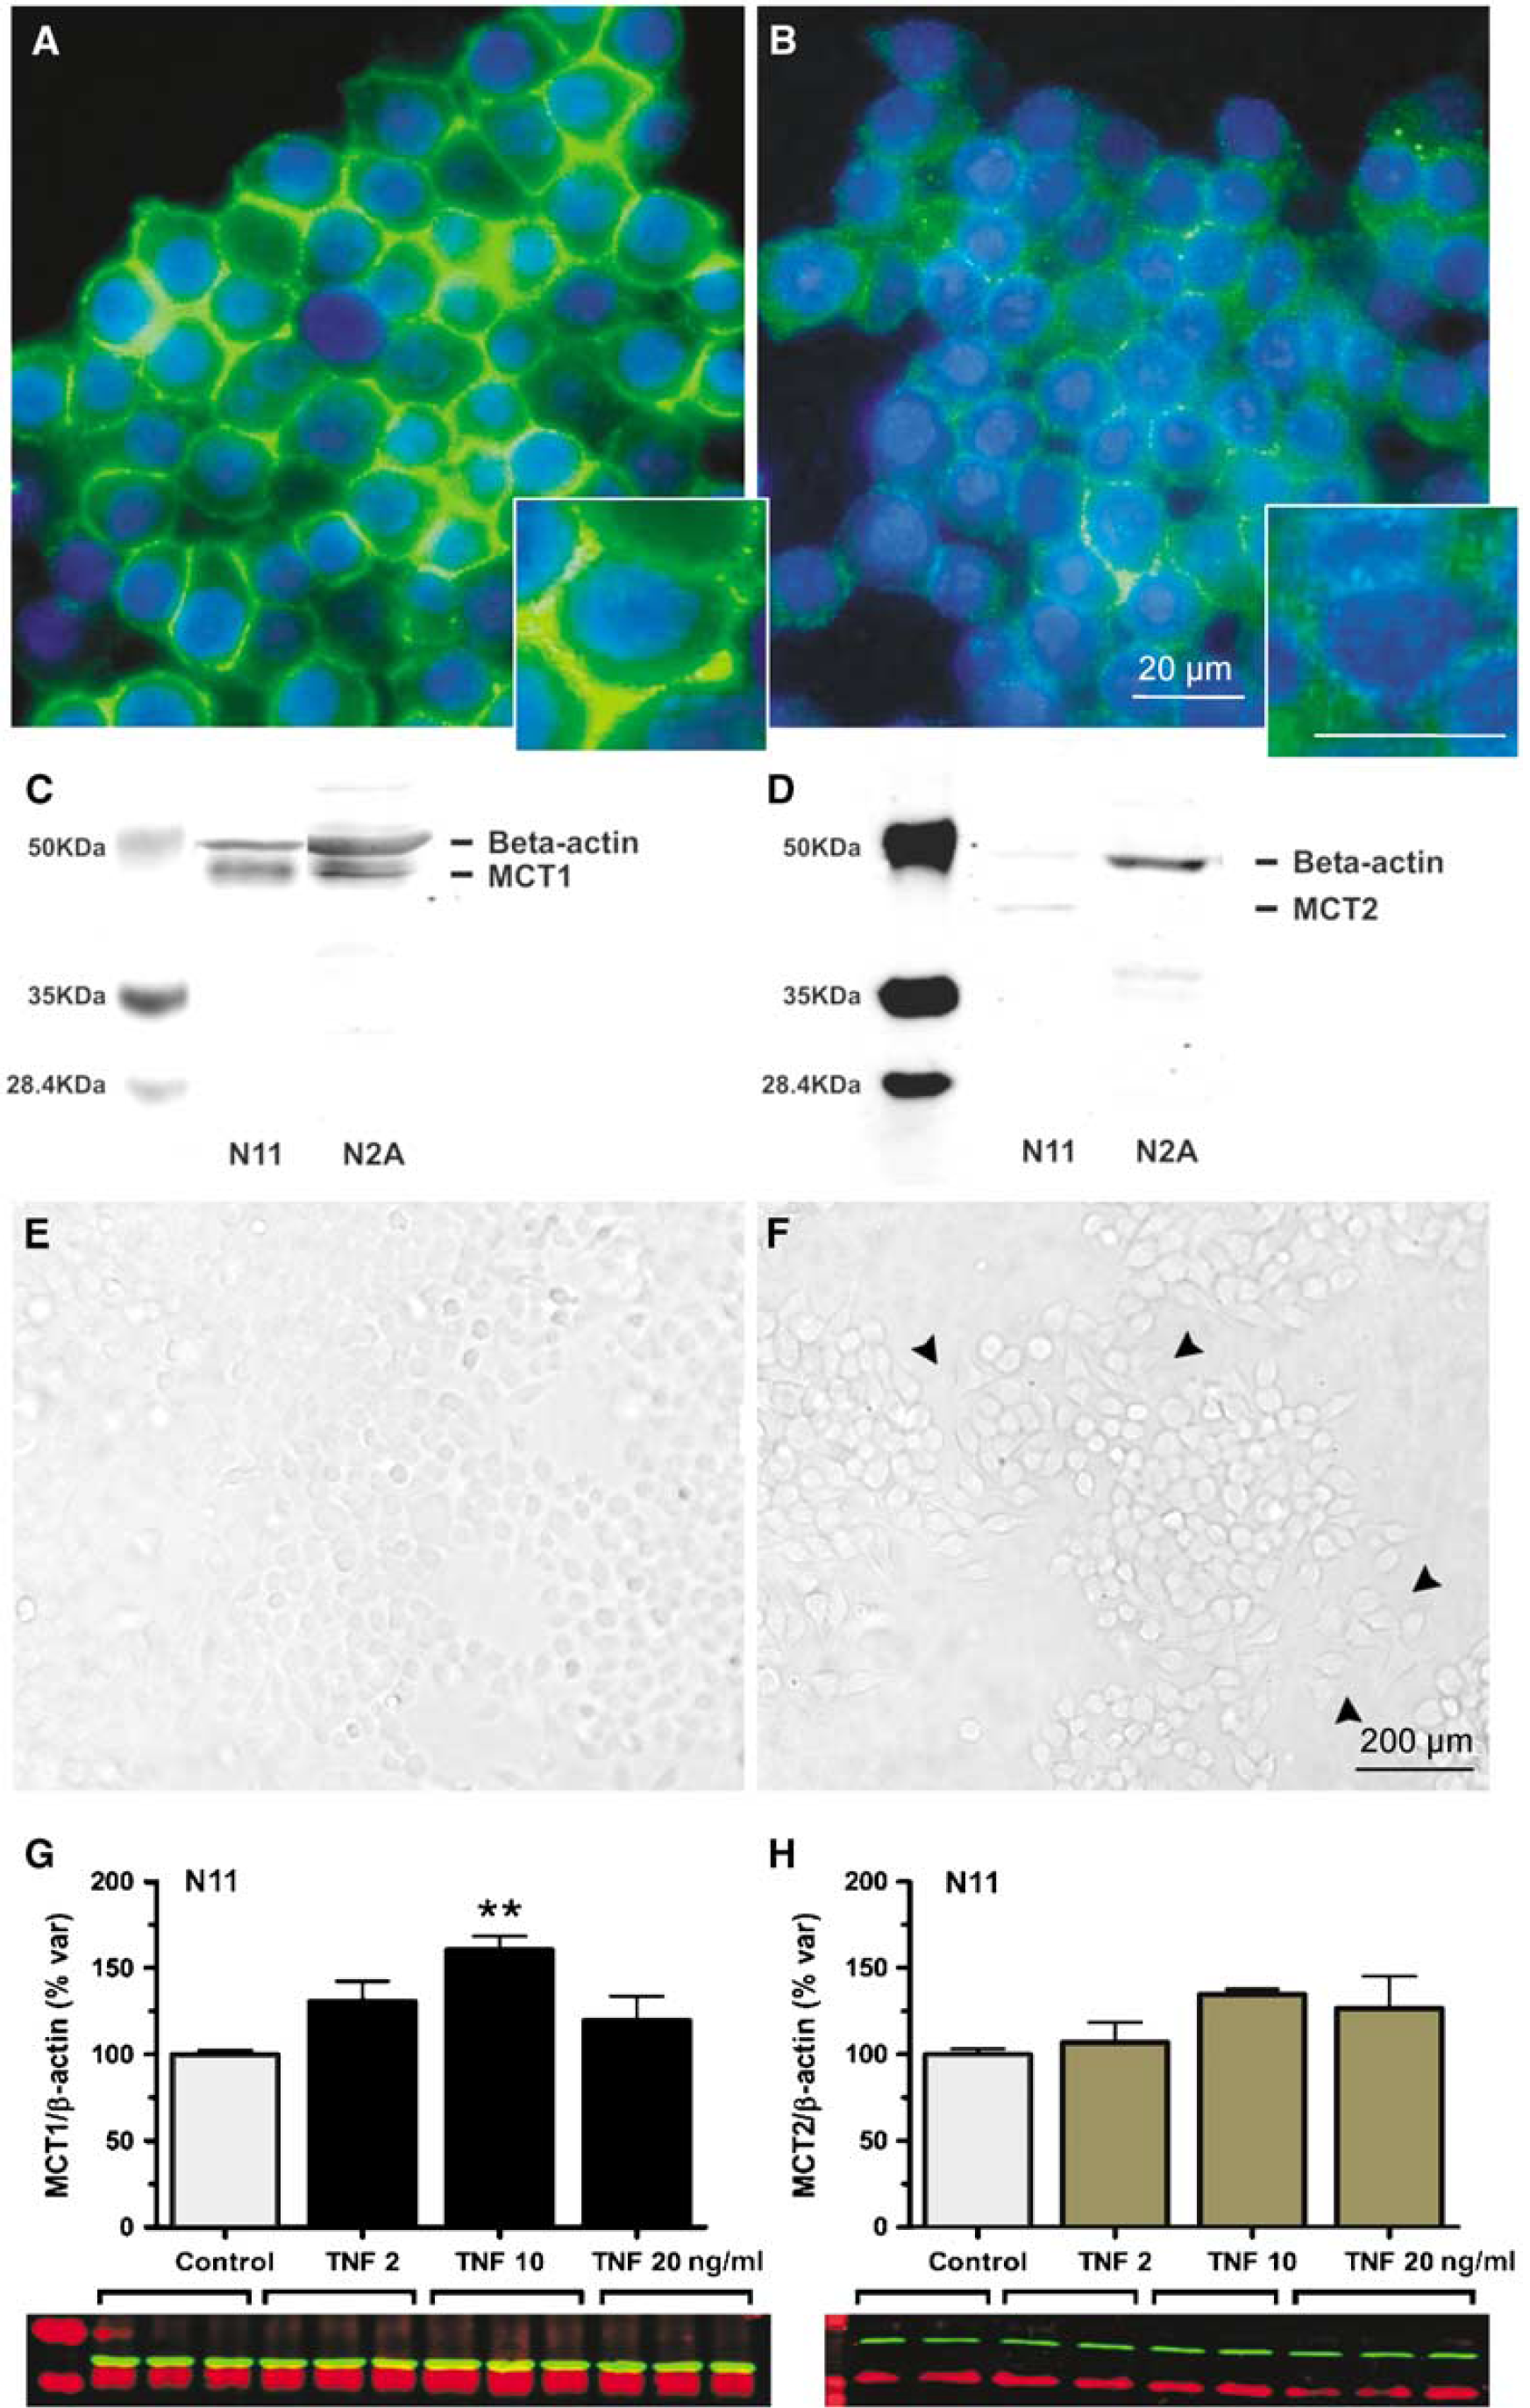
Monocarboxylate transporter expression in the N11 microglial cell line. Immunofluorescence labeling (green) of N11 microglial cells for MCT1 (
Discussion
Few studies have examined the changes in expression of MCTs in the brain after ischemia. The increased MCT1 mRNA levels observed here at 48 h after compression-induced ischemia are consistent with earlier observations made in two other ischemia models (Tseng et al, 2003; Zhang et al, 2005). First, Tseng et al (2003) reported in a transient global ischemia model, a strong MCT1 immunoreactivity in the hippocampus associated with astroglia, endothelial cells as well as ependymal lining. Second, a persistent increase in MCT1 mRNA levels up to 120 h after ischemia was reported in spontaneous hypertensive rats after permanent occlusion of the left middle cerebral artery (Zhang et al, 2005). A parallel increase in the MCT1 protein was described and associated with astrocytes and endothelial cells. In our case, we could not find colocalization between enhanced MCT1 protein expression and the astroglial marker, GFAP. As we assessed the expression only at 48 h after the ischemic episode, it is possible that in our model, only changes in mRNA levels take place at this time point, whereas alterations in the protein expression associated with astrocytes and endothelial cells would occur later on. Indeed, inhibition of protein synthesis after ischemia is a well-established phenomenon that involves persistent, but in many cases reversible, translation arrest (DeGracia et al, 2008). In addition to MCT1, changes in both MCT2 and MCT4 mRNA levels were also reported within and bordering the infarct zone at 120 h after onset in the middle cerebral artery occlusion model (Zhang et al, 2005). Interestingly, the authors suggested that such changes in MCT1, MCT2 and MCT4 in the infarct zone could be associated with microglia/macrophages and penetrating neutrophils, although they could not show it. Our observation that activated microglial cells identified by the expression of both OX42 and isolectin B4 also coexpress both MCT1 and MCT2 confirms the suggestion made by Zhang et al (2005). However, it remains unlikely that the observed changes in MCT1 and MCT2 mRNA expression are restricted to microglial cells, and further studies will be required to identify the other cell types involved. It is interesting to note that changes in both MCT1 and MCT2 expressions also occur at a certain distance from the lesion site including in the contralateral hemisphere. Diaschisis, or remote effects initiated by a focal lesion, has been well documented in several ischemia models and can affect both mRNA and protein expressions (Witte et al, 2000). Degeneration of callosal fibers, as reported earlier in our model using Fluro-Jade staining after ischemia (Moreira et al, 2006), could lead to changes in MCT expression in projecting areas. Other factors, including spreading depression and motor compensation during the recovery period, could also contribute to the remote alterations observed both ipsilaterally and contralaterally.
To date, no information is available about a possible expression of MCTs by microglial cells. Thus, to our knowledge, our study is the first to report the presence of both MCT1 and MCT2 expressions in activated microglial cells. Whether these two isoforms are expressed by the same cells in vivo or they represent two distinct populations of microglial cells is as yet unknown. Moreover, we cannot exclude the fact that peripheral macrophages, which were shown to express both MCT1 and MCT2 (Merezhinskaya and Fishbein, 2009), contribute to this population around the lesion site after ischemia. Our data regarding N11 cells confirm the presence of MCT1 and MCT2 in N11 cells and suggest the possibility that both could be expressed by microglial cells in vivo. In addition, few studies have examined the regulation of MCT expression in brain cells. In cultured neurons, it was shown that noradrenaline, insulin and insulin-like growth factor 1 enhance the expression of MCT2 by a translational activation (Pierre et al, 2003; Chenal and Pellerin, 2007; Chenal et al, 2008). Increased MCT1 expression was evidenced in cultured astrocytes exposed to hypoxia (Véga et al, 2006) or to the ciliary neurotrophic factor (Escartin et al, 2007). Our observation that TNF-α enhances the expression of MCT1 in the N11 microglial cell line not only provides another example of MCT regulation, this time by a cytokine, in brain cells, but it also suggests a mechanism to explain how upregulation of MCT1 can occur in microglial cells after an ischemic insult. Indeed, TNF-α was shown not only to be formed and released upon ischemia by brain cells but also to activate microglial cells directly (Barone and Feuerstein, 1999; Hallenbeck, 2002). As for the role of enhanced MCT expression in activated microglial cells, it could be related to the energetic costs associated with their different tasks after traumatic injury. Phagocytosis, removal and digestion of cellular debris, synthesis and release of cytokines as well as other neuroactive substances (e.g., nitric oxide) might require higher energy production that could be met by oxidation of lactate found in abundance in the extracellular space after ischemia.
An intriguing observation is the presence of a cell population in the corpus callosum strongly expressing MCT1 and MCT2 48 h after compression. These cells were identified as activated microglial cells, as they expressed isolectin B4. However, quite unexpectedly, these cells also exhibited S100β expression that is usually considered as an astrocytic marker. To our knowledge, it is the first time that colocalization between a microglial and an astrocytic marker is observed in vivo. However, it has been reported earlier that primary microglial cell cultures as well as the BV-2 microglial cell line express S100β in vitro (Adami et al, 2001). As it appears associated with filamentous structures, it is purported that S100β protein might be involved in cytoskeleton remodeling in these cells. In our case, expression of S100β in this microglial cell population could reflect the necessity for these cells to migrate at specific lesion sites within the white matter. Combined expression of MCTs could facilitate supply of energy substrates (as lactate) to fuel this migration process.
In conclusion, we have shown that expression of the MCTs, MCT1 and MCT2, undergoes significant changes in the brain after a transient episode of compression-induced ischemia as determined after 48 h of reperfusion. Part of the alterations observed occurs in activated microglial cells. It is suggested that enhancement of MCT expression provides an energy source for activated microglial cells to fuel their migration, phagocytosis and repair activities that take place after an ischemic episode.
Footnotes
Acknowledgements
TM was a recipient of a fellowship from the FCT—Fundação para a Ciência e Tecnologia, Portugal. FM was a recipient of a postdoctoral research fellowship from the Uehara Memorial Foundation and from the Manpei Suzuki Foundation for Diabetes Research (Tokyo, Japan). We thank Dr Noureddine Brakch (CHUV, Lausanne) and Dr Lucienne Juillerat-Jean-neret (University Institute of Pathology, CHUV, Lausanne) for kindly providing the Neuro2A and N11 cell lines, respectively, as well as the CIF—Cellular Imaging Facility (University of Lausanne). This work was supported by the Swedish Research Council (projects nos. 7688 and 15052) to SL and the Fonds National Suisse de la Recherche Scientifique Grant no. 3100A0-112119 to LP.
The authors state no conflict of interest.