
Abstract
The brain is a highly demanding organ, utilizing mainly glucose but also ketone bodies as sources of energy. Glucose transporter-1 (GLUT1) and monocarboxylates transporter-1 (MCT1) respectively transport glucose and ketone bodies across the blood-brain barrier. While reduced glucose uptake by the brain is one of the earliest signs of Alzheimer’s disease (AD), no change in the uptake of ketone bodies has been evidenced yet. To probe for changes in GLUT1 and MCT1, we performed Western immunoblotting in microvessel extracts from the parietal cortex of 60 participants of the Religious Orders Study. Participants clinically diagnosed with AD had lower cerebrovascular levels of GLUT1, whereas MCT1 remained unchanged. GLUT1 reduction was associated with lower cognitive scores. No such association was found for MCT1. GLUT1 was inversely correlated with neuritic plaques and cerebrovascular β-secretase-derived fragment levels. No other significant associations were found between both transporters, markers of Aβ and tau pathologies, sex, age at death or apolipoprotein-ε4 genotype. These results suggest that, while a deficit of GLUT1 may underlie the reduced transport of glucose to the brain in AD, no such impairment occurs for MCT1. This study thus supports the exploration of ketone bodies as an alternative energy source for the aging brain.
Keywords
Introduction
About 20% of the energy consumed by the body supports brain function, but the brain represents only 2% of the mass of the human body.1 –4 As the brain has very limited energy stores, its activity depends on a sustained supply of glucose or, alternatively, ketone bodies, from brain capillaries.5 –7
One of the early changes consistently observed in Alzheimer’s disease (AD) is the loss of glucose uptake by the brain.8 –12 Studies using positron emission tomography (PET) show reduced brain uptake of 18F-fluorodeoxyglucose (FDG) not only in clinical AD, but also in its earliest stages, including mild cognitive impairment (MCI) or in asymptomatic apolipoprotein E ε4 allele (ApoE4) carriers.10,13 –21 A reduction of cerebral glucose uptake has also been reported in various animals models of AD, using in situ brain perfusion,22,23 in vivo autoradiography24 –28 or PET.29,30 This energy deficit is considered a key factor in AD-related cognitive symptoms.31,32
Ketone bodies can serve as an alternative energy source for the brain, following a rise of their circulating concentrations under conditions such as prolonged fasting. 31 So far, the few published PET studies suggest that the uptake of radiolabeled acetoacetate (11C-AcAc) by the brain is maintained in MCI or AD.33 –35 On the other hand, ketone body supplementation in healthy young adult, MCI or AD individuals leads to higher 11C-AcAc uptake by the brain.36 –39 Originally used as a treatment for epilepsy,40,41 ketogenic interventions have been increasingly studied for their potential in early-stage AD over the past two decades, with recent findings showing promising results recently reported on cognitive outcomes.31,36,42 –45
To reach the central nervous system (CNS), glucose or ketone bodies must cross the blood-brain barrier (BBB). As a polar hydrophilic compound, glucose uptake through the BBB is predominantly mediated by the sodium-independent glucose transporter GLUT1, encoded by the SLC2A1 gene in capillary endothelial cells, via a passive facilitated transport.6,46 –49 Other types of glucose transporters are found on astrocytes (GLUT1, GLUT2, and GLUT7), oligodendrocytes (GLUT1) and neurons (GLUT3 and GLUT4) in the cortex, hippocampus, and cerebellum.6,31,46,50 –52 GLUT1 expression responds to changes in cellular metabolic demands, and it has been proposed that higher endothelial GLUT1 levels may favor brain uptake of glucose.53 –56 Monocarboxylates, such as lactate and ketone bodies, are transported across the BBB through the monocarboxylate transporter-1 (MCT1) coded by the SLC16A1 gene.57 –62 The high expression levels of MCT1 in human and murine brain endothelial cells have been confirmed by various techniques, including single-cell transcriptomics.47 –49,57,63 Other monocarboxylate transporters, such as MCT2 and MCT4, are predominantly expressed in neurons and astroglia.61,62 Contrasting with glucose uptake, the uptake of ketone bodies across the BBB does not appear to be enhanced by neuronal activity.64,65
Brain glucose hypometabolism is now regarded not only as an early diagnostic marker, but also a possible contributor to cognitive impairments in AD.10,11,21,31,32,66 –69 This hypothesis has fueled the search for alternative energy sources, such as ketone bodies, to compensate a chronic energy deficit in the aging brain. Still, the main transporters of glucose and ketone bodies, GLUT1, and MCT1, have not been investigated specifically at the BBB, where they stand at the gateway regulating energy uptake by the brain. It is therefore critical to determine to what extent their expression and function are altered during the progression of AD.
Here, we took advantage of our recently validated method to isolate brain microvessels from postmortem tissue70,71 to directly assess the cerebrovascular concentrations of GLUT1 and MCT1 in a cohort of study volunteers from the Religious Order Study (ROS). Subjects were divided in three groups according to the clinical diagnosis (no cognitive impairment (NCI), mild cognitive impairment (MCI) or AD) or the neuropathological diagnosis (Control or AD). Brain samples from the cohort used here have undergone an extensive biochemical characterization not only for Aβ and tau, but also for several vascular proteins.70 –72 We thus interrogated whether vascular levels of GLUT1 and MCT1 transporters in the parietal cortex were related to clinical and neuropathological diagnoses, neuropathological markers, and cognitive scores.
Material and methods
Human samples: Religious orders study (ROS) (Rush Alzheimer’s Disease Center)
Parietal cortex samples were obtained from participants in the ROS, a longitudinal clinical and pathological study of aging and dementia.70,71,73 Each participant enrolled without known dementia and agreed to an annual detailed clinical evaluation and brain donation at death. The study was approved by an Institutional Review Board of Rush University Medical Center. All participants signed an informed consent, an Anatomic Gift Act for brain donation, and a repository consent allowing their data and biospecimens to be shared. A total of 21 cognitive performance tests were administered of which 19 were used to create a global measure of cognition, and five cognitive domains: episodic, semantic, working memory, perceptual speed and visuospatial ability.74,75 Participants received a clinical diagnosis of Alzheimer’s disease dementia (AD), mild cognitive impairment (MCI) or no cognitive impairment (NCI) (n = 20 for each group) at the time of death by a neurologist, blinded to all postmortem data, as previously described.74,76,77 The neuropathological diagnosis is based on the ABC scoring method found in the revised National Institute of Aging – Alzheimer’s Association (NIA-AA) guidelines for the neuropathological diagnosis of AD, 78 as previously described. 71 Neuritic plaques, neurofibrillary tangles in the parietal cortex were counted following Bielschowsky silver impregnation. 79 Cerebellar pH was measured to confirm that the degree of preservation of the tissue was equivalent between groups.80,81 Soluble and insoluble levels of phosphorylated and total tau were quantified in parietal cortex using immunoblotting.81,82 Soluble and insoluble levels of Aβ40 and Aβ42, were assessed in homogenates of parietal cortex, as well as β-secretase-derived APP fragment (APP-βCTF) in the vascular fraction.71,72,81,82 See Table 1 for the characteristics of the cohort.
Participants were grouped according to the clinical diagnosis.
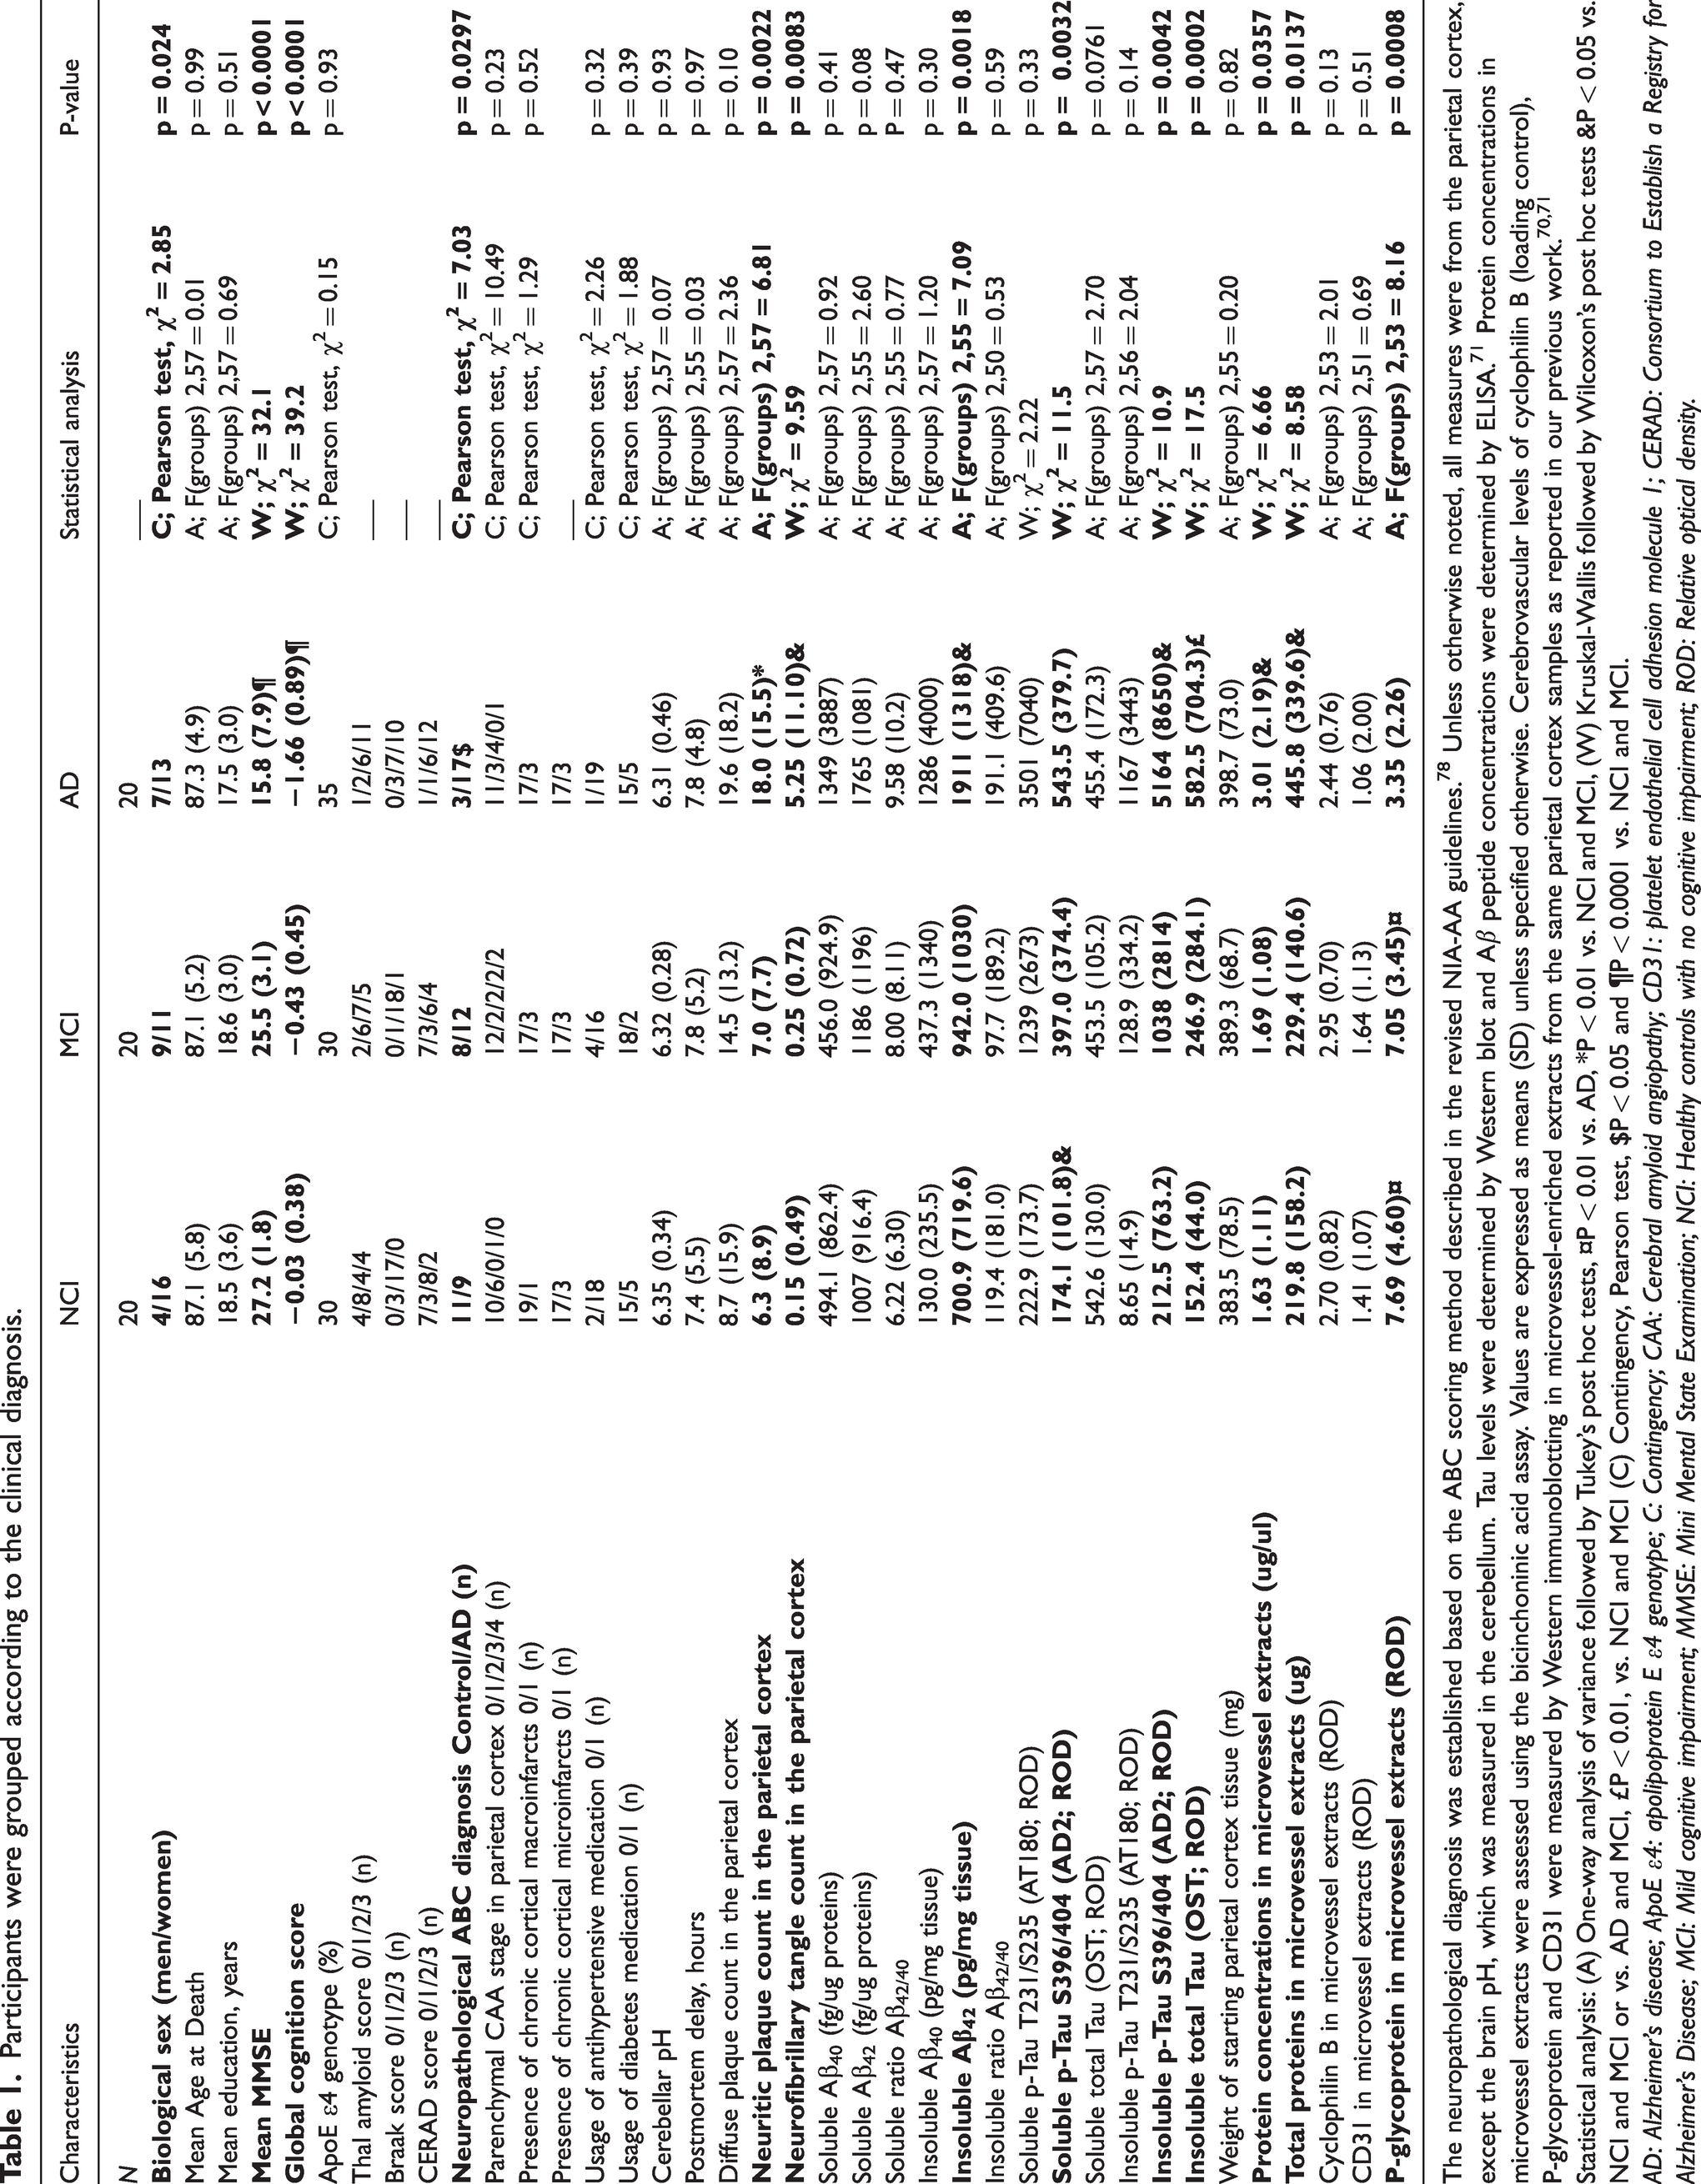
The neuropathological diagnosis was established based on the ABC scoring method described in the revised NIA-AA guidelines. 78 Unless otherwise noted, all measures were from the parietal cortex, except the brain pH, which was measured in the cerebellum. Tau levels were determined by Western blot and Aβ peptide concentrations were determined by ELISA. 71 Protein concentrations in microvessel extracts were assessed using the bicinchoninic acid assay. Values are expressed as means (SD) unless specified otherwise. Cerebrovascular levels of cyclophilin B (loading control), P-glycoprotein and CD31 were measured by Western immunoblotting in microvessel-enriched extracts from the same parietal cortex samples as reported in our previous work.70,71
Statistical analysis: (A) One-way analysis of variance followed by Tukey’s post hoc tests, ¤P < 0.01 vs. AD, *P < 0.01 vs. NCI and MCI, (W) Kruskal-Wallis followed by Wilcoxon’s post hoc tests &P < 0.05 vs. NCI and MCI or vs. AD and MCI, £P < 0.01, vs. NCI and MCI (C) Contingency, Pearson test, $P < 0.05 and ¶P < 0.0001 vs. NCI and MCI.
AD: Alzheimer’s disease; ApoE ε4: apolipoprotein E ε4 genotype; C: Contingency; CAA: Cerebral amyloid angiopathy; CD31: platelet endothelial cell adhesion molecule 1; CERAD: Consortium to Establish a Registry for Alzheimer’s Disease; MCI: Mild cognitive impairment; MMSE: Mini Mental State Examination; NCI: Healthy controls with no cognitive impairment; ROD: Relative optical density.
Isolation of brain microvessels
Human brain microvessels were extracted from separate inferior parietal cortex samples following the procedure described previously. 71 Following a series of centrifugation steps, including a density gradient centrifugation with dextran and a filtration (20-µm nylon filter), two fractions were obtained: one enriched in cerebral microvessels, the other consisting of microvessel-depleted parenchymal cell populations. Proteins of both fractions were extracted using a lysis buffer (150 mM NaCl, 10 mM NaH2PO4, 1 mM EDTA, 1% Triton X-100, 0.5% SDS and 0.5% deoxycholate) containing the same protease and phosphatase inhibitors cocktails (Bimake), and protein quantification was performed using bicinchoninic acid assays (Thermo Fisher Scientific).
Western blot
Proteins from the human vascular fraction were added to Laemmli’s loading buffer and heated 10 minutes at 70 °C (unheated for GLUT1). Equal amounts of proteins per sample (8 µg) were resolved on a sodium dodecyl sulfate-polyacrylamide gel electrophoresis (SDS-PAGE). All samples, loaded in a random order, were run on the same gel. Proteins were electroblotted on PVDF membranes, which were then blocked during 1 h at room temperature (RT) with a PBS solution containing 5% non-fat dry milk, 0.5% bovine serum albumin (BSA) and 0.1% Tween 20.
Membranes were stained with No-Stain™ protein labeling reagent (Thermo Fisher Scientific) to assess a similar protein load in the samples. Membranes were then incubated overnight at 4 °C with primary antibodies, listed in Suppl. Table 1. Membranes were then washed three times with PBS containing 0.1% Tween 20 and incubated during 1 h at RT with the secondary antibody in phosphate buffer saline (PBS) containing 0.1% Tween 20 and 1% BSA. Membranes were probed with chemiluminescence reagent (Luminata Forte Western HRP substrate; Millipore) and imaged using the Amersham Imager 680 (Cytiva). Densitometric analysis was performed using the Image Lab™ Software. Cyclophilin B (CypB) was used as a loading control. Uncropped gels of immunoblotting experiments conducted with human samples are shown in Suppl. Fig. 1.
Immunofluorescence
The method was similar to that described in previous publications.70,83 Extracts from the vascular fraction were dried on Superfrost Plus slides, fixed using a 4% paraformaldehyde solution in PBS for 20 minutes at RT and blocked with a 10% normal horse serum (NHS) and 0.1% Triton X-100 solution in PBS for 1 h at RT. Following an incubation overnight at 4 °C with primary antibodies diluted in a 1% NHS and 0.05% Triton X-100 solution in PBS, vascular extracts were incubated with secondary antibodies diluted in the same solution during 1 h at RT. Primary and secondary antibodies are listed in Suppl. Table 1. Cell nuclei were counterstained with 4′,6-diamidino-2-phenylindole (DAPI) (Thermo Fisher Scientific, 0.02% in PBS) and slides were mounted with mounting medium (VectaMount AQ Mounting Medium). Between each step, three washes of 5 min in PBS were performed.
Images were taken using a fluorescence microscope (EVOS fl Auto Imaging system; Thermo Fisher Scientific) at magnification 40x.
Data availability
The data that support findings of this study are available from the corresponding author on reasonable request. Data from the ROS can be requested at https://www.radc.rush.edu. Database of gene expression in adult mouse brain and perivascular cells is available at http://betsholtzlab.org/VascularSingleCells/database.html (Betsholtz lab), and here for human https://twc-stanford.shinyapps.io/human_bbb/ (Tony Wyss-Coray lab).
Statistical analysis
As is often the case with human samples, acquired data did not always meet assumptions of normality of distribution and equal variances between groups. Therefore, Mann-Whitney tests were used to identify significant differences between two groups. When more than two groups were compared, parametric one-way ANOVA followed by Tukey’s multiple comparison tests were performed, unless variances were different, in which case a non-parametric Kruskall-Wallis test followed by Wilcoxon’s multiple comparison was performed. Multiple regression analyses were made after adjustment for sex, age at death and ApoE genotype. Global cognitive scores were analyzed as a sum or compartmentalized into the 5 domains of episodic memory, semantic memory, working memory, perceptual speed and visuospatial ability evaluation. The threshold for statistical significance was set to p < 0.05. Individual data were excluded for technical reasons or if determined as an outlier. All statistical analyses were performed using GraphPad Prism 9.0 or JMP 16 softwares. Additional statistical analyses are available in Suppl. Table 2.
Study approval
All procedures performed with volunteers included in this study were in accordance with the ethical standards of the institutional ethics committees and with the 1964 Helsinki Declaration. Written informed consent was obtained from all individual participants included in this study.
Results
GLUT1 and MCT1 are enriched in human brain microvessels
We first confirmed that GLUT1 and MCT1 were enriched in brain microvessel extracts. As represented in Figure 1(a), GLUT1, MCT1, as well as the endothelial proteins platelet endothelial cell adhesion molecule 1 (CD31) and P-glycoprotein (P-gp, also known as ATP-binding cassette transporter B1 (ABCB1)) were highly concentrated in human brain microvessel fractions, contrasting with neuronal proteins GAP43 (growth associated protein 43) and β-tubulin III. Immunofluorescence analyses on isolated human brain microvessels revealed that GLUT1 and MCT1 were localized on microvessels, labelled with type IV collagen, a marker of basement membrane (Figure 1(b)). As previously reported,70,71 levels of CD31 and CypB remained comparable across clinical diagnostic groups, suggesting no AD-related loss of endothelial cells and constant protein loading in gels, respectively (Table 1). Starting tissue weights were similar between groups, but protein concentrations and total protein content in microvessel extracts were slightly higher in AD (Table 1). However, cerebrovascular levels of P-gp (ABCB1), an efflux transporter involved in Aβ clearance, 84 were lower in AD (Table 1).
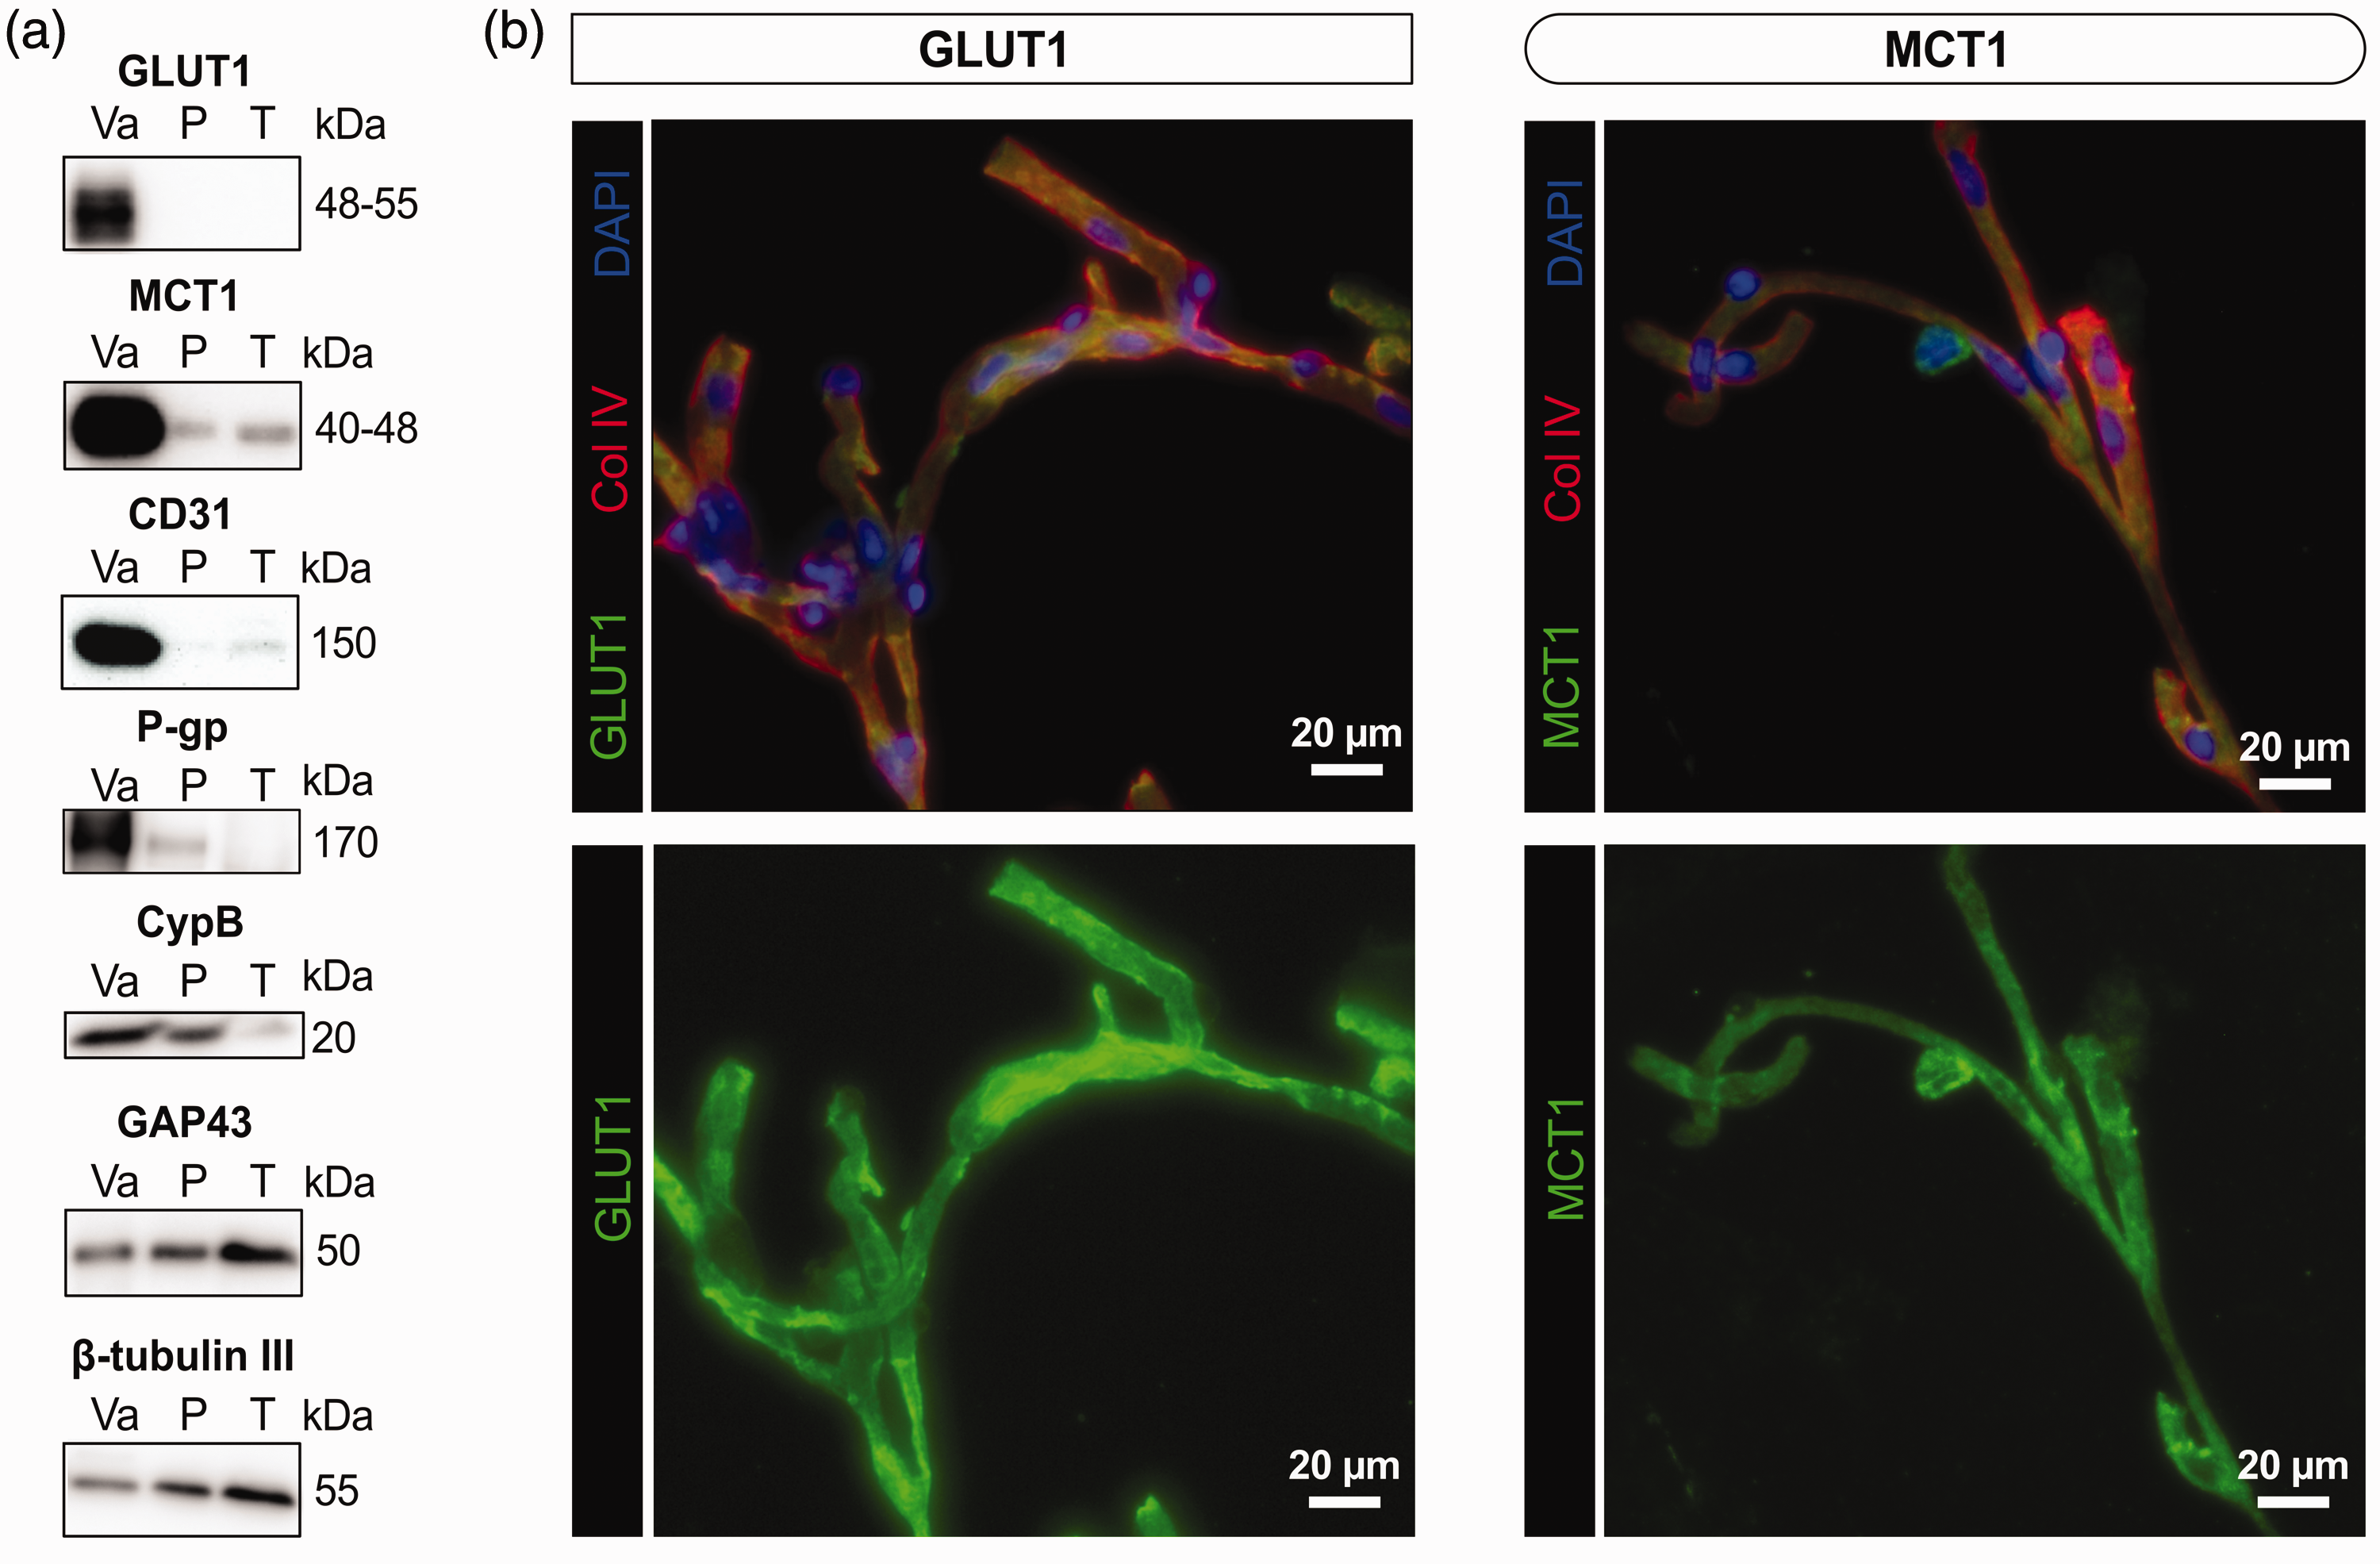
Glucose transporter (GLUT1) and ketone body transporter (MCT1) are enriched in human brain microvessel extracts. (a) Western immunoblotting analyses on human brain microvessel extracts show that GLUT1 as well as MCT1 are concentrated in the vascular fraction, as are endothelial markers CD31 and P-gp. The loading control CypB is also shown. On the other hand, GAP43 and β-tubulin III, both neuronal markers, are rather enriched in the microvessel-depleted parenchymal fraction. Representative photo examples were taken from the same immunoblot experiment. The same amount (8 µg) of proteins per sample was loaded. (b) Immunofluorescence assays showing that antibodies raised against GLUT1 and MCT1 bind to human brain microvessels, colabeled with basal lamina marker collagen IV (Col IV). Scale bar: 20 µm (40X).
Levels of GLUT1 are reduced while MCT1 remains stable in human brain microvessels
Lower cerebrovascular levels of GLUT1 (p = 0.004) were noted in individuals with a neuropathological diagnosis of AD, based on the ABC scoring system, compared to Controls (Figure 2(a)). Significance was reached only after adjustments for biological sex, age at death and ApoE genotype covariates. In contrast, no difference was found for cerebrovascular levels of MCT1 (Figure 2(b)). Consistent results were obtained for comparisons based on the clinical diagnosis, as GLUT1 levels were lower for AD participants compared to NCI (−49%, p = 0.002) and MCI (−54%, p = 0.0001) (Figure 2(c)). These differences were significant with a Kruskall-Wallis Wilcoxon’s non-parametric test and with an ANCOVA including sex, age at death and ApoE genotype as covariates (Figure 2(c)). By contrast, MCT1 levels were similar between clinical diagnosis groups (Figure 2(d)). Consistent with the association with the clinical diagnosis, ante mortem global cognition was strongly positively correlated with the cerebrovascular content in GLUT1, while no such association was established with MCT1 (Figure 2(e) and (f)). Differences observed remained significant after adjustment for sex, age at death and ApoE genotype (Figure 2).
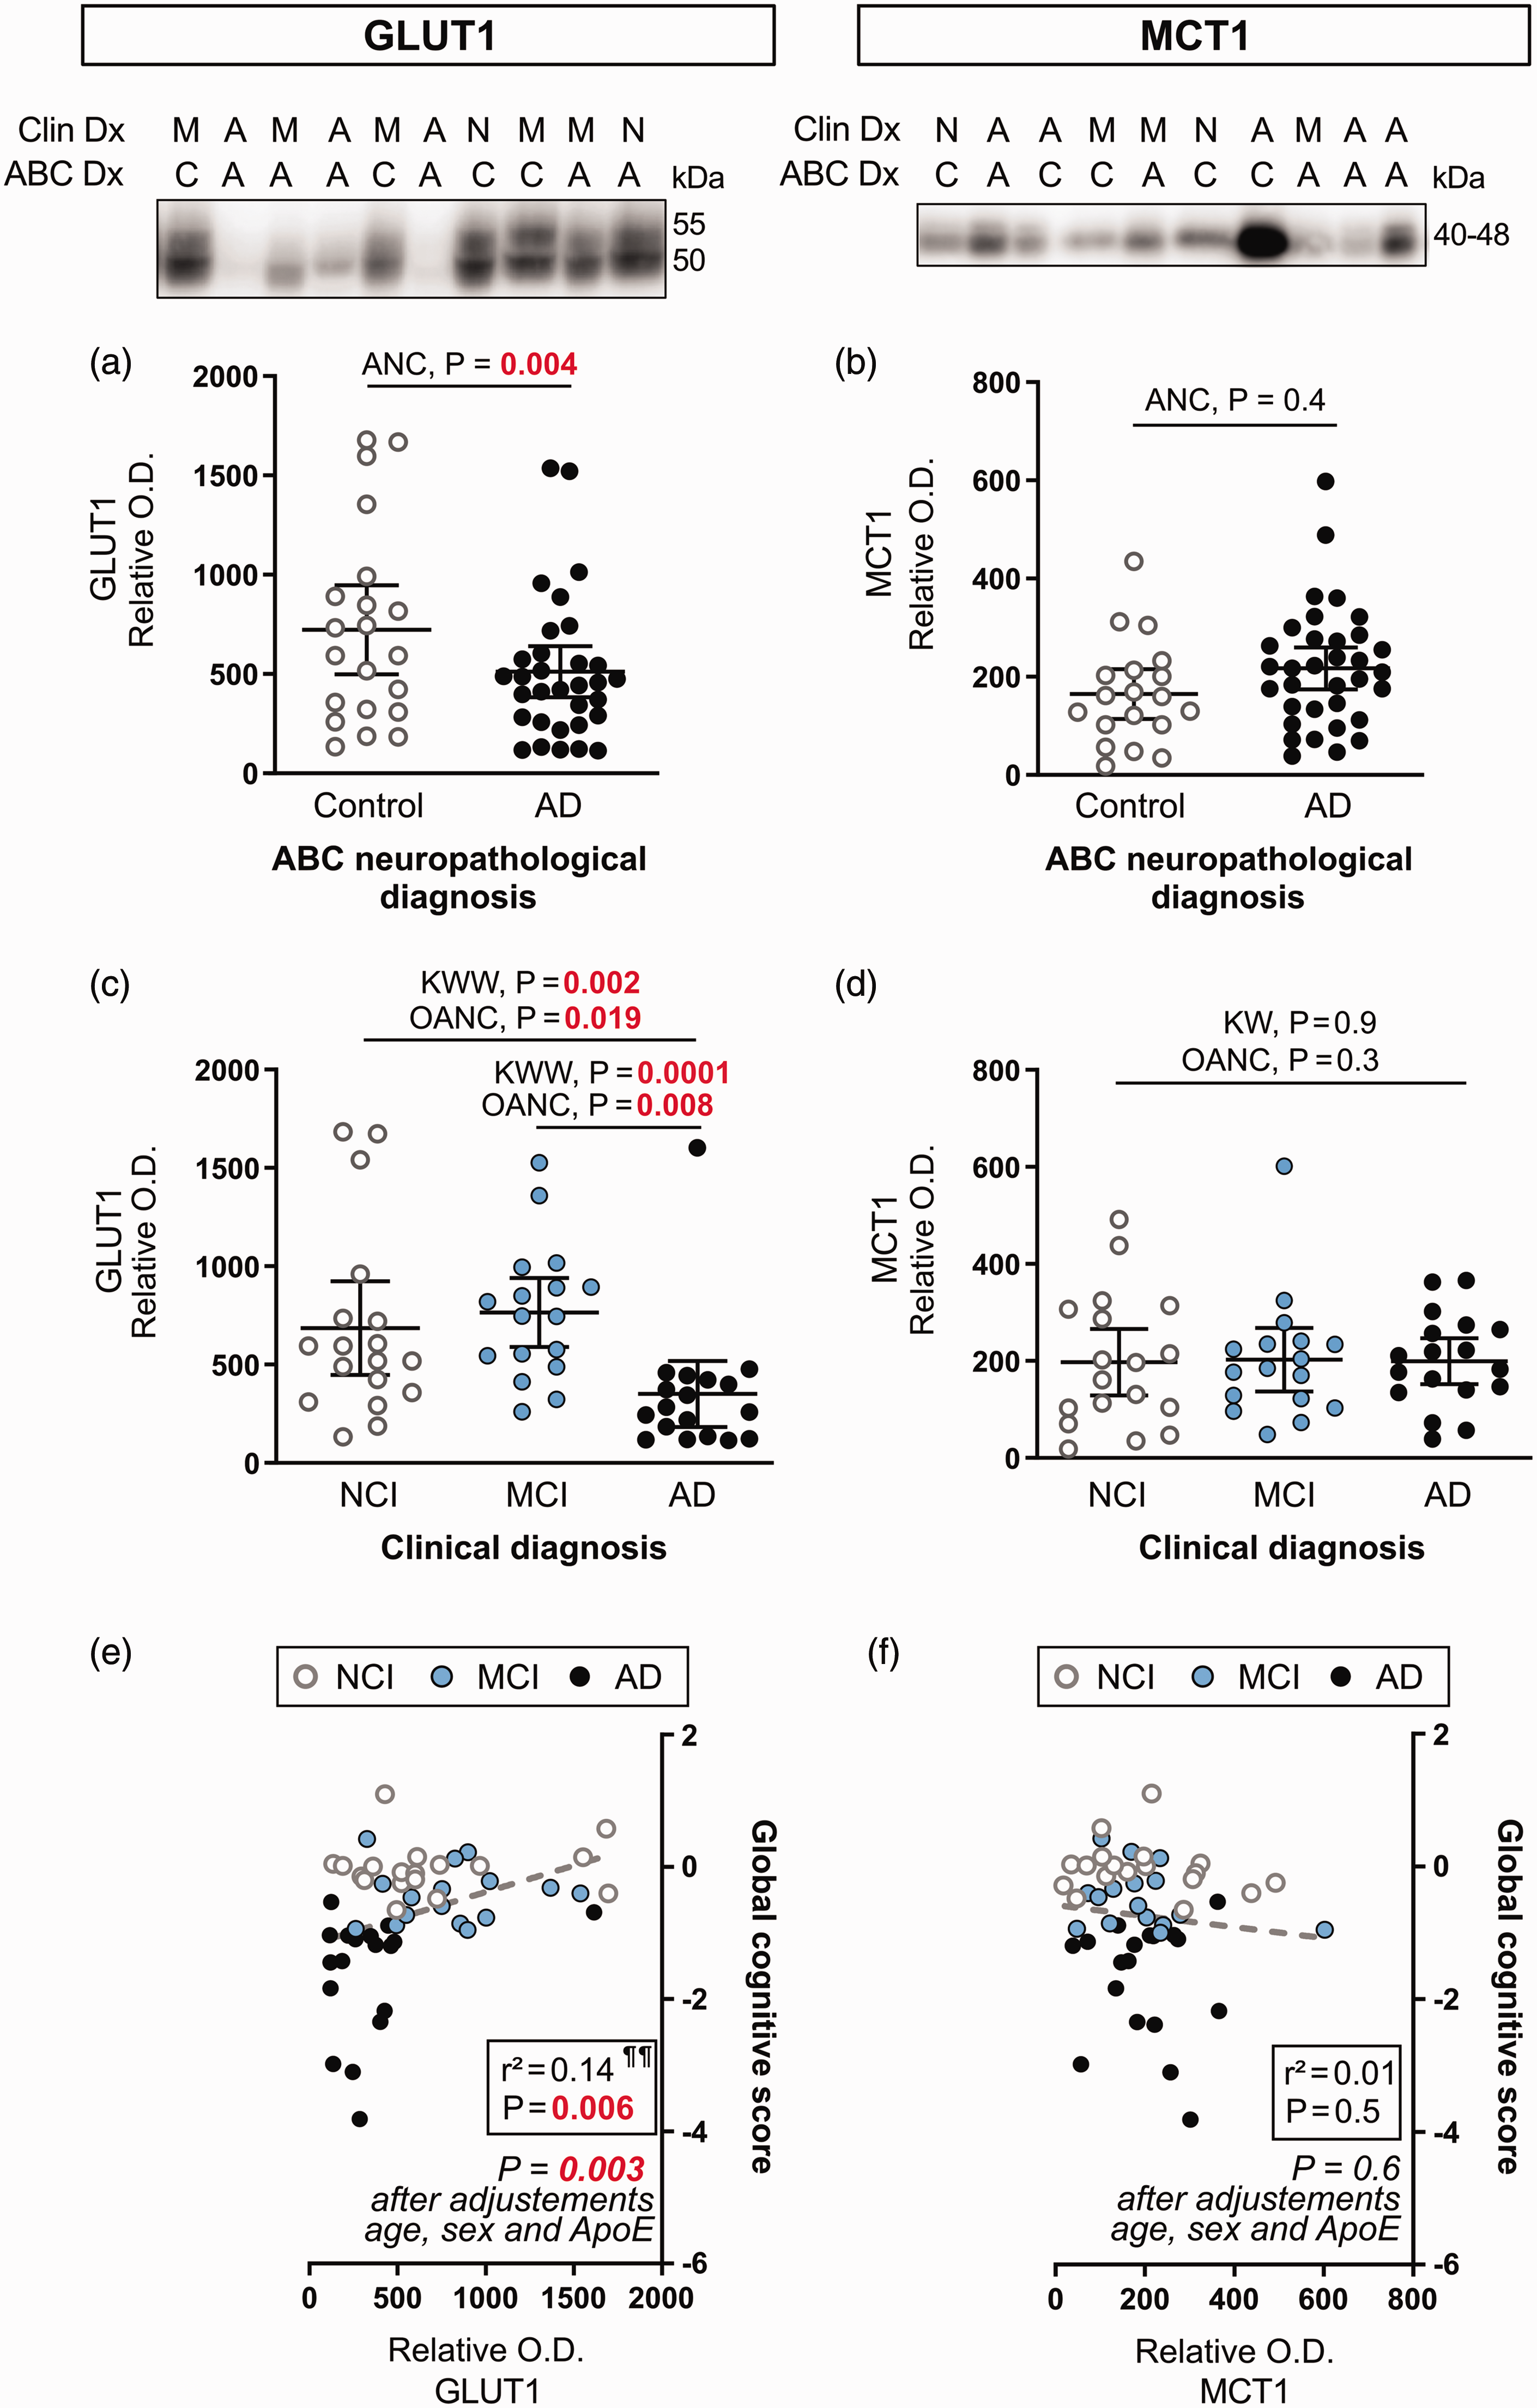
Cerebrovascular levels of GLUT1 are lower in clinically diagnosed AD participants, while MCT1 levels are comparable between subjects. (a, b) Subjects were compared according to the neuropathological diagnosis following ABC criteria. (c, d) Subjects were grouped according to the clinical diagnosis. Protein content in human microvessel extracts were determined by Western immunoblotting. Data are represented as scatterplots, with horizontal lines depicting means of relative optical density values with 95% confidence intervals. Representative photo examples illustrate consecutive bands. Uncropped gels of all immunoblot assays are shown in Suppl. Fig. 1. (e,f) GLUT1 was positively associated with global cognitive scores, but not MCT1.
Investigating further the association with the neuropathological diagnosis of AD, we show that cerebrovascular GLUT1 levels were lower in subjects with a Thal score of 2 and 3 (high Aβ-plaque frequency, p = 0.006), a Braak score of 3 (high neurofibrillary tangle count, p = 0.032), and with a CERAD score of 2 and 3 (high neuritic plaque density), p = 0.0002), after adjustments for sex, age at death and ApoE genotype (Figure 3(a) to (c)). MCT1 concentrations did not vary in individuals based on ABC scoring (Figure 3(a) to (c)). The stage of parenchymal cerebral amyloid angiopathy (pCAA) had no significant impact on GLUT1 or MCT1 levels (Figure 3(d)).
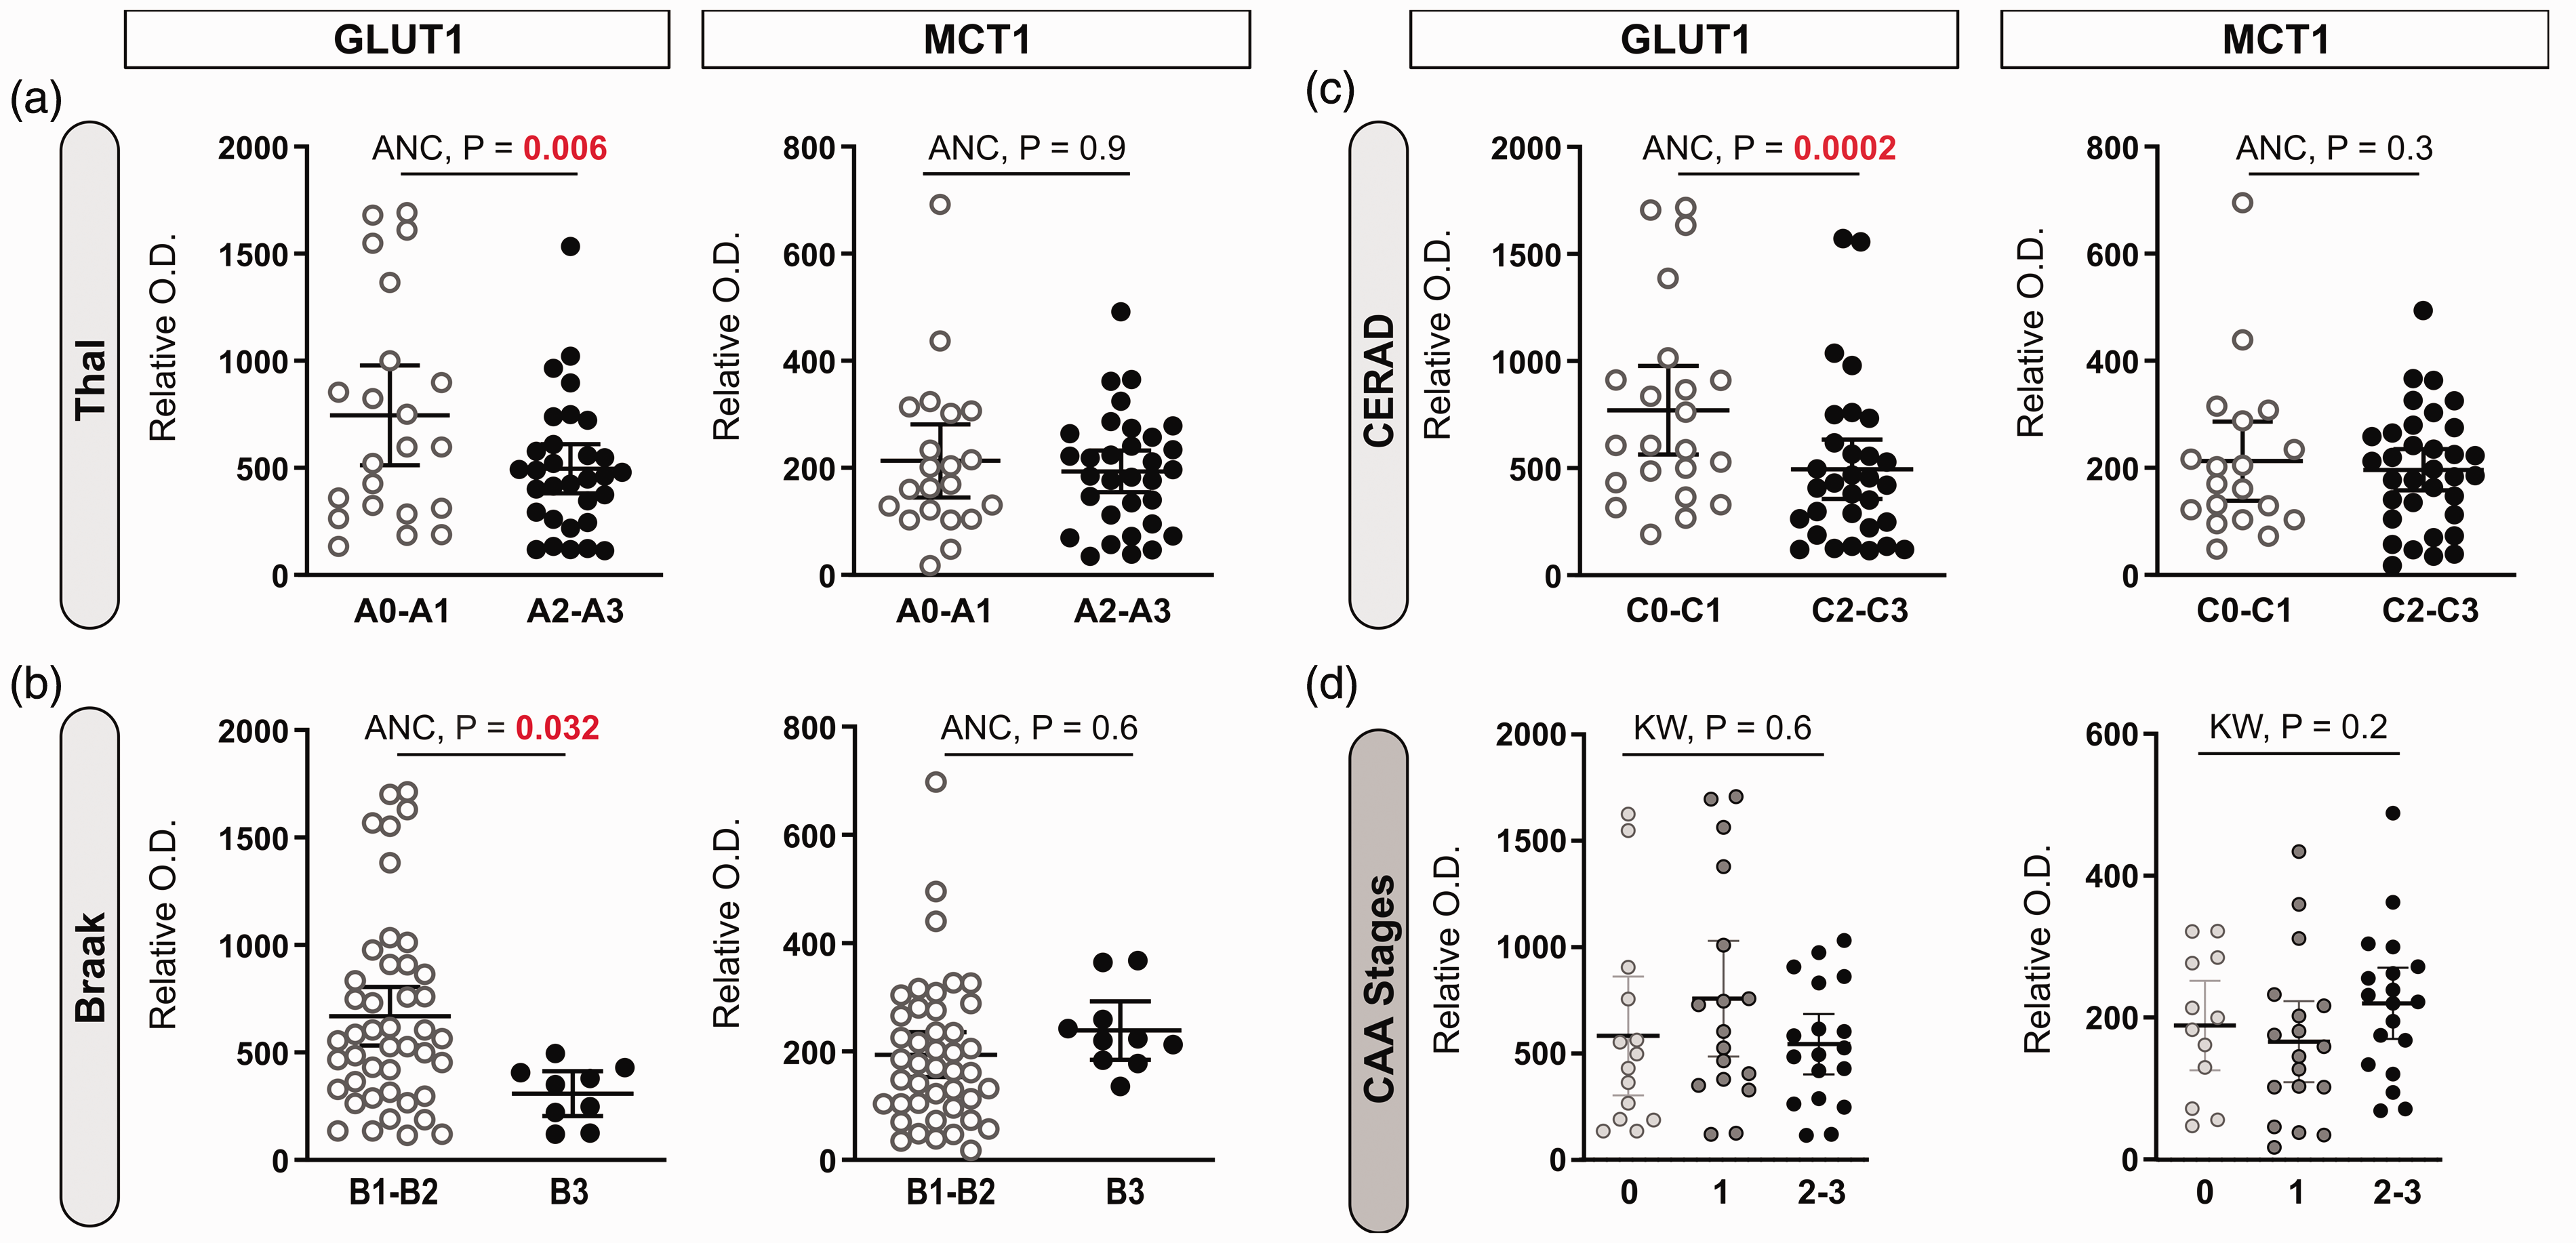
Cerebrovascular levels of GLUT1 are lower in individuals with an AD diagnosis based on Thal, Braak and CERAD subscores, but not based on parenchymal cerebral amyloid angiopathy (pCAA) stages. (a–d) Dot plots of the levels of GLUT1 and MCT1 in brain microvascular fractions comparing participants based on their neuropathological diagnosis following the ABC criteria and classified CAA stages. “A”-Thal score assessing phases of Aβ plaque accumulation (A), “B”-Braak score assessing neurofibrillary tangles (B), and “C”-CERAD score assessing neuritic plaque density (C). Parenchymal CAA stages in the parietal cortex were determined in the angular gyrus (d). Horizontal lines indicate means of relative optical density values with 95% confidence intervals. Additional statistical analyses are available in Suppl. Table 2.
Levels of vascular GLUT1 correlate with Aβ pathology and cognitive performance
We next investigated associations between vascular GLUT1, MCT1 and other key study variables from the same series of ROS participants, using linear regression analyses following adjustments for sex, age at death, and ApoE genotype (Figure 4). First, a strong inverse correlation was found between GLUT1 and APP-βCTF levels 72 (r2 = −0.28, p < 0.0001), a cleavage product of β-secretase (BACE1), both quantified in cerebrovascular fractions (Figure 4(a)). Second, GLUT1 was inversely related to neuritic plaque counts (r2 = −0.12, p = 0.002), but not with ELISA-measured concentrations of Aβ40 and Aβ42, assessed in the same brain region (Figure 4(a)). However, no significant correlations were observed between cerebrovascular MCT1 and Aβ pathology in either vascular fractions or brain homogenates. Finally, no significant association was detected between cerebrovascular GLUT1 or MCT1 and tau neuropathology, age at death, biological sex or ApoE ε4 genotype (Figure 4(a)).
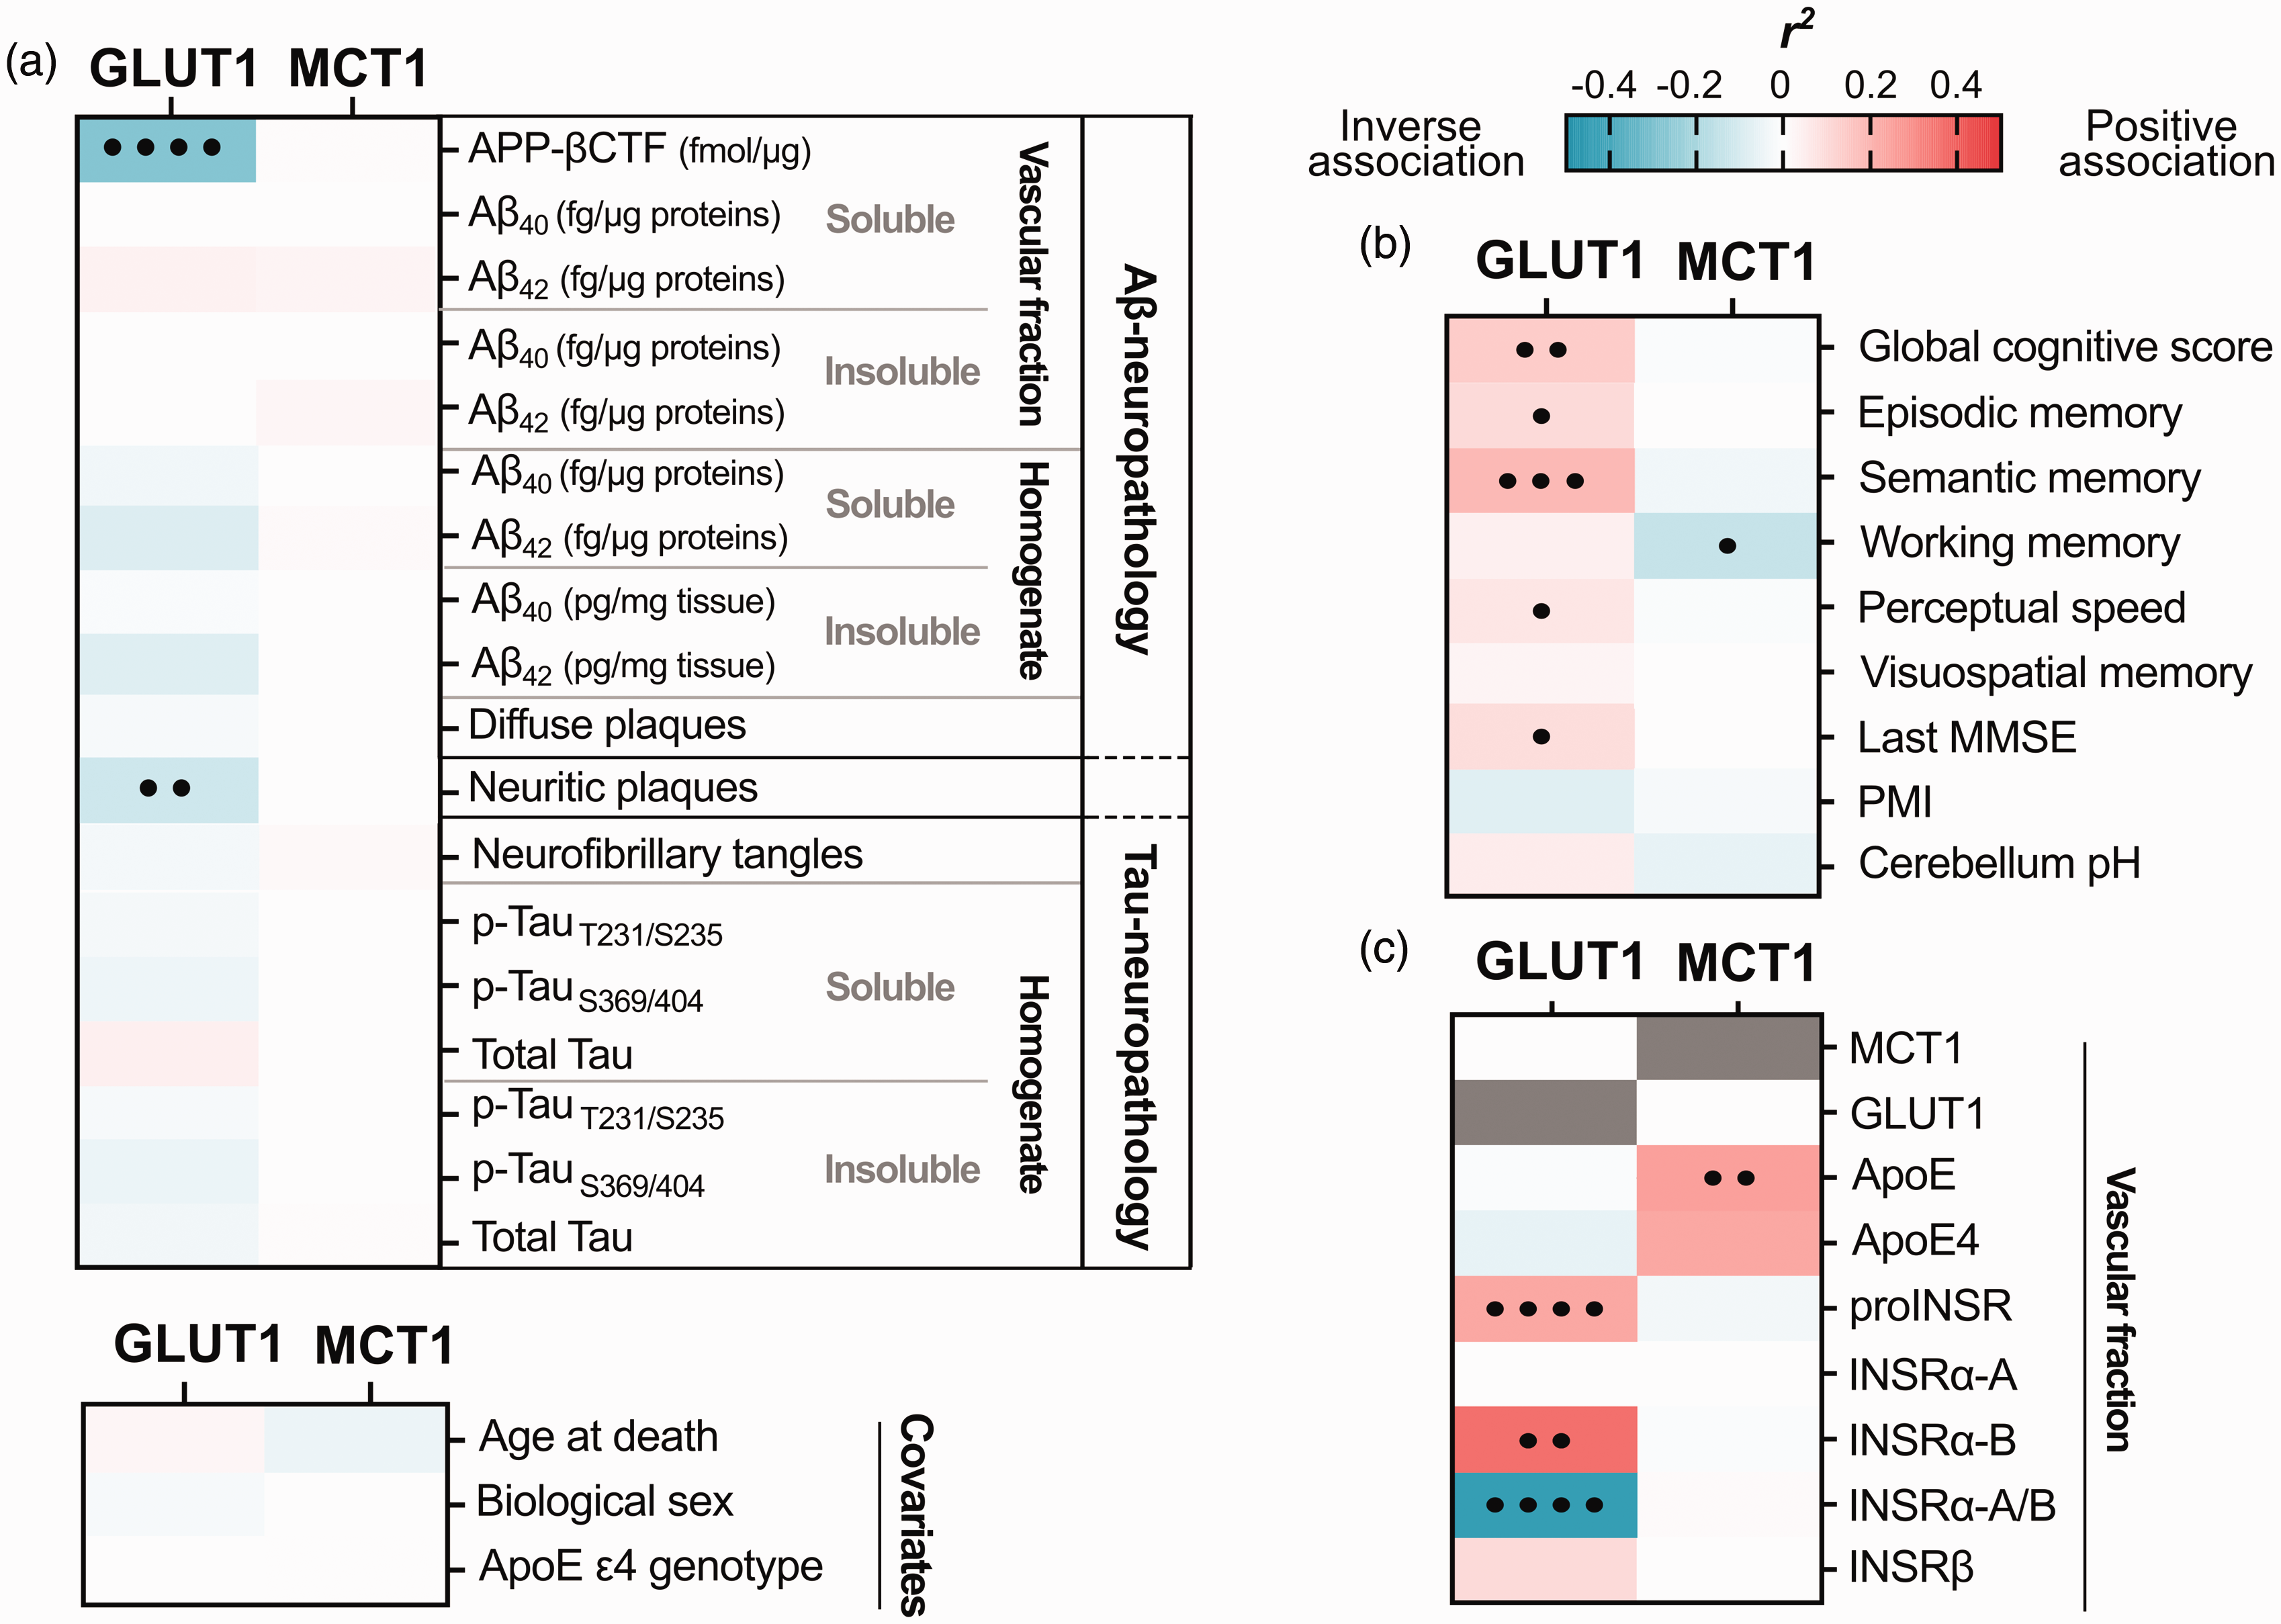
Linear regressions between cerebrovascular levels of GLUT1 or MCT1 and levels of Aβ and tau neuropathologies, other vascular proteins and cognitive scores. (a–c) Cerebrovascular levels of GLUT1 and MCT1 were investigated for their associations with several AD-relevant variables in human parietal cortex. (a) Soluble and insoluble proteins were quantified in TBS-soluble and detergent-insoluble (formic acid) fractions, respectively. APP-βCTF and Aβ concentrations (Aβ-neuropathology) were measured by ELISA and previously published.71,72,82 Levels of phosphorylated-Tau T231/S235 (AT180), S396/404 (AD2), total Tau (Tau-neuropathology) were determined in whole brain homogenates by Western immunoblotting and previously published.81,82 Correlations were also investigated with antemortem cognitive evaluation, post-mortem interval (PMI), cerebellum pH (b); as well as with other proteins quantified in microvessel-enriched fractions of human parietal cortex by Western blot (c). Linear regressions were performed to generate coefficients of determination (r2). Correlations were adjusted for the following covariates: sex, age at death and APOE genotype to generate p-values (•p < 0.05; ••p < 0.01; •••p < 0.001; ••••p < 0.0001). Cells highlighted in pink or blue, respectively, indicate significant positive and negative correlations, with deeper shades following the strength of r2 values, as shown in the scale.
As stated above, ante mortem global cognition was positively correlated with the cerebrovascular content in GLUT1 (r2 = 0.14, p = 0.003), while no such association was established with MCT1 (Figure 4(b)). More specifically, cerebrovascular GLUT1 was positively associated with episodic memory (r2 = 0.10, p = 0.024), semantic memory (r2 = 0.19, p = 0.0007), perceptual speed memory (r2 = 0.07, p = 0.031) and last MMSE (r2 = 0.09, p = 0.026) (Figure 4(b)). Cerebrovascular MCT1 showed no such association although a weak inverse relationship was found with working memory (r2 = −0.14, p = 0.045) (Figure 4(b)).
Furthermore, in cerebrovascular extracts, MCT1 correlated significantly with ApoE levels (r2 = 0.30, p = 0.004), and GLUT1 strongly correlated with the precursor of insulin receptor (proINSR) (r2 = 0.23, p < 0.0001), as well as with isoform B of the α extracellular chain of INSR (INSRα-B) (r2 = 0.36, p = 0.001) (Figure 4(c)). A strong negative association was seen with the ratio of vascular isoforms INSRα-A/B (r2 = −0.44, p = 0.0001), a marker of insulin resistance (Figure 4(c)).72,85 Interestingly, GLUT1 drove the significant positive correlation between MCT1/GLUT1 ratio and INSRα-A/B ratio (r2 = 0.46; adjusted p-value: <.0001) (Suppl. Fig. 2).
Discussion
The BBB plays an essential role in the uptake of energy-providing nutrients from the blood to the brain. By quantifying key BBB transporters in microvessels isolated from the parietal cortex, we observed a reduction in cerebrovascular GLUT1 in AD, which may contribute to impaired glucose utilization. On the other hand, MCT1 levels remained unaltered across study groups, consistent with the preservation of ketone body transport across the BBB in AD.
The results from immunoblotting and immunofluorescence experiments on isolated microvessels emphasize the preferential localization of GLUT1 and MCT1 on the cerebral vasculature,57,63,86 which is compatible with their capacity to transport glucose and ketone bodies, respectively, from the blood into the brain parenchyma. This is in agreement with previous localization studies of GLUT1 or MCT1 based on either the presence of mRNA (by in situ hybridization), protein expression (by immunohistochemical techniques), or both.31,46,61,62,87 Single-cell RNA sequencing datasets support the high expression of both GLUT1 and MCT1 in human and murine brain endothelial cells, but with a low level of MCT1 transcripts also found in astrocytes and oligodendrocytes.47 –49,57 Accordingly, a weaker band corresponding to MCT1 protein was detected by immunoblotting in the parenchymal fraction from human samples.
By specifically investigating cerebral vasculature isolated from frozen brain samples from the ROS, we detected a postmortem loss of GLUT1 in subjects with a clinical diagnosis of AD. Surprisingly, only a few immunoblot studies on GLUT1 in brain tissues from AD patients can be found in the literature. Most studies rather relied on immunohistochemistry, which is an excellent technique for localization but is less reliable for quantification, particularly in neurodegenerative diseases involving widespread cellular loss. Still, previous studies using whole homogenates of the brain cortex,88 –90 qualitative immunostaining of hippocampus, 91 or immunobinding assay of both regions 92 reported lower GLUT1 in AD (reviewed in46,50,52). These studies used cohorts of smaller sample size with different neuropathological diagnostic methods and brain regions.52,88,92 Of note, GLUT1 is expressed at a high level in erythrocytes (up to 10–20% of integral membrane proteins),93,94 and most previous studies used material contaminated by blood components. In contrast, the method used here excludes most erythrocytes during the fractionation process. Overall, despite important differences in methodologies and diagnosis, there is a consistency between the present results and previous literature over a reduction in GLUT1 occurring in the AD cerebrovasculature.
A wealth of PET studies performed in the last decades have established that a reduction in uptake and utilization of glucose by endothelial cells of the brain occurs early in the progression of •AD,9,16,21,95,96 correlating with lower cognitive scores.97,98 Reinforcing this view is the present observation that the reduction in GLUT1 was associated with a decline in cognitive scores. The cause of glucose hypometabolism in AD is not well defined. It is clearly not simply related to circulating levels of glucose, as hyperglycemia and diabetes are rather associated with a higher incidence of AD.67,68,99 A reduction in glucose uptake could obviously be the manifestation of a lower demand by degenerating brain tissue and failing energy use from astrocytes and neurons. 46 Accordingly, GLUT1 transport activity in the neurovascular unit is regulated by neuronal activity.53,54 However, at the time reduced glucose uptake is detected, before the clinical diagnosis of AD, the brain rather consumes more energy, possibly to compensate for synaptic and neuronal neurodegeneration.9,95,98,100,101 A second hypothesis postulates that an abnormal delivery of glucose to the brain, including a dysfunction of GLUT1 per se as explored in this study, is impeding the effective utilization of glucose by cerebral tissue, acting as a contributing factor to neuronal death.32,52,95 There is indeed evidence to support a quantitative role of GLUT1 in the regulation of glucose transport into the brain. Studies with GLUT1-deficient mice have confirmed GLUT1 is essential for proper development and maintenance of the brain microvasculature.56,102 –104 In hemizygous GLUT1-deficient mice, decreases in cerebral glucose uptake and blood flow are observed at 6 months of age, accentuated in mice carrying one APP mutant allele. 103 A quantitative autoradiographic study of 2-deoxyglucose in different regions of the rat brain suggests that the level of local cerebral glucose utilization correlates with GLUT1 density. 105 In sum, whether neuronal activity decreases due to impaired glucose transport, or glucose transport decreases in response to reduced energy demand remains an open question. Still, a reduction in cerebrovascular GLUT1 stands as a plausible upstream pathophysiological mechanism underlying reduced glucose brain uptake and energy crisis in neurons, leading to cognitive decline.
The reduction in cerebrovascular GLUT1 may also be seen from the perspective of the close association between metabolic disorders and AD. Although several postmortem studies show that the AD brain is resistant to insulin,72,106 –110 how this relates to a lower brain glucose metabolism is unclear, since GLUT1 is an insulin-independent transporter.111,112 In the present study, a significant association was observed between INSR and GLUT1 levels. Moreover, while lower levels of cerebrovascular INSRα-B were previously reported in AD, we show here that lower GLUT1 is associated with a higher INSRα-A/B ratio, which is a marker of insulin resistance. A critical knowledge gap thus remains in how peripheral metabolic determinants are linked to failing brain glucose uptake in AD.
If GLUT1 loss plays an upstream deleterious role in glucose uptake and cognition, what would be the cause of such a reduction?
Glut1 mRNA levels have been reported to be unchanged 90 or even higher in AD microvessels,47 –49 so a loss of gene expression is unlikely to be the cause of lower cerebrovascular GLUT1 protein. Still, a low expression of hypoxia-inducible factor 1α, a protein complex which regulates GLUT1 and GLUT3 transcription, has been suggested to lead to GLUT1 reduction in AD.88,113 A recent study suggests that impaired utilization of glucose by the brain might result from Aβ42-induced dysfunction of GLUT1 in microvessels, 114 which is in accordance with the correlation between GLUT1 and both APP-βCTF (BACE1-induced cleavage of APP) and neuritic plaques observed here. In addition, among neuropathological scales, CERAD and Thal scores (plaques) were stronger determinants of GLUT1 cerebrovascular levels than Braak stages (tangles). However, in transgenic mice, induction of Aβ and/or tau pathologies do not consistently lead to lower GLUT1 or reduced D-glucose uptake.22,23,103,115 –121 Yet, several investigations reporting decreased glucose uptake and/or GLUT1 levels in these models, put a strong emphasis on the importance of age in this reduction. In human volunteers, lower FDG-PET glucose signals in the brain were found to correlate with amyloid positivity in dementia and amnestic MCI groups. 122 Finally, there is no evidence so far to suggest that GLUT1 is being cleaved by a protease, such as BACE1, calpain or presenilin in the endothelium. Therefore, the cause for the observed decrease in GLUT1 remains speculative at this point and deserves further investigation.
Cerebrovascular MCT1 levels are unchanged in AD
Another key finding in this study is the absence of reduction in the levels of cerebrovascular MCT1 in persons with AD, contrasting with GLUT1 in the same sample series. MCT are bidirectional, proton-coupled transporters that mediate transport of a diverse spectrum of monocarboxylates including lactate, pyruvate, short-chain-fatty acids and ketone bodies.57 –59,61 While the uptake mechanism of ketone bodies in the brain has not been fully ascertained, possibly involving diffusion, PET and in vitro studies indicate that MCT1 facilitates the transport of ketone bodies through BBB endothelial cells.31,57,61,64,123 –125 Once in the brain, ketone bodies can be used as fuels for ATP production by cells of the CNS. 31 Accumulating PET scan data using 11C-AcAc have confirmed the capacity of ketone bodies to cross the BBB, including studies in volunteers administered exogenous medium chain fatty acids (MCFA).33,35 –39
There is very little prior available knowledge on MCT1 alteration in AD. One study, however, reported lower MCT1 levels in the brains of 15-month-old 3xTg-AD mice compared to mice at a younger age. 121 This study also showed a substantial decrease in BBB GLUT1 along with an adaptive shift to the ketogenic system as an alternative fuel in this model. 121 Other animal studies suggest that prolonged fasting and calorie restriction increase the expression of MCT1.126,127 In humans, changes in postmortem RNA-seq profiles of several genes involved in glycolytic and ketolytic pathways were used to suggest an impairment in AD, 128 but no evidence of altered MCT1-mediated transport of ketone bodies into the brain has been found. By contrast,11C-AcAc PET data from studies totaling hundreds of volunteers provide evidence of spared ketone bodies uptake in AD or MCI, along with lower FDG uptake in the same individuals.31,33,36,39 Two older arteriovenous studies show a deficit in brain uptake of glucose but not of ketones in sporadic or familial AD.129,130 Based on these observations, to circumvent glucose defects observed in the early stages of AD, ketone bodies, such as AcAc, β-hydroxybutyrate or ketogenic compounds, such as MCFA, are being investigated as alternative energy sources for the starving brain.31,64,131 The contribution of decreased glucose availability and brain metabolism to AD does not rule out the opposite effect. In other words, neurodegenerative processes in AD could reduce brain glucose metabolism due to reduced synaptic functionality and, consequently, decrease energy requirements, thus completing a vicious circle. However, from a therapeutic standpoint, the potential use of ketone bodies as an alternative fuel for the brain is supported by the herein reported absence of reduction in cerebrovascular MCT1.
Supplemental Material
sj-pdf-1-jcb-10.1177_0271678X241237484 - Supplemental material for Lower GLUT1 and unchanged MCT1 in Alzheimer’s disease cerebrovasculature
Supplemental material, sj-pdf-1-jcb-10.1177_0271678X241237484 for Lower GLUT1 and unchanged MCT1 in Alzheimer’s disease cerebrovasculature by Manon Leclerc, Cyntia Tremblay, Philippe Bourassa, Julie A Schneider, David A Bennett and Frédéric Calon in Journal of Cerebral Blood Flow & Metabolism
Footnotes
Funding
The author(s) disclosed receipt of the following financial support for the research, authorship, and/or publication of this article: This work was supported by the Canadian Institutes of Health Research (CIHR) to F.C. [grant numbers PJT 168927 and 156054]. The study was supported in part by P30AG10161, P30AG72975 and R01AG15819 (D.A.B). F.C is a Fonds de recherche du Québec-Santé (FRQ-S) research scholar. M.L. was supported by a scholarship from the Fondation du CHU de Québec and a joint scholarship from the FRQ-S. P.B held scholarships from the Fondation du CHU de Québec, a joint scholarship from the FRQ-S and the Alzheimer Society of Canada (ASC), and a scholarship from the CIHR.
Acknowledgements
The authors are thankful to Gregory Klein, from the Rush Alzheimer’s Disease Research Center, for his assistance with data related to our cohort. The authors are indebted to the nuns, priests and brothers from the Catholic clergy involved in the Religious Orders Study.
Declaration of conflicting interests
The author(s) declared no potential conflicts of interest with respect to the research, authorship, and/or publication of this article.
Authors’ contributions
M.L. performed some Western blots and immunofluorescence experiments, performed most data analyses, generated Figures and Tables, and drafted the manuscript. C.T. and P.B. extracted microvessels, made initial Westerns blots, and immunofluorescence experiments with human samples. J.S and D.B. provided human samples and data from the ROS, as well as obtaining funding and supervision of ROS and critical read of the manuscript. F.C. obtained funding, designed the project, and wrote the manuscript.
Supplementary material
Supplemental material for this article is available online.
Abbreviations
References
Supplementary Material
Please find the following supplemental material available below.
For Open Access articles published under a Creative Commons License, all supplemental material carries the same license as the article it is associated with.
For non-Open Access articles published, all supplemental material carries a non-exclusive license, and permission requests for re-use of supplemental material or any part of supplemental material shall be sent directly to the copyright owner as specified in the copyright notice associated with the article.