
Abstract
At this time, the pathophysiology of macrophage involvement and their role in stroke progression are poorly understood. Recently, T2- and T2*-weighted magnetic resonance imaging (MRI), after intravenous administration of iron-oxide particles, have been used to understand the inflammatory cascade. Earlier studies report that image enhancement after stroke is from iron-laden macrophages; however, they do not account for potential blood-brain barrier disruption and nonspecific contrast enhancement. In this study, spontaneously hypertensive rats were preloaded with Feridex 7 days before stroke, permitting the labeling of bone-marrow-derived macrophages. Three-dimensional gradient-echo imaging showed average signal decreases of 13% to 23% in preloaded animals, concentrated on the lesion periphery and reaching a maximum on days 2 to 4 after stroke. Immunohistochemistry showed ED-2+, PB+, MHC-II+ and TNF-α+ perivascular macrophages (PVM), meningeal macrophages (MM), and choroid plexus macrophages (CPM). ED-1+ and IBA+ tissue macrophages and/or activated microglia were located throughout the lesion, but were PB−. These findings indicate the following: (1) Feridex preloading permits tracking of the central nervous system (CNS)-resident macrophages (PVM, MM, and CPM) and (2) CNS-resident macrophages likely play an integral role in the inflammatory cascade through antigen presentation and expression of proinflammatory cytokines. Further refinement of this method should permit noninvasive monitoring of inflammation and potential evaluation of antiinflammatory therapies in preclinical models of stroke.
Introduction
Ischemia-reperfusion (I-R) triggers the production of inflammatory cytokines, resulting in an increased expression of cellular adhesion molecules, microglia activation, and leukocyte infiltration (Wang et al, 2007). Although microglia play an integral role in the hyperacute time frame (minutes), macrophages are recruited heavily in the subacute to chronic phase of stroke (days) (Flaris et al, 1993; Hallenbeck et al, 2005; Kochanek and Hallenbeck, 1992). The importance of macrophage activity to overall stroke progression, from the hyperacute phase to the chronic phase, has largely been underappreciated. Recently, it has been suggested that they may play a larger role in the initiation and continuation of the inflammatory cascade (Becher et al, 2006; Greter et al, 2005).
Macrophages of the brain may be divided into two major subtypes, namely tissue macrophages and central nervous system (CNS)-resident macrophages (Lassmann et al, 1993; McMenamin, 1999). Tissue macrophages are derived from activated microglia that have become phagocytic. The CNS-resident macrophages include perivascular macrophages (PVM), meningeal macrophages (MM), and macrophages within the choroid plexus (CPM). Given their strategic location within the CNS, these macrophages (PVM, MM, and CPM) may be considered as the ‘gatekeepers’ of the brain. It has been speculated that PVM and MM may serve as antigen-presenting cells, expressing a major histocompatibility complex (MHC) class II and mediating the immune response through an interaction with T cells (Angelov et al, 1998; Becher et al, 2006; Hickey and Kimura, 1988; Polfliet et al, 2002). They have also been reported to express proinflammatory cytokines, suggesting a direct involvement in the progression of disease (Bauer et al, 1996; Becher et al, 2006; Lehrmann et al, 1998). Given this duality, understanding the role(s) of CNS-resident macrophages in stroke is vital.
The development of iron-oxide contrast agents, such as superparamagnetic iron oxides (SPIOs, size 60 to 150 nm) and ultrasmall paramagnetic iron oxides (USPIOs, size 10 to 40 nm), prompted an interest in tracking inflammation through macrophage activity (Thorek et al, 2006; Wang et al, 2001; Weissleder et al, 1990). SPIOs and USPIOs may be internalized by macrophages through receptor-mediated endocytosis (SR-A types I/II) or phagocytosis (Raynal et al, 2004), making them visible on
In this study, we preloaded SHR (spontaneously hypertensive) rats with the SPIO Feridex (Bayer HealthCare Pharmaceuticals, Wayne, NJ, USA) 7 days before transient middle cerebral artery occlusion (tMCAO) (Figure 1). We hypothesize that this will permit the iron labeling of bone-marrow-derived macrophages and the imaging of their activity after tMCAO. We also hypothesize that this particular population of macrophages, termed ‘CNS-resident macrophages,’ is essential for the initiation and maintenance of the inflammatory response through antigen presentation and cytokine expression. Although this is an accepted concept in experimental and clinical multiple sclerosis, it is new to stroke and has yet to be investigated thoroughly. The results presented herein provide a basis for potential investigation of antiinflammatory therapies in preclinical models of stroke.
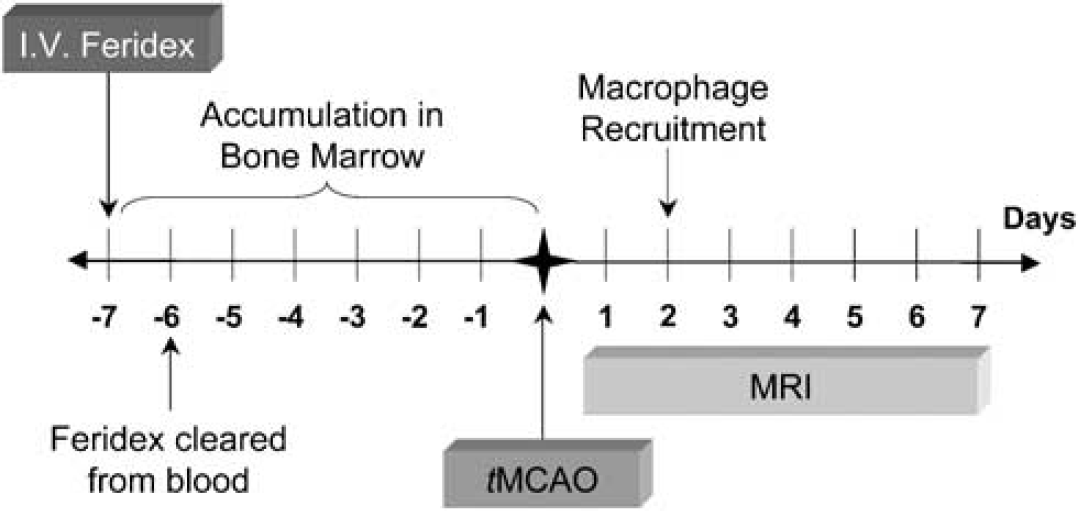
Hypothesized method of Feridex accumulation with 7-day preloading. Feridex has a blood half-life of 5 to 6h, the majority of which is cleared by the reticuloendothelial system (RES). The remainder accumulates in the bone marrow before ischemic insult. After ischemia–reperfusion (I–R), these iron-laden macrophages are recruited to the stroke region. Using noninvasive magnetic resonance imaging (MRI), their involvement in the acute and subacute/chronic phase of the inflammatory cascade may be monitored. iv, intravenous; tMCAO, transient middle cerebral artery occlusion.
Materials and methods
Animal Preparation
This study was approved by the IACUC (Institutional Animal Care and Use Committee) of the National Institute of Neurological Disorders and Stroke, National Institutes of Health (IACUC protocol #1225-05). A total of 16 SHR rats (SHR/NCrl: male, 3 to 4 months, 350 ± 20 g, Charles River Laboratories, White Plains, NY, USA) were anesthetized with isoflurane (5% induction, 2.5% maintenance) delivered in a 2:2:1 mixture of breathing quality air, nitrogen, and oxygen. Twelve animals were subjected to 30 mins of the right middle cerebral artery occlusion, followed by reperfusion (tMCAO) using the intraluminal suture model (Koizumi et al, 1986; Longa et al, 1989). The remaining four animals underwent sham surgery (no suture insertion). The rats were monitored for 2 h after recovery, and were then returned to their cages.
Feridex Administration
The animals were divided into four groups (
Magnetic Resonance Imaging
Imaging was performed using a 7.0T/30 cm imaging spectrometer (Bruker Biospin, Billerica, MA, USA) equipped with ± 45 G/cm self-shielded gradients (Resonance Research, Billerica, MA, USA). Diffusion-weighted echo-planar imaging (DW-EPI),
Inclusion/Exclusion Criteria
Animals (
Immunohistochemistry
After the final magnetic resonance imaging (MRI) on day 7, the rats were killed by means of transcardial perfusion fixation after an overdose of isoflurane anesthesia. Brains were extracted and placed in 4% paraformaldehyde for 1 to 2 days and then transferred overnight to 20% sucrose. They were then snap frozen in isopentane and stored at −73°C. Serial 16-μm-thick sections were collected, beginning at the olfactory bulb (+ 5.0 from the bregma) and extending to the start of the cerebellum (−13.0 from the bregma). For every set of 10 slides, the cryostat was advanced 500 μm.
ED-1, ED-2, and ionized calcium-binding adaptor molecule (IBA) staining were performed for the identification of macrophages and microglia (ED-1: nonspecific macrophage marker (monocytes, macrophages, and activated/phagocytic microglia); ED-2: specific to well-differentiated macrophages; and IBA: specific to activated microglia). The sections were incubated for 10 mins in methanol containing 0.6% hydrogen peroxide, permeabilized with 0.3% Tween (Mallincrodt Baker, Phillipsburg, NJ, USA) for 1h, and blocked with 5% NDS (Jackson Laboratories, West Grove, PA, USA) for 1 h. Any of three primary antibodies were used on consecutive slides, namely ED-1 (1:200, CD68, Abcam, Cambridge, MA, USA), ED-2 (1:100, CD163, AbD Serotec, Raleigh, NC, USA), or IBA (1:150, Iba1, Wako, Richmond, VA, USA). Negative control sections were prepared with mouse IgG (1:1,500, Jackson Laboratories, West Grove, PA, USA) for ED-1 and ED-2, and with rabbit IgG (1:1,500, Jackson Laboratories, West Grove, PA, USA) for IBA. The slides were incubated in a humidity chamber at 4°C overnight. Biotinylated secondary antibodies (donkey antimouse or antirabbit, 1:1,500, Jackson Laboratories, West Grove, PA, USA) were applied to all sections and incubated for 1 h, followed by the Avidin–biotin–peroxidase complex (ABC-Elite Kit, Vector Laboratories, Burlingame, CA, USA) for 1 h. The binding between antibody and antigen was visualized with diaminobenzidine (DAB Kit, Sigma, St Louis, MO) for 2 to 5 mins. All slides were counterstained with nuclear fast red for nuclear identification.
Prussian blue (PB) staining was performed for the identification of iron-labeled cells (PB: specific to ferric iron (Fe3+)). Rehydrated sections were immersed in a stock solution of 10% potassium ferrocyanide for 5 mins, followed by a working solution composed of 3% concentrated hydrochloric acid and 7% potassium ferrocyanide for 30 mins. All slides were counterstained with nuclear fast red for nuclear identification.
ED-1, ED-2, and PB double staining was performed to verify which population(s) of macrophages contain iron. Single sections were initially run through the standard immunohistochemistry protocol, with staining of contiguous sections for ED-1 or ED-2. After the DAB step, PB staining was performed as per protocol, followed by counterstaining with nuclear fast red for nuclear identification.
ED-2, MHC-II, tumor necrosis factor-α (TNF-α), and interleukin-1 (IL-1) expressions were used for a rough assessment of antigen presentation and cytokine expression within the well-differentiated macrophage population. Double immunofluorescence for ED-2:TNF-α, MHC-II:TNF-α, ED-2:IL-1, and MHC-ILIL-1 was performed as follows: incubations with TNF-α (1:100, YC-032, Yanaihara Institute, Shizuoka, Japan) and IL-1 (1:100, AF-501-NA, R&D Systems, Minneapolis, MN, USA) were followed by incubation with fluorescein-conjugated secondary antibodies (1:200, Jackson Laboratories, West Grove, PA, USA); incubations with ED-2 (1:100) and MHC-II (1:250, OX6, Abcam, Cambridge, MA, USA) were followed by incubation with rhodamine-conjugated secondary antibodies (1:200, Jackson Laboratories, West Grove, PA, USA). All slides were mounted using Prolong Antifade (Invitrogen, Carlsbad, CA, USA).
Image Analysis: Magnetic Resonance Imaging
Image reconstruction was carried out using Paravision's Image Processing and Display Software (PV3.0.2, Billerica, MA, USA). Image analysis and parameter map production (apparent diffusion coefficient (ADC),
A separate reader blinded to lesion volume determined Feridex-positive and Feridex-negative regions on 3D-GRE images. Feridex-positive volumes were collected manually, with the equivalent contralateral region serving as a Feridex-negative control. Percentage signal intensity reduction was calculated as: [% SI decrease = (SIFeridex-positive −SIFeridex-negative)/SIFeridex-negative) × 100].
Image Analysis: Immunohistochemistry
For ED-1, ED-2, IBA, and PB staining, photos (20 x) were taken using an Axioplan light microscope (Carl Zeiss Microimaging GmbH, Berlin, Germany) in 10 locations along the entire lesion periphery (interior and exterior). Additional photos were taken in the lateral ventricles (left and right) for assessment of the choroid plexus. These 12 images were acquired for the central portion of the lesion, corresponding to the central three imaging slices (Figure 2). Cell counts were performed using the ImageJ software (BIRSS, NIH, Bethesda, MD, USA) by a single reader blinded to all animal identifiers.
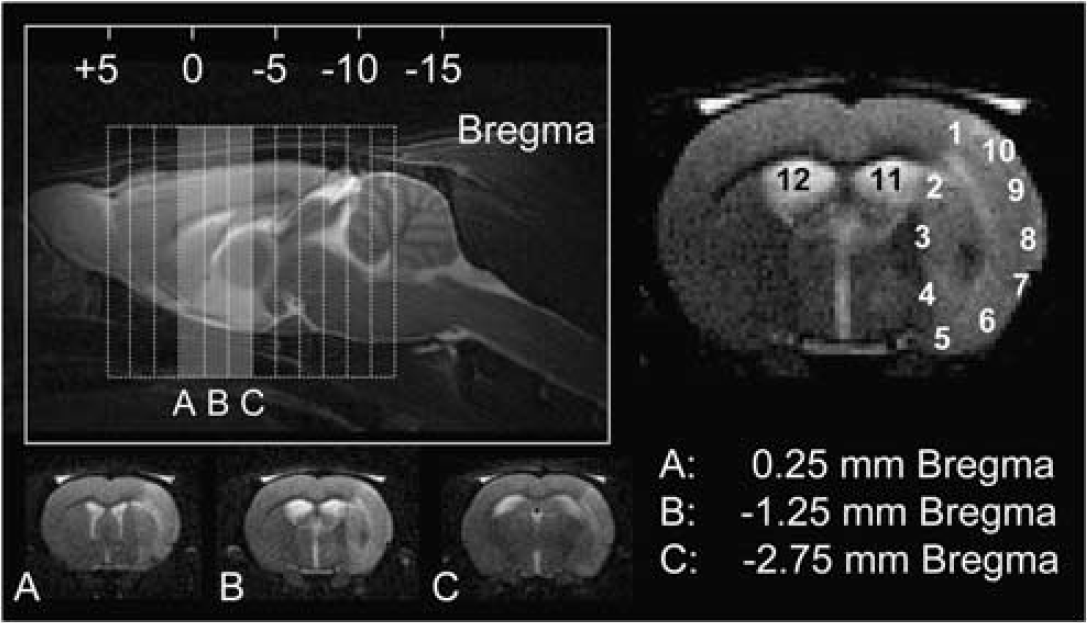
Schematic representation of imaging slice selection and the corresponding immunohistochemistry. Top left: sagittal
For double staining and double immunofluorescence, photos (40 x) were taken in multiple locations along the lesion periphery, with particular attention to perivascular regions and the meninges along the exterior edge. For double immunofluorescence, additional photos were taken in the lateral ventricles (left and right) for assessment of the choroid plexus.
Statistical Analysis
Data are presented as mean (s.d.). Normality was tested using the Shapiro–Wilk and Kolmogorov–Smirnov tests. For the temporal evolution of lesion volume, edema, ADC, and
Results
Lesion Progression After Ischemia–Reperfusion
Interreader variability was 20mm2 (20) (
Feridex Visualization of the Inflammatory Response
Figure 3 shows 3D-GRE images for group 1: Preloaded tMCAO on days 1, 4, and 7 (top row); and for groups 2 to 4: Postloaded tMCAO, Control tMCAO, Preloaded SHAM on day 4. Within the Preloaded tMCAO group, vasodilation and blood-vessel darkening were evident on day 1 GRE images (Figure 3, top left, arrows). Total lesion hypointensity was significantly greater in magnitude than that in the Preloaded SHAM group for day 1 (
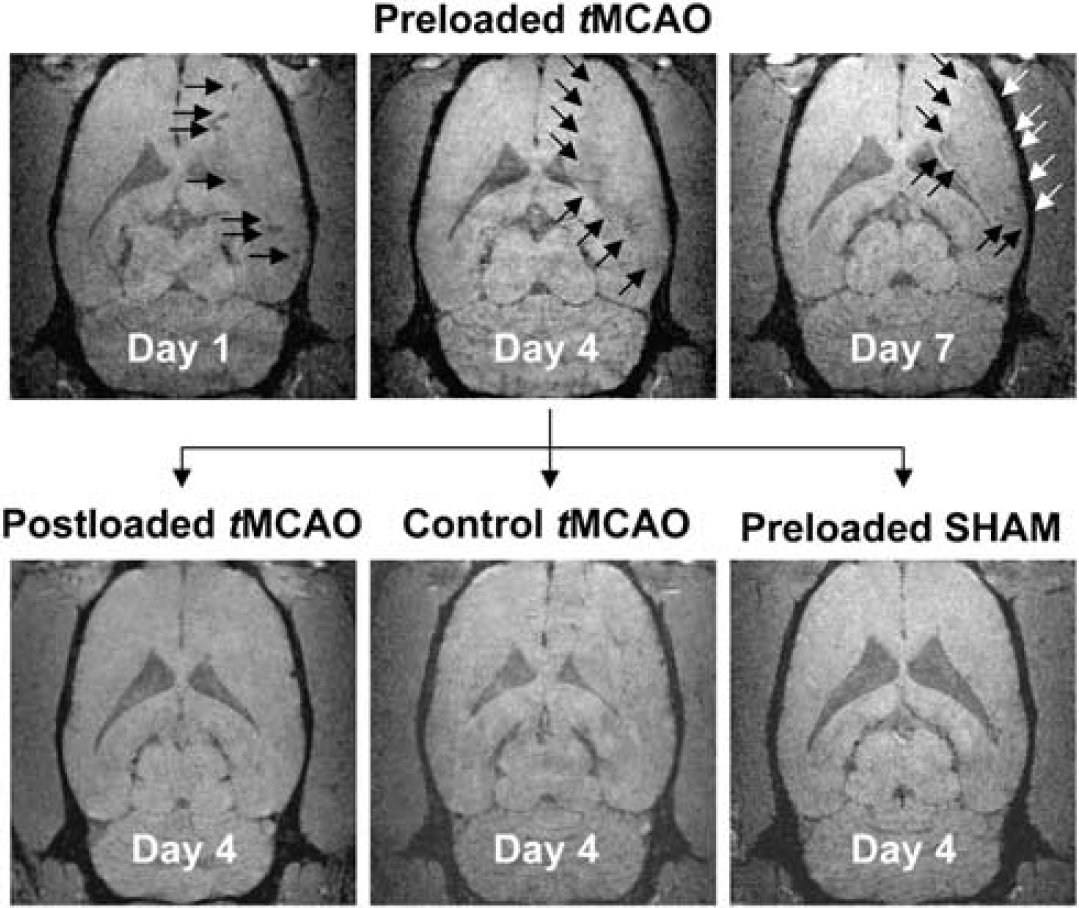
Feridex visualization of the inflammatory response. Day 1, 4, and 7 coronal GRE images for group 1: Preloaded transient middle cerebral artery occlusion (tMCAO) (top row). Vasodilation and blood-vessel darkening were evident on day 1 (top left). Marked hypointensity developed along the lesion periphery, reached a maximum by day 4 (top middle), and remained constant through day 7 (top right). Day 4 coronal GRE images for group 2: Postloaded tMCAO (bottom left), for group 3: Control tMCAO (bottom middle), and for group 4: Preloaded SHAM (bottom right). The GRE signal decrease along the lesion periphery (top middle) was significantly greater in magnitude than that in the Preloaded SHAM group (bottom right). The GRE signal decrease within the lesion core was not statistically different than that in the Preloaded SHAM group (
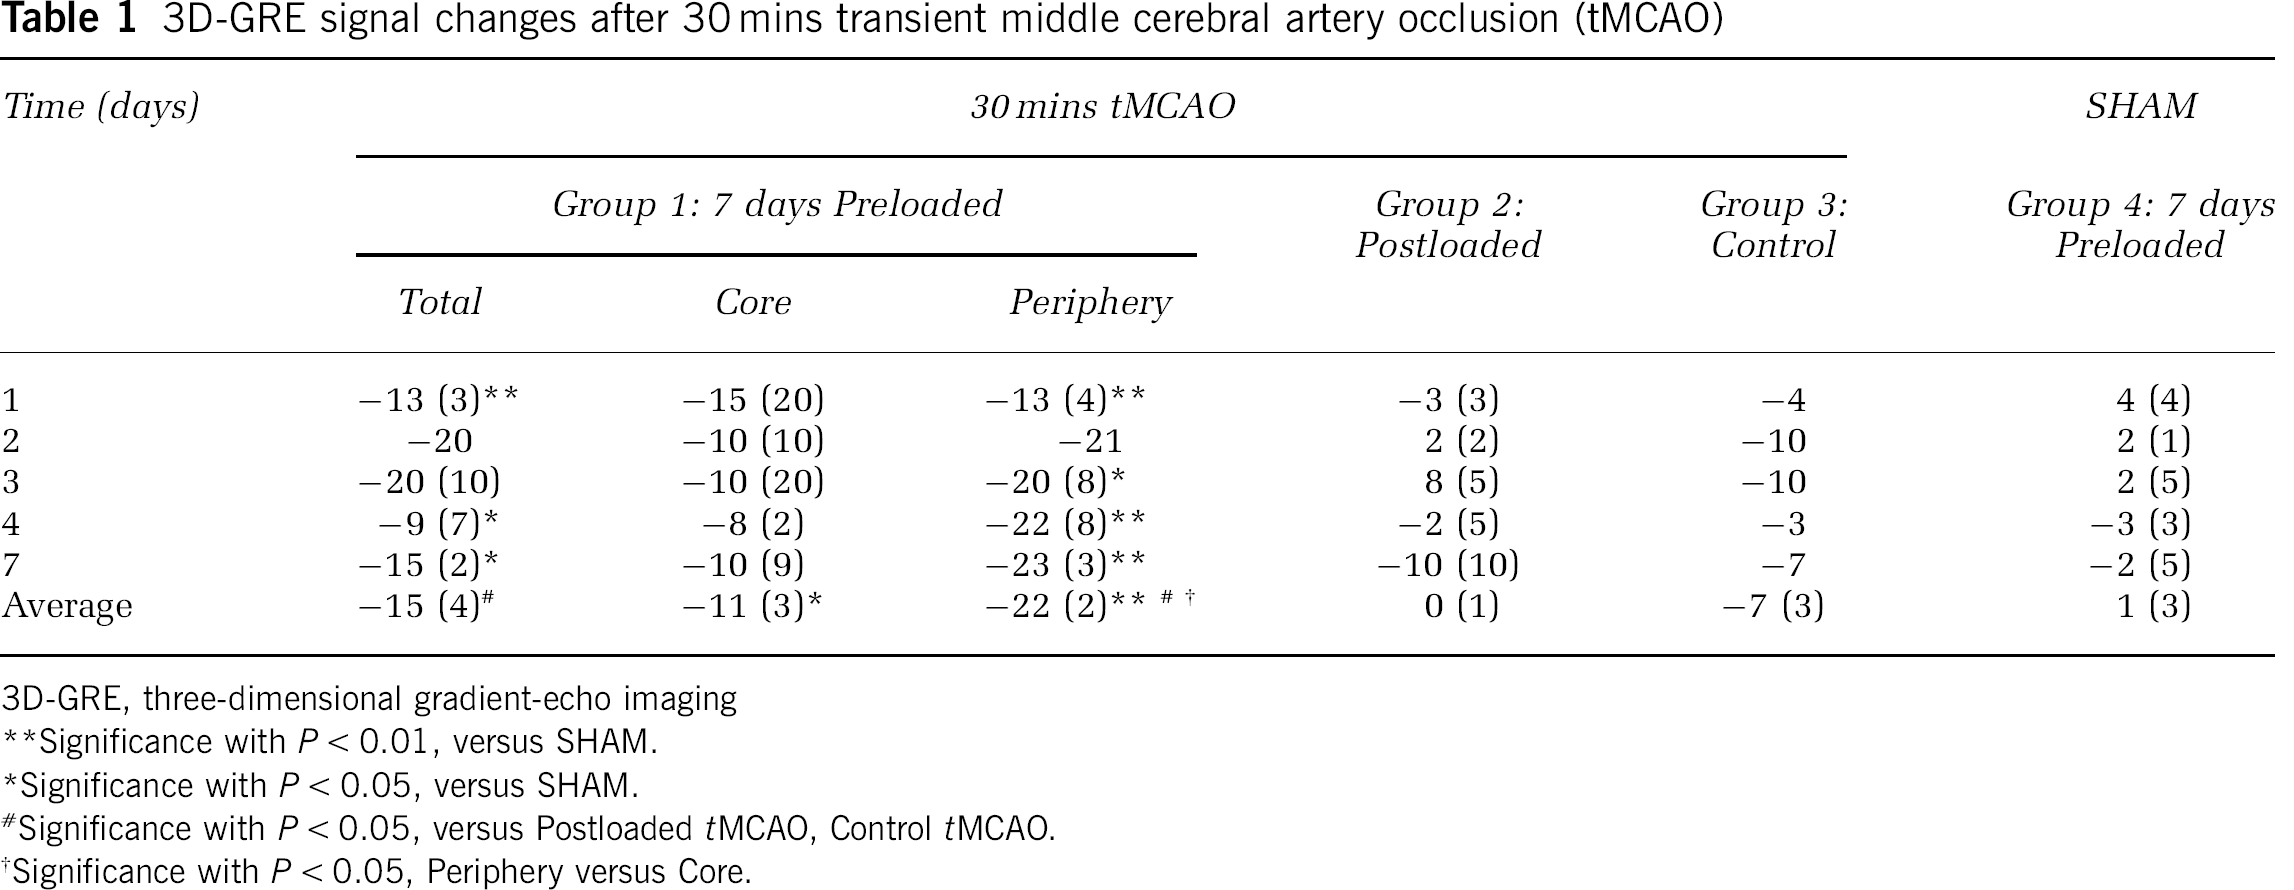
Table 1 provides a detailed, quantitative summary of 3D-GRE signal evolutions for individual groups after tMCAO. For the Preloaded tMCAO group, time-averaged signal changes for total lesion (−15% (4)) and the lesion periphery (−22% (2)) were significantly different from those for Postloaded tMCAO, Control tMCAO, and Preloaded SHAM groups (
3D-GRE signal changes after 30 mins transient middle cerebral artery occlusion (tMCAO)
3D-GRE, three-dimensional gradient-echo imaging
Significance with
Significance with
Significance with
Significance with
ED-1 Correlates with IBA and ED-2 Correlates with Prussian Blue
Figure 4 shows the correlations between ED-1, IBA, ED-2, and PB immunohistochemical staining within the Preloaded tMCAO group. ED-1 and IBA staining were well-correlated on a region-by-region basis (
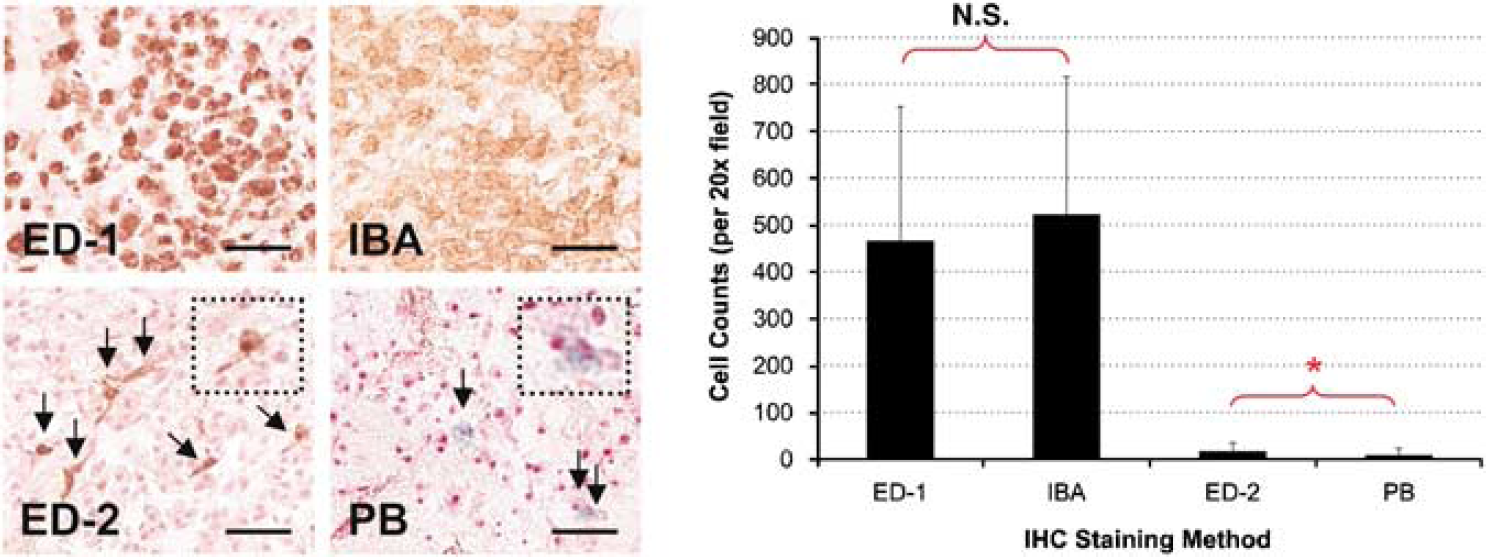
Correlation between ED-1/IBA and ED-2/PB staining. ED-1+ staining visually correlated with ionized calcium-binding adaptor molecule (IBA+) staining and there was no significant difference in cell counts. ED-2+ staining (arrows, inset, brown) visually correlated with Prussian blue (PB+) staining (arrows, inset, blue). However, although the two had the same magnitude of cell counts, ED-2+ was significantly higher than PB+ by an approximate factor of two (
On the inner edge of the peri-infarct area (R1–R5), ED-2+ and PB+ staining were observed primarily in perivascular locations and in a limited quantity in the parenchyma. On the outer edge of the peri-infarct area (R6–R10), ED-2+ and PB+ staining were observed primarily within the meninges. Within the infarct core, ED-2+ and PB+ staining were extremely limited, if not absent. ED-1+ and IBA+ staining were present throughout the infarct. Similar to ED-2+ and PB+ staining, ED-1+ and IBA+ staining were greater in the peri-infarct area than that in the core.
Table 2 provides a detailed, quantitative summary of cell counts for ED-1, IBA, ED-2, and PB immunohistochemical staining for individual groups on day 7 after tMCAO. In Postloaded tMCAO and Control tMCAO groups, although the IBA and ED-1 cell counts were of the same magnitude, the IBA cell counts were significantly higher than the ED-1 cell counts (
Cell counts on a group-by-group basis (per 20 × field)
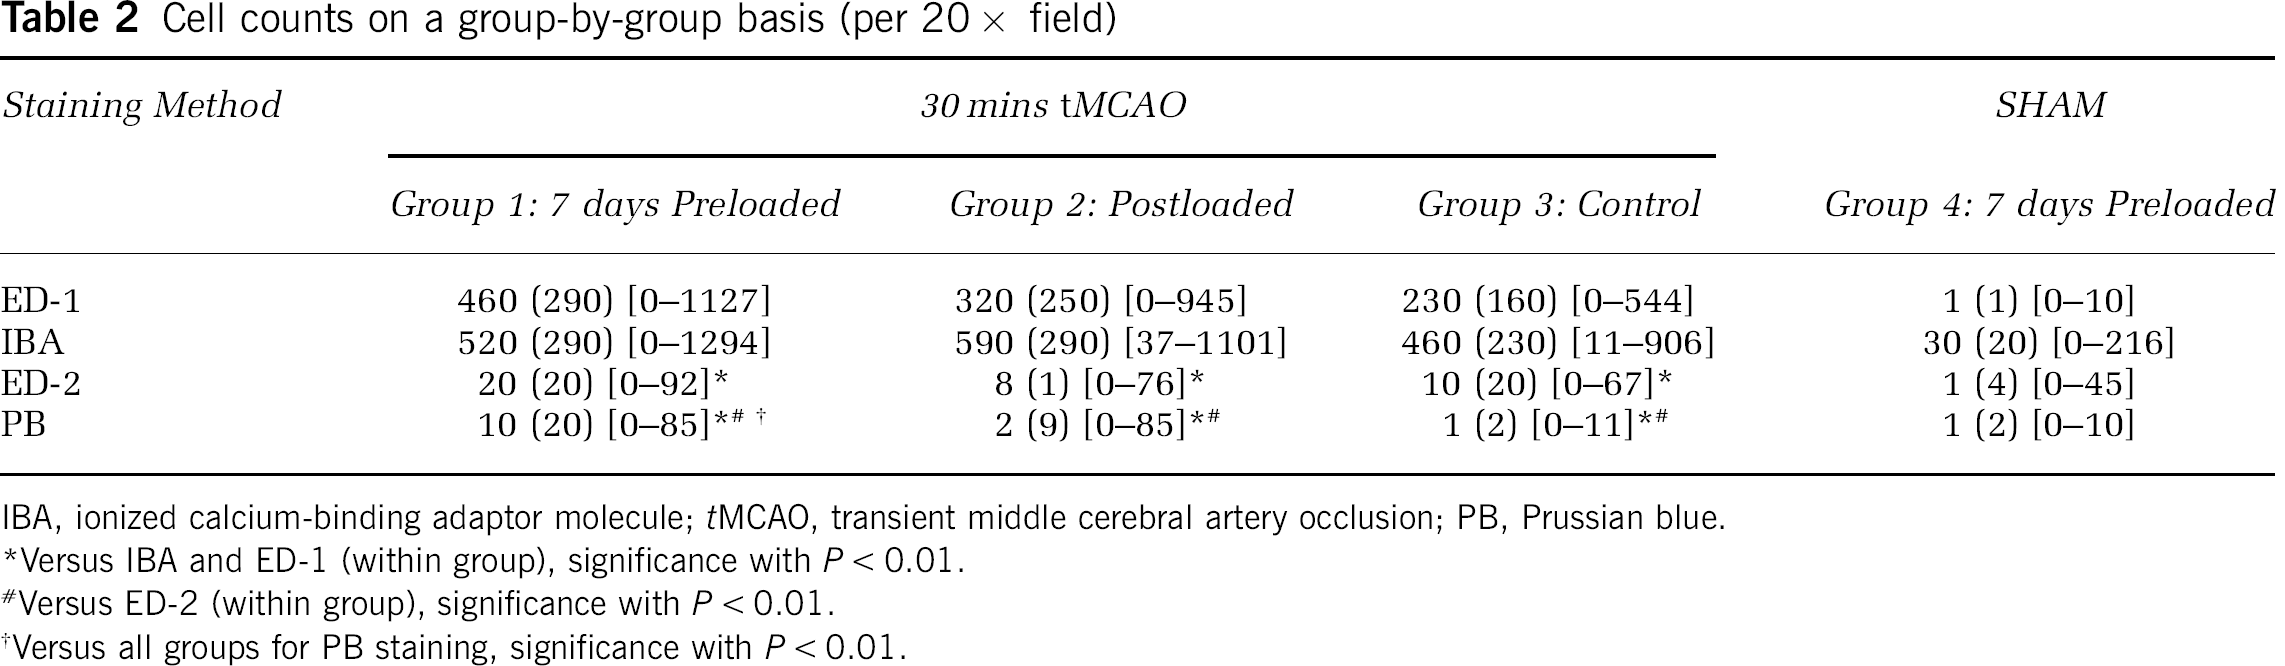
IBA, ionized calcium-binding adaptor molecule;
Versus IBA and ED-1 (within group), significance with
Versus ED-2 (within group), significance with
Versus all groups for PB staining, significance with
Verification of ED-2:PB Double Staining
Figure 5 shows double staining for ED-2:PB (top and middle) and ED1:PB (bottom) for CNS-resident macrophages located in the meninges. ED-2+ and PB+ macrophages were identified (top and middle row), validating the presence of iron in well-differentiated macrophages. Although some of the ED-2+/PB+ macrophages stained brown with an intense blue color (middle right), the majority stained brown and light blue (top). ED-1+ macrophages were PB negative (bottom row), confirming the absence of iron in monocytes/macrophages, and in activated microglia (bottom right).
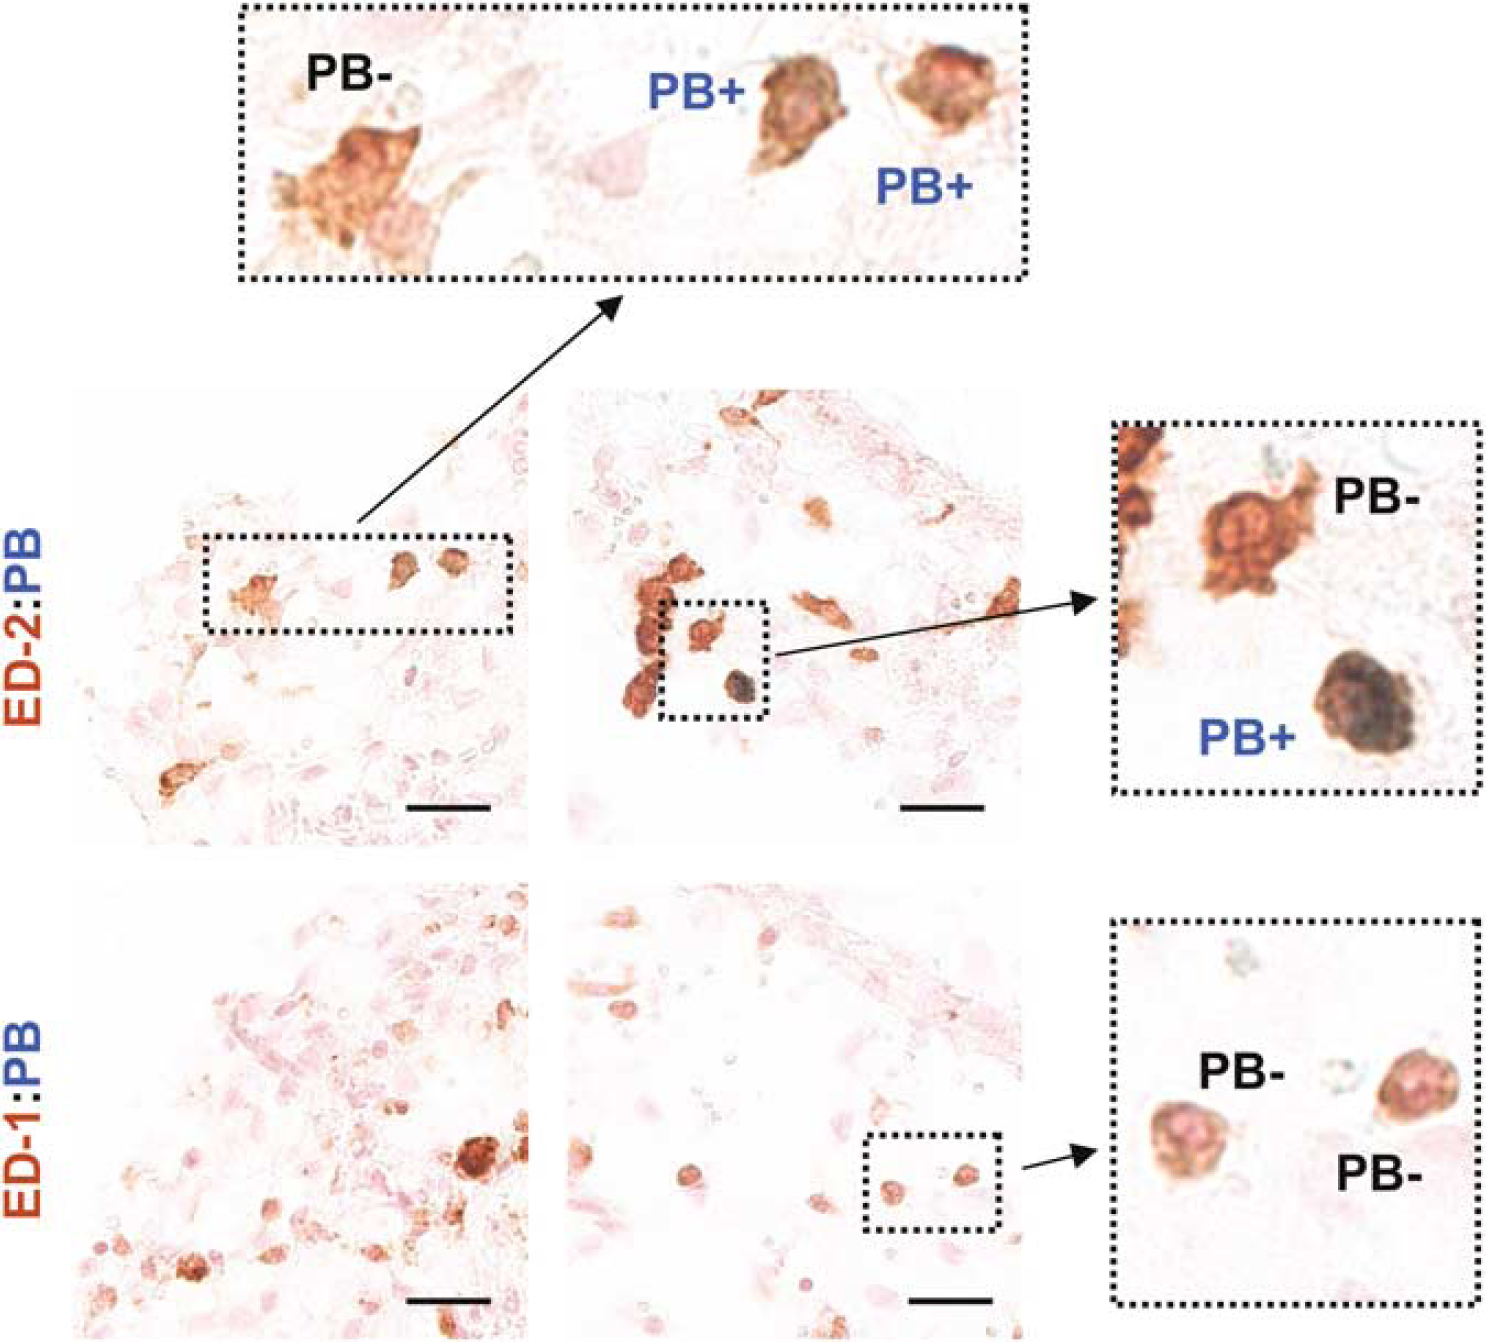
Confirmation of ED-2:PB double staining. ED-2+ and Prussian blue (PB+) macrophages were identified (top, middle row), validating the presence of iron in well-differentiated macrophages. ED-1+ and PB− macrophages were identified (bottom row), confirming the absence of iron in monocytes/macrophages and in activated microglia. Brown = ED-2+ (top, middle) or ED-1+ (bottom), Blue = PB+, background = nuclear fast red counterstain. Colocalized images (40 x), scale bar = 25 μm.
Central Nervous System-Resident Macrophages Express MHC-II and TNF-α
Figure 6 shows the colocalization of ED-2+ − and PB+-stained macrophages and the colocalization of ED-2+ macrophages expressing MHC-II complex and TNF-α. ED-2+ macrophages were isolated to three distinct locations, the meninges, choroid plexus, and perivascular regions. These macrophages stained positive for the MHC-II complex and TNF-α. An additional small number of ED-2−, PB−, and MHC-II+ cells was observed scattered throughout the lesion area (not shown). It is likely that these correspond to ED-1+ − and IBA+-activated microglia. Overall, IL-1 staining was weak, with high background fluorescence and nonspecific staining. For these reasons, IL-1 results were excluded from this study.
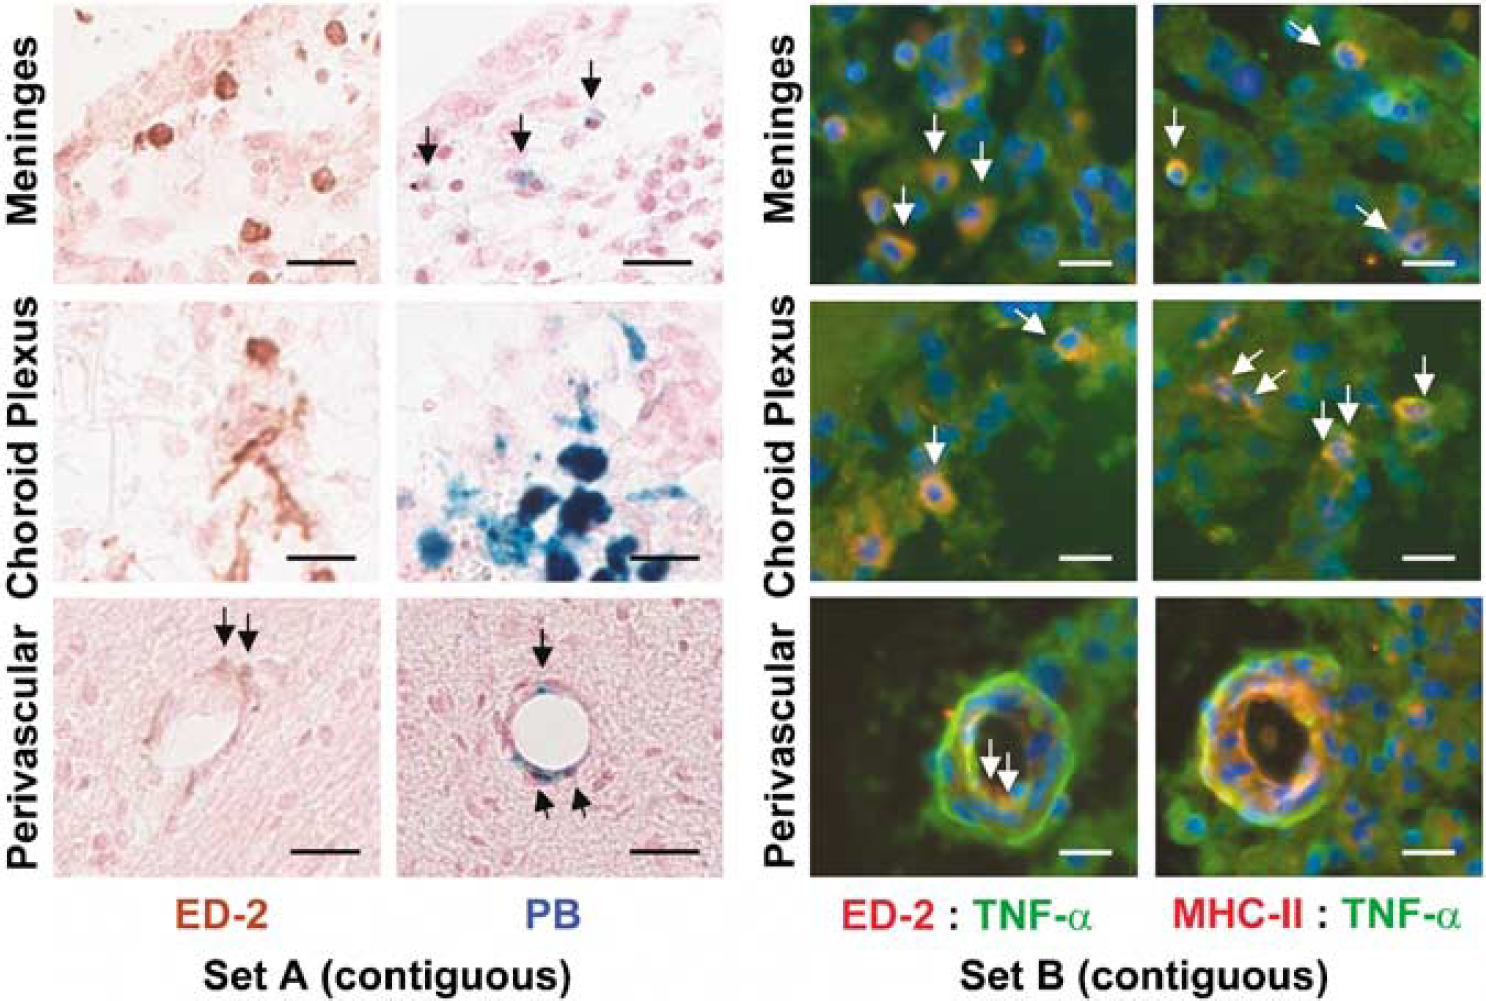
CNS-resident macrophages express major histocompatibility complex class II (MHC-II) complex and tumor necrosis factor-α (TNF-α). Immunohistochemistry (Set A, contiguous sections): ED-2+ and PB+ macrophages (arrows) were identified within the meninges, choroid plexus, and perivascular locations (colocalized images, (20 x), scale bar = 25 μm). Brown = ED-2+, blue = PB+, background = nuclear fast red counterstain. Immunofluorescence (Set B, contiguous sections): These ED-2+ and PB+ macrophages, located at the interface between the blood-brain barrier and the extravascular space, were found to express both MHC-II complex and TNF-α (colocalized images (40 x), scale bar = 25 μm). Blue = DAPI for nuclei. Red = Rhodamine for ED-2/MHC-II. Green = fluorescein for TNF-α.
Discussion
In this study, we monitored CNS-resident macrophages using Feridex preloading and noninvasive MRI after tMCAO. In addition, we verified that these CNS-resident macrophages likely play an integral role in the inflammatory response, using immunohistochemistry and immunofluorescence techniques.
We observed an ~20% signal decrease along the lesion periphery between days 2 and 7 after I–R injury, corresponding to ED-2+, PB+, MHC-II+, and TNF-α+ macrophages. These findings, based on Feridex preloading, are in contrast to earlier work using iron oxides after stroke (Farr et al, 2008; Rausch et al, 2002; Schroeter et al, 2006). This difference may largely be attributed to the time frame of macrophage labeling. According to Raynal et al (2004), a 3-day incubation resulted in a 1.1% to 3.0% uptake of Fe-injected dose. Without adequate time for macrophage labeling, injection of iron oxide after I–R injury merely serves as a negative contrast method for the perfusion status and assessment of the blood-brain barrier permeability, and not as a marker of macrophage activity. The choice of 7-day preloading was based on Feridex blood-pool kinetics and liver/spleen clearance rates (Wang et al, 2001) and earlier testing in traumatic brain injury (Foley et al, 2006), ensuring that the MRI signal is from macrophages of systemic origin. Given the difficulty in isolating bone-marrow-derived macrophages, we do not know the precise labeling efficiency in our study. However, we do know that the signal decrease observed on 3D-GRE images is consistent with the 24% (Vande Berg et al, 1999) and 27.8% (Hundt et al, 2000) signal decreases in MRI studies directly labeling the bone marrow. As a further support, the pattern of signal evolution from the subacute to the chronic time frame after tMCAO mirrors the direct quantification of GFP-labeled bone-marrow-derived macrophages in radiation-induced chimeras after stroke (Tanaka et al, 2003).
There was a small decrease in the GRE signal over time (~3% to 10%) in the Control tMCAO group. This decrease could potentially be from endogenous iron deposition during the process of tissue necrosis, but it is more likely that this signal change is from the formation of edema and the concomitant change in
We found quantitative and qualitative correlations between ED-1 and IBA staining (i.e., activated microglia), as well as between ED-2 and PB staining (i.e., iron-labeled, well-differentiated macrophages), validating the signal changes observed on 3D-GRE images. Additional double staining for ED-2:PB and ED-1:PB verified both the presence of iron within ED-2+ macrophages and the absence of iron in ED-1+ macrophages. These findings are in contrast to earlier work in permanent ischemia, in which there exists an inherent disconnect between the findings on MRI and those on histology/immunohistochemistry (Rausch et al, 2001; Saleh et al, 2004b). We propose that this discordance is a result of two factors. First, iron-oxide administration several hours after permanent ischemia is potentially troublesome. Depending on their size, iron oxides can remain in the blood pool for anywhere from several minutes to several hours. If blood-brain barrier disruption is present, they may extravasate, travel along the Virchow-Robin spaces, and diffuse into the brain (Thorek et al, 2006). This increases the potential for nonspecific accumulation of contrast when smaller iron oxides, such as combidex and mion particles, are being used. Second, ED-1 is a nonspecific marker of macrophage activity (Beelen et al, 1987). ED-1 has been shown to be coincident with OX-42 staining, typically used for the identification of activated microglia (Lassmann et al, 1993). Therefore, it is not surprising that the number of ED-1+ cells far exceeded the number of PB+ cells in these earlier studies.
To circumvent these problems, we used methods known to accurately differentiate between various populations of macrophages and brain microglia (Beelen et al, 1987; Ito et al, 1998; Lassmann et al, 1993). OX-42 staining is more widely used in the identification of microglia; however, we chose to use IBA, a recently identified marker specific to a 17kDa calcium-binding protein expressed only in activated microglia (Ito et al, 1998). ED-1 is a marker that recognizes the rat homolog of human CD68, a 110 kDa cell-surface glycoprotein readily expressed on the membrane surface of monocytes, macrophages, dendritic cells, and microglia. ED-2 is a marker that recognizes the rat homolog of human CD163, a 175 kDa cell-surface glycoprotein expressed only by resident or well-differentiated macrophages, not by monocytes or microglia. Prussian blue staining, most commonly known as Perl's method, targets the release of ferric iron (Fe3+) from binding proteins and the production of an insoluble blue compound. Therefore, if a macrophage contained ferric iron, it is labeled blue.
To reiterate, we found a significant correlation between IBA+ and ED-1+ cells. IBA+ counts were either equivalent to or slightly higher than ED-1+ counts, indicating that the majority of ED-1+ cells were in fact activated microglia. The number of ED-2+ cells in our study was significantly higher than the number of PB+ cells; however, the quantitative results were of similar magnitude and were significantly different from both IBA+ and ED-1+ cell counts. This difference between ED-2+ and PB+ counts is easily explained by the reported turnover of macrophages every 1 to 2 weeks (Whitelaw, 1966). We preloaded animals with Feridex 7 days before I–R injury, and cell counts were not performed until 7 days after I–R injury. This means that on insult, macrophages will begin to turnover, leading to two populations of macrophages—one that is Feridex labeled and a newly recruited nonlabeled population. We do not know the temporal dynamics of Feridex-labeled versus nonlabeled macrophages, and admittedly, further study is warranted to determine the effect of macrophage turnover on MRI signal variability. Investigation into the kinetics of iron uptake by the bone marrow, spleen, lymph organs, and the CNS after Feridex administration, but before insult, as well as at serial time points after insult, would be required. Regardless of this shortcoming, the correlations between ED-1+ and IBA+ macrophages, ED-2+ and PB+ macrophages, and the observed 3D-GRE signal changes confirm our primary hypothesis—Feridex preloading permits labeling of well-differentiated macrophages and monitoring of their activity after tMCAO.
We discovered that these Feridex-labeled macrophages (ED-2+ and PB+) were confined to three distinct locations, including perivascular regions (PVM), the meninges (MM), and the choroid plexus (CPM). These ED-2+ and PB+ macrophages were also MHC-II+ and TNF-α+. Unfortunately, we were unable to draw any conclusions about IL-1. As we used a polyclonal antibody, the IL-1 staining results had an extremely high background, making true IL-1 expression difficult to differentiate from nonspecific IL-1 staining. Despite our lack of conclusive evidence on IL-1 expression, the strategic location of these ED-2+ and PB+ macrophages, and their dual expression of MHC-II+ and TNF-α+, leads us to believe that CNS-resident macrophages play an active role in the continuation of the inflammatory response after tMCAO. The best way to confirm their role in reperfusion injury is to perform a selective depletion before stroke induction. These experiments are extremely difficult even in healthy animals, so it would be more challenging to carry them out in hypertensive animals with stroke. In addition, it would be important to investigate these CNS-resident macrophages, their expression of MHC-II+, and their interaction with T cells. The MHC-II+ expression is not synonymous with, but is required for, T-cell activation. Although this only permits us to state that CNS-resident macrophages expressing MHC-II may mediate T-cell activation and the immune response after tMCAO, earlier work in experimental allergic encephalitis supports this contention (Becher et al, 2006; Greter et al, 2005; McMahon et al, 2005).
Extensive investigation of this specific population of macrophages has been underway since the 1990s in experimental allergic encephalitis and clinical multiple sclerosis. These macrophages actively express MHC-II antigen after administration of interferon-γ and TNF in bone-marrow chimeras (Lassmann et al, 1991). They participate in the pathogenesis of experimental allergic encephalitis through the production and secretion of products, such as proteases (matrix metalloproteinases) and inflammatory cytokines (IL-1, IL-6, and TNF-α), and may interact with leukocytes through intercellular adhesion molecule 1 expression (Bauer et al, 1996). More recently, and probably most importantly, it was shown that their selective depletion results in the suppression of disease (Polfliet et al, 2002). Given that this population of macrophages forms a first line of defense at the interface between the blood and the brain, their manipulation could provide attenuation of reperfusion injury in both the acute and subacute to chronic phases of stroke.
In conclusion, we have shown that preloading with Feridex 7 days before tMCAO permits the selective monitoring of CNS-resident macrophages using 3D-GRE imaging, a unique population of cells that seem to be playing an active rather than a passive role in inflammation and disease progression. Therefore, Feridex preloading provides an attractive avenue for the noninvasive assessment of antiinflammatory therapies in preclinical models of stroke and experimental allergic encephalitis.
Footnotes
Acknowledgements
The authors thank Christina A Rabinak, BS and Narendra C Panapitiya, BS, for their preliminary work with respect to MRI analysis and immunohistochemistry.
The authors declare no conflict of interest.