
Abstract
Critical closing pressure (CCP) is an arterial pressure threshold below which small arterial vessels collapse. Our aim was to compare different methods to estimate CCP in the cerebrovascular circulation using the relationships between transcranial Doppler flow velocity (FV), laser-Doppler flux (LDF), and arterial blood pressure (ABP). A total of 116 experiments in rabbits were analyzed retrospectively. At the end of each recording, cardiac arrest (CA) was induced. Arterial blood pressure in femoral artery, basilar artery FV, cortical blood LDF, intracranial pressure (ICP) was recorded. Critical closing pressure was estimated using linear regression between decreasing mean ABP values, FV, and LDF during CA. In addition, CCP was calculated from FV waveform just before CA. The correlation between CCP evaluated using LDF and FV during CA was 0.98 (P < 0.0001). The correlation between CCP measured during CA and CCP estimated from the transcranial Doppler ultrasonography (TCD) waveform was weaker (R=0.39; P <0.001), with CCP calculated from waveform being significantly greater than CCP from CA (median difference 9 mm Hg; P < 0.003). Critical closing pressures obtained from FV waveform and CA correlated with mean ICP before CA (R = 0.40; P = 0.001). In conclusion strong correlation exists between CCP values obtained by means of FV and LDF during cardiac arrest. However, predictions of CCP using TCD waveform analysis show substantial differences from values of CCP recorded during cardiac arrest.
Keywords
Introduction
Critical closing pressure (CCP) was first described using a mathematical model predicting that small vessels would collapse when the arterial blood pressure (ABP) approached a critical CCP value (Burton, 1951). In the cerebrovascular circulation, this value was postulated to be equal to the sum of intracranial pressure (ICP) and a component proportional to the active tension of vascular smooth muscle (Dewey et al, 1974) as follows:

To predict CCP, ABP should be lowered below the lower limit of autoregulation. A linear relationship between cerebral blood flow and ABP can be then extrapolated to the value of pressure where flow reaches zero. Aaslid (1992) and Panerai et al (2006a, b) proposed a new method to calculate CCP using transcranial Doppler ultrasonography (TCD). The intercept point of a regression line between single pulse pressure plotted along the X axis and the blood flow velocity (FV) in the middle cerebral artery plotted along the Y axis was used for the estimation of CCP. Alternative methods have been suggested using ratios of first harmonics of FV pulse and ABP pulse (Aaslid, 1992; Michel et al, 1997; Czosnyka et al, 1999a, b). These methods are attractive from the clinical point of view because continuous and noninvasive prediction of CCP is possible without the need to decrease ABP.
Measurement of cortical cerebral blood flow using laser-Doppler flowmetry (LDF) has never been evaluated in the context of calculation of CCP. Some similarities and discrepancies between the dynamics of ‘small tubes flow’ (LDF) and ‘big tubes flow’ (TCD) were highlighted in the past (Richards et al, 1995).
In this study, the relationship between transcranial Doppler FV and laser-Doppler flux observed during cardiac arrest in experimental animals has been examined. These values were compared with CCP assessed from the TCD and ABP waveforms just before cardiac arrest adopting the algorithm of Aaslid (1992) and Aaslid et al (2003).
Materials and methods
A retrospective analysis of experiments performed between 1993 and 1997 was carried out from 116 New Zealand white rabbits in accordance with guidelines established by the United Kingdom Animal Act (Scientific Procedures), 1986. All animals were studied under three various protocols. At the end of each protocol, cardiac arrest was induced, and only this part of data was analyzed.
Preparation of Experimental Animals
Rabbits were prepared using the methods described by Nelson et al (1990, 1992). Anesthesia was induced using alphaxalone/alphadolone (3 nmol per kg of body weight) given intravenously and maintained using 1% to 3% halothane in 3:1 nitrous oxide/oxygen. Temperature was monitored rectally and controlled with a warming blanket. The jugular vein was cannulated and a tracheostomy was performed. The rabbits were paralyzed using pancuronium (0.7 nmol/kg per h) and ventilated using a pump, with endtidal CO2 (EtCO2) measured continuously. Halothane was maintained at 1.5%. Polyethylene cannulae were advanced into both femoral arteries, and from one, ABP was recorded using a direct pressure monitor. The second cannula was used to control ABP by hemorrhage or by blood reinfusion. The animals were supported in a sphinx position using a head frame with three-point skull fixation.
A posterior frontal burr hole ~7 mm in diameter was created at the bregma to one side of the midline, and an 8-MHz pulsed ultrasound probe connected to a transcranial Doppler (TCD) ultrasonograph was positioned over the exposed dura and adjusted to insonate the basilar artery (depth from 18 to 22 mm). Maximum flow velocity (FV) waveform was recorded. Two more burr holes of diameter not exceeding 2 mm were made on the other side of the midline. One was used to position a laser-Doppler probe epidurally (cortical blood flow monitor) for the continuous measurement of laser-Doppler flux (LDF) signal, representing cortical microcirculation in the underlying cortex. The second burr hole was used for the measurement of ICP A small hole in the dura was made to insert a subarachnoid ICP microsensor. Example of monitoring of ABP, ICP, FV, and LDF is presented in Figure 1.
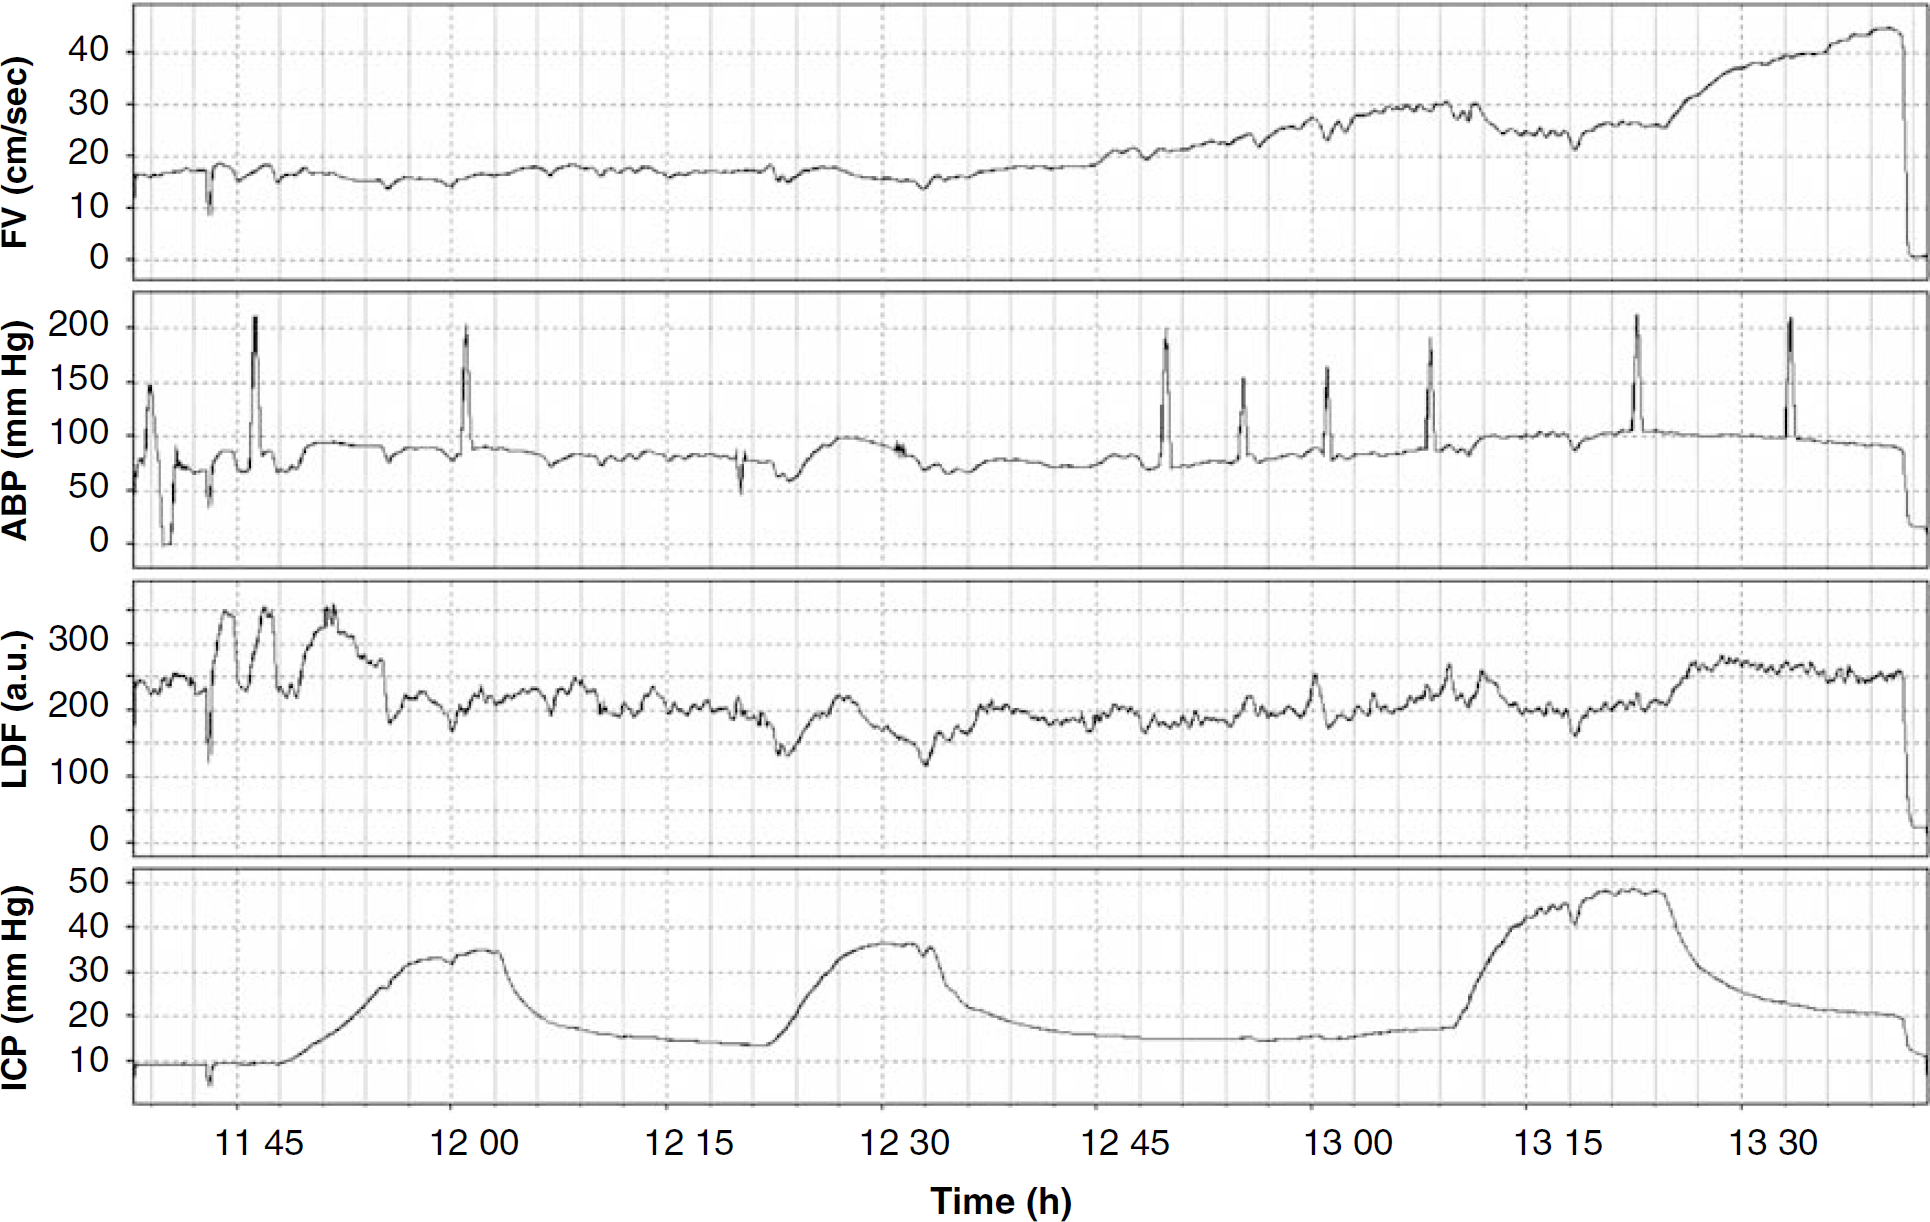
Time plots showing parameters recorded during testing ‘physiological maneuvers’. Protocol included increase in ICP controlled by saline infusion into the lumbar channel (around 1210 hours repeated after 1255 hours at higher level of PaCO2, changed by decrease of respiratory rate. Cardiac arrest was induced at 1315 hours. The variables recorded were ABP, arterial blood pressure; FV, blood flow velocity; ICP, intracranial pressure; LDF, cortical laser-Doppler flux.
Protocols
Three groups were studied. Group I (31 animals) contained simple physiologic maneuvers, such as changes in arterial concentration of CO2 from mild hypocapnia to hypercapnia, pharmacological changes in AP (hypertension induced by dopamine and hypotension induced by trimethophan), or limited increase of ICP by infusion of saline into the lumbar CSF space. Details of experimental protocol were described in earlier works. (Czosnyka et al, 1994, 1996; Richards et al, 1995). Group II (58 animals) contained animals in which gross intracranial hypertension was studied. Intracranial pressure was increased stepwise by increasing rate of lumbar saline infusion, until cerebral perfusion pressure decreased below 20 mm Hg (Harland et al, 1999). In Group III (27 animals), the hemodynamic effects of pharmacological blocking of endothelial nitric oxide synthase were studied (Richards et al, 1997).
At the end of the each experimental protocol, the rabbits were killed by intravenous administration of 600 mg pentobarbitone followed by 5 mL of 10% potassium chloride, but ventilation was maintained. Before, during, and after cardiac arrest, recorded waveforms (ABP, basilar artery FV, cortical blood flux (LDF), and ICP) were analyzed.
Data Acquisition and Analysis
Signals were converted into digital samples using an analog-to-digital converter fitted into an IBM-compatible personal computer. Sampling frequency was set to 150 Hz. Samples were saved on the hard disk using a program designed by Zabolotny et al (1994). Digital signals were then analyzed using our own software for clinical data processing (ICM +; http://www.neurosurg.cam.ac.uk/icmplus).
During cardiac arrest changes in ABP from the baseline to below 30 to 40 mm Hg, we compared changes in LDF and FV using linear regression (see Figure 2). Before comparison, pulse waveform and respiratory waveforms were extracted using a 4-sec moving average filter. Transcranial Doppler ultrasonography-based CCP was calculated as the intercept point of linear regression model between FV and ABP (CCPTCD). Laser-Doppler flowmetry-based CCP was calculated as the intercept point between LDF-LDFzero and ABP (CCPLDF). LDFzero was a biologic zero of LDF assessed as a 1-min moving average of LDF output after cardiac arrest with no TCD flow (Richards et al, 1995).
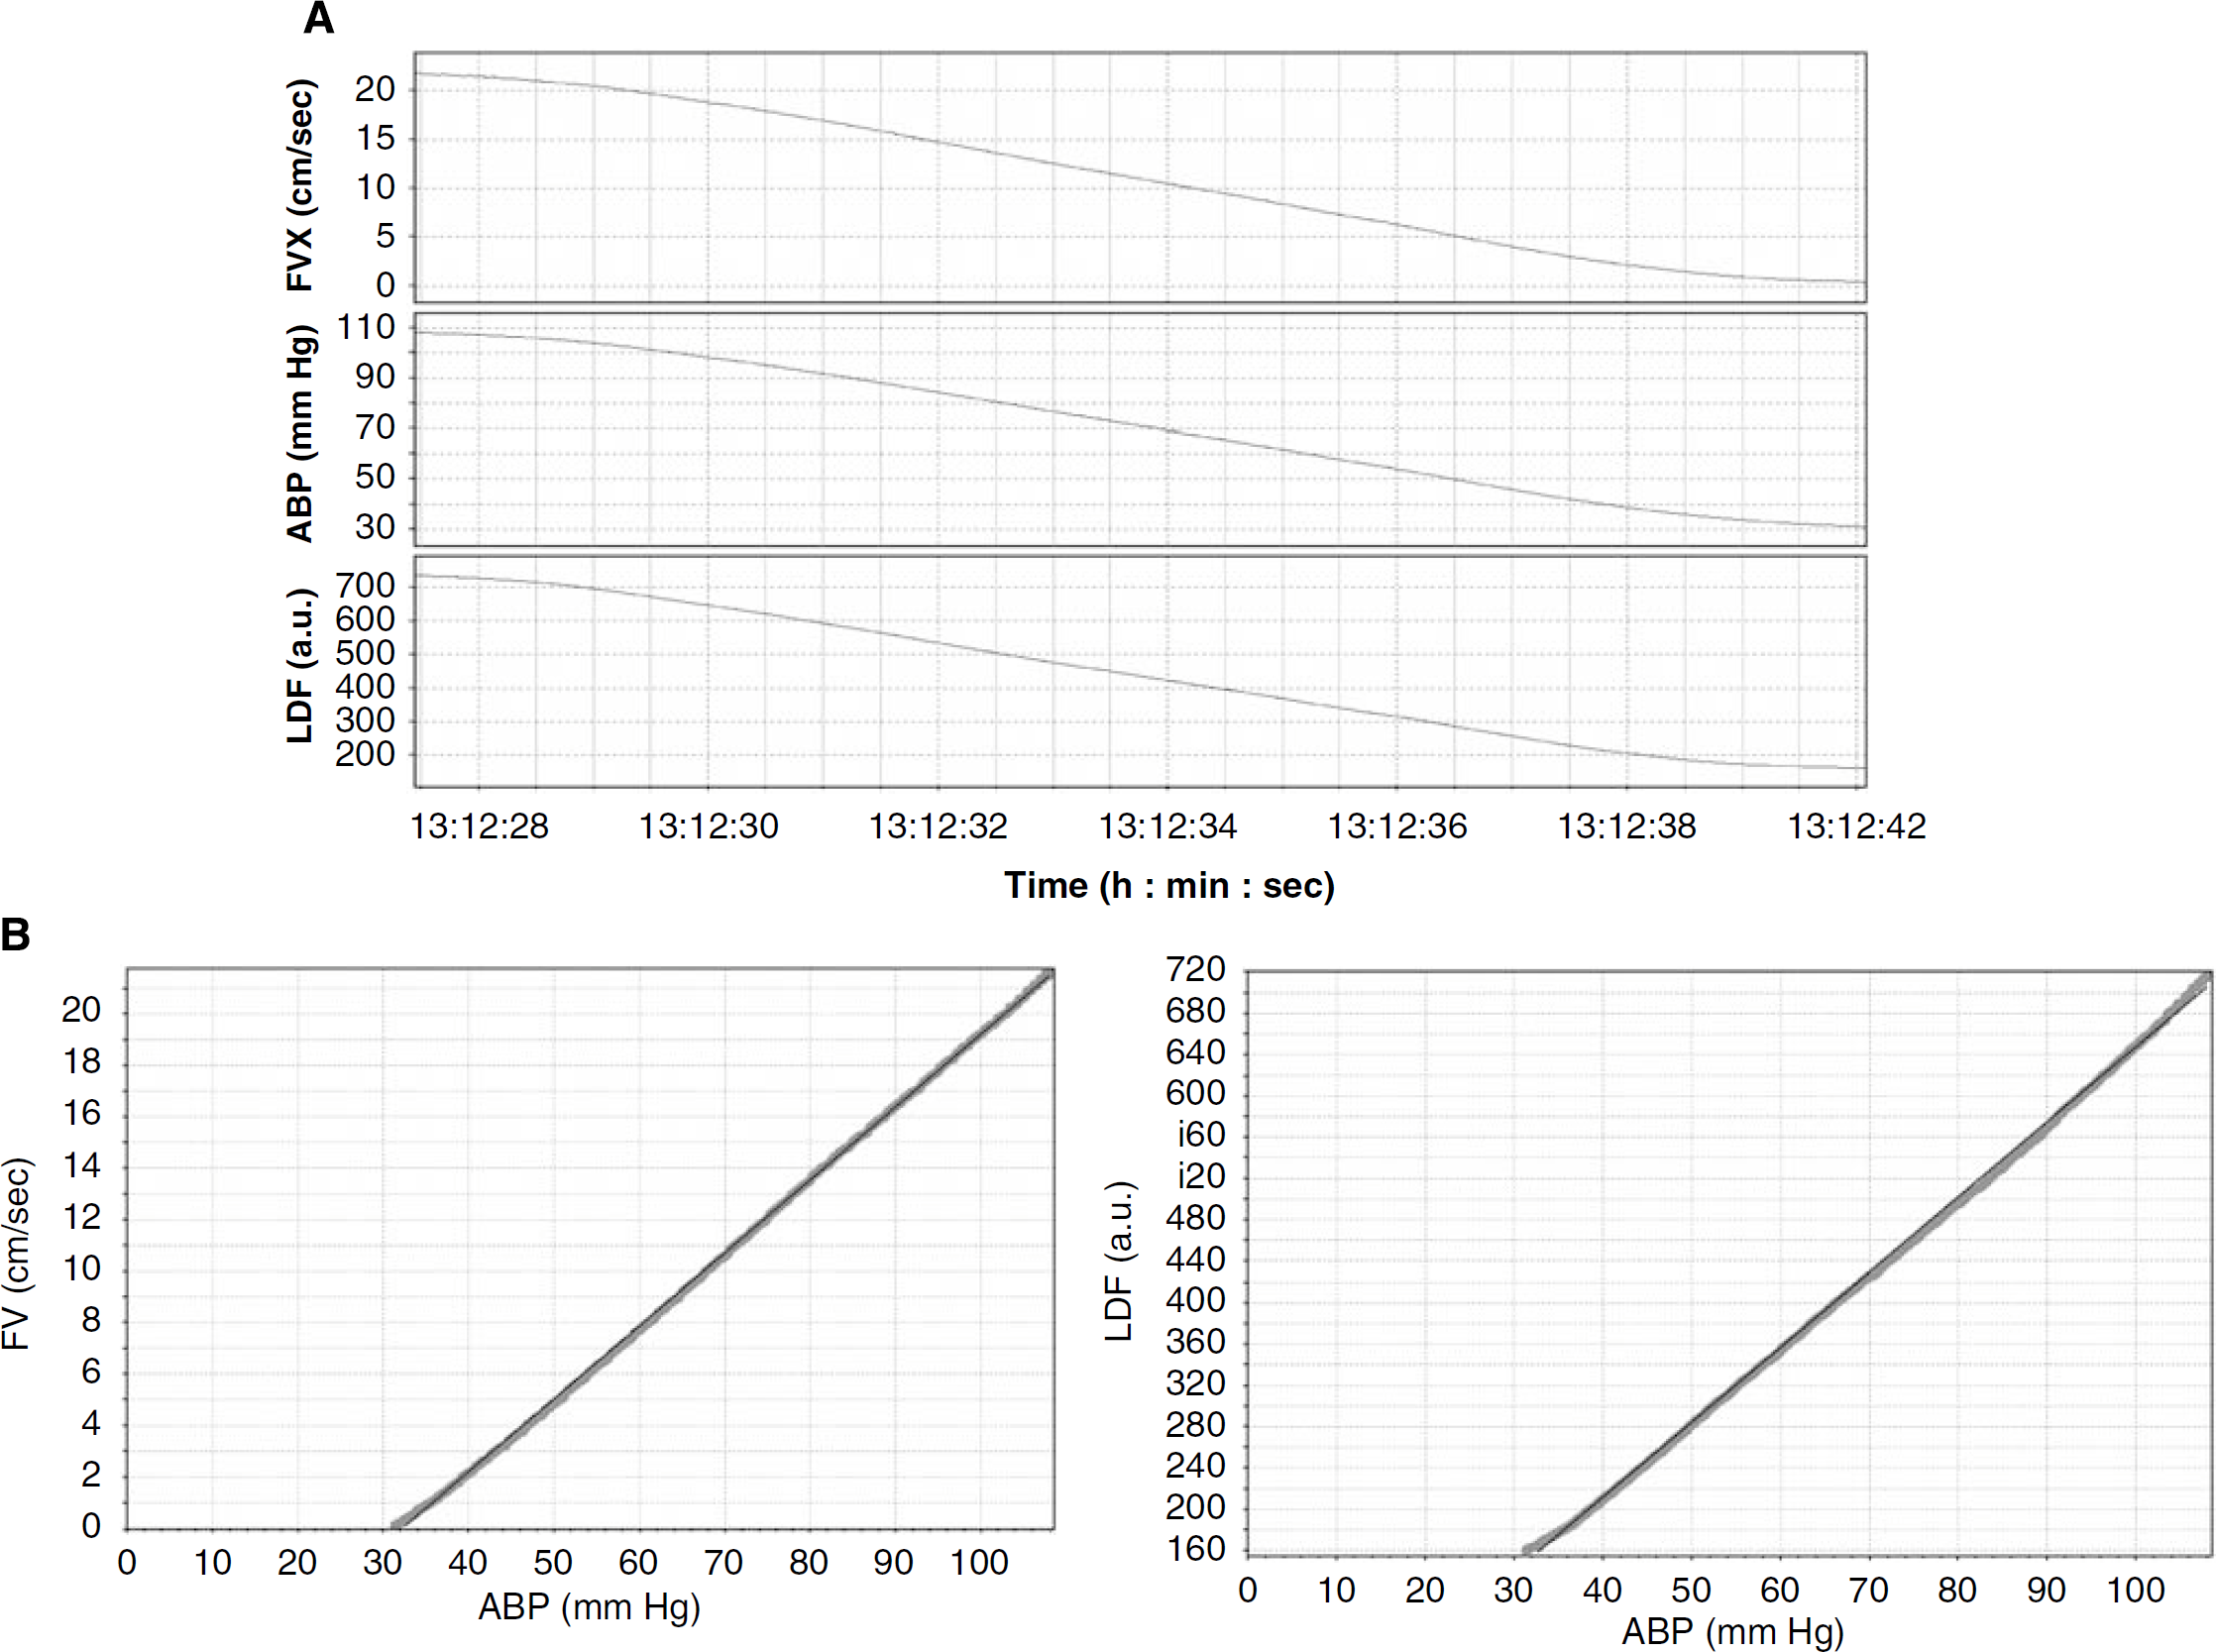
Plots showing parameters recorded during the cardiac arrest. (
Critical closing pressure was also estimated using the TCD waveform stable period just before cardiac arrests from minimum of 6 secs. The first harmonics of TCD and blood pressure were evaluated using Fourier Transform (FV1 and ABP1 relatively). CCPwaveform was calculated as

Sources of Supplies and Equipment
The direct pressure monitor used to record AP was obtained from Gaeltec Ltd. (Dunevegan, UK), and the cortical blood flow monitor was from Moor Instruments (Axminster, UK). The TCD ultrasonograph, model PcDop 842, was manufactured by SciMed (Bristol, UK), and the subarachnoid ICP microsensor by Codman & Shurtleff Inc. (Raynham, MA, USA). The analog-to-digital converter, model DT 2814, was obtained from Data Translation (Marlboro, MA, USA). We used the Statgraphic Plus statistical package from Manugistics (Rockville, MD, USA).
Results
Basic hemodynamic parameters in three groups of animals recorded just before cardiac arrest are presented in Table 1.
Basic parameters recorded just before cardiac arrest and calculated critical closing pressures
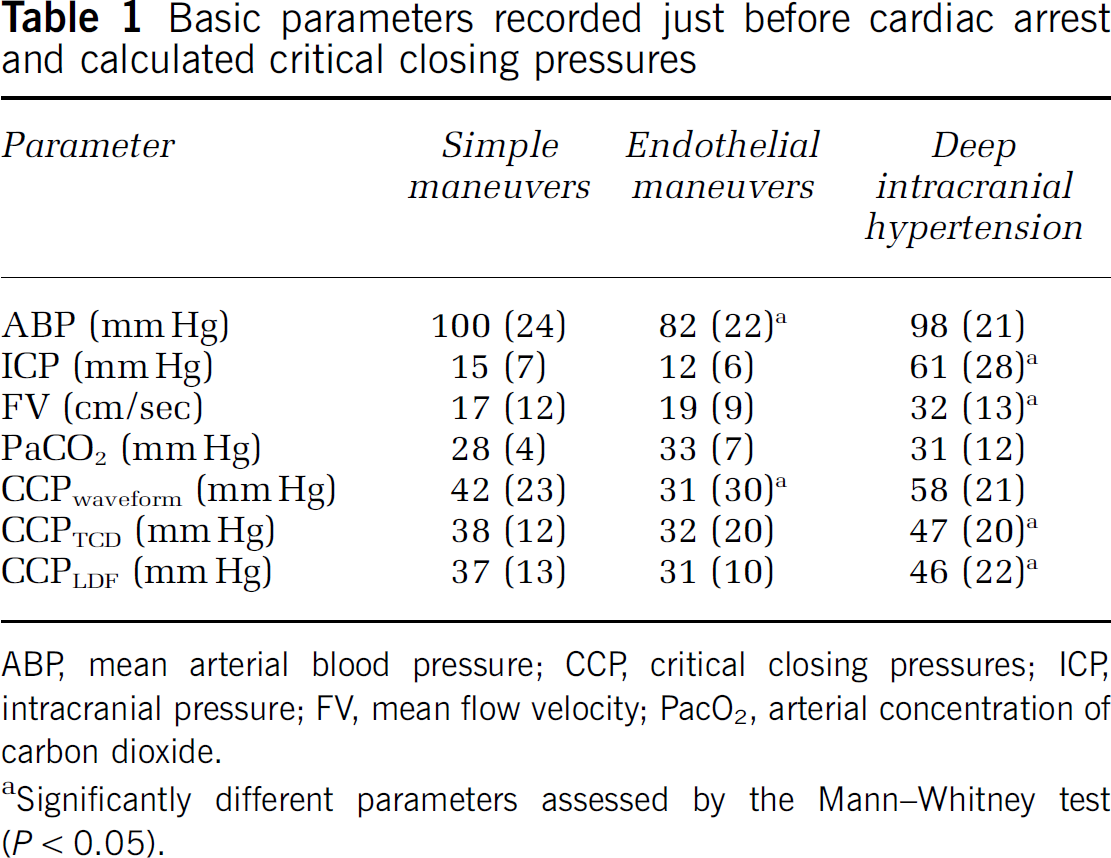
ABP, mean arterial blood pressure; CCP, critical closing pressures; ICP, intracranial pressure; FV, mean flow velocity; PacO2, arterial concentration of carbon dioxide.
Significantly different parameters assessed by the Mann-Whitney test (P <0.05).
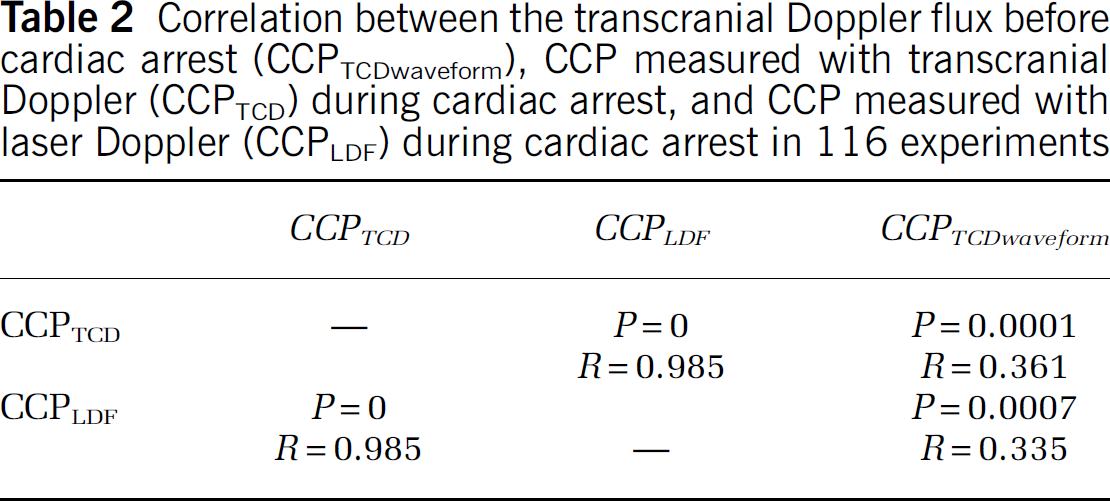
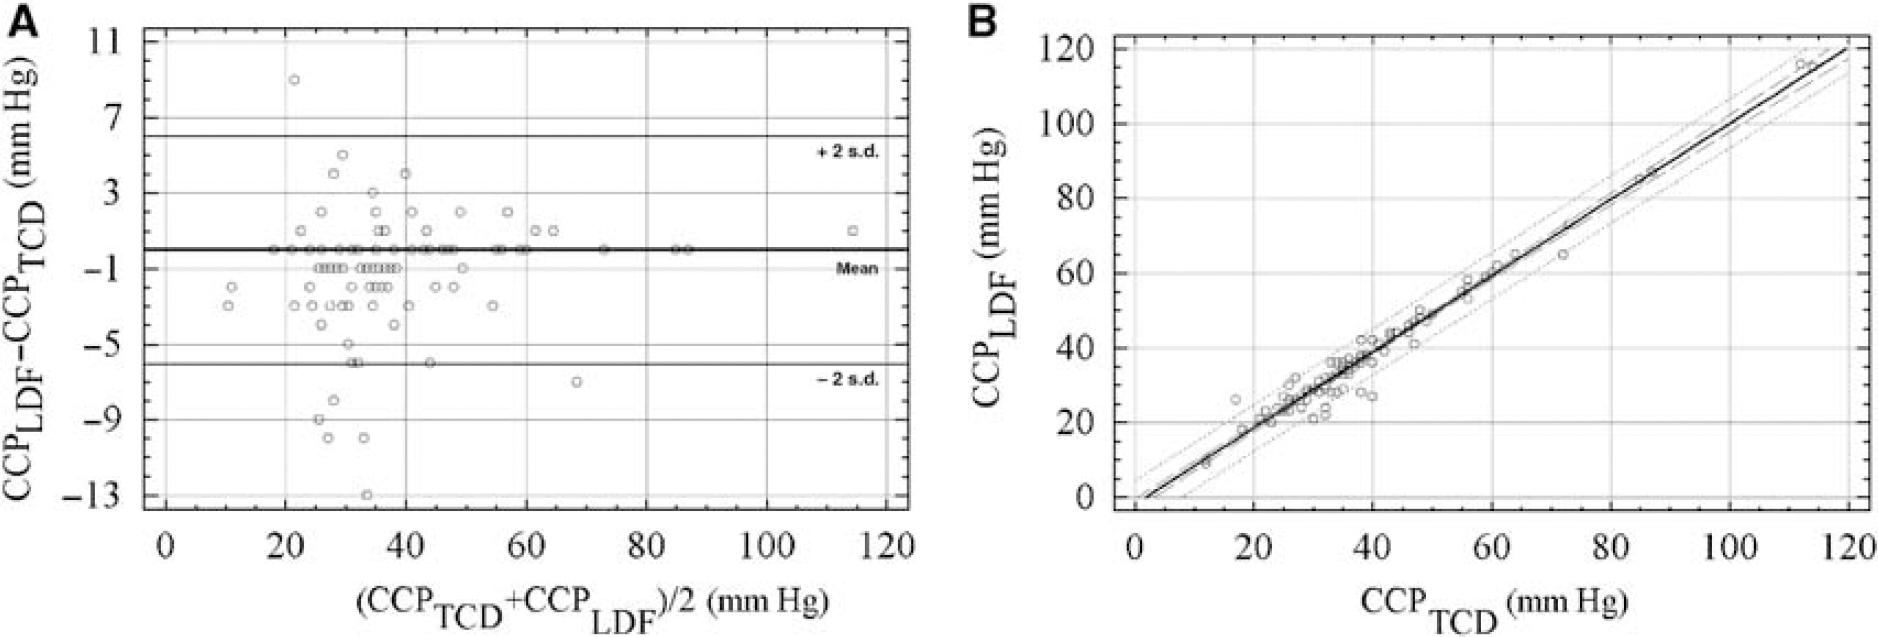
The correlation between CCPTCD and CCPLDF was strong (R = 0.985; P < 0.0001, Table 2). The relationship between CCPTCD and CCPLDF was best described by a linear model (Figure 3). The mean difference between CCP calculated by either transcranial Doppler or LDF during CA in 116 experiments was 0.78 mm Hg. This difference was not statistically significant (P = 0.078).
Correlation between the transcranial Doppler flux before cardiac arrest (CCPTCDwaveform), CCP measured with transcranial Doppler (CCPTCD) during cardiac arrest, and CCP measured with laser Doppler (CCPLDF) during cardiac arrest in 116 experiments
Critical closing pressures measured during cardiac arrest. (
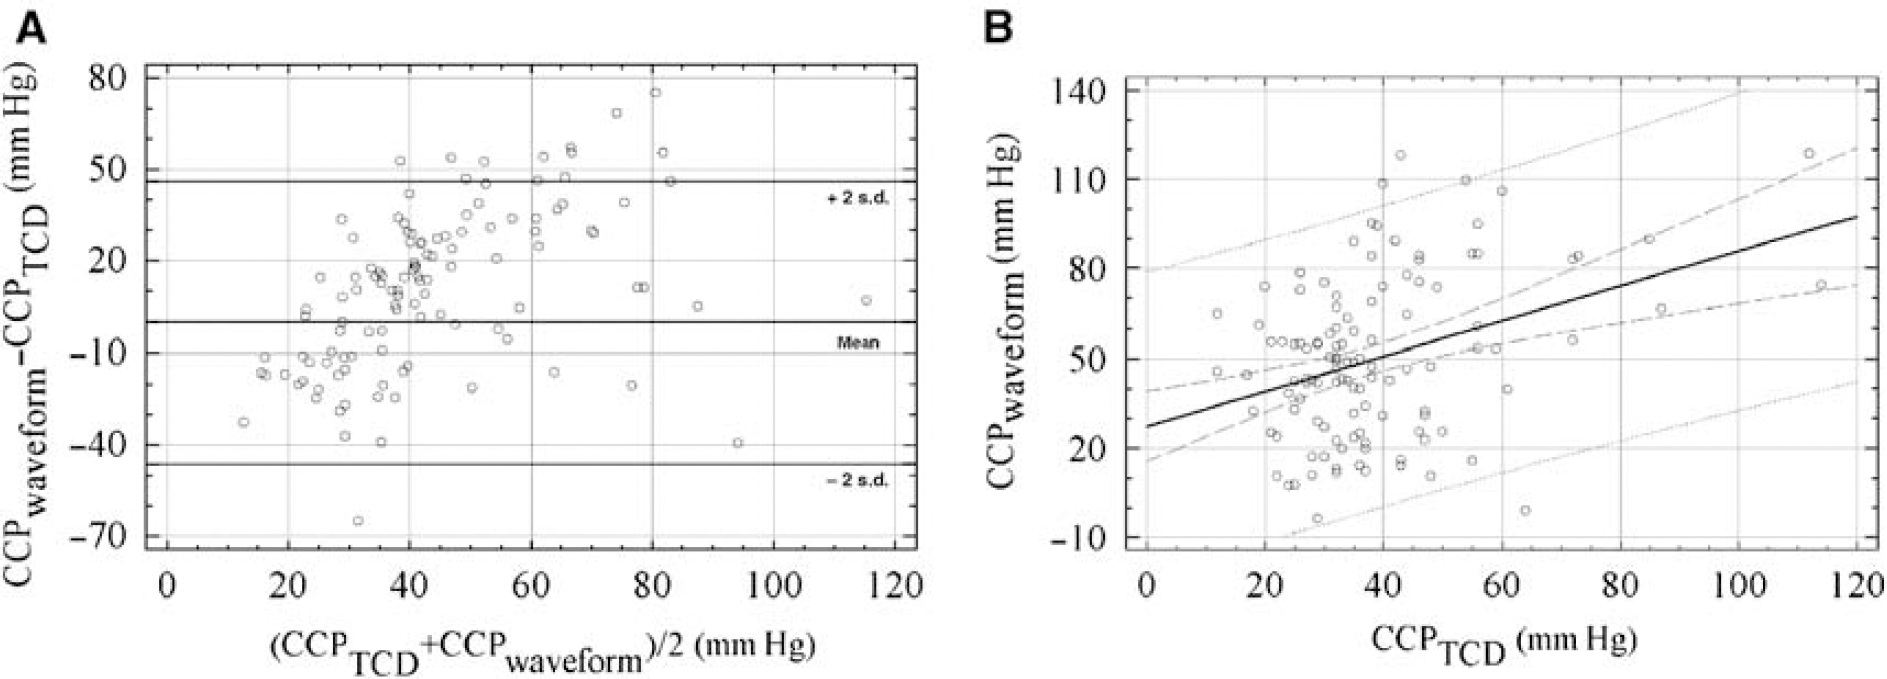
The association of CCPTCD with CPPwaveform (Figure 4) and of CCPLDF with CPPwaveform was significant but correlation coefficients were weaker (R = 0.42, P = 0.0001 for CCPTCD with CPPwaveform; R = 0.38, P = 0.0007 for CCPLDF with CPPwaveform). The values of CCPwaveform were significantly greater than those of CCPTCD (median difference was 9 mm Hg; P < 0.003).
(
There was limited variation in the correlations between CCPTCD and CCPLDF for all three groups of rabbits, all being above R = 0.95. The correlation between CCPTCD and CCPwaveform was higher in the group of ‘endothelial experiments’ (R = 0.64) and ‘simple maneuvers’ (R = 0.59) than that in the ‘deep intracranial hypertension’ group (R = 0.34). There were no differences between hemodynamic parameters just before cardiac arrest between groups, with exception of high ICP (mean 60 mm Hg, s.d. 21 mm Hg) forced in Group II.
All three estimators of CCP correlated significantly with ICP just before cardiac arrest, reaching correlation coefficient of order of 0.4; P = 0.001.
Finally, we identified a significant relationship between the value of CCP measured during CA and the speed of change in ABP (see Figure 5); R = 0.34, P < 0.004), indicating a greater value of CCPTCD when changes in ABP were faster.
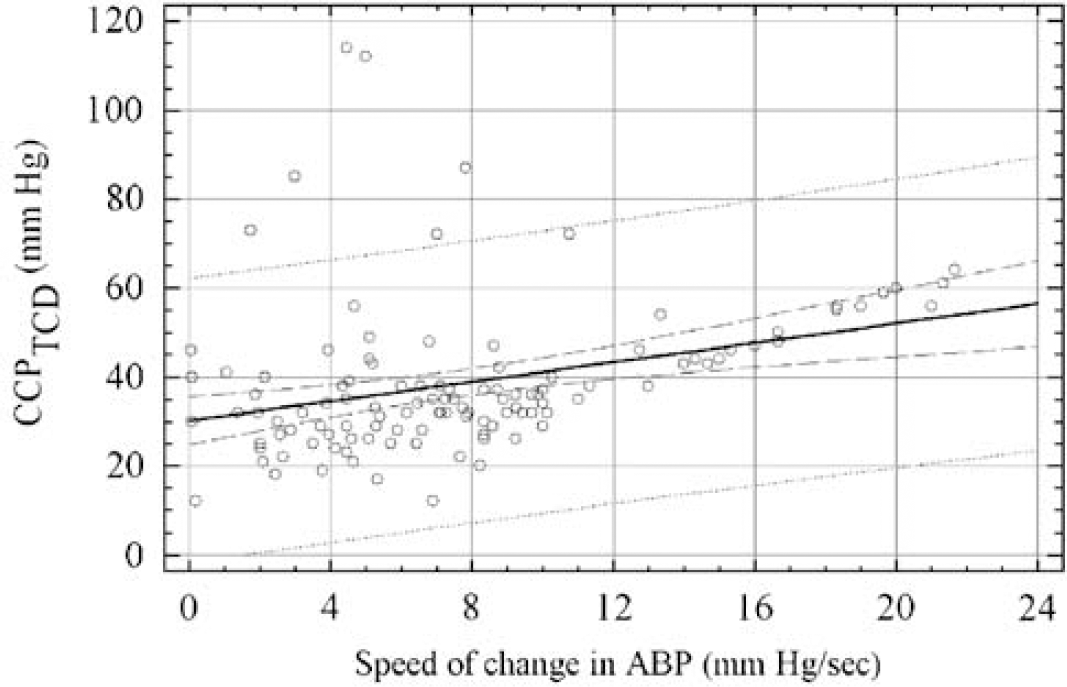
Relationship between CCPTCD and speed of change in ABP during cardiac arrest (R = 0.333; P = 0.0003).
Discussion
Critical closing pressure is the pressure at which cerebral blood vessels collapse and effective capillary blood flow ceases. Critical closing pressure is related to vascular tone and can be determined from the relationships between velocity of cerebral blood flow and the ABP. The concept of the CCP may help to understand how flow in the cerebrovascular circulation is regulated, and how this mechanism may be altered in pathologic states (Aaslid et al, 2003; Panerai et al, 2006a, b).
In this study, we have shown a close relationship between the values of CCP obtained using measures from either TCD or LDF during cardiac arrest. They both proved comparable. In the 116 experiments, the mean difference between the values obtained with the two methods was < 2 mmHg. It suggests that in a scenario of cardiac arrest, there seems to be no discrepancy between rapid changes in cerebral blood flow in basal and small cortical vessels, and that both methods share precision.
The method based on the analysis of TCD and ABP waveform was introduced to calculate CCP noninvasively in various clinical conditions (Panerai et al, 2005; Moody et al, 2005; Edouard et al, 2005). In our study, we confirmed a significant correlation between the values of CCP derived from TCD waveform (noninvasive) and that calculated from cardiac arrest (CCPLDF and CCPTCD; invasive). However, strength of correlation was weaker than the correlation between CCPLDF and CCPTCD. It was undoubtedly lower than documented by Aaslid et al (2003), where comparison of CCPwaveform and CCP calculated from ‘long diastole’ decrease in mean ABP and FV resulted in correlation generally greater than R = 0.9. Values of CCPwaveform are greater than values of CCPTCD and CCPLDF.
A discrepancy between CCP measured during CA and that predicted from the TCD waveform may be partially explained by different rates of change in ABP: during one heartbeat the rate of change in ABP in the anesthetized rabbit is much greater than during CA (55 mm Hg per sec compared with 7 mm Hg per sec; P <0.0001). In the CA model, CCPTCD is positively correlated with the rate of change in ABP. We can therefore anticipate that differences between CCPwaveform and CCPTCD are a result of different rates of change in ABP. Furthermore, the difference between CCPwaveform and CCPTCD can be influenced by the action of potassium and barbiturates on vessels' wall proprieties. The tone of the vessels' smooth musculature may be modified by the drug. Next, the femoral artery arterial pulse pressure waveform was considered to calculate CCP. The waveform of carotid artery may differ from femoral artery (it is usually richer in higher harmonics), although the first harmonic from the femoral artery and the carotid artery are very similar (Czosnyka et al, 1994). It is also possible that three different protocols might have influence on CCPs evaluated at the end of each experiment. The best similarity between CCPwaveform and CCPTCD was seen in the endothelial maneuvers group. The probable reason is that these maneuvers have a minimal effect on the large cerebral vessels (BA). A comparable correlation was seen in Group I (‘simple physiological maneuvers’), probably because this group was most heterogeneous, producing a wide distribution of CPPs because of induced changes in cerebrovascular resistance (with CO2) and in cerebral perfusion pressure (with changes in ABP and ICP). In Group III (intracranial hypertension), correlation was the weakest. Large values of prearrest ICP may be responsible for this effect. During cardiac arrest, a step-decrease in ICP is often noticed, attributed to the abruptly diminishing ‘vascular component’ of ICP (Czosnyka et al, 1999a, b). If this step-decrease is substantial, ICP is naturally becoming ‘ill defined’ during the cardiac arrest. Moreover, the Cushing reflex, due to high ICP just before CA, may have distorted waveform of TCD FV pattern in this group, and therefore influenced CCPwaveform.
Our results indicate that CCPwaveform may be a useful method when monitoring hemodynamically relevant incidences of mild intracranial hypertension and arterial hypotension (Edouard et al, 2005). A correlation around 0.6 may seem to be low, but in clinical brain monitoring it is not uncommon to interpret such a value as indicating a reasonable agreement (Reinhard et al, 2003; Steiner et al, 2003). In the clinical scenario, estimated values can be calculated repetitively and time-averaged, thus improving the signal-to-noise ratio. CPPwaveform can be calculated on a beat-to-beat basis and may be used to detect cerebral hemodynamic fluctuations in time. Previous clinical studies indicated that CCPwaveform may be utilized in the detection of cerebral vasodilatation (Moody et al, 2005) and of moderate intracranial hypertension (Czosnyka et al, 1999a, b). Our results suggest that in deep intracranial hypertension (like in Group III), clinical use of CCPwaveform is probably of lower significance.
Although, having definite merits, CCP is not that commonly used at the bedside in clinical neurosciences. It needs very good skills to obtain good quality TCD waveforms. For continuous monitoring of CCP, good and stable fixation of ultrasound probes is necessary. Good quality of ABP waveform, reflecting cerebral ABP waveform, is also needed. In summary, it is interesting but a demanding technique, still awaiting better clinical evaluation.
Conclusion
A strong correlation exists between CCP values obtained by means of TCD and LDF measurements. However, predictions of CCP using TCD waveform analysis shows substantial differences from values of CCP recorded during cardiac arrest. These differences will need to be understood before indirect calculations of CCP can be reliably used in clinical practice.