
Abstract
In addition to cerebrovascular resistance (CVR) zero flow pressure (ZFP), effective cerebral perfusion pressure (CPPe) and the resistance area product (RAP) are supplemental determinants of cerebral blood flow (CBF). Until now, the interrelationship of PaCO2 -induced changes in CBF, CVR, CPPe, ZFP, and RAP is not fully understood. In a controlled crossover trial, we investigated 10 anesthetized patients aiming at PaCO2 levels of 30, 37, 43, and 50 mm Hg. Cerebral blood flow was measured with a modified Kety-Schmidt-technique. Zero flow pressure and RAP was estimated by linear regression analysis of pressure–flow velocity relationships of the middle cerebral artery. Effective cerebral perfusion pressure was calculated as the difference between mean arterial pressure and ZFP, CVR as the ratio CPPe/CBF. Statistical analysis was performed by one-way RM-ANOVA. When comparing hypocapnia with hypercapnia, CBF showed a significant exponential reduction by 55% and mean VMCA by 41%. Effective cerebral perfusion pressure linearly decreased by 17% while ZFP increased from 14 to 29 mm Hg. Cerebrovascular resistance increased by 96% and RAP by 39%; despite these concordant changes in mean CVR and Doppler-derived RAP correlation between these variables was weak (r = 0.43). In conclusion, under general anesthesia hypocapnia-induced reduction in CBF is caused by both an increase in CVR and a decrease in CPPe, as a consequence of an increase in ZFP.
Keywords
INTRODUCTION
Arterial partial pressure of carbon dioxide (PaCO2) is well known to change global cerebral blood flow (CBF) and the flow velocity of the middle cerebral artery (VMCA), which can be explained by an increase or decrease in cerebral vascular resistance (CVR) and partly by cerebral perfusion pressure (CPP). Over a range of PaCO2 values of 20 to 80 mm Hg for each mm Hg increase or decrease in PaCO2 there is a 2% to 4% change in CBF or VMCA. 1 However, it is still unclear which of both determinants is more affected by hyperventilation and hypoventilation: CPP, CVR, or both. Both variables are thought to be influenced by arteriolar smooth muscle tone and therefore these variables can be expected to change simultaneously when PaCO2 varies. 2
When calculating the CPP, the mean arterial pressure (MAP) is commonly used as effective upstream pressure and the intracranial pressure (ICP) as effective downstream pressure (EDP) of the cerebral circulation, because of a Starling resistor phenomenon located at the level of cerebral veins. 3 However, another major component of the EDP is the critical closing pressure (CCP), which cannot be directly measured in patients with spontaneous circulation. It has been proven that in vivo pressure–flow relationships are linear for many vascular beds, including the cerebral vessels. 4 Since the introduction of transcranial Doppler ultrasonography (TCD), a number of methods have been developed to assess CCP by extrapolating instantaneous pressure–flow velocity plots (ABP/VMCA) to zero or by calculation of the intercept of diastolic, mean, and/or systolic values of pressures and flow velocity.2,5–8
A number of factors other than vascular tone, i.e., central venous pressure and ICP, can also influence the EDP in the cerebral circulation. Consequently, the use of the term ‘zero flow pressure’ (ZFP) is considered more appropriate than CCP. 9 It is suggested that, in patients without increased ICP, ZFP is determined by arteriolar tone. The effective CPP (CPPe) is defined by the difference between MAP and ZFP. 5 The inverse of the slope of the ABP–VMCA plot is named the ‘resistance area product’ (RAP). 10 In several investigations, the RAP has been used as an index of CVR.2,11
Recent studies could show that ZFP varies inversely with changes of PaCO2.2,5,6 Furthermore, hypocapnia reduced CBF by decreasing CPPe due to the increase in ZFP, whereas the RAP was unaffected. 7 In contrast, McCulloch et al 2 could show that hyperventilation significantly increases RAP, which seemed to have a greater effect on VMCA than the increase in ZFP.
It is still unclear, which of both components are more affected by hyperventilation and hypoventilation. Describing the pressure–flow (velocity) relationship by a single parameter (CVR) can mislead interpretation and blunt key relationships. As an extreme case, it is possible to have repeated pressure–flow velocity measurements indicating a constant estimation of CVR = ABP/CBF or ABP/VMCA, when in fact there had been changes in both ZFP and RAP. 6
Up to now there is no investigation that combines measurements of CBF and VMCA to compare changes of the cerebrovascular CO2-reactivity (CO2-R) of global CBF and of VMCA. Similarly, reference calculations of CVR based on quantitative CBF measurements and calculation of CPPe by determination of ZFP have not yet been compared with changes in RAP. Therefore, we investigated the effects of variation in PaCO2 on CBF, VMCA, CPPe, ZFP, RAP, and CVR in patients under intravenous anesthesia.
MATERIALS AND METHODS
Design
The prospective study was designed and performed in a controlled, crossover design at the University of Göttingen Medical Center. The main purpose of this study was to evaluate the cerebrovascular reactivity induced by variations in arterial partial pressure of carbon dioxide in anesthetized patients examined by a combination of two cerebral measurement techniques: transcranial Doppler Sonography and Kety-Schmidt technique. Each patient served as his own control. The study followed the recommendations of the Declarations of Helsinki from 1975 to 1989 and the European Union Commission and European Medicines Agency (Council Directive 91/507/EEC and 75/318/EEC). Approval was obtained from the local institutional review board (Medical Ethical Committee of the Georg-August-University of Göttingen, Göttingen, Niedersachsen, Germany; No. 07/09/90).
End Points
The end points of the trial were changes in CBF, VMCA, CPPe, ZFP, CVR, and RAP.
Screening, Inclusion, and Informed Consent of Patients
Due to logistic reasons we could perform only 1 to 2 measurements per month. Therefore, standard-screening procedures could not be applied in this crossover trial. Patients were eligible for inclusion if scheduled for elective coronary surgery. Exclusion criteria were being older than 80 years of age, female gender, patient refusal, active neurologic disease, and a history of cerebrovascular disease, brain injury, or intracranial surgery. All patients were informed of the purpose of the study and provided written informed consent before being enrolled. None of the eligible patients refused inclusion of the trial. There were no dropouts during the study period.
Sample Size Calculation
The intersubject and intrasubject variability of CBF, CPP, and CVR has been reported in earlier studies.12–15 There is paucity of data of CBF and VMCA in humans under general anesthesia, which was necessary for an exact sample size calculation for this crossover trial. We expected a 50% difference of CBF with an estimated effect size of 0.7 to 0.8. For a statistical power of 0.8 to 0.9 the sample size had to be between 7 and 10 patients. Therefore, we projected a sample size of 10 patients.
Anesthesia Procedure
Individual medications were continued until surgery. Intravenous anesthesia was induced and maintained by continuous intravenous administration of fentanyl, midazolam, and pancuronium. The anesthesia procedure, the details of mechanical ventilation, and the methods of catheter insertion have been described in previous reports in detail.14,16
Measurements
Cerebral blood flow was measured using the modified Kety-Schmidt inert gas saturation technique with argon as a tracer gas as described in detail in earlier reports.14,16 Blood flow velocity in the proximal (M1) segment of the middle cerebral artery (VMCA) was measured by TCD as extensively described in earlier reports.5,14 Because TCD measurements of VMCA from the transtemporal window fail with above average incidence in elderly female patients we included only male patients in this study. 17 Arterial blood pressure was measured invasively in the radial artery, ispilateral to the TCD probe.
Measurements were performed aiming at PaCO2 levels of (A) hyperventilation (30 mm Hg), (B) normoventilation I (37 mm Hg), (C) normoventilation II (43 mm Hg), and (D) hypoventilation (50 mm Hg) before surgery. All measurements were performed during hemodynamic and respiratory steady-state conditions. The time interval between the measurements was 20 minutes. Blood samples were drawn twice, at the beginning and end of each argon wash-in period, to measure hemoglobin concentration and variables of blood gas analysis (ABL; Radiometer, Copenhagen, Denmark). For comparisons with CBF measurements, VMCA was averaged over the 10-minute period of each argon wash-in maneuver. End-expiratory CO2 concentrations were continuously recorded to ensure a stable PaCO2 during argon saturation.
Calculations
The analyses of the ZFP, CPPe, and RAP have been performed after the study period. Cerebral ZFP was calculated from data at the beginning and end of each CBF measurement from two simultaneous 10-second recordings (two breathing cycles) of the VMCA envelope and arterial pressure curves. Over each 10-second period we first averaged consecutive pairs of diastolic, mean, and systolic data of ABP and VMCA. These data were used in a pressure/flow velocity plot. Zero flow pressure was then extrapolated by linear regression analysis of the ABP–VMCA relationship. A correction of the time delay between ABP and VMCA signal was not necessary. The ABP axis intercept of the regression line determines the ZFP.5,8 The cerebral ZFP was used as a measure of the EDP of the cerebral circulation. In the relationship between ABP and VMCA, the RAP is defined as the inverse slope of their linear regression line.2,4,6,10
Formulae to calculate CPPe, CVR, and RAP are shown in Table 1. The calculation of the carbon dioxide reactivity was based on the ratio of the individual changes of CBF and PaCO2. To ensure a better comparability with previous studies, we compared CBF and VMCA values of hyperventilation (A) and hypoventilation (D) with standardized normocapnic CBF and VMCA values, extrapolated by regression analysis for each patient at a PaCO2 level of 40 mm Hg. This calculation of CO2-R indicates the percentage of the changes in CBF and VMCA per mm Hg, which is relatively independent of the particular flow levels and the PaCO2 values. 18
Formulae to calculate CPPe, CVR, RAP, and CO2-R
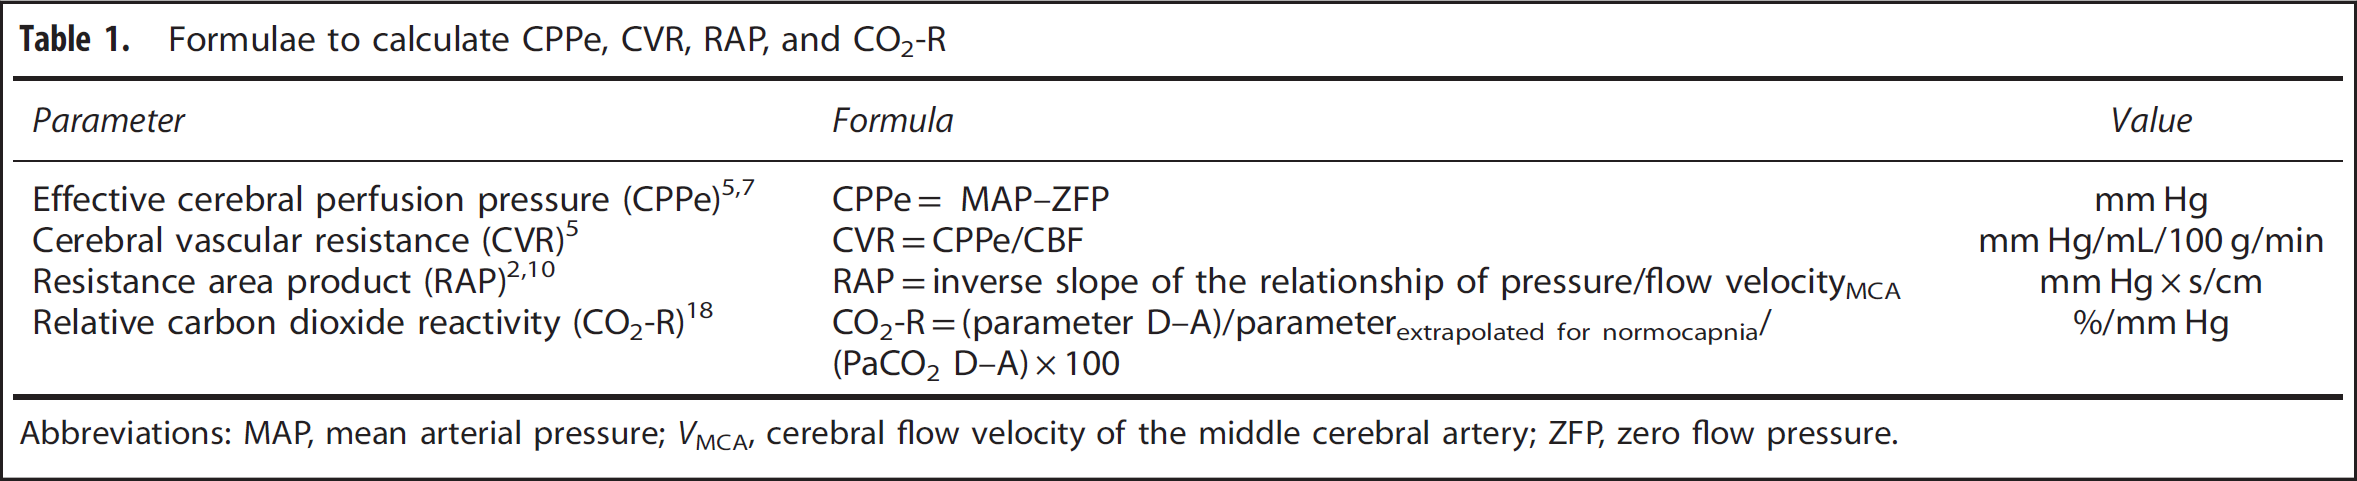
Abbreviations: MAP, mean arterial pressure; VMCA, cerebral flow velocity of the middle cerebral artery; ZFP, zero flow pressure.
Statistical Analysis
The results presented in tables are expressed as mean (standard deviation) unless otherwise stated. Tests for normal distribution of data were performed with the D'Agostino-Pearson omnibus K2 method.
The differences between the ventilation steps were assessed using one-way analysis of variance for repeated measures (RM-ANOVA). Multi-comparison analyses between measurements have been done with Holm-Šídák post hoc tests.19,20
The differences between D (hypoventilation) and A (hyperventilation), C (normoventilation II) and A (hyperventilation) as well as B (normoventilation I) and D (hypoventilation) were calculated using t-tests for paired data or Welch test and nonparametric Wilcoxon signed-rank test, if indicated. 21 To provide an estimate of the effect of changes in PaCO2 levels and their clinical meaningfulness, we calculated mean differences (MD) and their 95% confidence intervals (MD; 95% CI upper bound, lower bound; P value). 22 To prevent from type I error, all primary end points were tested by one-way ANOVA for repeated measurements followed by Bonferoni multiple comparison tests. 23 All statistical analysis were performed two-sided and a P value of <0.05 was considered to be significant. Database sheets were done by MS Excel for Mac 2011 (Microsoft, Redmond, WA, USA). Statistical procedures and graphs were made using Prism 6.0 (GraphPad Software, La Jolla, CA, USA). Sample size calculation was performed with G*Power (University of Düsseldorf, Department of Psychology, Düsseldorf, Germany).
RESULTS
The study period was 11 months (20 February 1991 until 28 January 1992). A total of 10 male patients were included in the study. The mean age of the patients was 56(6) years, (median 58, range 48 to 65 years), mean height 173(6) cm, and mean body weight 77(9) kg. The variability of the four target levels of PaCO2 was small due to the controlled adjustment of mechanical ventilation. Levels of hemoglobin, partial oxygen pressure, blood viscosity, and blood temperature were kept constant during the measurements. Cardiac index and stroke volume index changed slightly, which was clinically not relevant. The controlled reduction in PaCO2 caused a small increase of MAP, which could be related to a significant small increase of systemic vascular resistance.
The mean TCD-insonation depth of the MCA was 51(3) mm. The TCD signals were of high quality in all patients except one measurement: during the second 10 seconds recording of VMCA and ABP of patient 5 at PaCO2 of 37 mm Hg showed ABP artifacts. The calculation of the ZFP was thus based on the values at the beginning of the CBF measurement. Hemodynamic and basic metabolic data are presented in Table 2. Results of absolute CO2-R of CBF and VMCA are presented in Table 3 for the different steps of PaCO2 variation as well in Figures 1A and 1B, as exponential function.
Hemodynamic and metabolic variables
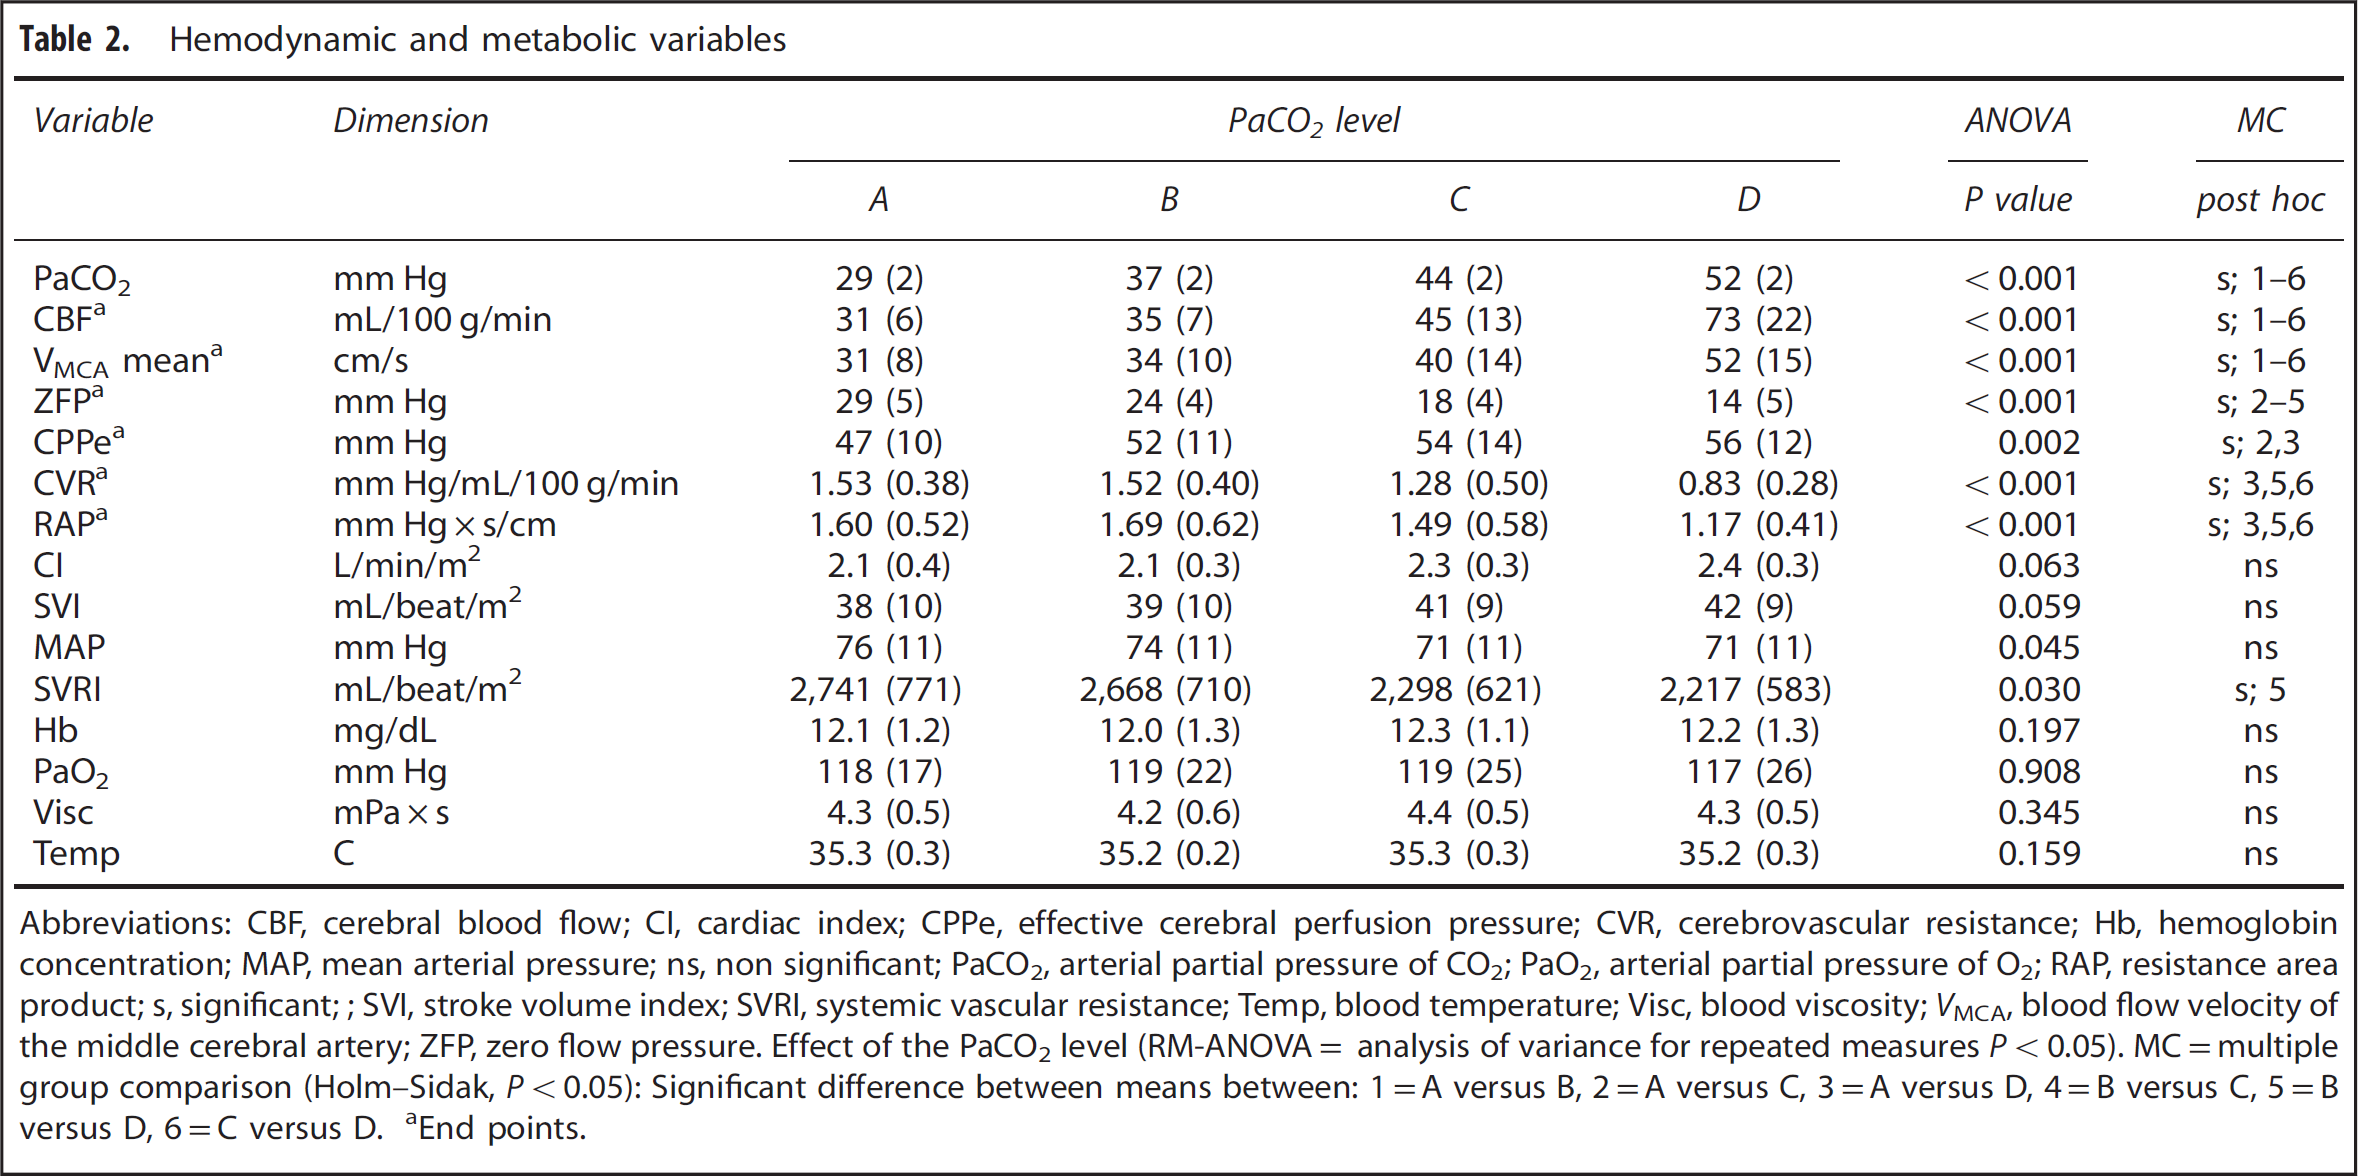
Abbreviations: CBF, cerebral blood flow; CI, cardiac index; CPPe, effective cerebral perfusion pressure; CVR, cerebrovascular resistance; Hb, hemoglobin concentration; MAP, mean arterial pressure; ns, non significant; PaCO2, arterial partial pressure of CO2; PaO2, arterial partial pressure of O2; RAP, resistance area product; s, significant;; SVI, stroke volume index; SVRI, systemic vascular resistance; Temp, blood temperature; Visc, blood viscosity; VMCA, blood flow velocity of the middle cerebral artery; ZFP, zero flow pressure. Effect of the PaCO2 level (RM-ANOVA= analysis of variance for repeated measures P<0.05).
MC=multiple group comparison (Holm–Sidak, P<0.05): Significant difference between means between: 1=A versus B, 2=A versus C, 3=A versus D, 4=B versus C, 5=B versus D, 6=C versus D.
End points.
Effect of changes in PaCO2 levels on primary end points
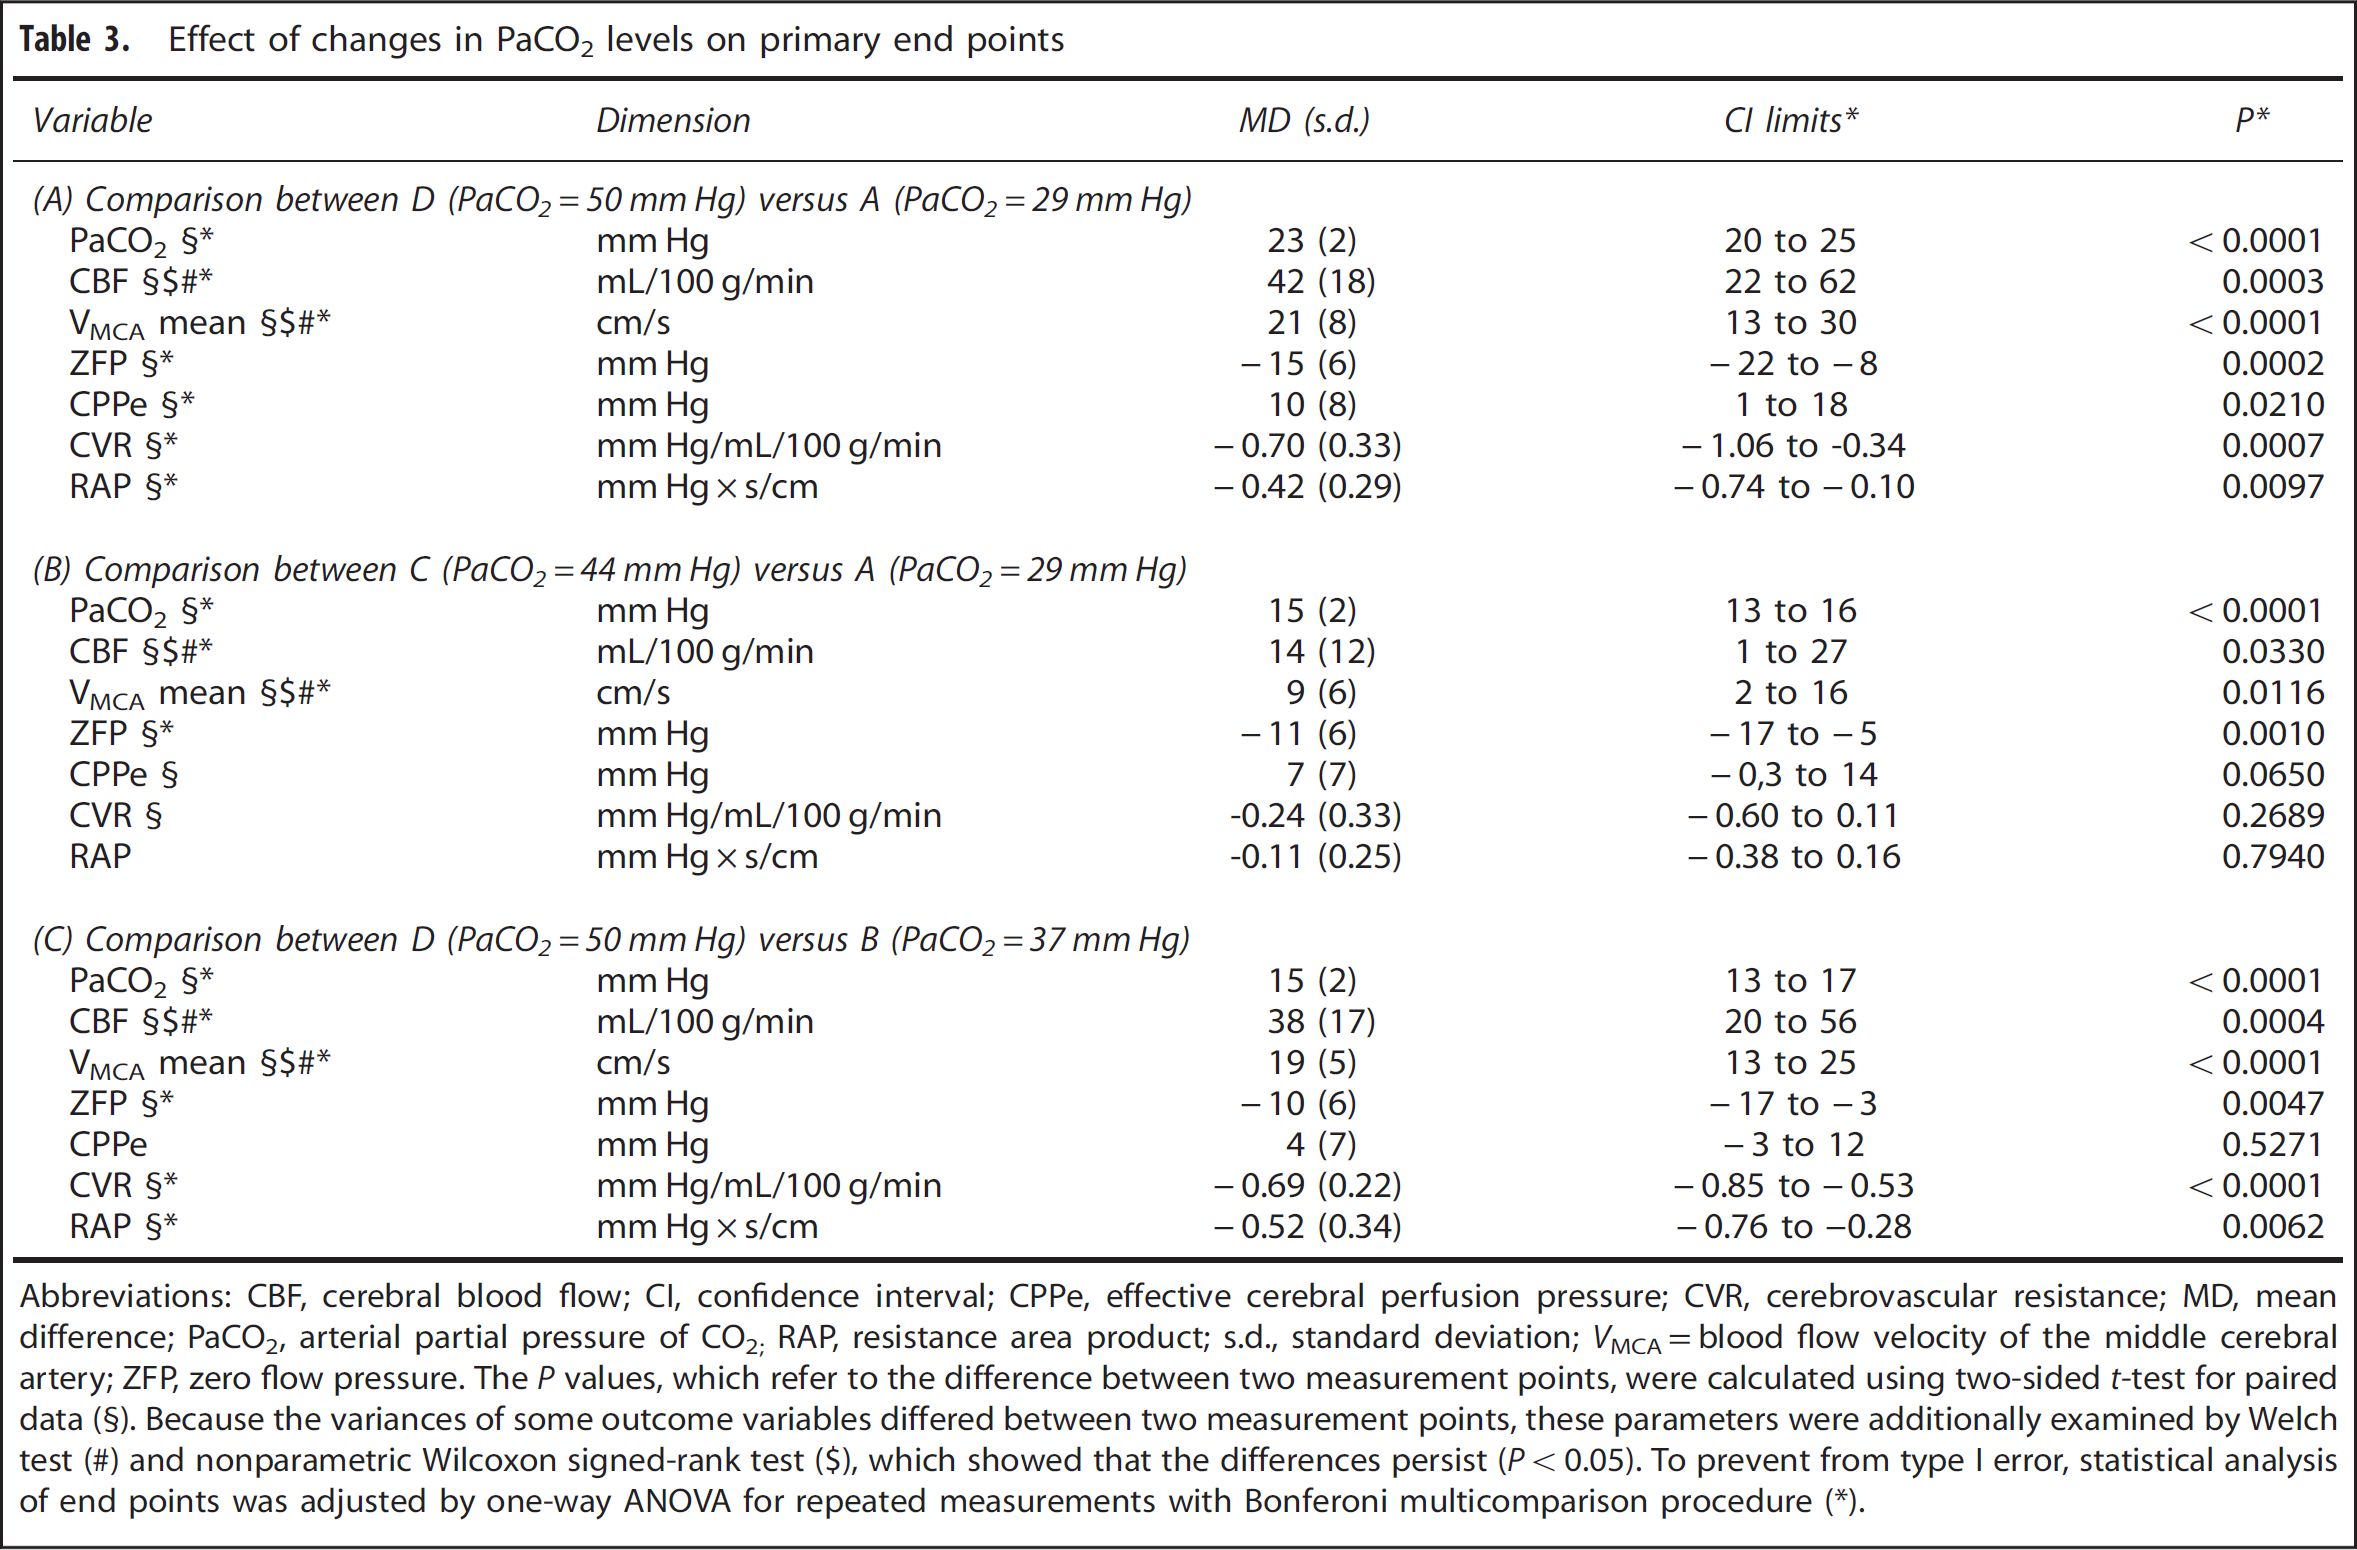
Abbreviations: CBF, cerebral blood flow; CI, confidence interval; CPPe, effective cerebral perfusion pressure; CVR, cerebrovascular resistance; MD, mean difference; PaCO2, arterial partial pressure of CO2; RAP, resistance area product; s.d., standard deviation; VMCA=blood flow velocity of the middle cerebral artery; ZFP, zero flow pressure. The P values, which refer to the difference between two measurement points, were calculated using two-sided t-test for paired data.
Because the variances of some outcome variables differed between two measurement points, these parameters were additionally examined by Welch test
nonparametric Wilcoxon signed-rank test
which showed that the differences persist (P<0.05). To prevent from type I error, statistical analysis of end points was adjusted by one-way ANOVA for repeated measurements with Bonferoni multicomparison procedure (∗).
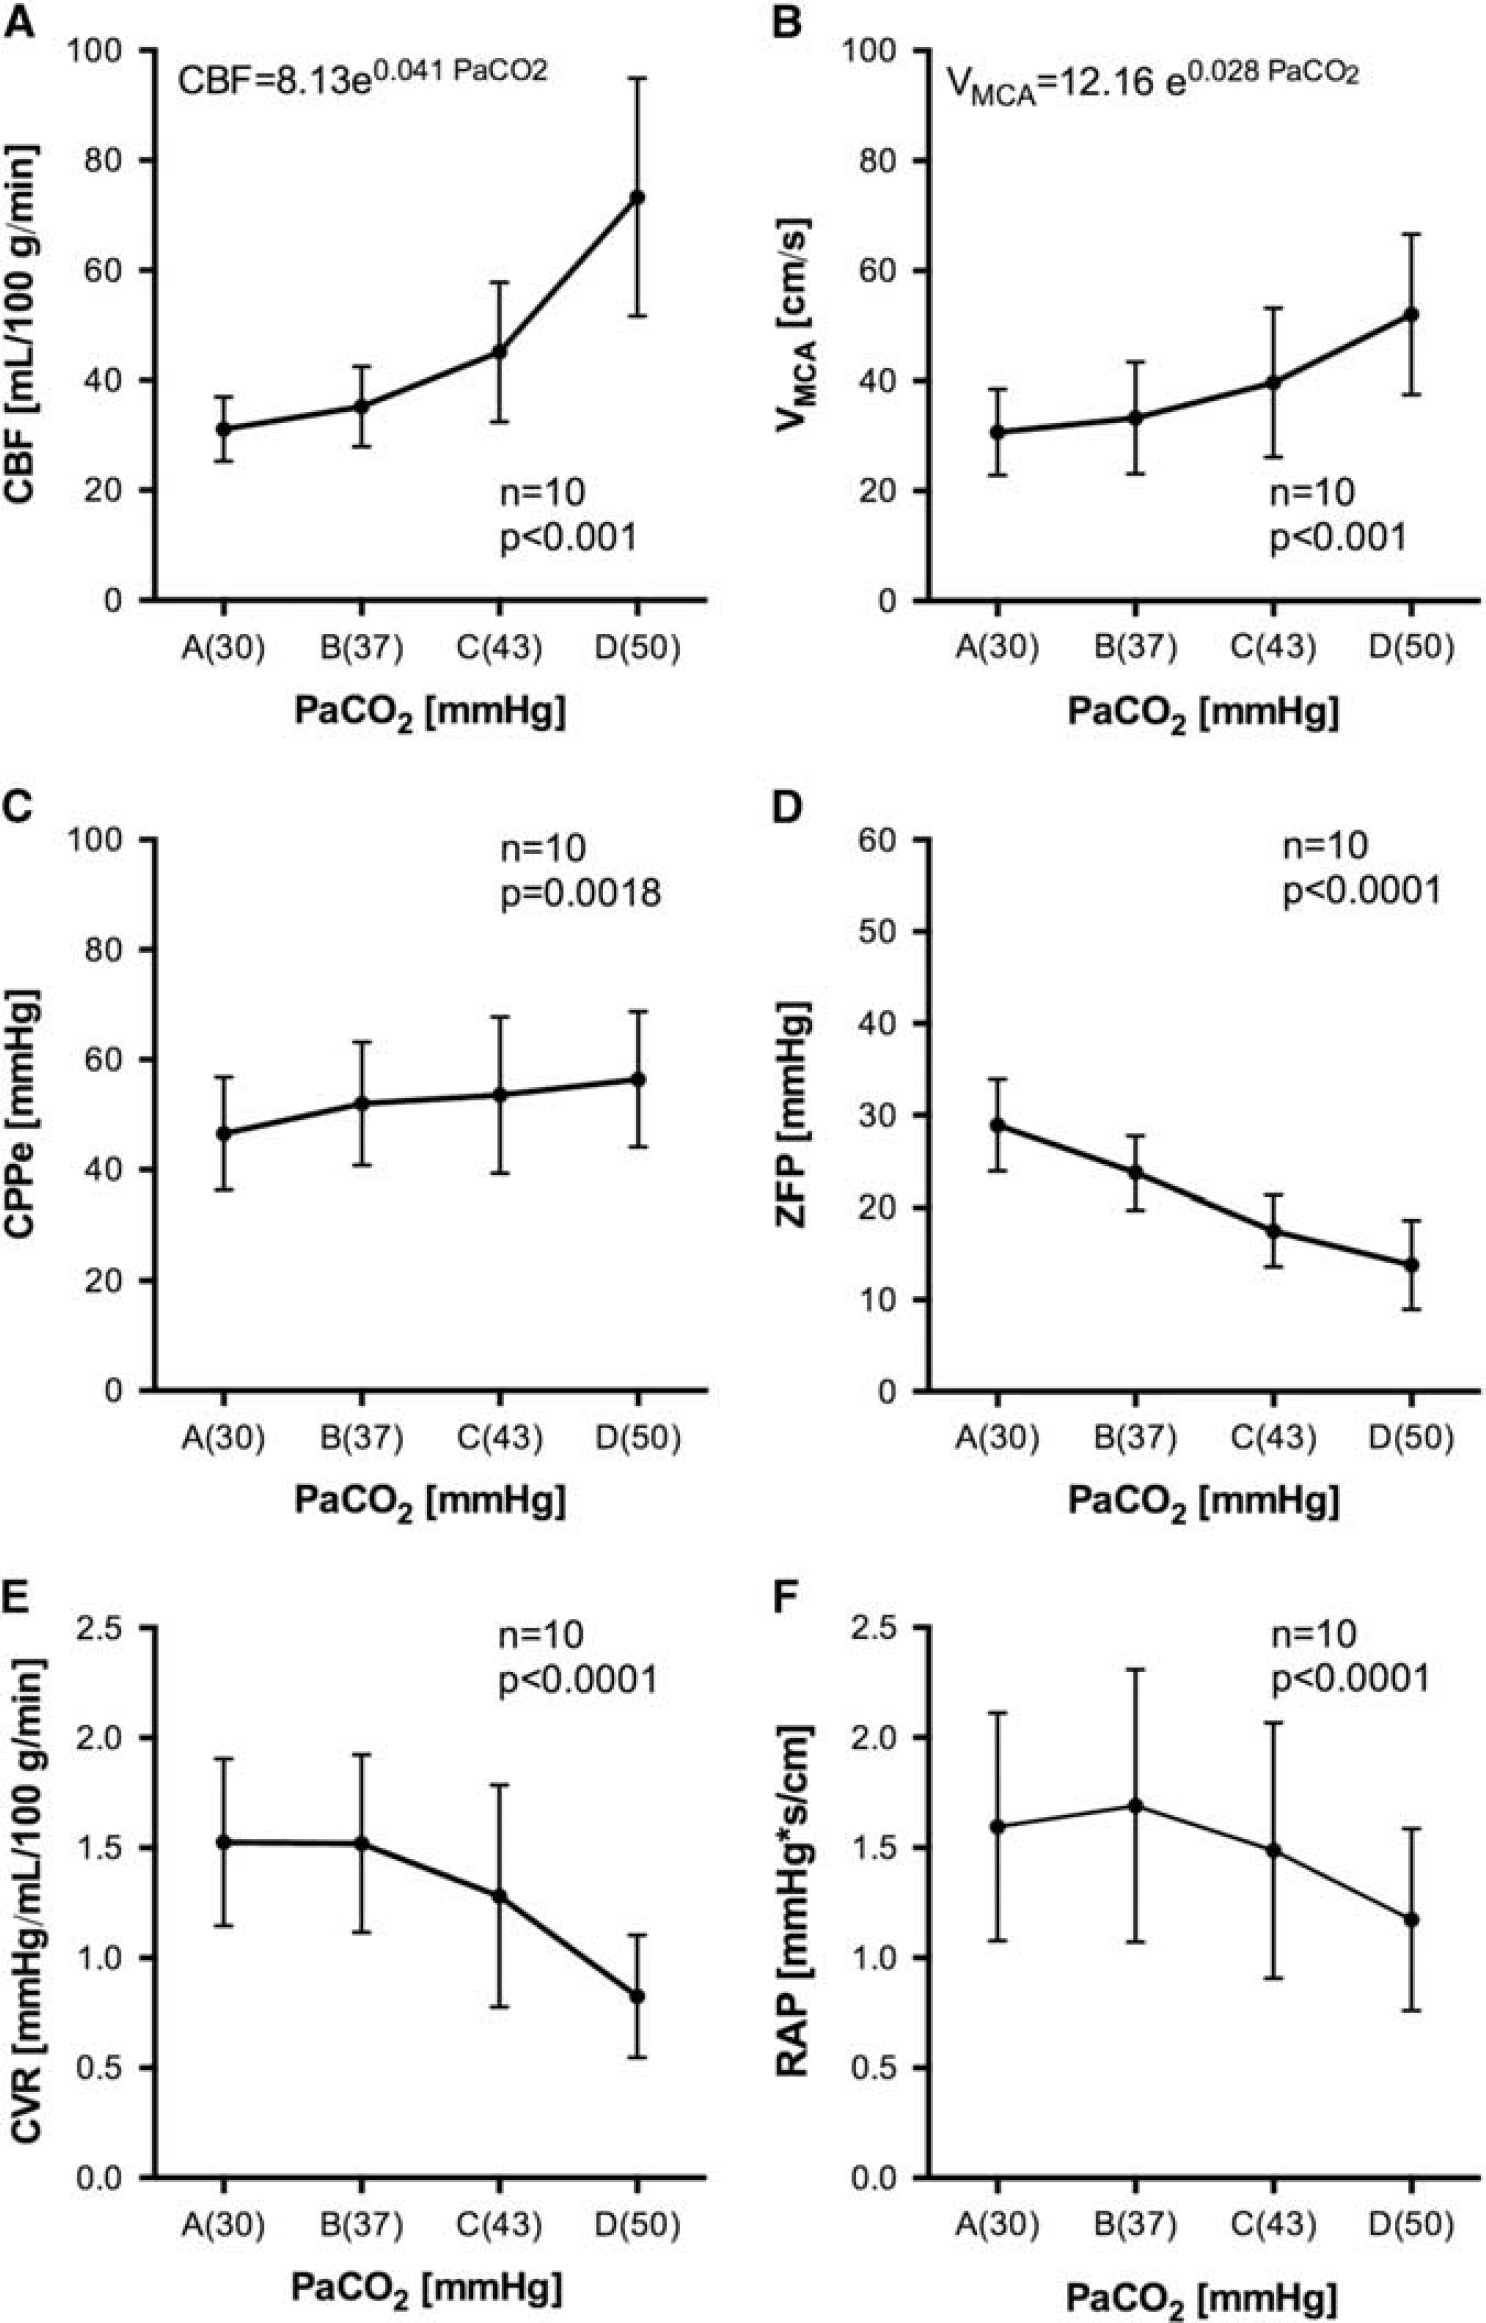
Cerebral hemodynamic variables under different levels of PaCO2. Values of CBF (
The effects of ventilatory changes on the cerebral circulation were substantial. Hyperventilation (A) exponentially reduced CBF, in total by 55%, and VMCA by 41%, when compared with hypoventilation (D). Compared with CBF, the exponential decrease of mean VMCA due to changes in PaCO2 was less pronounced (Figures 1A and 1B, Tables 2 and 3A).
The decrease in CBF and mean VMCA due to hyperventilation was interrelated to an increase of CVR by 96% (Figure 1E, Tables 2 and 3A) and a decrease in CPPe by 17% (Figure 1C, Tables 2 and 3A). As expected, changing PaCO2 levels from hypoventilation to hyperventilation leads to a small increase of the MAP by 7.5%; however, post hoc comparison analysis between measurements (D) and (A) did not reach level of significance (MD 5 (8) mm Hg, P = 0.25). The CPPe decrease was thus primarily caused by an evident linear increase of ZFP by 15(6) mm Hg (Figures 1C and 1D, Tables 2 and 3A). Hyperventilation (A) increased RAP only by 39%, when compared with hypoventilation (D) (Figure 1F, Tables 2 and 3A). The changes in mean CVR and RAP were thus concordant, nevertheless the correlation analysis of individual data showed only a weak linear connection (Pearson r = 0.43, CI 0.14 to 0.66, P = 0.005).
The curves of CBF, VMCA, CVR, and RAP showed an exponential slope (Figure 1). Thus, percent changes between the ventilation steps might be quantitatively different. For statistical analysis, we consequently compared C (normoventilation II) versus A (hyperventilation) and B (normoventilation I) versus D (hypoventilation) of all end points.
When comparing level C (normoventilation II) with A (hyperventilation) CBF was reduced by 28% and mean VMCA by 21% (Table 3B). The decrease of CPPe by 12% was caused by an increase of ZFP by 74%, which exceeded the small increase in MAP. Cerebrovascular resistance increased by 0.24(0.30) mm Hg/mL/100 g/min and RAP by 0.11 (0.25) mm Hg × s/cm (Table 3B), which were not significant.
When comparing level D (hypoventilation) with B (normoventilation I) the CBF was decreased by 50% and mean VMCA by 36% (Table 3C). Here, the relative increase of ZFP was high (93%) but absolute changes were small, which lead only to a small reduction in CPPe by 7%. The RAP showed a less pronounced increase (by 46%) than the CVR, which increased by 91% (Table 3C).
Cerebrovascular CO2-R of CBF was 1.88 (0.89) mL/100 g/min/ mm Hg, corresponding to a relative change of 4.13 (1.27) %/mm Hg. The cerebrovascular CO2-R of mean VMCA was 0.95 (0.36) cm/s/mm Hg, corresponding to a relative change of 2.47 (0.48) %/mm Hg, which was significantly lower than the relative CO2-R of CBF (MD −1.67; 95% CI: − 2.46, −0.87; P = 0.001).
DISCUSSION
We investigated the effects of variations in PaCO2 on CBF, blood flow velocity, eCPP, CVR, ZFP, and RAP in cardiovascular patients undergoing fentanyl–midazolam anesthesia. The three most prominent results of our study are:
Hypocapnia-induced reduction in CBF under general anesthesia was the effect of both, an increase in CVR and a decrease in CPPe, as a consequence of an increase in ZFP;
The increases of mean CVR and RAP associated with hypocapnia were concordant. Nevertheless, correlation analysis showed only a weak linear relationship;
Variation of PaCO2 within a range of 30 to 50 mm Hg induced changes in CBF and VMCA, which both followed an exponential function. However, VMCA systematically underestimated changes in global CBF resulting in a discrepancy between cerebrovascular CO2-R measured by CBF and VMCA.
Examining the functional capacity of the cerebrovascular autoregulatory system by altering blood pressure is difficult and possibly hazardous to be performed as a routine clinical procedure. Therefore, Bloor et al 24 introduced CO2-R measurements to evaluate cerebral vascular reactivity.
In our study, we could show that the cerebrovascular CO2-R (within a PaCO2 range of 30 to 50 mm Hg) of CBF as well as VMCA followed an exponential shape. Other authors described the cerebral CO2-R response curve of CBF in humans as a linear or exponential function.1,15,25,26 Correspondingly, CO2-response curves of the VMCA measured by TCD have been described as a linear, logarithmic, exponential, or as a sigmoid function.26,27
Today, VMCA and its indices are routinely used to assess components of cerebral circulation and CVR. A good correlation between changes in VMCA and changes in CBF has been found during carotid endarterectomy. 28 During cardiopulmonary bypass and in patients with cerebrovascular diseases, correlations between CBF and VMCA values are rather weak with wide between-patient variation.14,29
In a number of previous studies, relative changes in CBF were reflected by changes in VMCA in a proportional manner, suggesting that MCA diameter remains constant. 30 Nevertheless, other investigations could show that illness and interventions as orthostasis, migraine attacks, CO2-rebreathing, or vasoactive medicine could change the MCA diameters by 5% to 12%.31–34
Reports of cerebrovascular CO2-R of CBF and VMCA in humans give inconsistent results. Additionally, comparisons between cerebrovascular CO2-R of CBF and VMCA in humans under general anesthesia are very rare. In our study, we could show that the cerebrovascular CO2-R (within a range of 30 to 50 mm Hg) of CBF as well as VMCA showed an exponential function. However, the relative cerebrovascular CO2-R measured by TCD was lower when compared with measurements of CBF by the Kety-Schmidt technique, especially under hypercapnia. The most probable explanation is that changes of PaCO2 do not only cause changes in vascular diameter at the arteriolar level but may also cause minor changes in MCA main trunk diameter resulting in a slight systematic difference between relative changes in flow and flow velocity. A similar phenomenon had been described during hypothermic cardiopulmonary bypass. 14
Our study is the first report that combines measurement of global CBF with the determination of ZFP and CPPe. The CVR is commonly defined by the law of Darcy as the quotient between the driving blood pressure and CBF (‘classical model’ CVR = (MAP-ICP)/CBF). This model has limitations, because it assumes that flow or flow velocity only reaches zero when the driving pressure is zero, which is unlikely, at least in the absence of intracranial hypertension. 6 Patients without cerebrovascular disease are expected to have a normal ICP between 7 and 15 mm Hg in supine position. 35 Hyperventilation reduces cerebral blood volume and consequently decreases ICP. 36 But the reduction of ICP induced by hyperventilation in patients without cerebrovascular disease is expected to be small. Thus, the main determinant of the driving pressure would be the MAP. Our patients showed only a small increase of MAP and systemic vascular resistance, which was in accordance with the previous findings. 37 Nevertheless, measures of MAP do not directly reflect the effective CPP because the CPP may be modified by factors other than MAP and ICP. 6
Studies of other organs have shown that the EDP can be determined by a Starling resistor located at arteriolar level. 38 These studies verified the theory of Permutt and Riley 39 showing that two forces, the extramural pressure (ICP in the case of the brain) and arteriolar wall tension determine CCP. Arteriolar wall tension arises from a combination of the stretched elastic components of the vessel wall and active contraction of vascular smooth muscle. Thus, the driving pressure for the flow through arterioles is, under many conditions, not the difference between arterial (inflow) pressure and venous (outflow) pressure, but rather the difference between arterial pressure and CCP.
The CCP of the cerebral circulation cannot be directly measured in patients with spontaneous circulation. It has been confirmed that in vivo pressure–flow relationships are straight lines for many vascular beds and for the cerebral vessels as well. 4 Since the introduction of TCD, a number of methods have been developed to assess CCP noninvasively by extrapolating instantaneous pressure–flow velocity plots (ABP/VMCA) to zero from continuous recordings or by extrapolation of the ZFP from a linear function given by diastolic, mean, and/or systolic values of pressures and flow velocity.2,5–7
In a former investigation, we suggested the hypothesis of two Starling resistors in a series connection, one (proximal) at the precapillary level of cerebral resistance vessels (CCPart) and a second (distal) at the level of collapsible cerebral veins (CCPven). The EDP of the cerebral circulation may be determined by CCPart, CCPven (i.e., ICP), or jugular venous pressure, depending on which one is the highest. 5 Thus, a number of factors other than vascular tone, i.e., central venous pressure and ICP, can also influence EDP in the cerebral circulation. Consequently, the use of the term ‘zero flow pressure’ (ZFP) is considered more appropriate than CCP. 9
Using the difference between MAP and ZFP as the driving pressure of the cerebral circulation offers advantages in understanding pathophysiology, because changes of the EDP will be reflected by this kind of calculation (‘alternative model’ CVR = (MAP-ZFP)/CBF). The reduction of CPPe due to hyperventilation in our patients was clinically relevant, which is in accordance with previous findings.2,5–7,40
When using TCD, an estimate of vascular resistance can be derived from the ratio between blood pressure and blood flow velocity, which equals the product of the peripheral resistance and the cross-sectional area of the vessel at the site of insonation, the RAP. 10 Up to now, there is no investigation that compared measurements of global CBF and VMCA compare changes in CVR with RAP. In our study, the increase of mean CVR and RAP due to changes of PaCO2 was concordant. Nevertheless, correlation analysis of individual data showed only a weak linear relationship. There are only a few trials about variations of PaCO2 and its effect on CBF and CVR as well as on VMCA and RAP in patients or volunteers without cerebral disease. They all showed an inverse reaction of CBF and CVR.1,26 Recent TCD studies could show that the RAP varies inversely with changes in PaCO2.2,40 Thus, the RAP might have potential to reflect CO2-induced changes of vascular resistance. Some investigations showed that hypocapnia increases ZFP, whereas the RAP seems to be unaffected.7,41 Conversely, McCulloch et al 2 found that RAP increased significantly with hypocapnia, and the increase in RAP appeared to have a greater effect on VMCA than the increase in ZFP. In the relationship between flow velocity and arterial blood pressure, the RAP has been defined as the inverse slope of their linear regression line.2,4,6,10 The RAP can thus be expressed as RAP = (MAP–ZFP)/VMCA. The CVR is defined ‘classically’ as CVR = (MAP – ICP)/CBF or in our study ‘alternatively’ as CVR = (MAP–ZPF)/CBF. In our patients, the CO2-R curve of the VMCA showed a smaller increase than CBF when comparing levels from hyperventilation to hypoventilation, which affects the slope of the pressure–flow (velocity) relationship and consequently also limits the validity of RAP as an index of CVR. Recently, Panerai et al 42 could show that the RAP is related to myogenic properties of the cerebrovascular system, while ZFP reflects metabolism and cerebrovascular reactivity to CO2. Our data, however, could not explain the regulatory mechanism between these two factors.
Some methodological aspects of our study have to be considered. First, the a priori sample size calculation was based on estimation of the effect size, because of a lack of data regarding CBF and VMCA under general anesthesia in humans. A post hoc calculation showed a statistical power of 99% for the CBF and VMCA (n = 10, α error probability = 0.05; effect size CBF of 2.3 and effect size VMCA of 2.6).
Furthermore, the type of anesthesia may have potential influence on the results of our study. Induction of anesthesia with fentanyl and midazolam leads to a moderate, but proportional reduction of CBF and cerebral metabolism. 14 The cerebrovascular CO2-R in our patients favorably compared with data in conscious patients. Although we thus have no reason to assume, that intravenous anesthesia with fentanyl and midazolam per se may have affected the PCO2-induced changes in CBF and VMCA in our patients, the results of this study cannot a priori be extrapolated to other types of anesthesia.
Similarly, the external validity of our data could be limited by the fact that our patients were experiencing coronary artery disease and concomitant asymptomatic cerebrovascular disease cannot completely be excluded despite normal cerebrovascular CO2-R. Therefore, the conclusions from our study results should be limited to this patient population.
Another possible limitation of our study may arise from the linear extrapolation method of ABP and VMCA, which has been used to estimate ZFP. During variation of PaCO2 capacitance effects of the middle cerebral artery may have changed, which in turn may have impaired the accuracy of our extrapolation of ZFP. The effects of hypocapnia and hypercapnia on MCA compliance have not yet been investigated. However, the linearity of pressure–flow velocity relationships have not been influenced by PaCO2 in a prior investigation and potential effects on compliance are thus assumed to be of minor methodological importance. 5
The Kety-Schmidt method has been considered a reference method for estimating global CBF.12,43 In contrast to positron emission tomography or single-photon emission computed tomography, the Kety-Schmidt technique is largely independent of assumptions regarding tracer kinetics, but might slightly overestimate global CBF in case of incomplete cerebral tracer saturation. Because of the crossover design of our study, a slight systematic overestimation of CBF has minor importance for the interpretation of hemodynamic changes.
CONCLUSIONS
Hypocapnia-induced reduction in CBF under general anesthesia is caused by both, an increase in CVR and a decrease in CPPe, as a consequence of an increase in ZFP. The increases in CVR and RAP associated with hypocapnia were concordant. Nevertheless, correlation analysis showed only a weak linear relationship. Using the RAP as an index of CVR has thus limitations. The cerebrovascular CO2-R of VMCA was lower when compared with CBF. The most probable explanation is that changes of PaCO2 do not only cause changes in vascular diameter at the arteriolar level but might also cause minor changes in MCA main trunk diameter, resulting in a slight systematic difference between relative changes in flow and flow velocity.
AUTHOR CONTRIBUTIONS
AW and Hans Sonntag (see above) designed the study and were responsible for the whole study project. AW, FG, and SK carried out the study. All authors interpreted the results. FG and AW wrote the manuscript. SK, RJS, and GHV gave important intellectual input and revised the manuscript. All authors take full responsibility for the content of the paper.
AVAILABILITY OF DATA AND MATERIALS
On request we will make used materials, data, and associated protocols available in a publicly accessible database
DISCLOSURE/CONFLICT OF INTEREST
The authors declare no conflict of interest.
Footnotes
ACKNOWLEDGMENTS
The authors gratefully thank Sanne Hoeks, Ph.D. (Clinical Epidemiologist, Department of Anesthesiology, Erasmus MC, 3000CA Rotterdam, The Netherlands) for her expert advice in statistical analysis. This article is dedicated in memoriam to our teacher, colleague, and friend Professor Hans Sonntag, who considerably contributed to the concept of this study and died in 2011.