
Abstract
There is currently a great interest to combine electroencephalography (EEG) and functional magnetic resonance imaging (fMRI) to study brain function. Earlier studies have shown different EEG components to correlate well with the fMRI signal arguing for a complex relationship between both measurements. In this study, using separate EEG and fMRI measurements, we show that (1) 0.1 ms visual stimulation evokes detectable hemodynamic and visual-evoked potential (VEP) responses, (2) the negative VEP deflection at ∼80 ms (N2) co-varies with stimulus duration/intensity such as with blood oxygenation level-dependent (BOLD) response; the positive deflection at ∼120 ms (P2) does not, and (3) although the N2 VEP–BOLD relationship is approximately linear, deviation is evident at the limit of zero N2 VEP. The latter finding argues that, although EEG and fMRI measurements can co-vary, they reflect partially independent processes in the brain tissue. Finally, it is shown that the stimulus-induced impulse response function (IRF) at 0.1 ms and the intrinsic IRF during rest have different temporal dynamics, possibly due to predominance of neuromodulation during rest as compared with neurotransmission during stimulation. These results extend earlier findings regarding VEP–BOLD coupling and highlight the component- and context-dependency of the relationship between evoked potentials and hemodynamic responses.
Keywords
Introduction
Human brain function can be noninvasively studied with imaging techniques such as functional magnetic resonance imaging (fMRI) and electroencephalography (EEG). The most commonly used fMRI approach reports signal changes coupled to alterations in neuronal activity through a complex set of mechanisms, the most dominant of which is blood oxygenation level-dependent (BOLD) contrast (Ogawa et al, 1990). The BOLD signal reflects alterations in paramagnetic deoxy-hemoglobin content in tissue. The spatial resolution of fMRI is typically on the order of tens of mm3 while its temporal resolution is in the second range (Buxton et al, 2004; and references therein). This is rather slow compared with changes in neuronal activity, for example, in the form of spiking activity (Logothetis, 2008). The EEG signals, on the other hand, noninvasively reflect changes in the electrical activity of brain tissue with a millisecond time resolution. Thus, earlier studies have combined EEG and fMRI measurements (1) to obtain more precise temporal information from fMRI responses (Bonmassar et al, 2001; Mulert et al, 2004); (2) to constrain potential source locations for EEG source reconstruction (Bonmassar et al, 2001; Debener et al, 2005; George et al, 1995); or (3) to quantitatively investigate EEG–BOLD coupling (for a review see Ritter and Villringer (2006)). However, although there is great interest in combining EEG and fMRI, the exact relationship between their respective signals remains elusive.
To investigate the relationship between evoked potentials and BOLD responses, use of short duration stimuli might be advantageous. In an earlier study also using ultrashort stimulation, we have shown that vascular nonlinearities are reduced and cannot account for most of the nonlinearities in the BOLD response (see Yesilyurt et al (2008) for details). Additional confounding factors caused by longer lasting stimuli, such as neuronal adaptation (Logothetis et al, 2001), are also minimized by applying brief stimulus pulses. Apart from these advantages, stimuli of very short duration allow to study the characteristics of the impulse hemodynamic response function.
Earlier studies have suggested that visual-evoked potential (VEP) amplitudes are linearly correlated to the magnitude of the BOLD response (see Kashikura et al (2001)). Studies both in humans and rats have reported a linear relationship between somatosensory-evoked potential (SEP) amplitude and the BOLD response (Arthurs and Boniface, 2003; Ogawa et al, 2000). In contrast, a nonlinear relationship between EEG and fMRI measurements has also been reported (Zhang et al, 2008a, b ). (In this paper, the term ‘linearity’ is used to describe a linear relationship over the whole range of stimulus durations/intensities. Linearity over the whole range, hence, has to fulfill two conditions: data has to be described with a single slope only and a zero intercept. If the data can be described with a single slope but with a nonzero intercept, we define this as ‘partial linearity’ or ‘nonlinearity.’ Note that in many other studies, the term ‘linearity’ only has to fulfill the first condition.).
Using two pulse stimuli with varying inter-stimulus-interval, Zhang et al showed that if a threshold model used to fit the VEP and CBF/BOLD responses, the intercept would be slightly negative although the low SNR does not allow resolving this issue (Zhang et al, 2008a). Thus, that study suggested that CBF might not have been evoked (Lauritzen, 2005) or even decreased by small increases in neuronal activity. Logothetis et al, in contrast, observed that reducing the contrast of the visual stimuli yielded reduction in both BOLD response and cortical EEG (local field potential or ‘LFP’) measured invasively in macaque monkeys (Logothetis et al, 2001). However, at the limit of zero LFP, the intercept of the BOLD response remained at ∼50% of its peak response (Logothetis et al, 2001). To explain this finding, the authors proposed the existence of a minimal hemodynamic response. A ‘minimal hemodynamic response’ might be induced by a noncontinuous dilation of arteriolar smooth muscles if a threshold of vasodilatory chemical agents has to be exceeded to activate those muscles. However, this noncontinuous vasodilation has never been directly observed but indirectly inferred from combined electrophysiology and hemodynamic data (Pfeuffer et al, 2003; Logothetis et al, 2001). In summary, although there is strong evidence for a close coupling between hemodynamic response and various electrophysiological measures of neuronal activity, no consistent picture arises concerning the manner in which evoked potential components are related to the BOLD signal.
Thus, in this study, ultrashort stimulus durations (Yesilyurt et al, 2008) were used and hemodynamic and VEP responses were recorded sequentially (1) to explore the quantitative relationship of EEG and fMRI responses, (2) to investigate whether a minimal hemodynamic response is present, and (3) to determine the stimulus-evoked impulse response function (IRF) and compare with IRF of spontaneous activity. The findings of this study suggest that although fMRI measurements and EEG recordings can co-vary under certain stimulus conditions, the relationship between specific EEG oscillations or event-related potential (ERP) components and BOLD response can change for different stimulation as some processes in the tissue might preferentially affect EEG data or BOLD signal.
Materials and methods
Subjects and Set-Up
Nineteen healthy human volunteers participated in the study (age range, 21 to 34, 11 women and 8 men). All volunteers provided informed consent in accordance with the guidelines of the local ethics committee of the University of Tübingen. For ultrashort visual stimulation, custom-built light-emitting-diode goggles were used. Because of their fast rise/decay time, stimulus duration could be controlled with submillisecond accuracy. The construction and features of the experimental set-up have been described in detail elsewhere (Yesilyurt et al, 2008).
Study Design
In experiment 1, on 13 subjects, stimulus intensity (SI) was kept constant (1000 cd/m2) whereas stimulus duration (SD: 0.1, 1, 3 and 5 ms) was varied. All SD were easily perceivable by the subject. (Below the retinal integration time (∼30 to 50 ms), the threshold for the perception of a visual stimulus does not only depend on stimulus duration but on the product of stimulus duration and intensity.) In each run, subsequent to a 30 secs resting period, 12 stimuli of the same duration with randomized inter-stimulus-intervals (30 to 35 secs) were presented to the subjects in a darkened scanner room. The choice of long inter-stimulus-intervals prevents neuronal as well as hemodynamic refractory effects (Cannestra et al, 1998; Huettel and McCarthy, 2000) and nonlinearities caused by slow recovery of post-stimulus undershoot (Buxton et al, 2004). To assess the reproducibility of the responses between sessions, two runs for each stimulus condition were carried out.
In experiment 2, on 11 subjects, the stimuli were all of the same duration (5 ms) but of different intensities (20, 50, 100, 250, 500 cd/m2). Each fMRI session started with a resting period of 30 secs and consisted of 16 stimuli of the same type. The intervals between successive stimuli were randomized between 30 and 35 secs, to prevent coherent summation of vascular oscillations.
In all experiments, subjects were instructed to keep their eyes open and minimize eye movements. Further, to retain the attention of the subjects, they were instructed to count the number of stimuli they perceived during the experimental session and report this number at the end of the session. The order of the sessions for different stimulus conditions was randomized within and across subjects.
In experiment 1, data of three subjects were excluded from further analysis: on one subject large motion artifacts were detected, two subjects reported constantly much less number of stimuli than presented. In few cases, individual experimental sessions were repeated, if the subjects reported fewer stimuli than ∼75%.
In addition to fMRI measurements, for all experimental conditions, nonsimultaneous EEG measurements were performed on the same subjects. A total of 400 stimuli were presented for each stimulus condition with an inter-stimulus-interval of 1.5 secs, yielding a sufficient number of trials required for VEP analysis (Odom et al, 2004). The ERP experiments were performed nonsimultaneously but on the same subjects for the following reason: to get a reliable ERP, typically, the paradigm has to be repeated few hundred times to have enough SNR, whereas for fMRI few repetitions are sufficient. However, for fMRI the inter-stimulus-interval has to be ∼20 secs or more to avoid overlapping hemodynamic responses. Using the same inter-stimulus-interval for the EEG experiments would lead to an EEG experimental time too long for human subjects (e.g. 30 secs × 400 = 12,000 secs = 200 mins). As a simple visual stimulus as used in this study evokes reproducible ERP and BOLD signal responses, it is also not necessary to perform both experiments simultaneously (see for a recent review Laufs et al (2008)).
Data Acquisition
Functional magnetic resonance imaging:
The MR images were acquired on a 3T TIM-Trio scanner equipped with a 12-channel head coil (Siemens, Erlangen, Germany). A T2* weighted gradient echo EPI sequence was used for functional measurements. The sequence parameters were TR = 500 ms, TE = 35 ms, FOV = 20 × 20 cm2, matrix size = 64 × 64, slice thickness = 3.5 mm, 7 slices. In addition, a high-resolution MPRAGE anatomical image with voxel-size = 1 × 1 × 1 mm3 was acquired. To minimize movements, foam pads were placed on both sides of the head.
Electroencephalography:
The EEG was recorded using three occipital channels (Oz, O1, and O2) from a 64-channel sintered Ag/AgCl electrode cap (BrainProducts, Gilching, Germany). As most of the VEP sources are located within the visual cortex, the electrodes chosen can be compared with the fMRI time courses in early visual cortex regions of interest (ROI). Recordings were performed in an electrically shielded room using BrainAmp MR plus amplifier (BrainProducts). Electrode placement followed the international 10 to 20 system, and the electrodes were referenced to a frontal central electrode. An electrode placed at AFz was used as the common ground. Electrode impedances were kept below 15 kΩ. Eye movements were recorded using an electrooculogram with an electrode placed over the outer canthus of the right eye. The EEG readings were online high-pass filtered with 10 secs time constant and digitally recorded at 5000 Hz together with a 50 Hz notch filter and stored for off-line analysis.
Data Analysis
Functional magnetic resonance imaging:
The FMRI data were analyzed using FSL software (Smith et al, 2004) (http://www.fmrib.ox.ac.uk/fsl) and in-house MATLAB (The MathWorks, Natick, MA, USA) routines. Data were motion-corrected with the MCFLIRT tool of FSL using the mean volume as reference. Within each experiment, motion-corrected datasets of all runs were registered to a reference dataset (experiment 1: the run with 5 ms SD; experiment 2: the run with 500 cd/m2 SI). To remove slow drifts, data were high-pass temporal filtered (50 secs). Low-pass temporal filtering and spatial smoothing were not applied.
Functional activation maps were created using a standard γ-variate function (σ = 2.4 secs, peak delay = 5 secs) and its first derivative as regressors in the general linear model in the FEAT tool of FSL. On the activation map of the reference datasets, 50 voxels with highest z-scores were selected as ROI—in an earlier study, we have shown that selecting a greater number of voxels (e.g. 75, 100 voxels) within the same brain region merely gives rise to subtle quantitative but not qualitative differences (Yesilyurt et al, 2008). Single trial time courses were extracted and averaged within the ROI for each subject and stimulus condition. As all datasets within each experiment were co-registered, the same voxels were consequently chosen for all datasets.
Whenever data were normalized (see Results section), response time courses were normalized to the mean peak amplitude of the run with 5 ms SD in experiment 1 or the run with 500 cd/m2 SI in experiment 2, respectively. The positive response integral was calculated as the product of full-width-at-half-maximum and peak values of the BOLD response. (Using the peak amplitude instead of the integral of the BOLD response affects the results only quantitatively but not qualitatively (data not shown).) The post-stimulus undershoot integral was defined as the sum of BOLD signal values within the post-stimulus time interval 8 to 20 secs. These integrals were again normalized to the corresponding value of the same stimulus condition, which was used for normalization of the positive response. In addition, a post-stimulus undershoot index (PSUI) was calculated by dividing the post-stimulus undershoot by the positive response integral.
Electroencephalography:
Post-processing of EEG data were performed using Vision Analyzer software (Brain Products). On the basis of the onset triggers recorded during the experiments, EEG epochs—from -100 to 500 ms—were extracted from continuously recorded data.
A band-pass filter within the range 1 to 45 Hz was applied. Electrooculogram artifacts—trials with amplitude exceeding ± 75 mV—were detected and eliminated from further analysis. From a total of 400 sweeps, artifact rejection processing yielded at least 320 valid sweeps for each subject and stimulus condition. Segmented data were baseline-corrected using the baseline time range from -100 to 0 ms. Trials were averaged for each channel individually. Across subjects, two reproducible VEP deflections were obtained: a negative response occurring 78.9 ± 7.7 ms (mean ± s.d.; across subjects and stimulus conditions) after stimulus onset and a positive peak occurring at 121.6 ± 11.9 ms. They were referred to as N2 and P2 (Odom et al, 2004), respectively, and were identified as the peak negative and positive deflections occurring in the intervals from 50 to 100 ms and from 100 to 150 ms after stimulus onset. (As the recovery to baseline for P2 VEP component could not be defined unambiguously and the integral of N2 VEP gives qualitatively rise to the same results, the peak ERP amplitudes instead of the integral were used (data not shown).). The amplitude of N2 and P2 VEP components were normalized using the same reference datasets as in fMRI analysis.
Experiment to study impulse response function of spontaneous activity:
To assess resting state IRF and compare it with the stimulus-evoked IRF as measured in experiment 1, we performed an additional experiment on one subject recording simultaneously fMRI and EEG data, while the subject was resting in the scanner with eyes closed. Same EEG set-up and EEG and fMRI pre-processing as in the earlier experiments were used. Using FFT, spectrograms were created and averaged over occipital channels (O1, O2, and Oz). Time course of the averaged spectrum and averaged BOLD signal in the early visual cortex, together with motion and cardiac phase regressors (created using RETRICOR tool implemented in AFNI: http://afni.nimh.nih.gov/afni) were used to generate resting state IRF (using deconvolution tool implemented in AFNI; 3dDeconvolve). Shortly, 3dDeconvolve tool uses a sum of scaled and time-delayed versions of the input time series to estimate the IRF of the system (http://afni.nimh.nih.gov/afni/doc/manual/3dDeconvolve).
Results
Figure 1 illustrates group functional activation map (experiment 1, SD = 5 ms, corrected for multiple comparisons P < 0.05) overlaid on a standard MNI image. Functional activation is located for all stimulus durations in and around the calcarine fissure. Very similar activation map was observed also in experiment 2 (data not shown). For each SD in experiment 1, there were two experimental sessions to investigate the reproducibility of the BOLD response across sessions. Figures 2A and 2B show average normalized BOLD time courses (the same voxels for the two different sessions) from the two separate sessions. Correlation coefficients between the BOLD response time courses were calculated for each subject and stimulus condition individually. For 0.1 ms stimulation, the mean correlation coefficient was 0.75 ± 0.12 (mean ± s.e.). With increasing stimulus duration, the correlation coefficient and, thus, reproducibility, increased as well: for 3 and 5 ms to 0.79 ± 0.12 and 0.86 ± 0.08, respectively.
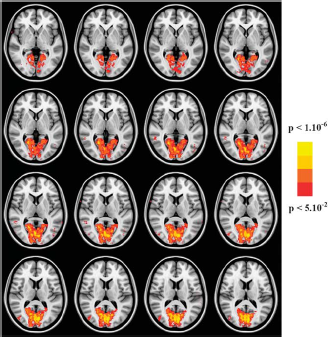
Color-coded activation maps (stimulus duration 5 ms, corrected for multiple comparisons P < 0.05) overlaid on a standard MNI image obtained from group analysis across subjects. Activated voxels were accumulated around the calcarine sulcus. Similar activation maps were generated also at shorter stimulus durations and in experiment 2 at different stimulus intensities (data not shown).
To illustrate the reproducibility from the two separate runs, signal intensity values on the average time courses at each time point (time interval from 0 to 15 secs) were plotted (Figure 2C)—different colors depict different stimulus durations. Positive responses are shown in the upper right (light colors) and post-stimulus undershoots in the lower left field (dark colors). Linear regression analysis yielded a slope of 0.994 and an R2 value of 0.975, indicating good correspondence not only between response amplitudes/integrals but also in the response dynamics of the two separate sessions.
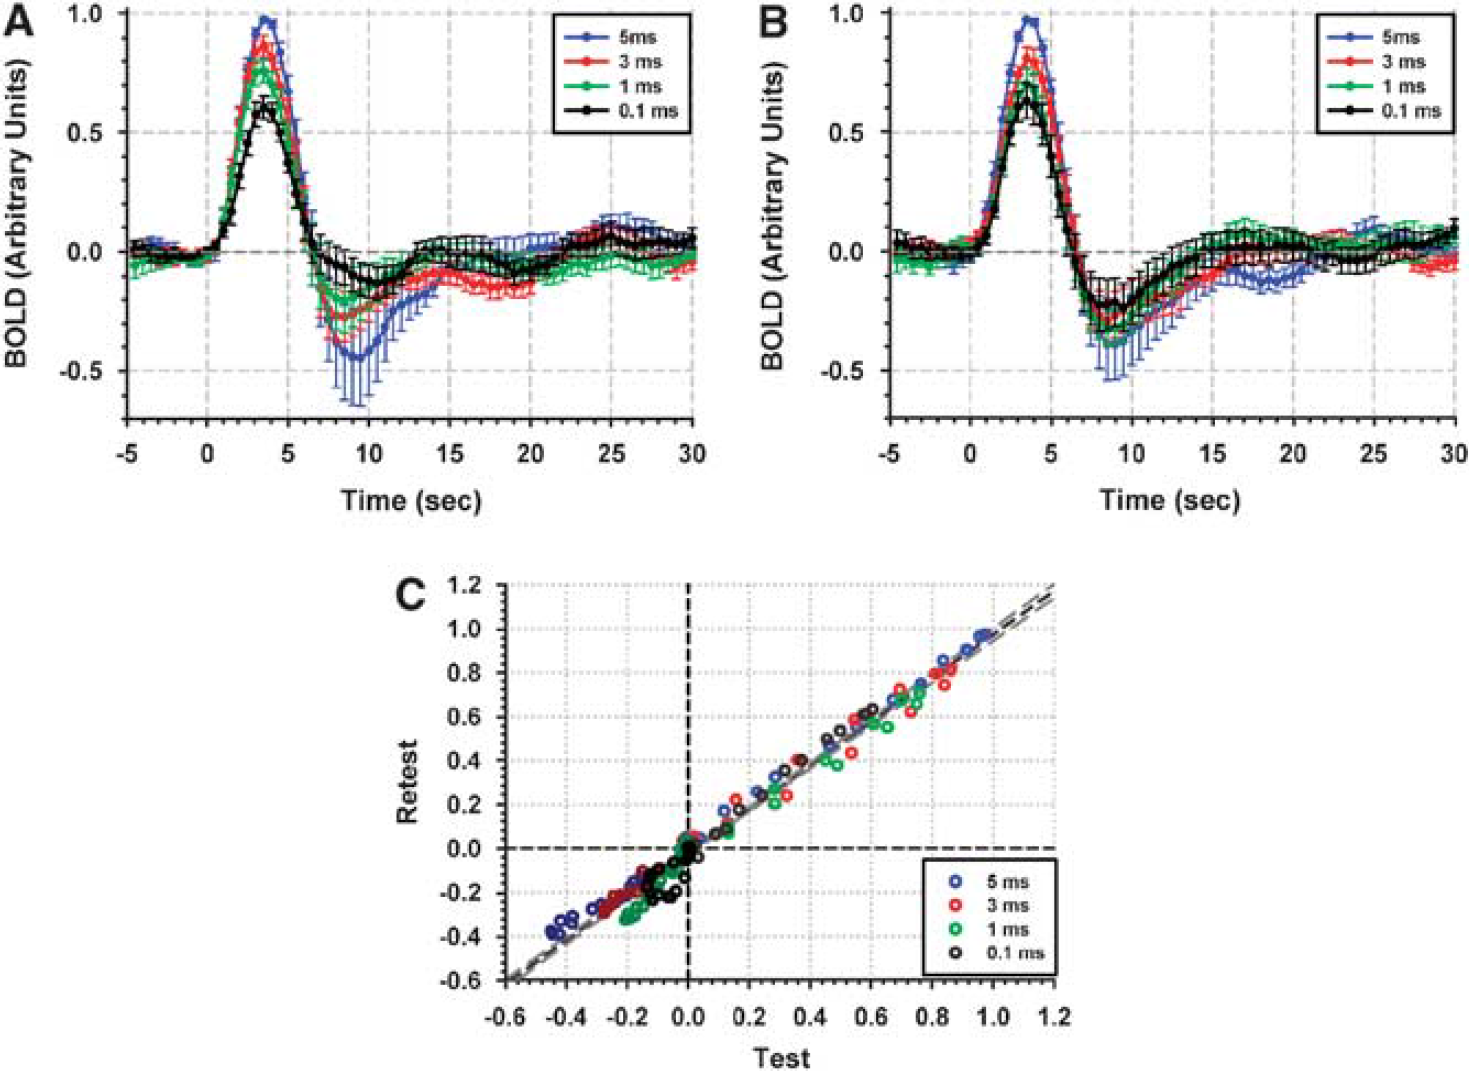
For each stimulus duration, two independent experimental sessions were held to investigate reproducibility of responses. Mean BOLD time courses (averaged across subjects) were normalized to the peak amplitude of a 5 ms stimulus response (ROI was created from mean activation of 5 ms stimulus responses from two different sessions). Normalized time courses for test and retest sessions are presented in (
Increases in stimulus duration were associated with increases in peak positive and post-stimulus undershoot amplitudes. The peak amplitude of the mean hemodynamic response to a 0.1 ms stimulus was ∼ 1.5%. The BOLD signal exhibited a peak delay of ∼ 4 secs. The peak amplitude varied from ∼0.6% to 2.8% across subjects. For a 5 ms stimulus, peak response amplitudes were between 1.1% and 4.3%; significantly larger than the responses for 0.1 ms (P < 10−4). Decreasing stimulus duration yielded decreases in post-stimulus undershoot (see Figures 2A, 2B, and 4A). The BOLD responses also exhibited a slight overshoot and small oscillations after resolution of the post-stimulus undershoot, which were most pronounced at the shortest SDs: 0.1 and 1 ms.
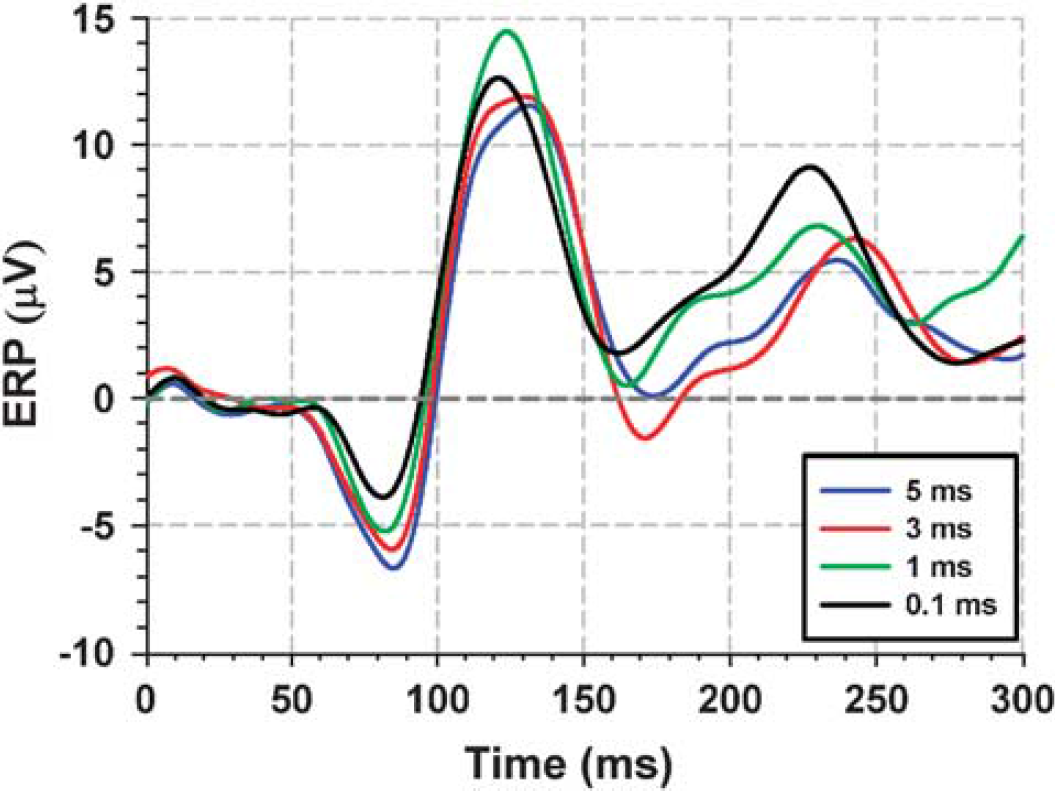
The EEG recordings were performed complementary to fMRI measurements. Visual-evoked potential (VEP) time courses from one representative subject for experiment 1 are shown.
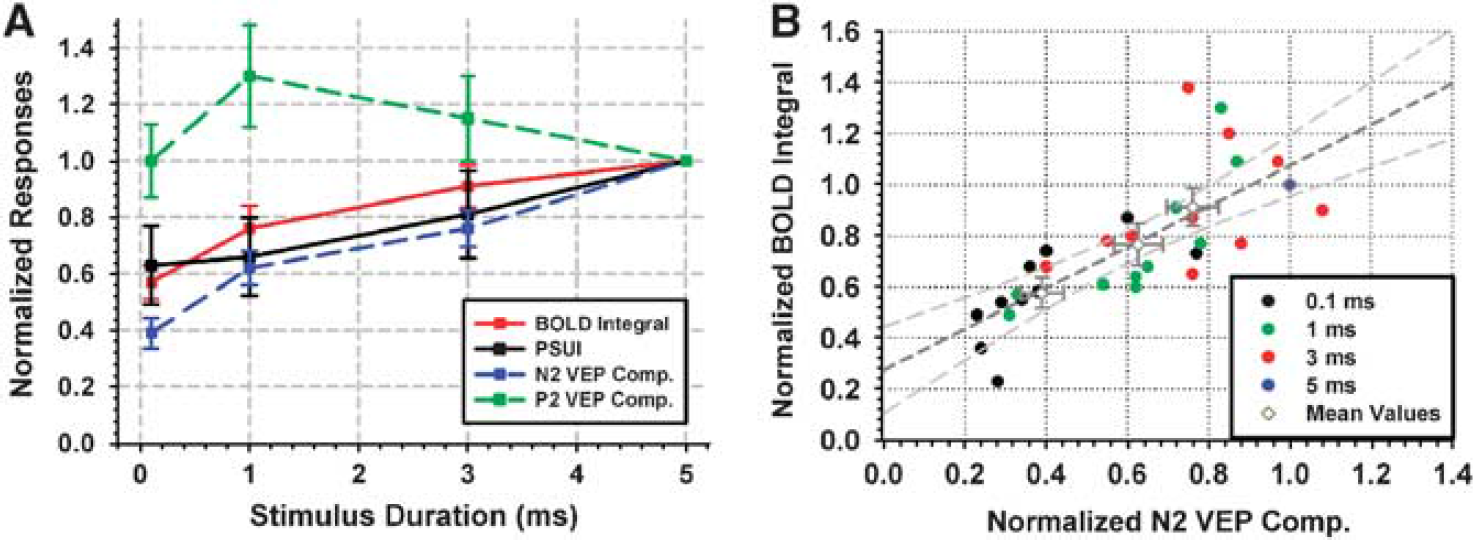
(A) Normalized responses as a function of stimulus duration; red: Positive BOLD integral, black: PSUI: post-stimulus undershoot index, blue: N2 component of VEP green: P2 component of VEP The BOLD signal and N2 VEP responses increase with stimulus duration (P < 0.05). For each subject and stimulus duration, normalized positive integral values are plotted against the corresponding N2 VEP components (
Complimentary to fMRI measurements, EEG recordings at the same stimulus durations were performed. Figure 3 displays ERPs for a representative subject with the electrode located above the posterior part of the occipital cortex (channel O1). (As the peak delay times and VEP response dynamics vary for each subject, averaging VEP time courses across subjects blurs the ERP components making them difficult to observe. Therefore, the ERP time course only for one representative subjects is shown.) Across subjects, two VEP deflections were found to be robust and reproducible: a negative peak (N2) at ∼80 ms and a positive peak (P2) at ∼ 120 ms. As depicted in Figure 4A, the N2 amplitude increased with stimulus duration (P < 0.05). The P2 VEP component, however, was not linearly correlated with SD over the whole range of tested SDs (Figure 4A). However, except for SD = 0.1 ms, there is a negative linear correlation between P2 VEP and SD. In addition, choosing a different ROI in the early visual cortex (e.g. anterior or posterior part of early visual cortex) does not result in a linear correlation between P2 and BOLD signal over the entire range (data not shown). The positive integral of the BOLD response and the amplitude of the N2 VEP component to the shortest stimulus duration (0.1 ms) were smallest, having values of 57% and 39% of the corresponding response to the longest stimulus duration (5 ms), respectively.
Normalized BOLD integral values were consistently greater (P < 10−2 paired t-test) than the normalized N2 VEP amplitudes (Figures 4A and 4B). For example, at 1 ms SD, the N2 and BOLD integral were ∼62% and 76% of the corresponding values at 5 ms SD. Comparisons of N2 peaks and BOLD integrals across stimulus durations are depicted in Figure 4B. A linear regression analysis on N2 VEP and BOLD signal data yielded a linear correlation with a slope of ∼0.8 and intercept of ∼0.275 (R2 = ∼ 0.6) showing that, although a linear correlation was observed over a wide range, the integral of the BOLD response has a positive intercept at the limit of zero N2 response.
Furthermore, shorter duration stimuli caused smaller post-stimulus undershoot changes. To assess relative changes in post-stimulus undershoot compared with positive responses across stimulus conditions, we calculated a PSUI by dividing the post-stimulus undershoot integral by the positive response integral. A constant PSUI indicates that both the positive response and the post-stimulus undershoot are scaled proportionally. It was found that the PSUI shows a trend to increase with stimulus duration (Figure 4A, P>0.05), indicating that the enhancements in the post-stimulus undershoot might be larger compared with the positive response.
In experiment 2, SD was kept constant whereas SI was stepwise altered. Normalized mean time courses (11 subjects) are shown in Figure 5A. Increasing SI elicited larger BOLD responses (P<0.05). As in experiment 1, responses were highly nonlinear over the entire range of SDs, resulting in an integral of the BOLD response to 20 cd/m2 stimulus of about 60% of the response integral to a 500 cd/m2 stimulus, although the intensity of the stimulus was 25-fold (∼ 1.4 log) less. Post-stimulus undershoot was observed under all stimulus conditions. The PSUI exhibited an increasing trend, as in experiment 1 (Supplementary Figure 2). Regression analysis indicated a similar linear relationship between N2 VEP peaks and BOLD integrals, as in experiment 1 (Figure 5B). The slope of the linear regression curve was ∼0.83 and the intercept ∼0.15 (for the intercept: P> 0.05). Again, no significant positive or negative linear correlation between P2 peaks and SI was found (R2 = ∼0).
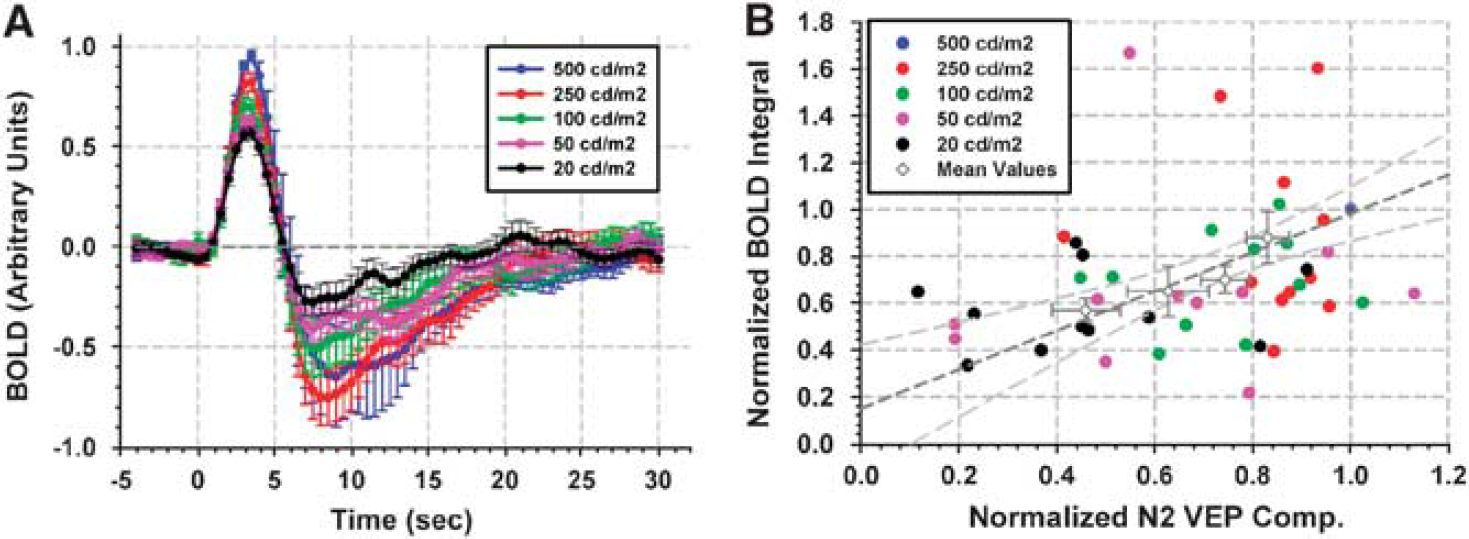
In experiment 2, SI was stepwise altered with a constant stimulus duration. (
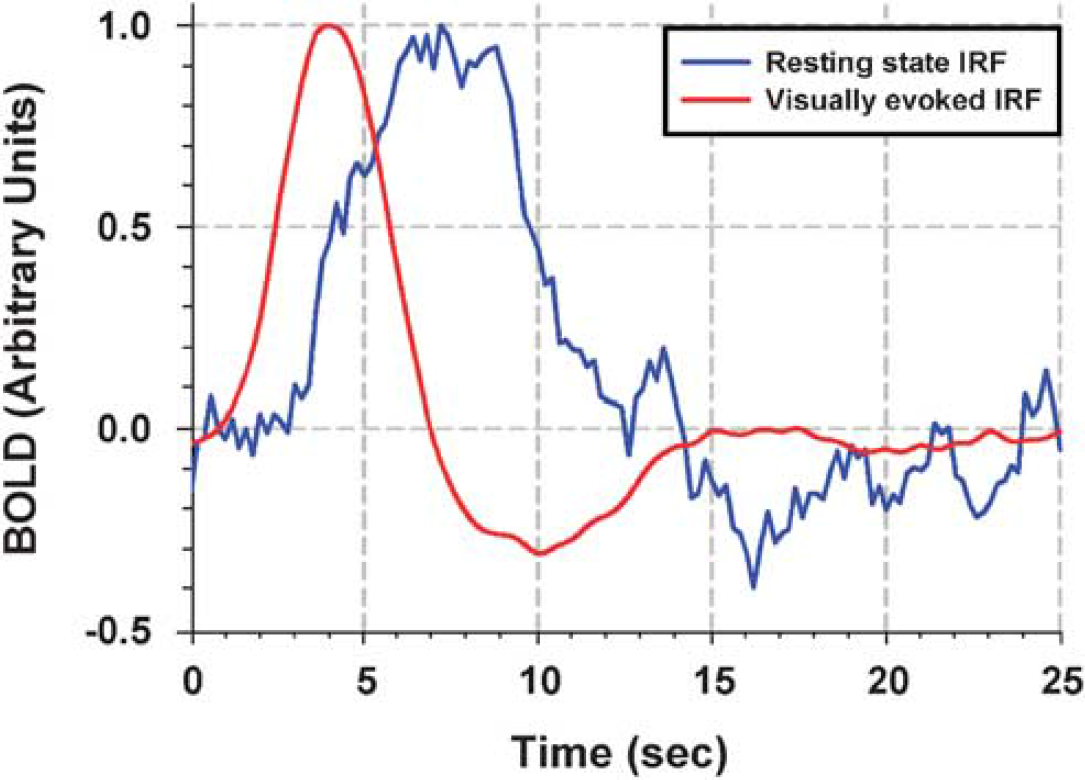
Comparison of intrinsic and stimulation-induced IRFs. Red line represents the hemodynamic response to 0.1 ms stimulus; blue line represents the resting state hemodynamic response function. Resting state hemodynamic response function was derived from one subject. Simultaneous EEG-fMRI data were recorded, while subject was resting in the scanner with eyes closed.
Intrinsic and visually evoked IRFs are shown in Figure 6. Intrinsic IRF was found to have much slower time course than externally induced hemodynamic response: for external and intrinsic IRF, time-to-peak values were ∼4 and 8 secs, time-to-onsets were ∼1.6 and ∼3.5 secs and FWHM values were ∼3.2 and ∼5.6 secs, respectively.
Discussion
Combining EEG data with fMRI to study brain function during stimulation and rest is becoming increasingly popular. The results of many studies regarding EEG-BOLD signal relationship are, however, inconsistent suggesting that the relationship might be variable as a function of stimulus design and subjects. In this study, our aim was to investigate VEP–BOLD signal relationship using ultrashort stimulus durations to answer the following questions: (1) Which VEP component is most closely related to the BOLD signal? (2) Does the correlation of this specific component hold for the entire range of stimulus durations? (3) Is the IRF the same for external stimulation and internal spontaneous activity? In general, the results indicate that the EEG-BOLD signal relationship is highly dependent on the context.
Visual-Evoked Potential/Blood Oxygenation Level-Dependent Response Dynamics
Robust VEP and BOLD responses to visual stimulation of 0.1 ms duration were observed which is, to our knowledge, shorter than used in any other earlier human visual study. The BOLD response time course showed very similar characteristics to those using longer stimulus durations. It started increasing ∼ 1 secs after the cessation of stimulus presentation and reached its peak value at ∼ 4 secs followed by an undershoot lasting up to ∼ 15 secs (Figures 2A–B). A strong correlation between BOLD response time courses from two different sessions was observed (Figures 2A–2C). The latter result extends the finding of Aguirre et al (1998), showing high reproducibility of the BOLD response within subjects for longer stimulus durations. The EEG also exhibited a characteristic tri-phasic response, although two deflections were particularly robust and reproducible across subjects; a negative deflection at ∼ 80 ms (N2) and a positive deflection at ∼ 120 ms (P2) (Figure 3). In contrast to the earlier study (Yesilyurt et al, 2008), no initial dip was detected, which may probably be attributed to (1) shorter stimulus duration (200 times shorter) and (2) lower intensity (∼45% lower).
Link between Blood Oxygenation Level-Dependent Signal and Visual-Evoked Potential
The link between hemodynamic responses and underlying neuronal activity has been investigated earlier using intracranial electrical recordings and fMRI measurements in both animals and humans (Logothetis et al, 2001; Mukamel et al, 2005; Ogawa et al, 2000). The study by Logothetis et al (2001) revealed that changes in visually evoked LFPs are linearly correlated to the BOLD response. Similarly, earlier rat studies had shown a close relationship between somatosensory-evoked responses (SEPs) and BOLD amplitude (Ogawa et al, 2000). However, because of its invasive nature, intra-cortical measurements are not suitable for studies in healthy human subjects. Instead, EEG measurements recorded with the electrodes located at the surface of the scalp can complement fMRI acquisitions, thus providing deeper insights into the relationship between neural and hemodynamic activity in the brain (Arthurs and Boniface, 2003; Kashikura et al, 2001; Wan et al, 2006; Zhang et al, 2008a, b ). Similar to the invasive electrophysiology findings, human studies have shown a close relationship between BOLD responses and SEPs as well as VEPs. In agreement with these results, within the stimulus duration interval from 0.1 to 5 ms, the N2 VEP component is linearly related to the BOLD response (Figure 4B) albeit none of these responses is a linear function of stimulus duration and/or intensity over the entire range. However, unlike the N2 VEP component, the P2 component did not linearly correlate with the BOLD response. In addition, fMRI activation maps show that in response to brief light stimuli, most of the activated voxels are located in the primary visual cortex (Figure 1). This is in agreement with a similar study where it was reported that the early VEP component is localized closer to the V1 BOLD response than the later VEP component (Whittingstall et al, 2007, 2008). On the other hand, other studies have shown that different evoked potential deflections correlate best with the BOLD response, for example, P3a is related to BOLD signal changes in the right fusiform and left superior temporal gyrus for a facial emotion recognition task (Johnston et al, 2005); N170 for face and house visual stimuli have been found to correlate well with hemodynamic responses in various brain areas in the temporal-occipital lobes (Iidaka et al, 2006); and N400 and BOLD signals were linked in the superior temporal gyrus for a semantic priming task (Matsumoto et al, 2005). Taken together, these findings imply that certain EEG components may correlate better with BOLD than others. Moreover, the relationship of these components and the BOLD response may vary according to the experimental paradigm used. This argues that the ERP-BOLD signal relationship is elusive. In other words, the BOLD signal is thought to be sensitive on the metabolic aspects of tissue activity. In contrast, ERP is sensitive to the temporal coherence of neuronal activity from a subset of the neuronal population. In addition, simultaneous excitation and inhibition on the same neurons might not yield any detectable EEG response but might be associated with a BOLD signal response. Therefore, depending on the stimulus type, the coherent summation of neuronal activity might yield a different ERP component being most associated with tissue metabolism and, hence, most correlated with the BOLD signal.
Positive Blood Oxygenation Level-Dependent Response at the Limit of Zero Visual-Evoked Potential Amplitude
The data presented in this paper exhibited a positive BOLD signal intercept at the extrapolated limit of zero N2 amplitude (Figures 4B and 5B). The SNR of both ERP and the BOLD signal is high enough to allow a reliable fit of the data; the explained variance is 60%. Thus, the positive intercept cannot be explained by low SNR (see also Figure 5D in Logothetis et al (2001)). In a recent study, Wan et al (2006) showed a positive intercept shift between neuronal efficacy derived from the BOLD response and EEG signals in response to visual stimuli of various frequencies. Other studies have also indicated a positive intercept of the BOLD response at the limit of zero SEP (Arthurs and Boniface, 2003). In contrast to these studies, Zhang et al (2008a, b) reported that at the extrapolated limit of zero VEP (defined as the amplitude of the second positive VEP component) using a two-pulse stimulation paradigm, the intercept of CBF and BOLD response is negative. This would imply that for low neural activity, a negative BOLD signal still has to be observed even if an activity is too small to generate a hemodynamic response. The low neuronal activity would nevertheless consume energy, hence causing an increase in deoxygenated hemoglobin. However, in this study, we did not observe a negative BOLD response even for the shortest stimulus duration. The apparent discrepancy of the studies of Zhang et al to our and the other studies might be caused by the differences in stimulus design used, interaction of VEP responses, and analysis methods, and so on. To resolve this discrepancy, a single stimulus and a two-pulse stimulation paradigm have to be used in the same subjects.
The positive intercept found in this study might be explained by the fact that the EEG and BOLD signal are sensitive to distinct brain physiological processes. The EEG measures changes in electrical potential generated by the synchronous synaptic activity of neuronal populations (predominantly pyramidal cells). In contrast, the BOLD-fMRI technique measures (additional to direct effects of CBV change) the alteration in deoxy-hemoglobin concentration induced by interplay between CBF, and CMRO2 following alternations in neuronal activity (Buxton et al, 2004). The hemodynamic response is correlated (but not causally linked) with changes in oxidative metabolism (Attwell and Iadecola, 2002; Uludag et al, 2004) and, thus, the BOLD signal can be regarded as a marker of the change in the overall metabolic state of a neuroglial population. Nonsynchronuous pyramidal cell activity, symmetrical changes in ion distribution (as has been shown in some types of interneurons, for example, stellate cells (Murakami and Okada, 2006)) and glial activity have only a weak influence on EEG signals measured on the scalp but do consume oxygen and glucose. Therefore, although EEG and BOLD signals can reflect common underlying processes, their responses can be dissociated depending on the experimental paradigm used. For example, interneurons are not organized in the open field arrangement, and do not necessarily give a measurable electrical response. The lack of response is due to the superposition principle that requires certain geometrical arrangements of the dipoles. These arguments might also explain why hemodynamic responses are observed without a measurable electrophysiologal response as in this study and in the study of Sirotin and Das (2009). Thus, in these cases, combining EEG and BOLD signal might provide complimentary information about brain activity not reducible to each other.
The other possible explanation for the positive BOLD signal intercept at the limit of zero N2 VEP (see dark gray regressor in Figure 4B) is the existence of a minimal hemodynamic response, as suggested earlier by Logothetis et al (2001). Using simultaneously recorded BOLD and LFPs in the monkey visual cortex, they found that at the lowest stimulus contrast, the LFP amplitude decreased to almost 0% of its maximum value at the highest stimulus contrast, whereas the BOLD response dropped to only 50% of its maximum value. That is, it was proposed that there is a certain amount of stimulus-independent BOLD response (SIBR) and BOLD signal changes evoked by the applied stimulus are just added to the SIBR. Determining the nonlinearities at different magnetic fields by using visual stimuli of short durations, Pfeuffer et al (2003) have suggested the existence of this kind of ‘switch type’ initial BOLD component. More recently, in the visual cortex of monkeys, it has been shown that an anticipatory signal gives rise to increases in hemodynamic signal without corresponding change in neuronal activity (Sirotin and Das, 2009). In this study, randomizing the inter-stimulus-interval we attempted to minimize such anticipatory effects. However, based on our results alone we cannot rule out that anticipatory effects contribute to SIBR. To probe whether an SIBR independent of anticipatory effect exists, one may have to use even lower intensity and/or shorter duration stimuli than those used in this study.
Impulse Hemodynamic Response Function: Internally Versus Externally Evoked
Using stimulus duration of 0.1 ms, we have assessed the impulse hemodynamic response function induced externally by a (visual) stimulus. Usually, a system is characterized by a single IRF. However, because neuronal activity in the brain is altered by multiple pathways, most importantly by locally specific neurotransmission and a more diffuse neuromodulation, multiple IRFs might exist. Indeed, as has already been shown by Logothetis et al (2009) in macaque monkeys, the IRF to stimulation rises and decays faster than the IRF to spontaneous activity as assessed using invasive electrophysiology during eyes closed. To test whether this is also true in awake human subjects, we performed an additional experiment recording simultaneously fMRI and EEG data, while the subject was resting in the scanner with eyes closed. In this study, intrinsic IRF was found to have much slower time course than externally induced hemodynamic response: time-to-peak values for external and intrinsic IRF were ∼4 and 8 secs, respectively. Earlier, de Munck et al (2007) have shown similar results for the IRF during spontaneous activity.
As indicated above, one possible explanation of the discrepancy between time courses of two IRFs might be the different properties of underlying neuronal events. That is, externally induced IRF might dominantly be caused by faster neurotransmission, whereas slower neuromodulatory effects might underlie the intrinsic IRF for the most part (for a review see Logothetis (2008)). The vascular response might have a contribution from the ascending diffuse systems. Locus coreolus, for example, sends neuromodulatory pulses diffusely in many parts of the cortex regardless stimulus category and sensory modality. Neuromodulation is thought to act less spatially specific than neurotransmission. Thus, the former is also called ‘volume transmission,’ the latter ‘wire transmission.’ Clearly, further studies should clarify which neuronal processes are reflected in the IRF and whether more than two IRFs exist in the brain.
Footnotes
References
Supplementary Material
Please find the following supplemental material available below.
For Open Access articles published under a Creative Commons License, all supplemental material carries the same license as the article it is associated with.
For non-Open Access articles published, all supplemental material carries a non-exclusive license, and permission requests for re-use of supplemental material or any part of supplemental material shall be sent directly to the copyright owner as specified in the copyright notice associated with the article.