
Abstract
Quantification of regional cerebral glucose metabolism (CMRglc) using positron emission tomography and 18F-fluorodeoxyglucose (PET-FDG) requires knowledge of the correction factor between FDG and glucose net clearance, the FDG lumped constant (LC). Because diverging values for LC have been obtained, the authors reevaluated LC by measuring the ratio of the cerebral net extraction fractions of FDG (E*) and glucose (E) from arteriovenous cerebral measurements. Thirty subjects were studied (mean age = 25 ± 4 years): 12 during a programed infusion of FDG and 18 after a bolus injection of FDG. In the infusion study, LC was calculated as the ratio E*/E. In the bolus study, E* was calculated from the slope of a Patlak–Gjedde plot. Lumped constant was significantly smaller in the infusion study as compared with the bolus study (0.48 ± 0.16 vs. 0.81 ± 0.27, P < 0.001). In 4 subjects studied during continuous FDG infusion for 2.5 hours, LC decreased to 0.36 ± 0.11. These results suggest that the “steady-state” method underestimates LC because E* continues to decline because of significant labeled product. Further, the authors provide evidence for resetting of LC toward a greater value. The subsequent resetting of CMRglc provides a physiologically more meaningful estimate and allows for comparison of CMRglc values between different methodologies.
The study of regional cerebral glucose metabolism (CMRglc) in humans became possible with the development of the fluorodeoxyglucose (FDG) method (Reivich et al., 1979), by an adaptation of the autoradiographic method first described by Sokoloff and coworkers (1977). Differences between FDG and glucose in transport across the blood–brain barrier and in affinity to the hexokinase enzyme are incorporated into one correction term, known as the lumped constant (LC). To quantitate glucose brain metabolism, knowledge of the exact value of this constant is essential. Sokoloff and coworkers described a method for calculation of LC in a separate experiment after a step change in arterial DG concentration (Sokoloff et al., 1977). With this method, a value of 0.46 was obtained in the conscious rat, and later, using the same method in humans, Reivich and coworkers found a value of 0.52 (Reivich et al., 1985). The authors acknowledged, however, that because of contamination by labeled mannose, the latter value was underestimated. Another factor that may contribute to the underestimation of LC would be the case of significant dephosphorylation of FDG taking place. Since the study of Reivich et al. (1985), no other direct calculations of LC have been published, but several studies have attempted to calculate LC indirectly by assuming a global CMRglc of 30 μmol 100 g−1min−1(Phelps et al., 1979; Brooks et al., 1987; Kuwabara et al., 1990). Recent evidence suggests that this “gold standard” global CMRglc value is overestimated (Madsen et al., 1993; Hasselbalch et al., 1998), and this would result in a subsequent underestimation of LC. In a recent study, the authors found a ratio of 0.82 between global cerebral metabolic rate of FDG and glucose simultaneously measured by positron emission tomography (PET)-FDG and Fick's principle (Hasselbalch et al., 1998). Therefore, the authors decided to replicate the study of Reivich et al. (1985) and to compare this method with a calculation of LC by measurement of net FDG and glucose clearance obtained in another set of subjects. It was hypothesized that the method of Reivich and coworkers underestimates LC as compared with LC measurements done by comparison of global net uptake rates of FDG and glucose.
MATERIALS AND METHODS
Thirty healthy subjects were studied. Informed consent was obtained from the subjects after the nature of the procedure was explained, and the study was conducted according to the principles expressed in the Declaration of Helsinki II. The study was approved by the ethical committee system of Copenhagen and Frederiksberg, Denmark. Twelve subjects (mean age = 25 ± 4 years, 9 males, 3 females) were studied using the method described by Reivich and coworkers (Reivich et al., 1985), whereas 18 subjects (mean age = 25 ± 5 years, 10 females, 8 males) were studied using a standard PET-FDG setup as previously published (Hasselbalch et al., 1996a; Madsen et al., 1995). In all subjects, catheters were placed in local analgesia in the internal jugular vein, in the radial artery, and in two antecubital veins. The tip of the internal jugular catheter was advanced to the jugular bulb as described previously (Madsen et al., 1995
Determination of LC from infusion of FDG (infusion study)
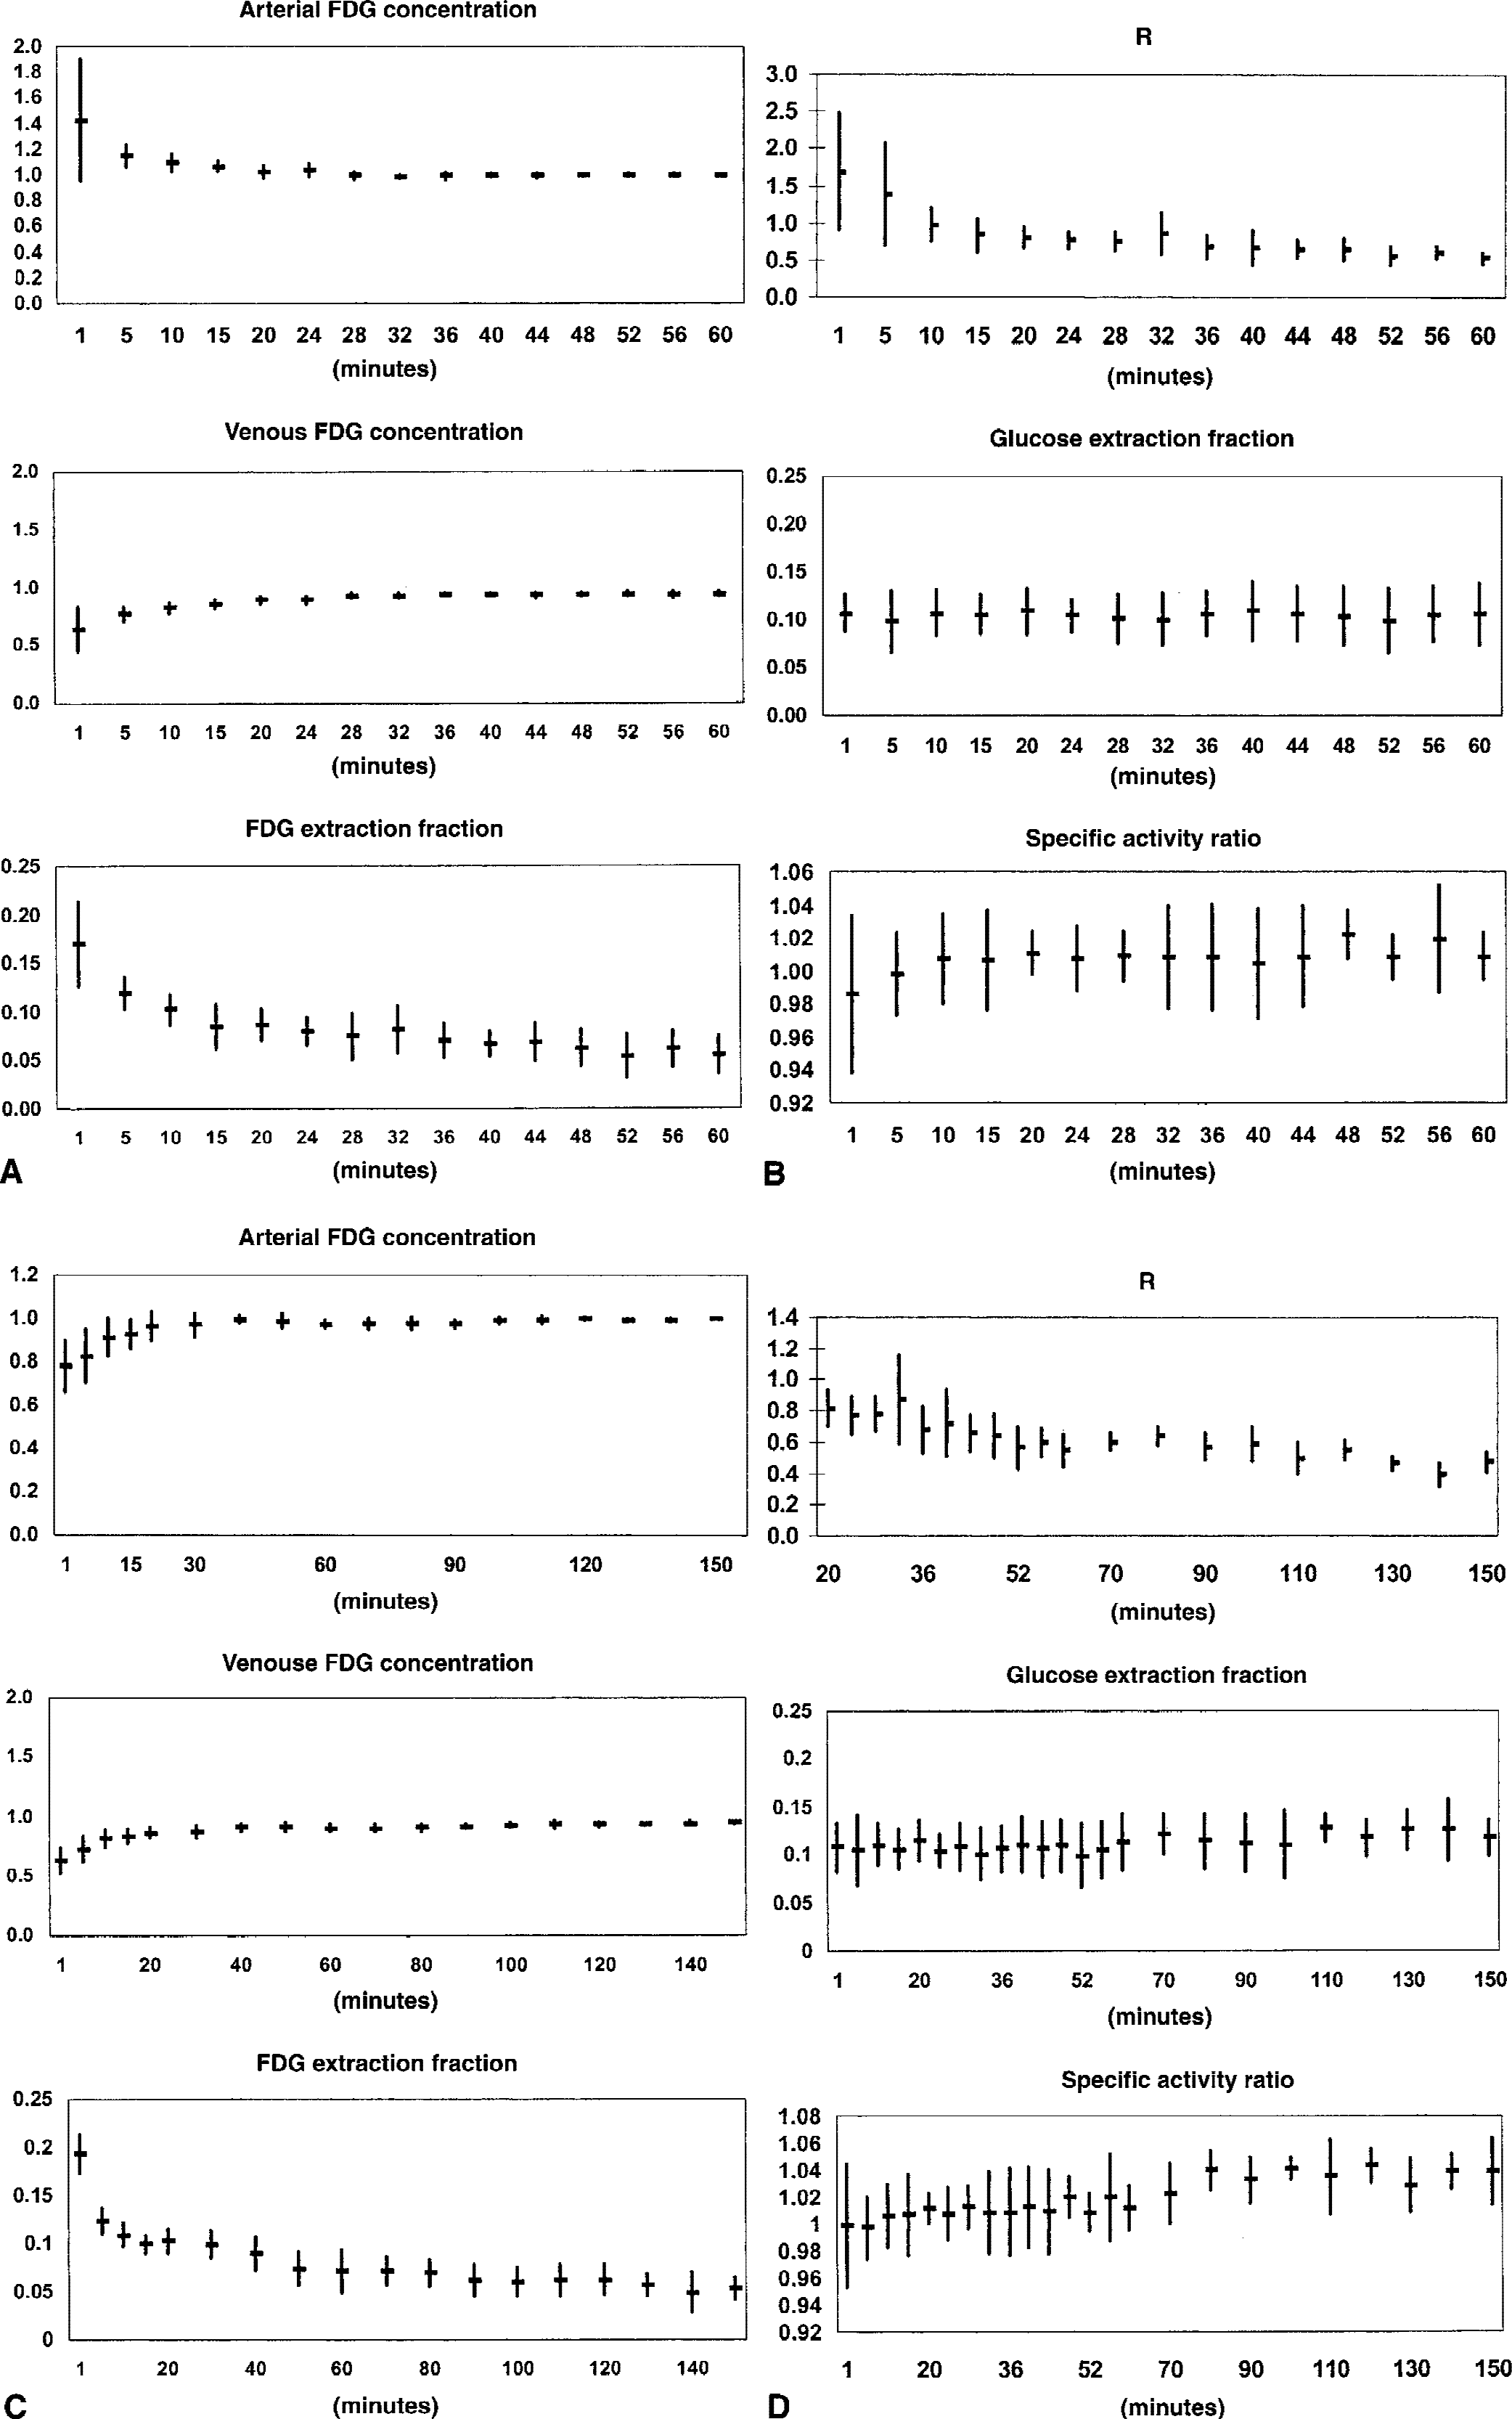
In 12 subjects, using the method described by Reivich et al. (1985), the net extraction of FDG (E*) was determined from steady-state levels of arterial and jugular venous FDG activity obtained by a programed infusion of FDG for 1 hour (infusion study). The method applied in this part of the study was identical to that used by Reivich and coworkers (1985). In a simple two-tissue model in which no dephosphorylation of FDG occurs (k4* = 0), a step change in arterial FDG activity (Ca*) concentration will lead to an increase in the jugular venous FDG activity (Cv*) with a rate equal to the fractional transfer of tracer from the precursor pool (transfer from brain back to blood and phosphorylation of FDG to FDG-6-P (k2* + k3*)). Cv* eventually reaches a steady-state level, equal to (1 − E*) × Ca*, where E* is the net extraction fraction of FDG. E* was calculated from the arterial and jugular venous FDG whole blood concentrations by E* = (Ca* − Cv*)/Ca*, accordingly, the net extraction of glucose (E) was calculated from E = (Ca − Cv)/Ca, where Ca and Cv are arterial and jugular venous whole blood glucose concentrations. A ratio was calculated:

where Cp* and Cp are the arterial plasma concentrations of FDG and glucose, respectively. The last term in Eq. 1 takes into account differences in the ratio between tracer and glucose in whole blood and plasma. After a step change in Ca*, R decreases until it reaches an asymptotic value equal to LC (Sokoloff et al., 1977). The asymptotic level was determined according to Reivich and coworkers (1985) as the y-intercept of a fitted line through the data points from 20 minutes to 60 minutes in a plot with 1/time as the x-axis, and R as the y-axis. In 8 subjects, data points from 20 minutes to 60 minutes were used for fitting, corresponding to the method applied by Reivich and coworkers (1985). To evaluate a potential continuous decline in E*, the programed FDG infusion was extended to 2.5 hours in 4 subjects.
A standard infusion schedule with a priming bolus injection was calculated from previous FDG studies as described by Patlak and Pettigrew (1976). In a 25-mL saline solution, 185 to 200 MBq was dissolved, and 2 mL was given as a bolus followed by an intravenous infusion of the remaining volume over 60 minutes (in 4 subjects, 350 MBq for 150 minutes) using a Braun Perfusor pump (B. Braun, Melsungen AG, Germany). From the radial artery and the internal jugular vein, 2 to 6 mL blood was sampled simultaneously for FDG tracer activity counting (in 9 subjects, the blood sample volume was increased from 2 to 6 mL, to improve the counting statistics), immediately followed by 1-mL samples for measurement of glucose concentration. From start of the infusion to 20 minutes, samples were taken with 5-minute intervals, from 20 to 60 minutes with 4-minute intervals (in 4 subjects studied for 2.5 hours, samples from 20 to 150 minutes were taken with 10-minute intervals). Arterial blood samples were divided into whole blood samples and plasma samples for determination of the specific activities in plasma and whole blood. Blood samples for determination of glucose concentrations were drawn into vials containing fluoride-EDTA, stored on ice, and analyzed in duplicate using a YSI 2300 Glucose Analyzer (Yellow Springs Instrument, Yellow Springs, OH, U.S.A.). Blood for FDG counting was drawn into preweighed and heparinized tubes, and corrected for volume differences by subsequent weighing after determination of activity contents using a COBRA 5003 gamma counter (Packard Instrument, Downers Grove, IL, U.S.A.). Paired samples were consecutively measured for 2 minutes and a broad window of 400 to 1200 keV led to a counting efficacy of 60%.
Determination of LC from bolus injection of FDG (bolus study)
In 18 subjects investigated in standard PET-FDG studies, simultaneous sampling of cerebral arteriovenous FDG and glucose concentrations was performed. In these studies, LC was calculated as the ratio of the net extraction fractions of FDG and glucose (E*/E). Time delay between arterial and venous sampling was corrected for by shifting the venous curve until the peak of the bolus was directly beneath the peak of the bolus in the arterial curve. As FDG was injected as a bolus, E* could not be determined from “steady-state” conditions. Instead, E* was determined from the slope of a Patlak–Gjedde plot (Patlak et al., 1983), where the x-axis is the time integral up to time t of arterial blood tracer concentration (Ca*), divided by Ca*(t), and the y-axis is the brain net radioactivity uptake (Ci*), divided by Ca*. Ci* was calculated as the difference between the time integral of arterial and venous blood tracer concentrations. The Patlak–Gjedde plot thus differed from that normally applied in PET-FDG studies for calculation of CMRglc, where the slope is the net clearance of FDG (K*, mL g−1min−1, equal to E* · CBF (cerebral blood flow)). In the ratio between net uptake of FDG and glucose, CBF cancels out. However, the methodologic problems related to the Patlak–Gjedde plot were common—for example, because of nonlinearity of the Patlak-Gjedde plot, the values for both E* and K* depend on which part of the curve is used for fitting. To evaluate the size of this error, E* was calculated from different parts of the curve.
The ratio between FDG and glucose (Ca*/Ca)/(Cp*/Cp) was not included in this part of the study. Because the ratio calculated from the infusion study reached a mean value of 1.0089 with no significant change over time from 0 to 60 minutes, it was considered of minor importance. The net extraction of glucose (E) was calculated as the mean of 9 to 12 paired blood samples from the internal jugular vein and the radial artery, respectively, taken throughout the study.
After intravenous bolus injection of 185 to 200 MBq FDG, 1-mL blood samples were taken simultaneously from the radial artery and the jugular vein at 10-second intervals from t = 0 to t = 3 minutes, at 20-second intervals from 3 to 5 minutes, at 1-minute intervals from 5 to 10 minutes, at 2-minute intervals from 10 to 20 minutes, and at 5-minute intervals for the rest of the study period. In 8 subjects, blood was sampled for 60 minutes; in the remaining 10 subjects, blood was sampled for 65 minutes. Blood samples were immediately placed on ice, centrifuged, and 500 μL plasma was taken for gamma counting as described above. Plasma glucose concentration was measured using a Beckman Glucose Analyzer (Beckman Instruments, Fullerton, CA, U.S.A.) and corrected to corresponding whole blood values as described previously (Madsen et al., 1995). FDG for all studies was obtained from the Cyclotron Unit at the PET Center, Department of Nuclear Medicine, Rigshospitalet, with a radiochemical purity more than 95%.
RESULTS
The results of the infusion study are shown in Table 1 and Fig. 1. Because of the priming bolus, there was an initial overshoot of the arterial FDG concentration, but in the interval between 20 and 60 minutes, the arterial concentration remained essentially constant with a variation from the value at 60 minutes ranging from 98.3% to 103%. As expected, the venous FDG concentration slowly rose, and the resulting arteriovenous difference, expressed as E*, decreased from the initial high extraction of FDG because of equilibration of blood and brain pools of FDG toward a slower but continuous decline (Table 1, Fig. 1A). This is illustrated in Table 1, where E* averaged over different time intervals decreased with increasing time. Even in the last time interval, the slope of a regression line fitted through data points in the last time interval was negative and statistically significantly different from zero (−0.0003 ± 0.0001, P < 0.02). Consequently, as the net extraction of glucose remained constant, R calculated from E and E* decreased as shown in Fig. 1B. Lumped constant calculated from the “asymptotic” value of R in the time interval 20 to 60 minutes, as described by Reivich and coworkers (1985), was 0.48 ± 0.16.
Infusion studies of 60
The FDG lumped constant determined from “steady-state” net extraction fractions of FDG and glucose after infusion of FDG (infusion study)
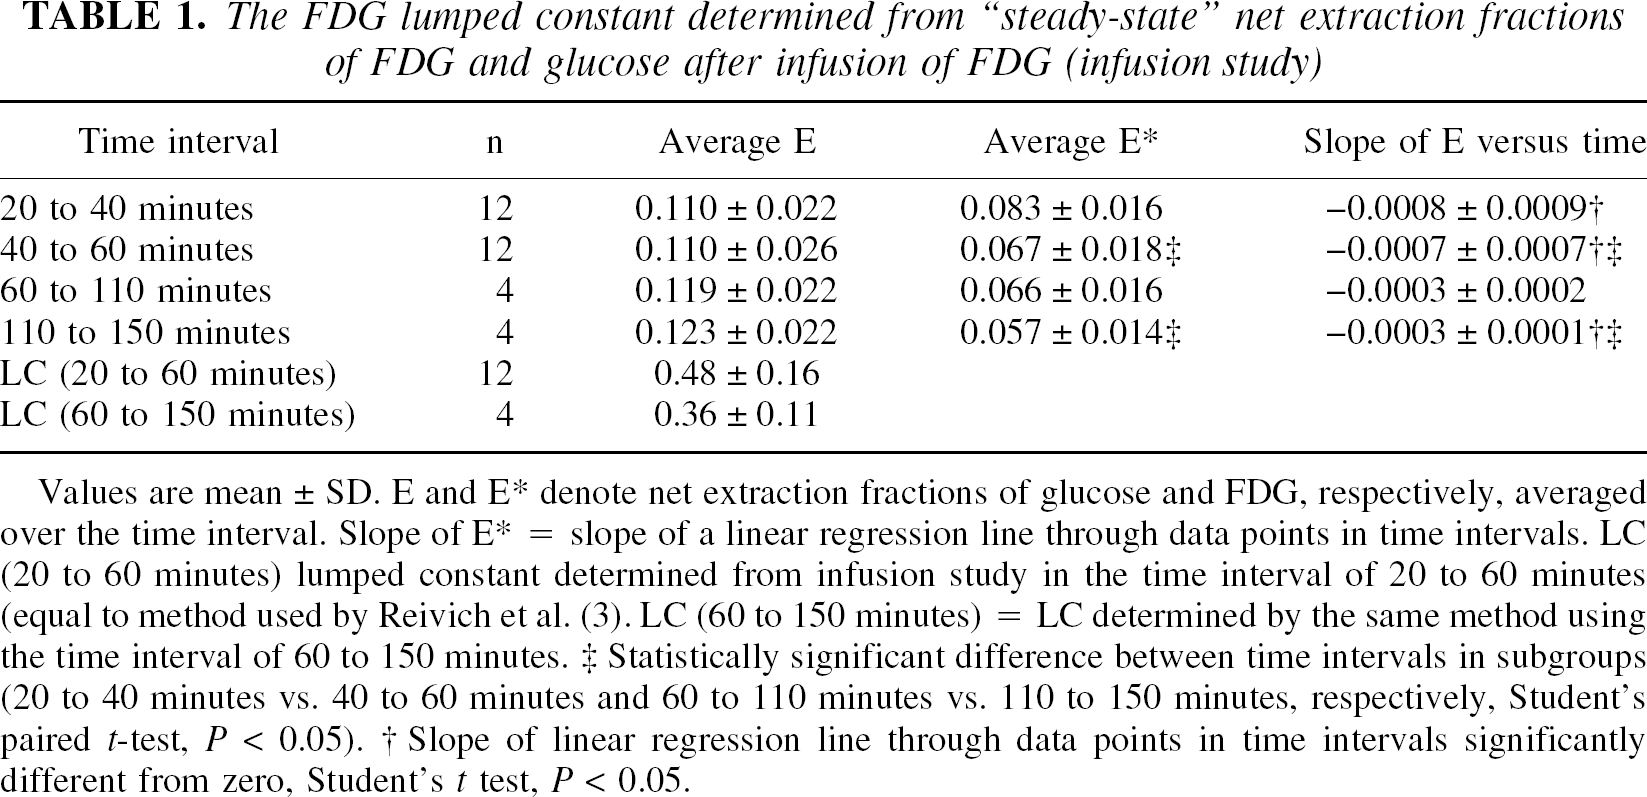
Values are mean ± SD. E and E denote net extraction fractions of glucose and FDG, respectively, averaged over the time interval. Slope of E* = slope of a linear regression line through data points in time intervals. LC (20 to 60 minutes) lumped constant determined from infusion study in the time interval of 20 to 60 minutes (equal to method used by Reivich et al. (3). LC (60 to 150 minutes) = LC determined by the same method using the time interval of 60 to 150 minutes.
Statistically significant difference between time intervals in subgroups (20 to 40 minutes vs. 40 to 60 minutes and 60 to 110 minutes vs. 110 to 150 minutes, respectively, Student's paired t-test, P < 0.05).
Slope of linear regression line through data points in time intervals significantly different from zero, Student's t test, P < 0.05.
Using the time interval from 60 to 150 minutes, LC tended to be lower (0.36 ± 0.16), but the difference was not statistically significant. However, LC determined from infusion of FDG was significantly less than the values for LC obtained from the bolus study (Table 2, Fig. 2), which ranged between 0.75 and 0.87 (P < 0.0001 to P < 0.002) depending on which part of the curve in the Patlak–Gjedde plot was used for line fitting. As expected, by fitting from the late part of the curve, the slope of the line (E*) decreased. Likewise, fitting a line through the early data points increased E* because of the lack of equilibrium of FDG between blood and brain, and the differences in the calculated values for LC were significant at P > 0.001 (Student's t-test). To check the reliability of the arteriovenous differences as a measure of total brain net uptake of FDG, Ci measured from simultaneous PET-FDG measurements was plotted in Fig. 2. The brain uptake of FDG predicted from the arteriovenous differences measured in the bolus study is shown in Fig. 3.
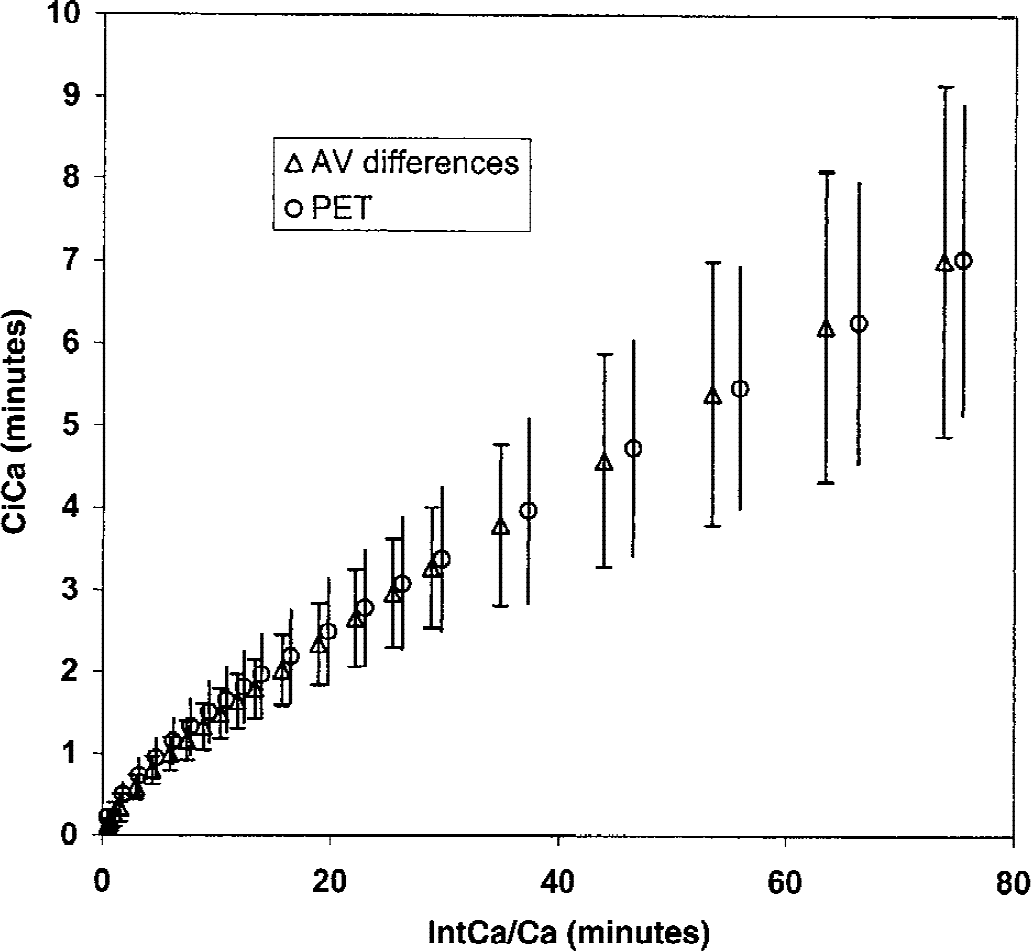
Bolus study. Patlak–Gjedde plot of normalized brain tracer uptake versus normalized integrated arterial tracer concentration. x-axis: the time integral of arterial blood tracer concentration (Ca*), normalized against Ca* (min). y-axis: the brain net radioactivity uptake (Ci*), normalized against Ca* (min). Data points are mean of 15 of the 18 subjects that had a simultaneous arteriovenous (AV) and positron emission tomography and 18F-fluorodeoxyglucose (PET-FDG) study performed (straight lines are ± 1 SD). AV differences: Ci measured from arteriovenous differences of FDG as described in Materials and Methods. PET: global Ci measured from a standard PET-FDG study in the same subjects (Hasselbalch et al., 1996b; Madsen et al., 1995).
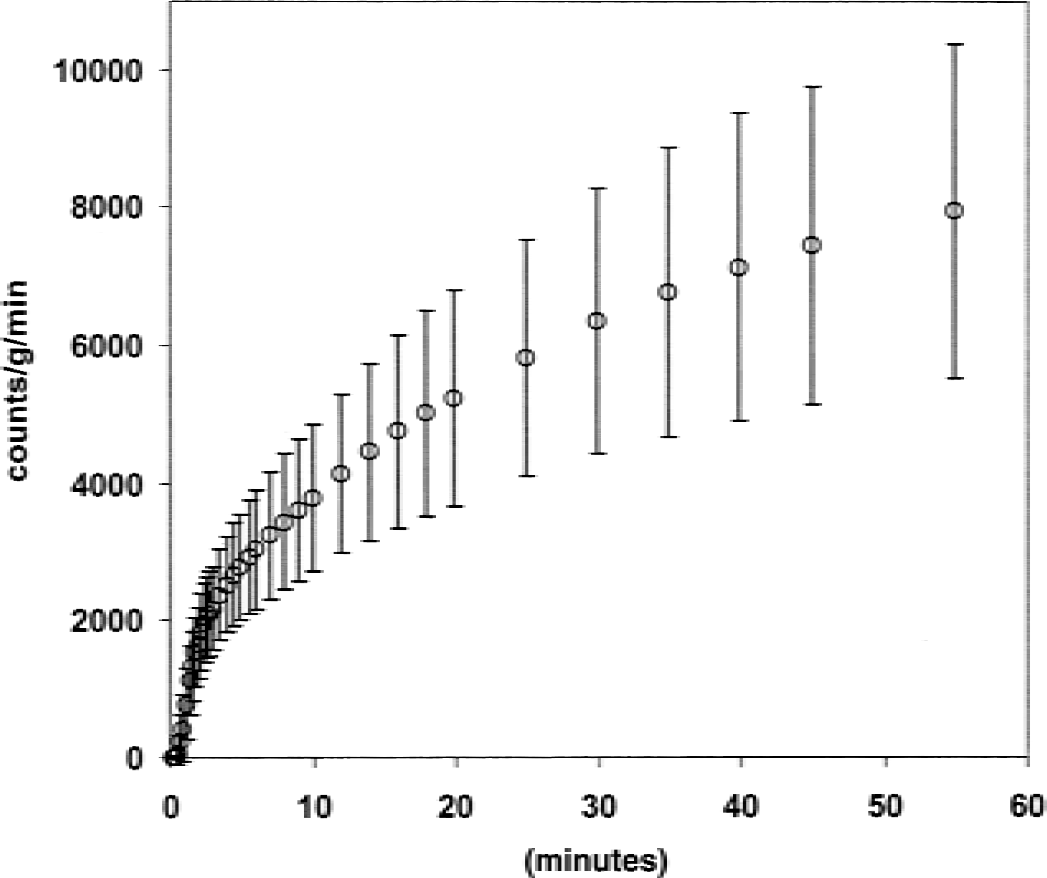
Bolus study. Time course of 18F-fluorodeoxyglucose (FDG) uptake predicted from AV differences. x-axis: study time. y-axis: FDG uptake estimated from (IntCa − IntCv) · F, where IntCa and IntCv are the integrated tracer activities in arterial and jugular venous blood, respectively, and F is cerebral blood flow in mL g−1min−1. Data points are mean of 18 subjects studied from 0 to 60 minutes (straight lines are ± 1 SD).
The FDG lumped constant determined from net extraction fractions of FDG and glucose after a bolus injection of FDG with the use of the Patlak–Gjedde plot (bolus study)
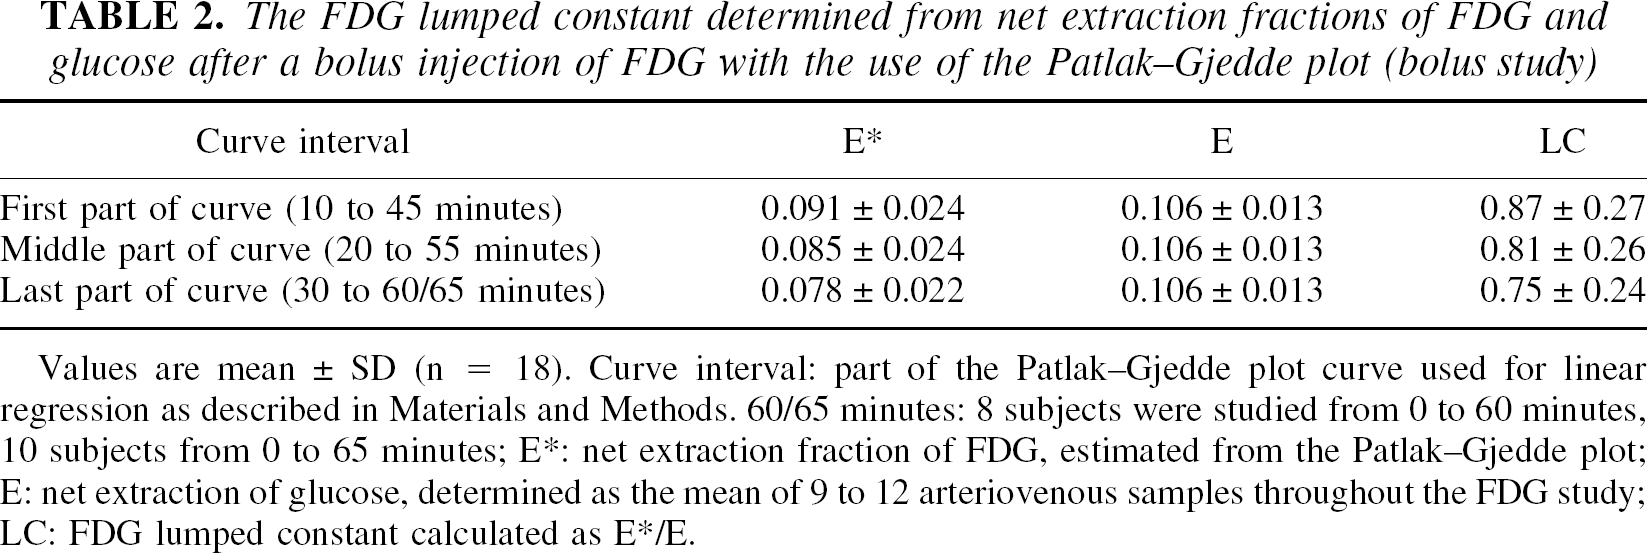
Values are mean ± SD (n = 18). Curve interval: part of the Patlak–Gjedde plot curve used for linear regression as described in Materials and Methods. 60/65 minutes: 8 subjects were studied from 0 to 60 minutes, 10 subjects from 0 to 65 minutes; E*: net extraction fraction of FDG, estimated from the Patlak–Gjedde plot; E: net extraction of glucose, determined as the mean of 9 to 12 arteriovenous samples throughout the FDG study; LC: FDG lumped constant calculated as E*/E.
DISCUSSION
In the current study, the authors have for the first time replicated the study of Reivich and coworkers in humans using a continuous FDG infusion to obtain steady-state arterial concentrations and net extraction fractions of FDG. When comparing LC values obtained with this method to LC values obtained from the bolus injection method, discrepancies that need further consideration were observed.
Infusion study
The LC value of 0.48 ± 0.16 calculated in the current study using the method of Reivich and coworkers differed only slightly from their reported value of 0.52, which suggested that the replication of their method was successful. However, several points render the interpretation of these results difficult. First, taking into consideration that their value was underestimated because of labeled mannose (Reivich et al., 1985), it was remarkable that a greater LC value was not found in the current study, in which FDG had a radiochemical purity of more than 95%. Second, the net extraction fraction of FDG (E*) continued to decline throughout the experiment (Table 1). Because the arteriovenous difference of FDG is less than 10%, the authors took great care in determining the tracer activity in arterial and venous blood by sampling the largest possible blood volume, weighing all samples to correct for volume differences, and optimizing counting. The authors suggest that these precautions increased precision and allowed them to visualize a continuous decline of E* signifying non–steady-state conditions that also cannot be excluded in the study of Reivich and coworkers. Even when the study was extended to 2.5 hours, E* continued to decrease. The equilibrium in the brain between the blood and the free FDG precursor pool is determined by both the metabolic trapping of FDG (k3*) and back diffusion from brain to blood (k2*). Using values for these rate constants obtained in white matter in the bolus study (k2*= 0.082, and K3*= 0.040, (Hasselbalch et al., 1998), the half life of the precursor pool is 5.7 minutes. After 51 minutes, the activity concentration in the precursor pool is within 0.2% of its final value, and lack of equilibrium therefore cannot explain the continuous decline in E* at later times.
The declining E* was more likely explained by non–steady-state conditions caused by either dephosphorylation of FDG (k4* > 0) or accumulating metabolites of FDG. Notably, in an appendix, Reivich and coworkers argued that the existence of a K4* > 0 should lead to an overestimation of LC (Reivich et al., 1985). This statement, however, rested on an erroneous argument assuming from the beginning an expression only valid for K4* = 0. Contrary to their anticipation, when K4* > 0, E* decreases and the FDG net extraction eventually becomes zero. Methodologic limitations did not allow the authors to prolong the experiment to visualize E* declining to zero, and the potential effect of escape of radiolabel from brain on the estimation of E* remains uncertain.
If appreciable amounts of labeled metabolites of FDG occur in blood during the experiment, and these metabolites cross the blood–brain barrier with a lower extraction fraction than FDG itself, E* will decline with time. In experimental studies with 2– 14C-deoxyglucose, radiolabeled metabolites do occur in blood within 45 minutes, mainly in the form of deoxyglucose-1-phosphate and deoxyglucose-1,6-biphosphate (Dienel et al., 1993). It remains to be determined whether significant amounts of FDG metabolites occur in blood after a continuous infusion of FDG. However, whatever causes the decline in E*, the authors conclude that non–steady-state conditions lead to an underestimation of LC when the method of Reivich et al. (1985) is used.
Bolus study
The LC values obtained by measurements of arteriovenous differences of FDG after a bolus injection of FDG were greater than those obtained with the infusion approach. Some methodologic issues also complicate the interpretation of these results. As with the infusion approach described above, labeled metabolites not crossing the blood–brain barrier may affect the time course of E*. However, as depicted in Fig. 2, there was a good agreement between E* obtained with the current method and E* obtained from direct measurements of Ci by PET-FDG. As shown in Fig. 3, the time course of FDG as predicted from the AV measurements follows that of a typical FDG brain activity curve. In the bolus study, the ratio between FDG and glucose (Ca*/Ca)/(Cp*/Cp) was considered negligible in the interval from 0 to 60 minutes. As can be seen from Fig. 1D, in the 4 subjects studied with the infusion method for 2.5 hours, there was a small, but significant, increase in the ratio from 60 to 150 minutes. Because of differences in the administration of FDG in the two studies, one cannot discount possible increases in the ratio in the bolus study. Assuming an increase in the ratio of a similar magnitude as that observed in the 150-minute infusion study, E* was calculated to increase approximately 2% with a subsequent 2% increase in LC. Thus, although a small change in the whole blood to plasma ratio between FDG and glucose has a minimal effect on the calculated LC, the magnitude of this change is not known and must be taken into account when interpreting the bolus data. Except for the study of Reivich et al. (1985), previous attempts to estimate LC have been based on the assumption of a global CMRglc of 0.30 μmol g−1min−1(Phelps et al., 1979; Brooks et al., 1987; Kuwabara et al., 1990), which stems from numerous studies applying Fick's principle using the most reliable “gold standard” method, namely the Kety–Schmidt technique for global CBF measurements. The authors recently argued that the gold standard global CMRglc of 0.30 μmol g−1min−1 is overestimated because of lack of correction for nonequilibrium between tracer in cerebral venous blood and brain tissue in these previous Kety–Schmidt experiments (Hasselbalch et al., 1998). The historic application of a too high average value for CMRglc may explain part of the discrepancy between the LC values of 0.4 to 0.65 obtained in previous studies (Phelps et al., 1979; Brooks et al., 1987; Kuwabara et al., 1990) and the LC value of 0.81 obtained in the current study from arteriovenous differences of FDG and glucose after a bolus injection of FDG. In support of this hypothesis, the authors recently calculated the lumped constant as the ratio between the global cerebral metabolic rate for FDG (CMRFDG) obtained in a standard PET-FDG study and the global CMRglc simultaneously obtained by the Fick's principle using the Kety–Schmidt technique with correction for nonequilibrium (Hasselbalch et al., 1998). The authors found a mean value of 0.81, identical to that obtained in the current study using a different methodology. Supporting the current results, in a recent double-label PET study, Spence and coworkers calculated a ratio of 0.86 between net uptake of 1-[11C]glucose and FDG (Spence et al., 1998). Finally, Frackowiak and coworkers arrived at a LC value of 0.75 when comparing CMRglc and CMR O2 in the same subjects (Frackowiak et al., 1988). That is, there is accumulating evidence from different methodologies suggesting a LC value in the range of 0.8 to 0.85. The relevance of an up-regulation of LC is apparent in that it lends physiologic meaning to the absolute quantification of global glucose consumption with PET-FDG and allows for comparison of results obtained with different methodologies. The first point might be exemplified by a carefully performed PET-FDG study in 50 young healthy volunteers, where Wang and colleagues using a LC of 0.52 found a global CMRglc value of 0.36 to 0.40 μmol g−1min−1(Wang et al., 1994). Applying a stoichiometric relationship of 5.6/1 for the oxygen/glucose metabolic rate (Siesjo, 1978), their subjects would have had a global cerebral oxygen metabolism (CMRO2) of 2 to 2.2 μmol g−1min−1, which is significantly greater than previously obtained values CMRO2 obtained with PET, ranging from 1.2 to 1.3 μmol g−1min−1(Mintun et al., 1984; Perlmutter et al., 1987; Leenders et al., 1990). Scaling their CMRglc values with the suggested LC of 0.81 would decrease their CMRglc and CMRO2 values to 0.23 to 0.25, and 1.3 to 1.4 μmol g−1min−1, respectively, which is compatible with the CMRO2 studies cited above. Second, different methodologies are more readily comparable with PET-FDG—that is, PET studies using a different glucose tracer, [1-11C]D-glucose, studies using Fick's principle, and the “LC corrected” study of Wang and coworkers, all yield practically identical CMRglc values ranging from 0.23 to 0.25 μmol g−1min−1(Hasselbalch et al., 1998; Wang et al., 1994; Blomqvist et al., 1990).
The methodologic difficulties adhering to the determination of LC described in the current study implies that the use of an “operational LC” may be more appropriate. The “operational LC” designates a scaling factor between the net uptake of FDG determined from a standard PET-FDG study and the net uptake of glucose determined in the same brain volume. When the latter is determined by Fick's principle using the Kety–Schmidt technique, a value of 0.81 has been obtained (Hasselbalch et al., 1998). The “operational LC” yields true CMRglc as long as subsequent PET-FDG studies are performed in the same standardized fashion, regardless of the theoretic imperfections of the PET-FDG method.
Conclusion
For the first time since 1985, the authors have replicated the study of Reivich et al. (1985) for direct determination of the FDG LC, and the LC value of 0.48 was close to the original value. However, because of non–steady-state conditions, this method seems to underestimate LC, and in a second study applying a different methodology, the authors present further evidence for a resetting of LC toward a greater value. This resetting provides a physiologic meaningful estimate for CMRglc determined with PET-FDG and allows for comparison of CMRglc values between different methodologies.
Footnotes
Acknowledgments:
The authors gratefully acknowledge The John and Birthe Meyer Foundation for the donation of the Cyclotron and PET scanner. The expert assistance of the technicians Gerda Thomsen and Karin Stahr also is gratefully acknowledged. The program for calculation of the FDG infusion schedule was kindly provided by Kathleen Schmidt, Laboratory of Cerebral Metabolism, National Institute of Mental Health, Bethesda, Maryland, U.S.A.