16. Positron emission tomography imaging in refractory gilles de la tourette syndrome and for stereotactic bilateral capsulotomy
L. Kangyong1, S. Liwei1 and G. Yihui2
1Neurology, 5th Hospital of Fudan University; 2PET Center of Huashan Hospital, Fudan University, Shanghai, China
Objective: To explore glucose metabolism changes of refractory Gilles de la Tourette syndrome (GTS) in PET scan and observe the effect of stereotactic bilateral capsulotomy for refractory GTS patients.
Methods: We examined the localized orbitofrontal and subcortical metabolic changes in FDG-PET by employing the region of interest (ROI) method in pre-operation and 6 months after operation. 7 cases refractory GTS underwent MRI guided stereotactic bilateral capsulotomy. The post-operation outcome of brain metabolic and clinical scales including tic severity, cognitive performance, and psychiatric status are under investigation by contrast to pre-operation so as to detect and evaluate the effects of capsulotomy for refractory GTS.
Results: There was a remarkable difference between the patients and control team in regional glucose metabolic changes (P<0.01). Moreover stereotactic capsulotomy induces localized orbitofrontal and subcortical metabolic changes and improves clinical symptoms in refractory GTS. No any serous side effects happened except transient urpclepsia and weight loss in our study.
Conclusion: The metabolic abnormalities of FDG are universal and remarkable in PET to refractory GTS, especially in frontal Lobe, orbitofrontal lobe, cingulated cortices, and caudate. FDG-PET changes demonstrated that capsulotomy do decrease remarkably regional hypermetabolism, which might be related to mechanism of surgical treatment of refractory GTS. MRI guided stereotactic capsulotomy is a precise, safe, very effective therapy in some ways for refractory GTS.
57. Postoperative cortical neural loss associated with cerebral hyperperfusion and cognitive impairment after carotid endarterectomy: 123I-iomazenil SPECT study
K. Chida, K. Ogasawara, Y. Suga, H. Saito, M. Kobayashi, K. Yoshida, Y. Otawara and A. Ogawa
Neurosurgery, School of Medicine, Iwate Medical University, Morioka, Japan
Background and aims: Although cerebral hyperperfusion after carotid endarterectomy (CEA) often impairs cognitive function, MRI does not always demonstrate structural brain damage associated with postoperative cognitive impairment. The purpose of the present study was to determine whether postoperative cortical neural loss, which can be detected by 123I-iomazenil (IMZ) single-photon emission CT, is associated with cerebral hyperperfusion after CEA and whether it correlates with postoperative cognitive impairment.
Methods: In 60 patients undergoing CEA for ipsilateral internal carotid artery stenosis (>70%), cerebral blood flow was measured using N-isopropyl-p-[123I]-iodoamphetamine single-photon emission CT before and immediately after CEA and on the third postoperative day. The distribution of benzodiazepine receptor binding potential in the cerebral cortex was assessed using 123I-iomazenilsingle-photon emission CT before and one month after surgery and was analyzed using three-dimensional stereotactic surface projection. Neuropsychological testing was also performed preoperatively and at the first postoperative month.
Results: Post-CEA hyperperfusion and postoperative cognitive impairment were observed in 9 patients (15%) and 8 patients (13%), respectively. Post-CEA hyperperfusion was significantly associated with postoperative hemispheric reduction of benzodiazepine receptor binding potential (95% CIs, 2.765 to 148.804; P = 0.0031). Post-CEA hyperperfusion (95% CIs, 1.183 to 229.447; P = 0.0370) and postoperative hemispheric reduction of benzodiazepine receptor binding potential (95% CIs, 1.003 to 77.381; P = 0.0496) were also significantly associated with postoperative cognitive impairment.
Conclusions: Cerebral hyperperfusion after CEA results in postoperative cortical neural loss that correlates with postoperative cognitive impairment.
67. Changes of brain phosphodiesterase 4 in major depression
M. Fujita1, S. Zoghbi1, C. Zarate2, A. Mallinger2, J. Hong1, H. Ozaki1, V. Pike1, R. Innis1 and W. Drevets3
1Molecular Imaging Branch; 2Mood and Anxiety Disorders Research Unit; 3Neuroimaging of Mood and Anxiety Disorders, National Institute of Mental Health, Bethesda, Maryland, USA
Objectives: The mechanism of action for some antidepressant treatments may involve upregulation of the 3′-5′-cyclic adenosine monophosphate (cAMP) cascade.1 This hypothesis is based on rodent studies consistently reporting upregulation of the cAMP cascade induced by chronic antidepressant drug administration. A post mortem human study also showed a decrease in cAMP regulatory element protein in unmedicated patients with major depressive disorder (MDD) and its normalization with antidepressants.2 The objectives of the current study were to image brain phosphodiesterase (PDE) 4, which metabolizes the second messenger cAMP, using the selective ligand [C-11](R)-rolipram in MDD patients before and after antidepressant treatment and in healthy controls to compare PDE4 levels between diagnostic groups and before versus after antidepressant treatment. Based on the human post mortem and rodent studies reviewed above, we hypothesized that unmedicated depressed subjects would show lower PDE4 levels than controls and that antidepressant drug treatment would increase PDE4 levels toward normal in MDD subjects.
Methods: [C-11](R)-rolipram PET scans with metabolite-corrected arterial input function were performed on 9 unmedicated MDD patients (5 females/4 males, age = 36±12) and 7 healthy controls (3 females/4 males, age = 32±13). So far only 3 patients repeated a scan 4 to 8 weeks after sertraline or escitalopram treatment. Preliminary analyses were performed by comparing VT/fP (total distribution volume normalized to plasma free fraction) measured with an unconstrained two-tissue compartment model in large brain regions of frontal, parietal, occipital, lateral and medial temporal, and anterior cingulate cortices, thalamus, caudate, putamen, and cerebellum. Depression symptom severity was rated using the Montgomery-Asberg Depression Rating Scale and Hamilton Anxiety Rating Scale.
Results: The two-compartment model well identified VT/fP in all regions with average identifiability of <2% in both controls and patients. Unmedicated patients showed 21% to 31% lower levels of VT/fP than controls in all brain regions (Figure). After correction for multiple comparisons by applying the False Discovery Rate, the decreases were significant (P<0.05) in all regions except frontal cortex. However, there was no significant correlation between the depression or anxiety scale scores and VT/fP in unmedicated patients. The three patients who had PET scans before and after treatment did not show consistent changes in VT/fP with two showing average increases of 18% and 27% and one showing an average decrease of 19% across the brain regions.
Conclusions: As we hypothesized, the current PET study showed lower levels of PDE4 in unmedicated MDD patients than healthy subjects, indicating downregulation of the cAMP cascade in depression. Additional patients will be studied before and after antidepressant treatment, and the regional specificity of abnormalities in PDE4 will be investigated via voxel-based analysis.
77. Effects of second-generation antipsychotic drug on dopamine synthesis in human brain measured by PET with L-[C-11]DOPA
H. Ito, H. Takano, H. Takahashi, R. Arakawa, M. Miyoshi, F. Kodaka, M. Okumura, T. Otsuka and T. Suhara
Molecular Neuroimaging Group, Molecular Imaging Center, National Institute of Radiological Sciences, Chiba, Japan
Objectives: Effects of antipsychotic drugs have widely been considered to be mediated by blockade of dopamine D2 receptors. Effects of antipsychotics on presynaptic functions of dopaminergic neurotransmission might also be related to therapeutic effects of antipsychotics. In the present study, changes in dopamine synthesis rate by administration of single dose of second-generation antipsychotics in relation with occupancy of dopamine D2 receptors were measured by positron emission tomography (PET) in healthy human subjects.
Methods: PET studies were performed on 12 healthy men (21 to 29 years of age) under resting condition (baseline study) and oral administration of single dose of antipsychotic drug, risperidone of 0.5 to 2.0 mg, (drug challenge study) on separate days. In each study, both PET scans with [C-11]raclopride and L-[C-11]DOPA were performed sequentially to measure dopamine D2 receptor binding and dopamine synthesis rate, respectively. For [C-11]raclopride PET, the binding potential (BP) in the striatum was calculated by the reference tissue model method with use of the cerebellum as a reference region. The occupancy of dopamine D2 receptors by risperidone was calculated from BP values in baseline and drug challenge studies. The uptake rate constant, Ki, for L-[C-11]DOPA in the striatum indicating the dopamine synthesis rate was estimated by the graphical analysis with use of the occipital cortex as a reference region.1 The percentage change in Ki by risperidone was calculated from Ki values in baseline and drug challenge studies.
Results: The occupancies of dopamine D2 receptors ranged from 39% to 75% in the putamen. The dopamine synthesis rate Ki values were 0.0136±0.0017 (1/mins) and 0.0142±0.0010 (1/mins) (mean±s.d.) in the putamen for the baseline and drug challenge studies, respectively. While occupancy of dopamine D2 receptors corresponding dose of risperidone was observed, no significant change in dopamine synthesis rate by risperidone was observed. No significant correlation between the occupancy of dopamine D2 receptors and the change in dopamine synthesis rate by risperidone was also observed. On the other hand, a significant negative correlation was observed between the baseline dopamine synthesis rate and the change in dopamine synthesis rate by risperidone (r = −0.87, P<0.001).
Conclusions: The negative correlation between the baseline dopamine synthesis rate and the change in dopamine synthesis rate by risperidone, and smaller coefficient of variation of dopamine synthesis rate Ki in drug challenge studies than in baseline studies indicate that second-generation antipsychotic, risperidone, can be considered to stabilize the level of dopamine synthesis rate. The concept of phasic and tonic dopamine release with relation to the modulation of dopaminergic neurotransmission has been proposed, and abnormal responsivity in both the phasic and tonic dopamine release in schizophrenia have been considered.2 Therapeutic effects of risperidone might be related to stabilizing effects on such dopaminergic neurotransmission responsivity.
78. Increase in thalamic binding of [11C]PE2I in patients with schizophrenia: a positron emission tomography study of dopamine transporter
R. Arakawa1,2, T. Ichimiya1,2, H. Ito1, A. Takano1, M. Okumura1,2, H. Takahashi1, H. Takano1, F. Yasuno1, M. Kato3, Y. Okubo2 and T. Suhara1
1Molecular Neuroimaging Group, Molecular Imaging Center, National Institute of Radiological Sciences, Chiba; 2Department of Neuropsychiatry, Nippon Medical School; 3Department of Neuropsychiatry, Keio University School of Medicine, Tokyo, Japan
Objectives: Previous in vivo imaging studies using positron emission tomography (PET) or single photon emission computed tomography (SPECT) reported no difference in dopamine transporter (DAT) bindings between control subjects and patients with schizophrenia.1,2 However, those studies evaluated DAT binding only in the striatum, as DAT density in extrastriatal regions is very low. The recent development of [11C]PE2I, which has high affinity and selectivity for DAT, allows the evaluation of extrastiatal DAT bindings.3
Methods: Eight patients (6 men, 2 women; mean age 36.5±9.5 yr, range 25 to 52 yr) diagnosed with schizophrenia participated in this study. Six of them were antipsychotic naïve and two had been antipsychotic free for at least six months before PET measurement. Psychopathological symptoms were assessed on the same day as the PET scans using the Positive and Negative Syndrome Scale (PANSS). Twelve normal control subjects (10 men, 2 women; mean age 33.2±12.0 yr, range 23 to 56 yr) also participated. A dynamic PET scan was performed for 90 mins after intravenous bolus injection of 214.7±13.7 MBq of [11C]PE2I. The specific radioactivity of [11C]PE2I was 344.5±355.3 MBq/nmol. All PET images were transformed into the standard brain size and shape using the statistical parametric mapping (SPM2) system. Regions of interest (ROIs) were drawn on all anatomically standardized PET images with reference to the T1-weighted MR images. ROIs were defined for the cerebellar cortex, caudate head, putamen, substantia nigra and thalamus. Binding potential (BPND) was calculated by the simplified reference tissue model method. The cerebellum was used as reference region because of its negligible density of DAT. After complete description of this study, written informed consent was obtained from all subjects. The study was approved by the Ethics and Radiation Safety Committee of the National Institute of Radiological Sciences, Chiba, Japan.
Results: The BPND value in the thalamus was significant higher in patients with schizophrenia (0.36±0.07) than in controls (0.28±0.08) (two-tailed t-test; d.f. = 18, t = 2.16, P = 0.044). There were no significant differences in BPND between the two groups in the caudate, putamen or substantia nigra. In patients with schizophrenia, there were significant positive correlations between BPND in the thalamus and total PANSS score (Pearson's correlation coefficient; r = 0.75, P = 0.032), positive (r = 0.78, P = 0.023) and negative scores (r = 0.82, P = 0.014), but no correlation was observed with the general PANSS score. There was no significant correlation between BPND in other regions and any of PANSS scores.
Conclusions: Although the function of DAT in the thalamus has remained unclear, high DAT bindings may suggest a hyper-dopaminergic state of pre-synaptic dopamine function in patients with schizophrenia.
91. Repetitive transcranial magnetic stimulation as a complementary treatment of post-stroke aphasia
N. Weiduschat1,2, A. Thiel3, A. Hartmann4, I. Rubi-Fessen4, J. Kessler2, P. Merl4, L. Kracht1, A. Schuster1, R. Krais1, W. Möller-Hartmann5, T. Rommel4 and W.D. Heiss1
1Max-Planck-Institute for Neurological Research; 2Neurology, University of Cologne, Cologne, Germany; 3Neurology and Neurosurgery, McGill University, Montreal, QC, Canada; 4RehaNova; 5Radiology, University of Cologne, Cologne, Germany
Objective: Recovery of post-stroke aphasia seems to be most effective, when ipsilesional regions can be functionally (re-)integrated. In contrast, interhemispheric compensation might represent an inferior strategy. The objective of utilising repetitively administered TMS (rTMS) in neurorehabilition is mainly to decrease the cortical excitability in specific regions that are presumed to hinder optimal recovery. Accordingly, the aim of the present study is to investigate the impact of rTMS over the right-hemispheric Broca-homologous area in aphasic stroke patients concerning the clinical course and its neuronal correlates using a randomized and placebo-controlled design.
Methods: We investigated right-handed patients with aphasia due to first-time stroke. Within 16 weeks post-stroke, the regional cerebral blood flow (rCBF) at rest and during an acoustic verb-generation task was measured using H215O positron emission tomography (PET). After randomization, the patients received either rTMS over the right triangular part of the inferior frontal gyrus (BA45) or sham-stimulation, each with subsequent conventional speech therapy. Repetitive TMS was conducted for 20 mins with a frequency of 1 Hz and an intensity of 90% of the individual motor threshold five times per week for a two-week period. The language performance was tested before and after the two-week rehabilitation period. Additionally, further H2O15-PET-scans were obtained after the last TMS-session using the same verb-generation paradigm.
Results: Single subject language activation PET studies were analyzed in the first 6 patients (3 in the intervention group, 3 in the control group). Preceding the intervention, activations in the left and the right BA45 were comparable in both groups (Figure 1). After the rehabilitation period, activations in the left BA45 were higher in the treatment group (P = 0.07; Figure 1). Activation in the right BA45 did not differ between groups. Improvement of language performance scores was higher in the intervention group on every task of the Aachener Aphasie Test.
Activation intensity of the left and right BA45, as measured in Z-scores, specified for different groups and time points (Group 0: sham stimulation; Group 1: rTMS over right BA45).
Conclusions: In accordance with the theory of transcallosal inhibition, rTMS over right BA45 as adjuvant therapy for post-stroke aphasia treatment causes increased activity in left BA45 as compared to sham-stimulation. This imaging finding has its clinical correlate in improved language performance of the treatment group. It has no permanent effect on right BA45 activity although this area was directly stimulated. These preliminary data suggest that TMS-intervention over right BA45 facilitates conventional speech and language therapy with a long-lasting transcallosal effect on left BA45.
210. Decreased neurokinin1 (substance P) receptor binding in patients with panic disorder: positron emission tomographic study with [18F]SPA-RQ
Y. Fujimura1, F. Yasuno1, A. Farris1, J.-S. Liow1, M. Geraci2, W. Drevets2, D. Pine2, S. Ghose3, A. Lerner1, R. Hargreaves4, D. Bruns4, C. Morse1, V. Pike1 and R. Innis1
1Molecular Imaging Branch; 2Mood and Anxiety Disorders Program, National Institute of Mental Health, Bethesda, MD; 3Department of Psychiatry, UT Southwestern Medical Center, Dallas, TX; 4Merck Research Laboratories, West Point, Pennsylvania, USA
Objectives: Pain and stress in animals cause release the peptide neurotransmitter substance P, which binds to and causes internalization of neurokinin1 (NK1) receptors. Positron emission tomography (PET) can localize and quantify NK1 receptors in brain using the non-peptide antagonist radioligand, [18F]SPA-RQ. We sought to determine if patients with panic disorder have altered density of NK1 receptors in brain because of their history of recurrent panic attacks. We also sought to determine if a drug-induced panic attack releases substance P in brain, as measured by decreased binding of [18F]SPA-RQ.
Methods: PET scans with [18F]SPA-RQ were performed in 14 patients with panic disorder and 14 healthy subjects. Of these two groups, 7 patients and 10 healthy subjects were scanned twice, once at baseline and once after injection of doxapram, a drug that induces panic attacks.
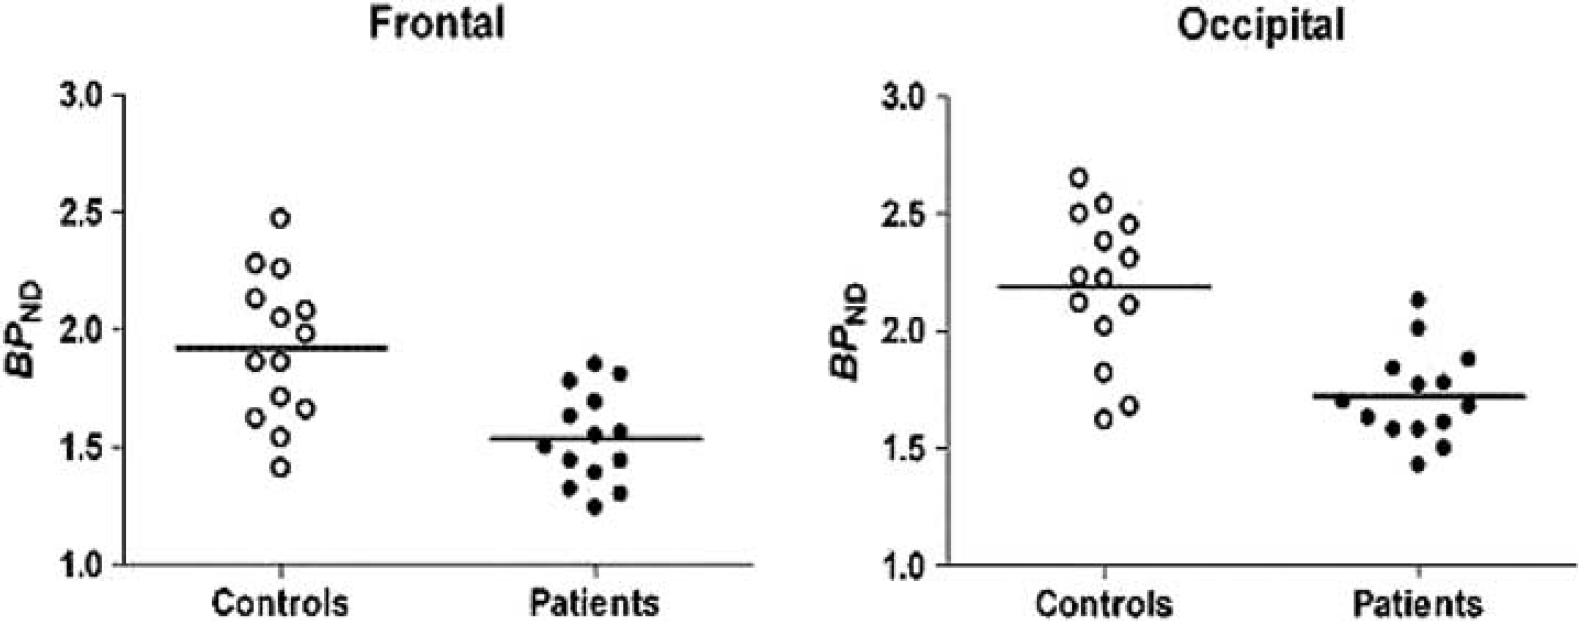
Results: NK1 receptor binding in patients (n = 14) compared to that in healthy subjects (n = 14) was significantly decreased by 12 to 21% in all brain regions. Doxapram effectively produced panic attacks in 6 of 7 patients with panic disorder but only 2 of 10 healthy subjects. Doxapram caused no significant change of [18F]SPA-RQ binding in either patients or healthy subjects.
Conclusions: Although induction of a panic attack has no significant effect on [18F]SPA-RQ binding to NK1 receptors, patients with panic disorder have widespread reduction of NK1 receptor binding in brain. The potential importance of decreased NK1 receptor binding in panic disorder could be explored in the future by measuring the effects of treatment and by comparison with other anxiety-related disorders.
Disclosures: This research was supported by the Intramural Program of NIMH (project #Z01-MH-002852-01). R.H. and H.D.B. were employees of Merck Research Laboratories. Y.F. and F.Y. were supported by the JSPS Research Fellowship in Biomedical and Behavioral Research at NIH.
Decreased Binding in patients with panic disorder. Decreased NK1 receptor binding at baseline in patients compared to healthy controls. The distribution of receptor binding (BPND) in 14 patients and 14 healthy controls is shown for two brain regions (frontal and occipital).
211. An MRI based F-18-FDOPA PET template of the rat brain
J. Chen1, R.-S. Liu2 and J.-C. Chen1
1Department of Biomedical Imaging and Radiological Sciences, National Yang Ming University; 2National PET/Cyclotron Center, Taipei Veterans General Hospital, Taipei, Taiwan R.O.C.
Objectives: Parkinson disease (PD) is a well known neurodegenerative disease that suffers millions of people. The characteristics of this disease is a gradually loss of dopamine neurons in the midbrain, but its exact cause is still unknown. F-18-FDOPA radiopharmaceutical is commonly used with PET to assess presynaptic nigrostriatal dopaminergic function which is an important index for brain function evaluation. To facilitate quantitative analysis of PD animal model using animal PET, we would like to develop an MRI based F18-FDOPA rat brain PET template for neurodegenerative disease study in small animals.
Methods: Four male Sprague Dawley rats (body weight range, 350 to 400 g) were scanned by both the 7T microMR and the microPET R4®. To choose the best objective function for co-registration, a Micro Deluxe Phantom was adopted to do accuracy evaluation. For phantom analysis using Pmod 2.95, we designed five markers on the middle slice of a phantom image for evaluation and then performed evaluation in two ways. One is pre-rotated PET image 5 degrees about z axis. The other is not only pre-rotated PET image 5 degrees about z axis but also pre-translated 5 mm in the x direction. The pre-processing steps in SPM 5, i.e. realignment, coregistration, normalization and smoothing, were used to create a F18-FDOPA rat brain PET template.
Results: In phantom analysis, the distance deviations of the five markers in two evaluation cases with Normalized Mutual Information (NMI) method are between 0.05 and 0.22 mm and between 0.20 and 0.40 mm, respectively. Because these are all less than 1 mm as required, therefore, NMI method was chosen as the optimal objective function for inter-modality image registration. The MRI based F18-FDOPA PET template for normal male rat brain was generated for voxel based statistical analysis in SPM for small animal studies.
Conclusions: The MRI based small animal PET template can be used for accurate assessment of local brain function change in the PD rat model study.
275. Striatal dopaminergic function during speech production
K. Simonyan1 and P. Herscovitch2
1Laryngeal and Speech Section, NINDS/NIH; 2PET Department, Clinical Center/NIH, Bethesda, Maryland, USA
Voluntary voice production for speech and song is a complex motor behavior controlled by the laryngeal motor cortex and its input and output structures, such as basal ganglia, thalamus and cerebellum. Neuroanatomical studies in non-human primates and neuroimaging studies in humans have shown that the putamen receives the strongest of all basal ganglia connections from the laryngeal motor cortex and is functionally active during voluntary voice production. Although the neuroanatomical and functional organization of the basal ganglia has been described, little is known about their neurotransmitter function during voluntary voice production in humans. The objective of this study, therefore, was to identify endogenous dopamine release during rest and speech production in healthy humans using PET with [11C]raclopride (RAC).
Thirteen right-handed monolingual English-speaking subjects (mean age 54.8 years, 6F/7M) were studied. Subjects underwent a dynamic 100-mins PET scan with RAC, which included 50-mins rest and 50-mins speech production (GE Advance tomograph). RAC was administered as a 1-mins bolus followed by a constant infusion. A high-resolution MRI was obtained in all subjects. PET images were corrected for subject motion and registered to each individual MRI normalized to the Talairach-Tournoux space. Volumes of interest were defined on each MRI using macrolabels maps and transferred to the co-registered PET images. RAC binding potential (BP) was determined as a ratio of concentrations in the regions with (putamen and caudate nucleus) and without (cerebellum) specific binding from the three frames over 40 to 50 mins at rest and eight frames over 60 to 100 mins during speech production. The speech-induced effects on dopamine release were estimated as the percentage change from resting baseline of the RAC BP values during speech production and their statistical significance was assessed using two-tailed paired t-test (P≤0.05, corrected).
The baseline RAC BP values were 2.17±0.36 in right putamen, 2.34±0.35 in left putamen, 1.58±0.37 in right caudate nucleus and 1.55±0.41 in left caudate nucleus (mean±s.d.). During speech production, RAC BP was significantly reduced by 10.7% in right putamen, 11.1% in left putamen, 11.7% in right caudate nucleus and 13.6% in left caudate nucleus (all P<0.0008). Decreased RAC BP values in the putamen showed left-hemispheric lateralization during speech production (P = 0.04).
We have demonstrated, for the first time to our knowledge, endogenous release of striatal dopamine during speech production in healthy subjects. Its left-hemispheric lateralization is consistent with the observation of left-lateralized functional networks during voluntary voice production in humans, suggesting behavior-specific integration and adaptation of the dopamine system for motor control of voluntary voice production. These results are critical for understanding the central mechanisms of voluntary voice control in humans and would potentially help in elucidating the pathophysiology of motor control deficits in neurological voice and speech disorders.
RAC BP values.
362. Study of human emotional processing using molecular imaging
R. Badgaiyan1,2 and A. Fischman2
1Radiology, Massachusetts General Hospital & Harvard Medical School; 2Shriners′ Hospital for Children, Boston, Massachusetts, USA
Background and aims: Even though animal studies have implicated dopamine and noradrenaline in the processing of emotional memories, the role of these neurotransmitters in processing of human emotions is unclear. Clinical studies have however suggested that the processing is impaired in degenerative diseases of the basal ganglia. Since dopamine neurotransmission is dysregulated in these diseases, it could be critically involved in the processing. In this experiment, we used a molecular imaging technique to examine whether dopamine is released during processing of emotional memories in healthy volunteers.
Methods: The volunteers were asked to perform an emotional memory task after a dopamine receptor ligand was administered intravenously. Because endogenously released dopamine displaces its ligands from receptor sites, task-induced release of dopamine was detected and mapped by dynamically measuring the concentration of radiolabeled ligands. In this experiment, a specific dopamine receptor ligand 18F-fallypride was used to study dopamine release in the brain. After a single intravenous administration of the ligand, volunteers were asked to perform an emotional memory task under a control and a test condition. The test condition was started 25 mins after the ligand. In the control condition, which was started immediately after the ligand administration volunteers were asked to rate the intensity of emotions evoked by emotionally neutral words while in the test condition, they made similar rating for emotional words. The ligand concentration was dynamically measured at each voxel during the experiment, using an ECAT HR+ PET camera.
Results: Behavioral data indicated that emotional words presented in the test condition elicited more intense emotion. Additionally, most of these words retrieved emotional memories. Analysis of the PET data indicated that the rate of displacement of the ligand 18F-fallypride increased significantly in the amygdala, medial temporal lobe and ventral prefrontal cortex. Increased rate of the displacement indicate that endogenous dopamine was released in these areas during processing of emotional memory. Interestingly, the fMRI studies have also implicated the same areas in the processing.
Conclusions: The results indicate that molecular imaging technique is a sensitive method to study neurochemistry of human cognition and that, dopamine mediates human emotional memory processing.
370. Cerebral oxygen diffusivity: a potential mechanism of upper limitation of oxygen extraction fraction in ischemic cerebrovascular disease
E. Shimosegawa, M. Imaizumi, H. Kato and J. Hatazawa
Department of Nuclear Medicine and Tracer Kinetics, Osaka University Graduate School of Medicine, Suita, Japan
Objectives: Cerebral oxygen extraction fraction (OEF) has upper limitation of around 65% even in the severely ischemic brain.1 In a simplified model for oxygen diffusivity (Dc) from cerebral capillary bed to brain tissue, the OEF is defined as a function of cerebral blood flow (CBF) (OEF = 1−exp(−Dc/CBF)).2 The model predicts that OEF would be close to 100% in severe ischemia when Dc is constant or increases with CBF reduction. We speculated that upper limitation of OEF is induced by Dc change in ischemic brain. We, therefore, investigated the relationships among OEF, CBF, cerebral blood volume (CBV), and Dc in patients with chronic ischemic cerebrovascular disease.
Methods: Twenty one patients (male:female = 17:4, aged: 40 to 78 yr, mean age: 66.2±9.0 yr) with the unilateral intra-cranial steno-occlusive lesion and 12 normal volunteers (male:female = 6:6, aged: 45to 58 yr, mean age: 50.3±3.4 yr) underwent H215O PET studies for measuring CBF, CBV, OEF, and cerebral metabolic rate of oxygen (CMRO2). Recently developed high resolution (transverse and axial spatial resolutions of 3.5 and 5.0 mm in FWHM) and large Field-of-View (FOV, 260 mm axially) clinical PET scanner was used3 (Shimadzu Co, Kyoto). Regions of interest (ROI) were placed on PET images for 23 brain regions in individual subject. Total of 483 and 276 regions were analyzed in patients and normal volunteers, respectively.
Results: In normal volunteers, mean CBF, CBV, OEF, and CMRO2 were 50.5±21.3 mL/100 mL per mins, 2.76±0.79 mL per 100 mL, 35.9±5.6%, 2.99±0.97 mL/100 mL per mins, respectively. In patients, mean CBF, CBV, OEF, CMRO2 were 37.4±16.4 mL/100 mL per mins, 3.39±1.35 mL/100 mL, 39.1±6.7%, 2.57±0.77 mL/100 mL per mins, respectively. When OEF was plotted against CBF, the peak OEF was found to be 54% at CBF of 20 mL/100 mL per mins. Dc showed a significant correlation with CBF (Dc = 0.40 × CBF+3.32, r = 0.910, P≤0.001) and with CBV (Dc = 0.11 × CBF3−2.17 × CBF2+12.7 × CBF−1.70, r = 0.368, P<0.001).
Conclusions: The present study demonstrated that Dc is not a constant but variable depending on cerebral circulation. In the present simplified model, Dc is a function of cerebral capillary bed volume (CBV*) (Dc = krnet × CBV*). Although CBV measured in the present method represented total CBV rather than CBV*, we found a significant correlation between Dc and CBV. Recent experimental study demonstrated that CBV* would passively decrease as CBF decrease.4 We previously reported that total CBV severely decreased in ischemic core in acute stroke patients.5 The mechanism responsible for upper limitation of OEF would be a restricted Dc due to capillary blood volume reduction in ischemic brain.
372. QBASE: image database system for multicenter clinical studies with QSPECT package
H. Watabe, T. Hayashi, T. Akamatsu and H. Iida
National Cardiovascular Center Research Institute, Suita, Japan
Objectives: QSPECT package has been developed for standardized calculation of quantitative CBF images using I-123 IMP1 and is appropriate for multicenter clinical studies. It performs image reconstruction with attenuation and scatter corrections, and compute two CBF images of pre- and post-pharmacological stress from a single session of a SPECT scan in conjunction with twice-administration of I-123 IMP (Dual-Table IMP-ARG technique). It can handle data from several commercial SPECT cameras by obtaining additional calibration data. However, in multicenter studies, not only image calculation but also standardized visualization, analysis, and statistics of images are needed. It is also important to have well-designed and secure database system that can handle multi-modal data such as images, projection data, blood radioactivity, or patient information. We have developed QBASE, image database system for QSPECT package. The goal of QBASE is to develop secure and flexible image database system which includes anonymization, brain normalization for the multicenter clinical studies.
Methods: QBASE is written in Python language (http://www.python.org) and uses Web based user-interface. Access control mechanism is implemented for security. Relational database model is utilized to handle multiple studies, multiple sites and multiple files related to a patient. The data uploaded on the sever are first analyzed to determine file type and study attributes such as image modality, acquisition site, acquisition date, and a patient information. The data uploaded will be automatically anonymized. The CBF images will be able to normalized to a standard brain image using 12 parameters Affine transformation. Then, mean CBF and flow reserve values for whole brain, cerebellum, MCA, PCA, ACA regions2 are automatically computed. Queries with several conditions are allowed to search the specific studies.
Results: A user uploaded the results of a I-123 IMP study to QBASE server and QBASE automatically determined acquisition conditions such as SPECT camera, collimator, and study duration. PET, MRI, X-ray CT images related to the study was also uploaded to the server. Additional study attributes such as PaCO2, Hct during the study can be attached. File lists belonged to the study was displayed on the web browser and by clicking the image name, the QBASE rendered the image, so the user could view and inspect the images. A table of the automatically determined regional CBF values was displayed and was able to be exported to CSV format data, which can be used further statistical analysis.
Conclusions: QBASE system was developed to support multicenter clinical studies with QSPECT package. The system was secure and flexible, and possible to fit several multicenter trials.
439. Widespread microglia activation in recent onset schizophrenia
B. Van Berckel1,2, M. Yaqub1, A. Schulte3, M. Bossong2, R. Boellaard1, R. Kloet1, A. Schuitemaker4, N. Van Haren2, G. Luurtsema1, B. Windhorst1, W. Cahn2, A. Lammertsma1, A. Rozemuller3 and R. Kahn2
1Nuclear Medicine & PET Research, VU University Medical Center; 2Psychiatry, Rudolf Magnus Institute for Neuroscience; 3Pathology; 4Neurology, VU University Medical Center, Amsterdam, The Netherlands
Objectives: Schizophrenia is a brain disease involving progressive loss of grey matter of unknown cause. Most likely, this loss reflects neuronal damage, which should in turn be accompanied by microglia activation. The aims of this study were to assess regional microglia activation in vivo using (R)-[11C]PK11195 and PET, and to measure activated microglia in post-mortem brains of patients with schizophrenia.
Methods: For the PET study, ten patients with schizophrenia (age: 24±2 years, 9 male) within five years of disease onset and ten healthy controls (23±4 years, 7 male) were included. Dynamic (R)-[11C]PK11195 scans (60 mins) in 3D acquisition mode were performed using an ECAT EXACT HR+ (CTI/Siemens). Arterial blood was withdrawn continuously using an on-line detection system (Veenstra). At set times, discrete blood samples were taken to determine both plasma to whole blood ratios and parent (R)-[11C]PK11195 fractions. All sinograms were corrected for dead time, tissue attenuation, decay, scatter and randoms, and were reconstructed using a standard filtered back projection algorithm and a Hanning filter with a cut-off at 0.5 times the Nyquist frequency. Subjects also underwent an MRI scan and MRI images were aligned to corresponding PET images to define various regions of interest (ROI) using an automatic procedure. (R)-[11C]PK11195 PET scans were analyzed using a supervised cluster analysis method. This method was recently validated for analysis of (R)-[11C]PK11195 data and yields binding potential (BPND) as outcome measurement.1
In addition, a post-mortem study was performed. Autopsy was performed on the brains of ten patients with schizophrenia and without other neurological diseases (age between 18 and 72 years). Disease duration was much longer than 5 years. Brain tissue of frontal cortex was used for immunohistochemical evaluation of microglia and astrocytes (using HLADR and GFAP, respectively).
Results: Results of the PET study are shown in Table 1.
(R)-[11C]PK11195 BP-ND for various ROI
Region
Schizophrenia
Controls
Significance
Total Brain
0.093±0.037
0.004±0.035
<0.001
Cerebellum
0.256±0.066
0.168±0.049
<0.05
Hippocampus
0.034±0.055
−0.063±0.059
<0.05
Cingulate Ant
0.118±0.052
0.042±0.069
<0.05
Thalamus
0.207±0.093
0.123±0.050
<0.05
Sup Temp
0.154±0.057
0.083±0.065
<0.05
Parietal
0.134±0.036
0.106±0.068
ns
Occipital
0.282±0.089
0.226±0.076
ns
Striatum
0.100±0.069
0.060±0.062
ns
In the post-mortem study, an increase in the number of activated microglia cells and reactive astrocytes was seen in only 5 subjects. No relation with age was found.
Conclusion: There is widespread activation of microglia in recent onset schizophrenia.
495. Application of cortical thickness mapping assessed by MRI to functional [18F]-Flumazenil-PET examinations
C. la Fougere1,2,3, S. Grant1, E. Schirrmacher1, R. Schirrmacher3, A. Evans3 and A. Thiel1
1Lady Davis Institute, McGill University, Montreal, QC, Canada; 2Department of Nuclear Medicine, University of Munich Medical Center—Grosshadern, Ludwig-Maximilians-University, Munich, Germany; 3Montreal Neurological Institute, McGill University, Montreal, QC, Canada
Objective: Most voxel-based morphometry (VBM) MRI-studies of gray matter volume tacitly assume that changes in gray matter density also represent changes in neuronal density. We propose a strategy to directly assess this relationship using high-resolution [18F]-Flumazenil PET as neuronal density marker and surface based cortical thickness (SCT) mapping. In contrast to VBM methods, which provide relative gray matter densities, SCT-mapping bears the advantage of providing a direct quantitative index of cortical morphology. This metric captures the distance between the white matter surface and the gray CSF intersection based on a geometric definition; the output is a scalar value measured in millimeters.
Methods: Anatomical MRI′s (Siemens Sonata 1.5 T) with 1 mm isotropic resolution were acquired for SCT measurements in four normal hemispheres. Images were registered into standardized stereotaxic space using a 12-parameter linear transformation, corrected for non-uniformity artifacts, segmented into white matter, gray matter, cerebrospinal fluid by means of CIVET-software. CIVET operates based on the notion that each vertex of the white matter surface is closely related to its gray matter surface counterpart; SCT can thus be defined as the distance between these linked vertices. Dynamic PET measurements (60 mins) were acquired on a high-resolution dedicated brain-scanner (Siemens, HRRT) after injection of 370 MBq of [18F]-Flumazenil as slow bolus over 60 s. The dataset was normalized, corrected for attenuation and scatter, and then iteratively reconstructed into an image volume consisting of 207 transaxial image planes with a voxel size of 1.22 mm. The PET volume was transformed into stereotaxic space using the parameters derived from MRI. Voxel-wise parametric maps of the non displaceable binding potential (BPND = k3/k4) of FMZ were calculated by the method of Logan using the white matter TAC as a reference tissue input. The average SCT and BPND of [18F]-Flumazenil in each vertex were calculated in predefined cortical regions (frontal, parietal, mes. and lat. temporal, occipital cortex, cingulum and central region).
Results: Average global BPND and SCT were 7.7±2.2 and 3.1±0.3 with ranges from (4.0 to 11.4 and 2.5 to 4.0) respectively. A significant positive relationship between BPND and SCT was found for the regions of the cortical convexity (frontal, parietal, lateral occipital and central cortex, r = 0.98, P = 0.07). In the lateral and mesial temporal cortex SCT was higher than would be expected from BPND in this region (SCT 3.2±0.31 mm, BPND = 8.3± 2.11 mm) and in the primary visual cortex SCT was much lower than BPND (BPND = 8.6, SCT = 2.5, r = 0.08).
Conclusion: The proposed strategy of combining high-resolution PET and SCT-mapping suggests that for the greatest part of the convexity cortex, BPND of [18F]-Flumazenil and SCT are highly correlated. This means that variability of cortical thickness might mainly be explained by variation in density of neuronal structures in those regions. However certain brain regions, especially on the mesial brain surface and in the temporal lobe do not seem to follow this relationship. Findings from morphometry studies in these areas should thus be interpreted cautiously with respect to conclusions on changes in the density of underlying neuronal structures.
520. PET imaging of cerebral glucose metabolism during executive function in normal rhesus
A.K. Converse, J.M. Moirano, J.A. Larson, K.V. Kronenfeld, T.R. Oakes, J.E. Holden, C.F. Moore and M.L. Schneider
University of Wisconsin, Madison, Wisconsin, USA
Objectives: To better understand executive function, we wished to identify regions of the primate brain activated by a reversal task that involves attention, working memory, and goal directed behavior. A priori, we expected to find activations in anterior cingulate gyrus, prefrontal cortex, and nucleus accumbens.
Methods: Adult normal rhesus macaques (Macaca mulatta, n = 10) were injected with 2-[F-18]fluoro-2-deoxy-D-glucose (FDG) and placed in the Wisconsin General Test Apparatus to perform a Reversal task and, in a different session, a sensorimotor matched Control task for 30 mins. Performance, as indicated by the number of correct trials, was recorded in the Reversal session. Following the behavior, the subjects were anesthetized with ketamine, maintained on isoflurane, and scanned by positron emission tomography (PET). Coincidence events were chosen so data for each individual corresponded to the same time frame post injection in each condition and were sorted into static sinograms. Images were reconstructed by filtered back projection with attenuation and scatter correction and aligned to template regions of interest (ROIs). The fractional difference in whole brain normalized radioactivity was calculated between the Reversal and Control scans for various bilateral ROIs and voxel-wise. Additionally, the total correct score was correlated against this measure of glucose metabolism alteration.
Results: Examining the group mean over all 10 subjects, no ROI exhibited significant metabolic alteration. However, task performance correlated positively with metabolic increases in putamen (punc<0.01) and thalamus (punc<0.05, 2-tail t, 10–2 d.f.). This ROI result was supported by the correlation map, which showed task performance positively correlated with metabolic increases in right putamen and posterior thalamus (punc<0.005, 2 tail t test, 10–2 d.f.). Two subjects showed particularly low task performance, namely 1 and 3 correct trials as compared to a range of 8 to 35 for the remaining 8 subjects. Post hoc analysis of the group means without these two subjects showed activation of the lateral prefrontal cortex ROI (punc = 0.016, 2-tail t, 8–1 d.f.), and, in the activation map, a significant positive cluster in the neighborhood of medial superior frontal gyrus in the coronal plane containing anterior commissure (pcorr = 0.023, 2-tail t, 8–1 d.f., corrected for multiple comparisons and cluster extent, t>3, k = 501 mm3).
Conclusions: FDG PET imaging of normal rhesus macaques suggests positive correlations between executive function task performance and glucose metabolism in putamen and thalamus. In high performing subjects, task-related increases in glucose metabolism were observed in prefrontal cortex.
This work was supported by NIH AA12277.
663. Hemodynamic compromise identified by oxygen extraction fraction response (OEFR) to acetazolamide in stroke patients with large artery occlusion
M. Jumaa1, M. Hammer1, K. Uchino1, S. Zaidi1, R. Lin1, V. Reddy1, H. Kuwabara2, D. Sashin3, Y.-F. Chang4, N. Vora5, T. Jovin1, L. Massaro1, J. Billigen1, H. Yonas6 and E. Nemoto7
1Neurology, University of Pittsburgh School of Medicine, Pittsburgh, Pennsylvania; 2Radiology, Johns Hopkins University, Baltimore, Maryland; 3Radiology, University of Pittsburgh School of Medicine; 4Neurosurgery, University of Pittsburgh School of Medicine, Pittsburgh, Pennsylvania; 5Neurology and Psychiatry, St Louis University School of Medicine, St Louis, Missouri; 6Neurosurgery, University of New Mexico, Albuquerque, New Mexico; 7Radiology, University of Pittsburgh, Pittsburgh, Pennsylvania, USA
Background: Hemodynamic compromise identified by cerebrovascular reserve (CVR) and oxygen extraction fraction (OEF) in stroke patients with large artery occlusion is an independent predictor of stroke risk ranging from 27% to 57%. However, comparison of both methods indicates that the sensitivity of CVR is substantially greater than OEF in detecting hemodynamic compromise which may be because CVR includes a vasodilator challenge with acetazolamide as opposed to OEF made in the resting state. We hypothesized that the response of OEF (OEFR) to an acetazolamide challenge would better correlate with CVR than OEF. We examined the correlation between CVR and OEFR to acetazolamide in stroke patients with large artery occlusion.
Methods: Stroke patients with large artery occlusion (internal carotid or middle cerebral artery) were studied by positron emission tomography (PET) using H215O2 (water) for cerebral blood flow (CBF) and 15O2 (gas) for cerebral metabolic rate for oxygen before and after acetazolamide. CVR was calculated as: CVR (%) = [(CBFa−CBFb)/CBFb] × 100; where: CBFb = CBF before acetazolamide, CBFa = CBF after acetazolamide. OEF response (OEFR) was similarly calculated as: OEFR (%) = [(OEFa−OEFb)/OEFb] × 100; for the entire middle cerebral artery territory of each hemisphere.
Results: There was a highly significant (P = 0.0001) negative linear correlation between CVR and OEFR indicating increasing ischemic stress (Figure). Hemispheres from three patients showed a positive OEFR.
CVR_OEFFig.
Discussion: A positive OEFR in response to a cerebrovascular challenge definitively indicates hemodynamic compromise and eliminates the problem of deciding on the absolute threshold for OEF to signify hemodynamic compromise. A negative OEFR reflects sufficient cerebrovascular reserve relative to oxygen demand.
707. Quantitative versus qualitative OEF identification of hemodynamic compromise in stroke patients with large artery occlusion
R. Lin1, K. Uchino1, S. Zaidi1, V. Reddy1, M. Jumma1, H. Kuwabara2, D. Sashin3, Y.-F. Chang4, N. Vora5, M. Hammer1, T. Jovin1, L. Massaro1, J. Billigen1, H. Yonas6 and E. Nemoto3
1Neurology, University of Pittsburgh School of Medicine, Pittsburgh, Pennsylvania; 2Radiology, Johns Hopkins University School of Medicine, Baltimore, Maryland; 3Radiology; 4Neurosurgery, University of Pittsburgh School of Medicine, Pittsburgh, Pennsylvania; 5Neurology and Psychiatry, St Louis University School of Medicine, St Louis, Missouri; 6Neurosurgery, University of New Mexico Health Sciences Center, Albuquerque, New Mexico, USA
Objectives: The Carotid Occlusion Surgery Study (COSS) uses qualitative oxygen extraction fraction (OEF) by the count rate hemispheric ratio method to identify hemodynamic compromise in symptomatic stroke patients with internal carotid occlusion is a proven independent predictor of increased stroke risk and is being used to evaluate the efficacy of bypass surgery in reducing stroke risk compared to best medical therapy. COSS represents a major improvement over the previous study that failed to show efficacy of bypass surgery. However, our earlier study indicated that quantitative OEF alone may not accurately indicate hemodynamic compromise which may be more problematic with qualitative OEF. We determined the agreement between qualitative OEF as measured in COSS and quantitative OEF in identifying hemodynamic compromise in stroke patients with unilateral internal carotid occlusion.
Methods: Fourteen stroke patients with unilateral internal carotid occlusion were studied by positron emission tomography measurements of quantitative and qualitative oxygen extraction fraction (OEF) with15O2 gas and H215O water for brain oxygen uptake and blood flow. The qualitative COSS OEF ratio method uses seven two cm diameter volumes of interest placed over the middle cerebral artery (MCA) territory with a threshold ratio of 1.13 (ipsilateral/contralateral) to indicate ischemic stress. For quantitative OEF, the entire MCA territory of each hemisphere was analyzed with an OEF threshold of 50%. The higher of the two quantitative OEF values was included in the plot for each patient for comparison with the COSS OEF ratio method. Patients with bilateral occlusion were excluded.
Results: Three of the 14 patients were identified in hemodynamic compromise by the qualitative COSS ratio method and three by quantitative absolute OEF values >50% (Figure). However, they were different patients. Patients with quantitative OEF>50% had COSS OEF ratios ranging from 0.8 to 1.10 whereas patients with COSS OEF ratios >1.13 had absolute OEF values ranging from 30% to 47%.
Carotid Occlusion Surgery Study (COSS) qualitative OEF ratio versus quantitative OEF hemispheres with highest quantitative OEF in 14 stroke patients with unilateral internal carotid occulusion.
Conclusion: Qualitative OEF by the COSS count rate ratio method does not identify the same patients in hemodynamic compromise as those identified by quantitative OEF.
K. Uchino1, R. Lin1, S. Zaidi1, H. Kuwabara2, D. Sashin3, Y.-F. Chang4, M. Hammer1, V. Reddy1, T. Jovin1, N. Vora5, M. Jumaa1, L. Massaro1, J. Billigen1, H. Yonas6 and E. Nemoto3
1Neurology, University of Pittsburgh School of Medicine, Pittsburgh, Pennsylvania; 2Radiology, Johns Hopkins University School of Medicine, Baltimore, Maryland; 3Radiology; 4Neurosurgery, University of Pittsburgh School of Medicine, Pittsburgh, Pennsylvania; 5Neurology and Psychiatry, St Louis University School of Medicine, St Louis, Missouri; 6Neurosurgery, University of New Mexico Health Sciences Center, Albuquerque, New Mexico, USA
Objectives: The constellation of cardiovascular risk factors including hypertension, diabetes, obesity and dyslipidemia are metabolic syndrome (MetS) associated risk factors for cardiovascular disease and stroke which may also affect cerebral blood flow (CBF), vascular reactivity and oxygen metabolism (CMRO2).
Methods: Volunteers (n = 15) free of vascular disease 59±15 (mean±s.d.) years of age were studied by quantitative positron emission tomography (PET) CBF, CMRO2 and oxygen extraction fraction (OEF) before and after acetazolamide (15 mg/kg, i.v.). Magnetic resonance angiography of the brain and neck excluded subclinical cerebrovascular disease and MRI coregistration was used to define the entire hemispheric middle cerebral artery territories. Subjects with one or more of MetS risk factors or medicated were classified with MetS risk factors. Increased OEF threshold was set at 50% based on previous studies.
Results: Eight of ten subjects with MetS risk factors had OEF >50%. None of the five without risk factors had OEF >50%. The presence of MetS risk factors was highly correlated with OEF >50% by Fisher's exact test (P<0.007). The increase in OEF was significantly (P<0.001) correlated with CMRO2 (Figure). Increased OEF was not associated with compromised acetazolamide cerebrovascular reactivity.
Discussion: Although the subjects with OEF >50% did not meet strict MetS criteria, the absence of high OEF in those without these risk factors reinforces the significance of this association. The observation of increased OEF and CMRO2 with normal or even exaggerated CVR provides interesting insights into the mechanisms of MetS associated risk factors as they relate to stroke risk.
Baseline OEF and CMRO2 in 14 subjects. One subject with MetS risk factors not included had CMRO2 of 8 to 9 mL/100 g per mins and OEF of 56% and 62%. Triangles = subjects with MetS risk factors.
888. [11C]DASB PET and serotonin transporter (SERT) availability in patients with early (EO) and late—onset (LO) of obsessive-compulsive disorder
K. Stengler1, S. Hesse2, D. Assmann1, I. Jahn1, R. Regenthal3, G. Becker2, M. Patt2, H. Knuepfer3, O. Sabri2 and U. Hegerl1
1Psychiatry; 2Nuclear Medicine; 3Clinical Pharmacology, University of Leipzig, Leipzig, Germany
Introduction: First in vivo imaging studies on SERT employing SPECT and PET in patients with OCD did not reveal consistent results. Previous research has investigated whether there are clinical, demographic and neurobiological differences between subgroups of OCD, e.g. individuals who have experienced onset of OCD at an early or later age. Results suggest that patients with an early onset (EO) of the disorder report greater severity and persistence of symptoms. Additional, few studies have investigated whether there are differences in treatment response between these subgroups of OCD. Therefore, the aim of the present study was to measure selectively SERT availability using [11C]DASB and PET in patients with early and late onset of the disorder.
Methods: Seventeen unmedicated patients with OCD (ICD 10: F42.0–42.2; 8 females, age 37±9 years; age of onset 26.3±14.5 years [10 to 53]; 4 patients with early onset OCD [EOCD]) and 11 healthy age- and gender-matched controls underwent dynamic PET after the IV injection of 570 MBq [11C]DASB. Distribution volume ratios (DVR) were generated using MRTM2 and VOI analysis after co-registration of the DVR maps with the individual 3D MRI data set. Severity of OCD was estimated using the Yale-Brown Obsessive Compulsive Scale (Y-BOCS). Patients must have Y-BOCS 3 20 points for inclusion into the study. Depressive symptoms were rated using the Beck Depression Inventory (BDI).
Results: There was a negative relationship between DVR and age of onset (e.g. for the left thalamus r = −0.467, P = 0.044, age-corrected) with significant lower values in the LO-OCD compared with EO-OCD. DVR of EO-OCD patients did not differ from controls. Lower than normal DVR in OCD were found in LO-OCD in any brain region (ranging from P = 0.175 in the right dorsolateral prefrontal cortex, P = 0.003 in the hippocampus-amygdala region to P<0.001 in the corpora striatum and the thalamus). YBOCS and DVR were correlated in the right dorsolateral prefrontal cortex (R = 0.504, P = 0.028) and the left medial frontal cortex (0.473, 0.041) but there were no significant association between BDI and DVR. Age had a significant effect on DVR across the brain regions (except cerebellum) in patients (from R = −0.713, P = 0.001 in the insula to R = −0.473, P = 0.055 in the left dorsolateral frontal cortex) but not in healthy controls. Neither age nor age of onset did correlate with YBOCS.
Conclusion: The SERT availability differs depending on the age of onset in patients with OCD. Compared with either EO-OCD or healthy controls patients with LO-OCD have abnormal low SERT availability in frontal cortical areas as well as in the striatum and the thalamus.
892. Comparison of 3T proton spectroscopy with F-18 FDG PET in association with genetic biomarkers for assessment of brain tumor recurrence
F. Imani1, F. Boada1, F. Lieberman2, D. Davis1, E. Deeb1, R. Hamilton3, B. Bencherif1 and J. Mountz1
1Radiology; 2Neuro-Oncology; 3Pathology, University of Pittsburgh Medical Center, Pittsburgh, Pennsylvania, USA
Objectives: With the advancements in discovery of genetic biomarkers, targeted chemotherapy and stereotactic radiation, it is critical that an accurate noninvasive assessment of tumor grade and viability be made. We evaluated 12 patients with new symptoms, suggestive of recurrence.
Methods: Magnetic Resonance Spectroscopy Imaging (MRSI) was performed on the GE MAGNETOM Trio to provide 3D maps of Choline (Ch) over Creatine (Cr) presented on a rainbow scale. Patients also underwent FDG PET scan. Intensity of FDG uptake was rated 0 (no uptake), 1 (<white matter), 2 (= white matter), 3 (>white matter, <gray matter), 4 (= gray matter), 5 (>gray matter). FDG uptake was compared with tumor grading based on histology and genetic biomarkers (N = 7), including the loss of heterozygosity (LOH) of 1p, 19q, 9p, 10q, 17p, Ki-67 index, mutation in p53, amplification of EGFR and GFAP.
Oligodendroglioma, WHO grade 2 (case 8). (A) FDG PET scan shows a focus of increased tracer activity (grade 3) in the left temporal lobe. (B) Map of Choline/Creatine demonstrates one focus of signal intensity in the left temporal lobe.
Results of 3T MRSI, FDG PET, histology and genetic biomarkers for 9 cases
MRSI
PET Grade
Viability
Histology
LOH
Ki-67
p53
EGFR
GFAP
MGMT methylation
Positive
0
Necrosis
ANAPLASTIC OLIGODEN- DROGLIOMA
Negative
10%
Positive
Negative
Negative
Negative
0
Necrosis
ANAPLASTIC ASTROCYTOMA, WHO GRADE 3
Negative
12%
Negative
Negative
Positive
Negative
5
Tumor
ANAPLASTIC ASTROCYTOMA, WHO GRADE 3
Positive
4
Tumor
INFILTRATING MALIGNANT ASTROCYTOMA
1p, 10q, 17p
Negative
Positive
Positive
Negative
Positive
3
Tumor
ANAPLASTIC ASTROCYTOMA, WHO GRADE 3
Positive
3
Tumor
ASTROCYTOMA, WHO GRADE 2
1p, 10q
Negative
Positive
Positive
Positive
1
Tumor
OLIGODENDROGLIOMA, WHO GRADE 2
Negative
< 5%
Positive
Negative
Positive
Positive
3
Tumor
OLIGODENDROGLIOMA, WHO GRADE 2
Negative
14%
Negative
Negative
Positive
Negative
Positive
3
Tumor
OLIGODENDROGLIOMA, WHO GRADE 2
1p, 19q, 9p
6%
Negative
Negative
Positive
Positive
Results: Three patients with high grade viable tumor recurrence showed grade 3 to 5 FDG uptake but only 2 had high Ch/Cr. In 6 patients with low grade viable tumors, FDG uptake was grade 1 to 3 and Ch/Cr was elevated in all. Two of 3 patients in the low grade group with FDG uptake grade 3 showed LOH in 1p, 19q, 9p, or 10q; the third patient had high Ki-67 suggestive of high grade transformation. Three patients with necrosis showed no FDG uptake, but Ch/Cr was elevated in 1. Spearman′s analysis demonstrated strong correlation between FDG uptake and tumor grading (r = 0.91).
Conclusion: 3D co-registered MRSI maps provide complementary information to FDG PET for assessment of tumor recurrence particularly in low grade tumors. Genetic biomarkers suggestive of high grade transformation were associated with higher FDG uptake.
MRSI signal intensity is presented on a rainbow color scale where blue-green is normal background and bright red corresponds to greatly elevated signal intensity.
918. Standerdization of CBF quantification using 123I-IMP SPECT and dual table ARG method
N. Jyoji1, K. Kamiyama1, T. Osato1, H. Nakamura1 and H. Iida2
1Neurosurgery, Stroke Center, Nakamura Memorial Hospital, Sapporo; 2Investigative Radiology, National Cardiovascular Center Research Institute, Osaka, Japan
Objectives: In assessment of hemodynamic cerebral ischemia using CBF-SPECT, resting and acetazolamide-activated CBF quantifications has been performed on different day using 123-I-IMP SPECT and ARG method.1 However, 2-days CBF quantification could not overcome the errors from different arterial input functions calculated using well-counter. Also, arbitrary assessment could be occurred using non-stereotactic ROI analysis on axial plane. In this study, the accuracy of dual table ARG (DTARG)2 which was developed as 1-day CBF quantification was investigated to establish the standardization of CBF quantification.
Methods: Sixteen normal volunteers were involved in this study, and DTARG was performed using a split equivalent dose of 123-I-IMP and common arterial input function. In resting CBF quantification, a relationship between the pixel value of 1st SPECT and resting CBF was tabled using two-compartment model, and then the 1st SPECT was transformed to resting CBF map. In acetazolamide-activated CBF quantification, a relationship between the pixel values of the 2nd SPECT and acetazolamide-activated CBF was tabled using dual two-compartment model for both resting and acetazolamide- activated CBF. Vascular reserve (VR) was defined as [(acetazolamide-activated CBF−resting CBF)/resting CBF × 100%]. For estimating diagnostic accuracy, CBF in vascular territories were measured by standardized ROI template (Flexer algorism) and segmental extraction estimation (SEE).3 SEE could demonstrate resting and acetazolamide-activated CBF, VR, stage of hemodynamic ischemia on the standardized brain surface image developed in 3D-SSP.4
Results: Using standardized ROI analysis for axial plane of mid-basal ganglia, mean resting CBF±s.d. was measured as 38.7±9.1(Rt), 38.0±8.3 (Lt) mL/100g per mins in ACA, 40.4±8.5, 39.2±8.7 mL/100g per mins in MCA, 39.7±7.8, 39.2±7.1 mL/100g per mins in PCA territories. Mean VR was measured as 42±20, 44±15% in ACA, 46±15, 47±17% in MCA, 44±19, 42±18% in PCA territories. Using SEE analysis, mean resting CBF was measured as 38.2±7.9, 38.1±8.2 mL/100g per mins in ACA, 38.1±7.3, 38.6±7.5 mL/100g per mins in MCA, 38.7±6.7, 38.1±6.4 mL/100g per mins in PCA territories. Mean VR was measured as 45±13, 45±16% in ACA, 48±15, 47±14% in MCA, 45±16, 47±15% in PCA territories. Territorial CBF in standardized ROI analysis was compatible to surface CBF using SEE analysis. Stage2 hemodynamic ischemia has been defined as both CBF less than 80% of normal mean CBF and VR less than 10% in MCA territory, significant reduction of renting CBF was comparable to mean CBF−1s.d. and significant reduction of VR was comparable to mean VR−2s.d.
Conclusions: Introduction of DTARG could make 1-day quantification of both resting and acetazolamide-activated CBF which overcomes measurement errors associated with 2-days CBF quantification. Also, introduction of SEE could make stereotactic assessment of severity of hemodynamic cerebral ischemia and its serial changes. These newly developed assessments for CBF-SPECT could improve the accuracy of SPECT quantification and diagnostic decision, and could promote the standardization of CBF quantification using SPECT.
974. Imaging of regional red blood cell mass in the rat brain by high-resolution, quantitative NanoSPECT/CT technology
D. Máthé1, I. Portörő2, G. Németh1 and A. Eke2
1Mediso Ltd.; 2Institute of Human Physiology and Clinical Experimental Research, Semmelweis University, Budapest, Hungary
Objectives: Regional oxygen supply by red blood cells (RBCs) within the regional cerebral blood volume (rCBV) has a major impact on brain functions. Hence, our motivation—by using a NanoSPECT/CT small animal imaging system with its proprietary Multiplexed-Multipinhole Collimation for in vivo quantitative SPECT1—was to develop a method for imaging RBC mass in the brain. As a test, rCBV was decreased by increasing the vascular tone via the NO/cGMP pathway by L-NAME.
Methods: Male Wistar rats (n = 4) were anesthetized by a 1:1 mixture of Ketamine-Xylasine solutions (100 mg/mL and 5 mg/mL, respectively) given i.p. in a dose of 2.5 mL/kg bdw for induction, followed by an hourly maintaining dose of 1.5 mL/kg bdw. Catheters were inserted into the femoral artery and vein.
RBCs were labeled with 99mTc using stannous pyrophosphate as reducing agent (20 μg Sn (II)/kg bdw, i.v.). Thirty minutes later, 1 mL of pre-treated arterial blood was withdrawn and gently mixed with 1 mL of 99mTc-pertechnetate solution of ∼ 200 MBq activity, and allowed to stand for 10 mins prior to re-injection. Labeled RBCs were re-injected (in 0.7 mL with approximate activity of 70 MBq) for mapping RBCs 5 mins post-injection.
Two animals were treated by L-NAME (100 mg/kg bdw, i.v.). Scans were acquired for control and at 44 mins following the L-NAME injection. Animals were sacrificed by saline infusion (a total of 100 mL) given via the arterial line with concomitant drainage via the venous line in order to remove blood from the brain's parenchyma.
Cerebral RBC mass (CRBCM) was characterized by activities normalized by the brain's volume (as shown in an exemplary experiment in the Figure).
Biodistribution of 99mTc-labeled red blood cells.
Results: No activities were found in the thyroids and in the stomach, the sites where free 99mTc-pertechnetate in blood accumulates if present; an evidence of a larger then 99% purity of radiolabeling. Hot spots in the brain were detected at sites of venous sinuses and the circus of Willis. CRBCM decreased in the L-NAME treated animals, as anticipated, while 99mTc-activity became about a magnitude smaller (0.03 mBq/cm3) after saline infusion demonstrating the specificity of the 99mTc-radiolabeling for RBCs.
Conclusions: Quantitative NanoSPECT technology is efficient to assess regional RBC mass in the rodent brain.
Acknowledgement: Supported by the National Office for Research and Technology Grant 2008ALAP1-01569/2008 given to A. Eke.
945. Reduction of mGluR5 binding sites in hippocampi from patients with pharmaco-resistant temporal lobe epilepsy: an autoradiographic study
L. Minuzzi1, E. Kobayashi2, J. Hall2, M.-C. Guiot3, F. Andermann2, F. Dubeau2, M. Diksic2, G. Massarweh4, J.-P. Soucy4 and P. Rosa-Neto1
1Translational Neuroimaging Laboratory—MCSA, Douglas Hospital, McGill University; 2Department of Neurology and Neurosurgery; 3Department of Pathology; 4Brain Imaging Center, Montreal Neurological Institute, McGill University, Montreal, QC, Canada
Objectives: Metabotropic glutamate receptors (mGluR) have an important role in the regulation of neuronal excitability. Immunohistochemistry studies have found abnormalities in the mGluR type 5 (mGluR5) in the hippocampus of patients with temporal lobe epilepsy (TLE). The objective of this study is to determine the maximum concentration and affinity of mGluR5 in cryosections of human hippocampus from healthy controls and TLE patients who underwent surgical treatment for refractory seizures. In vitro quantitative autoradiography was performed using the mGluR5 radioligand [3H]ABP688.
Methods: Human hippocampi were obtained from five healthy controls (Brain Bank, Douglas Hospital) and five patients operated for refractory TLE (Montreal Neurological Institute). The tissue was cryosectioned at 20 μm and a saturation binding study was carried out according to1 with some modifications. The slides were pre-incubated for 20 mins in buffer containing 30 mmol/L Na-HEPES, 110 nmol/L NaCl, 5 mmol/L KCl, 2.5 mmol/L CaCl2 and 1.2 mmol/L MgCl2 (pH 7.4) and then incubated for 60 mins in the presence of [3H]ABP688 (74 Ci/mmol) at a range of concentrations from 0.125 to 8 nmol/L. Non-specific binding was determined with addition of 10 μmol/L MPEP. The slides were washed (3 × 5 mins) in cold buffer, dipped in ice-cold water and dried. The sections along with autoradiographic standards were exposed for five days to phosphor imaging plates. The Bmax and KD of [3H]ABP688 from both groups were calculated by saturation binding analysis and compared using F-test (P<0.05).
Results: Saturation binding of [3H]ABP688 revealed higher Bmax in the control group in comparison to patients (1.31±0.06 and 0.89±0.16 pmol/mg of tissue, respectively). The 30% reduction of Bmax in the epileptic hippocampi was statistically significant (P = 0.01). Control group showed slightly higher KD (1.43±0.2 nmol/L) in comparison to the epileptic group (1.0±0.5 nmol/L) with no statistical difference.
Conclusions: The present study showed a reduction of the total amount of mGluR5 in epileptic hippocampi in comparison to controls. Autoradiography provides gold standard quantification of receptors in human tissue, establishing the mGluR5 reduction in hippocampus as a possible phenomenon involved in the hyperexcitable circuitry in the seizure focus. This reduction is in agreement with in vivo mGluR5 binding studies with positron emission tomography performed in these same patients before the surgical treatment.
SchweinhardtPFranssonPOlsonLSpengerCAnderssonJL. A template for spatial normalisation of MR images of the rat brain, J Neurosci Methods2003;129(2):105–13.
11.
CasteelsCVermaelenPNuytsJVan Der LindenABaekelandtVMortelmansLBormansGVan LaereK. Construction and evaluation of multitracer small-animal PET probabilistic atlases for voxel-based functional mapping of the rat brain. J Nucl Med2006;47(11):1858–66.
12.
KannoI. J Cereb Blood Flow Metab1988;8:227–35.
13.
HyderF. J App Physiol1998;85:554–64.
14.
IbarakiM. J Nucl Med2008;49:50–59.
15.
PeppiattCM. Nature2006;443:700–4.
16.
HatazawaJ. Stroke1999;30:800–6.
17.
Kim. Neuroimage2006;33(4):1126–35.
18.
Kretschmann. Cranial Neuroimaging and Clinical Neuroanatomy: Magnetic Resonance Imaging and Computed Tomography,2003.
19.
IidaH. J Nucl Med1994;35:2019–30.
20.
KimKM. Neuroimage2006;33:1126–35.
21.
MizumuraS. Ann Nucl Med2004;18:13–21.
22.
MinoshimaS. J Nucl Med1995;36:1238–48.
23.
NikolausS.. European Journal of Nuclear Medicine and Molecular Imaging2005;32:308–313.
24.
HintermannSVranesicI. ABP688, a novel selective and high affinity ligand for the labeling of mGlu5 receptors: Identification, in vitro pharmacology, pharmacokinetic and biodistribution studies. Bioorg Med Chem2007;15(2):903–14.
25.
NotenboomRGHampsonDR. Up-regulation of hippocampal metabotropic glutamate receptor 5 in temporal lobe epilepsy patients. Brain2006;129:96–107.
26.
TangF-RLeeW-L. Expression of the group II and III metabotropic glutamate receptors in the hippocampus of patients with mesial temporal lobe epilepsy. J Neurocytol2001;30:137–43.