
Abstract
Intracerebral hemorrhage (ICH) produces a high rate of death and disability. The molecular mechanisms of damage in perihematomal tissue in humans have not been systematically characterized. This study determines the gene expression profile and molecular networks that are induced in human perihematomal tissue through molecular analysis of tissue obtained from endoscopic clot evacuation. Differentially expressed genes and their cellular origin were confirmed in a mouse model of ICH. A total of 624 genes showed altered regulation in human ICH. Bioinformatic analysis shows that these genes form interconnected networks of proinflammatory, anti-inflammatory, and neuronal signaling cascades. Intracerebral hemorrhage evokes coordinated upregulation of proinflammatory signaling through specific cytokines and chemokines and their downstream molecular pathways. Anti-inflammatory networks are also induced by ICH, including annexins A1 and A2 and transforming growth factor beta (TGF β) and their intracellular cascades. Intracerebral hemorrhage downregulates many neuronal signaling systems, including the
Introduction
Intracerebral hemorrhage (ICH) is a common and lethal stroke subtype. Intracerebral hemorrhage constitutes 15% to 20% of all strokes, with only 10% of victims independent at 1 month and 38% survival after 1 year (Qureshi et al, 2001). Intracerebral hemorrhage produces primary damage from the initial hemorrhage and dissection through tissue planes, and an evolving secondary phase of injury in the surrounding tissue. Apoptotic cell death and tissue necrosis occur adjacent to the hemorrhage (Qureshi et al, 2001; Xi et al, 2006). In humans, ICH induces secondary damage in the brain through the induction of cerebral edema and perihematomal injury (Qureshi et al, 2001; Xi et al, 2006).
Perihematomal edema with mass effect is an almost universal complication of the ICH, elaborated over several days after the initial insult. Perihematomal blood flow is reduced, but not to ischemic levels (Miller et al, 2007). Nonetheless, several additional pathologic processes occur in human perihematomal tissue, including glutamate release, bioenergetic failure, inflammation, and apoptosis.
Microdialysis of perihematomal regions shows massive local glutamate release; blood glutamate levels correlate with hemorrhage size and reduced functional outcome after stroke (Kidwell et al, 2001; Castillo et al, 2002; Miller et al, 2007). Animal studies support these findings in showing elevated glutamate levels, abnormal glutamate signaling, and increased lactate production in a region with preserved blood flow in perihematomal tissue (Ardizzone et al, 2004; Wagner, 2007). Diffusion magnetic resonance imaging studies show that one-quarter of the patients exhibit a perihematomal region of diffusion abnormality most likely because of advanced bioenergetic failure (Kidwell et al, 2001). Unlike acute ischemic stroke, these processes in perihematomal tissue occur at a delay after ICH— when patients are in the hospital and under direct medical observation. This creates a frustrating clinical scenario because patients' condition worsens at the time in which there is maximal potential for medical intervention. This pattern of clinical worsening in perihematomal tissue highlights the significance of studies that may provide basic insights into the cellular mechanisms of perihematomal damage and edema after ICH. However, there have been no systematic studies of the molecular pathways in human perihematomal tissue that mediate this secondary brain damage.
Molecular and cellular studies in animal models of ICH indicate that hemorrhage induces inflammation, apoptotic cell death, and progressive tissue destruction in perihematomal tissue. Intracerebral hemorrhage produces a prompt infiltration of white blood cells, inflammatory cytokine production, and secondary inflammatory gene activation during a period of apoptotic cell death (Felberg et al, 2002; Lu et al, 2006; Xi et al, 2006; Wagner, 2007; Wasserman et al, 2007). Gene expression profiling in rat models of ICH indicate a robust upregulation of inflammatory genes in perihematomal tissue (Lu et al, 2006; Wasserman et al, 2007). Studies of human white blood cell gene expression patterns also indicate an inflammatory reaction in blood after ICH (Tang et al, 2006). However, these same studies have shown a poor correlation between genomic expression patterns in peripheral blood in rat ICH compared with peripheral blood in human ICH (Tang et al, 2001, 2006).
The present studies were undertaken to determine the gene expression profile in human perihematomal tissue in the acute period after ICH. On the basis of experimental animal studies, we hypothesized that ICH would induce inflammatory cytokine signaling centered around tumor necrosis factor-α (
Materials and methods
Human Subjects
Tissue was obtained from patients and index cases in a clinical trial (Hemorrhage Evacuation using MR-guided Endoscopy Surgery—HEME Surgery trial). The HEME Surgery trial was a study to evaluate the feasibility, safety, and potential efficacy of minimally invasive, magnetic resonance-guided endoscopic hematoma evacuation after ICH. Patients were randomized to receive clot evacuation or maximal medical care within 24 h of the hemorrhage. No patient received intracranial pressure (ICP) monitoring or activated factor VIIa before clot removal and tissue sampling. The UCLA Institutional Review Board approved the study protocol and consent form.
Genomic studies were performed on perihematomal parenchymal tissue adherent to removed clot. No specific perihematomal wall biopsy was performed; rather, the adherent tissue typically incidentally removed during hematoma evacuation was carefully isolated. After clot evacuation, the evacuated material was immediately rinsed of blood in ice-cold buffered saline and adherent neural parenchymal tissue microdissected off the clot. One sample was not included because of insufficient tissue adherent to the clot. The typical size of the aliquot of microdissected brain parenchyma was 150 to 200 mg. Two-thirds of the tissue was sent to UCLA Neuropathology for diagnostic evaluation and one-third was immediately frozen in liquid nitrogen. Control tissue was obtained from five autopsy cases within 4 h of death from the same brain areas as the sites of the ICH specimens: frontal and parietal cortex; putamen and subcortical white matter (Table 1). Death in these cases was from cardiopulmonary arrest in the setting of advanced but healthy aging (Table 1) and did not occur after prolonged illness. Previous studies have shown that RNA isolation from autopsy cases up to 40 h after death in this clinical situation produces good RNA quality without evidence of systematic changes in gene expression patterns (Li et al, 2004; Stan et al, 2006). This lack of a systematic effect of this postmortem interval on the relevant genes in this study was confirmed with mouse gene expression analysis (Supplementary Figure 1).
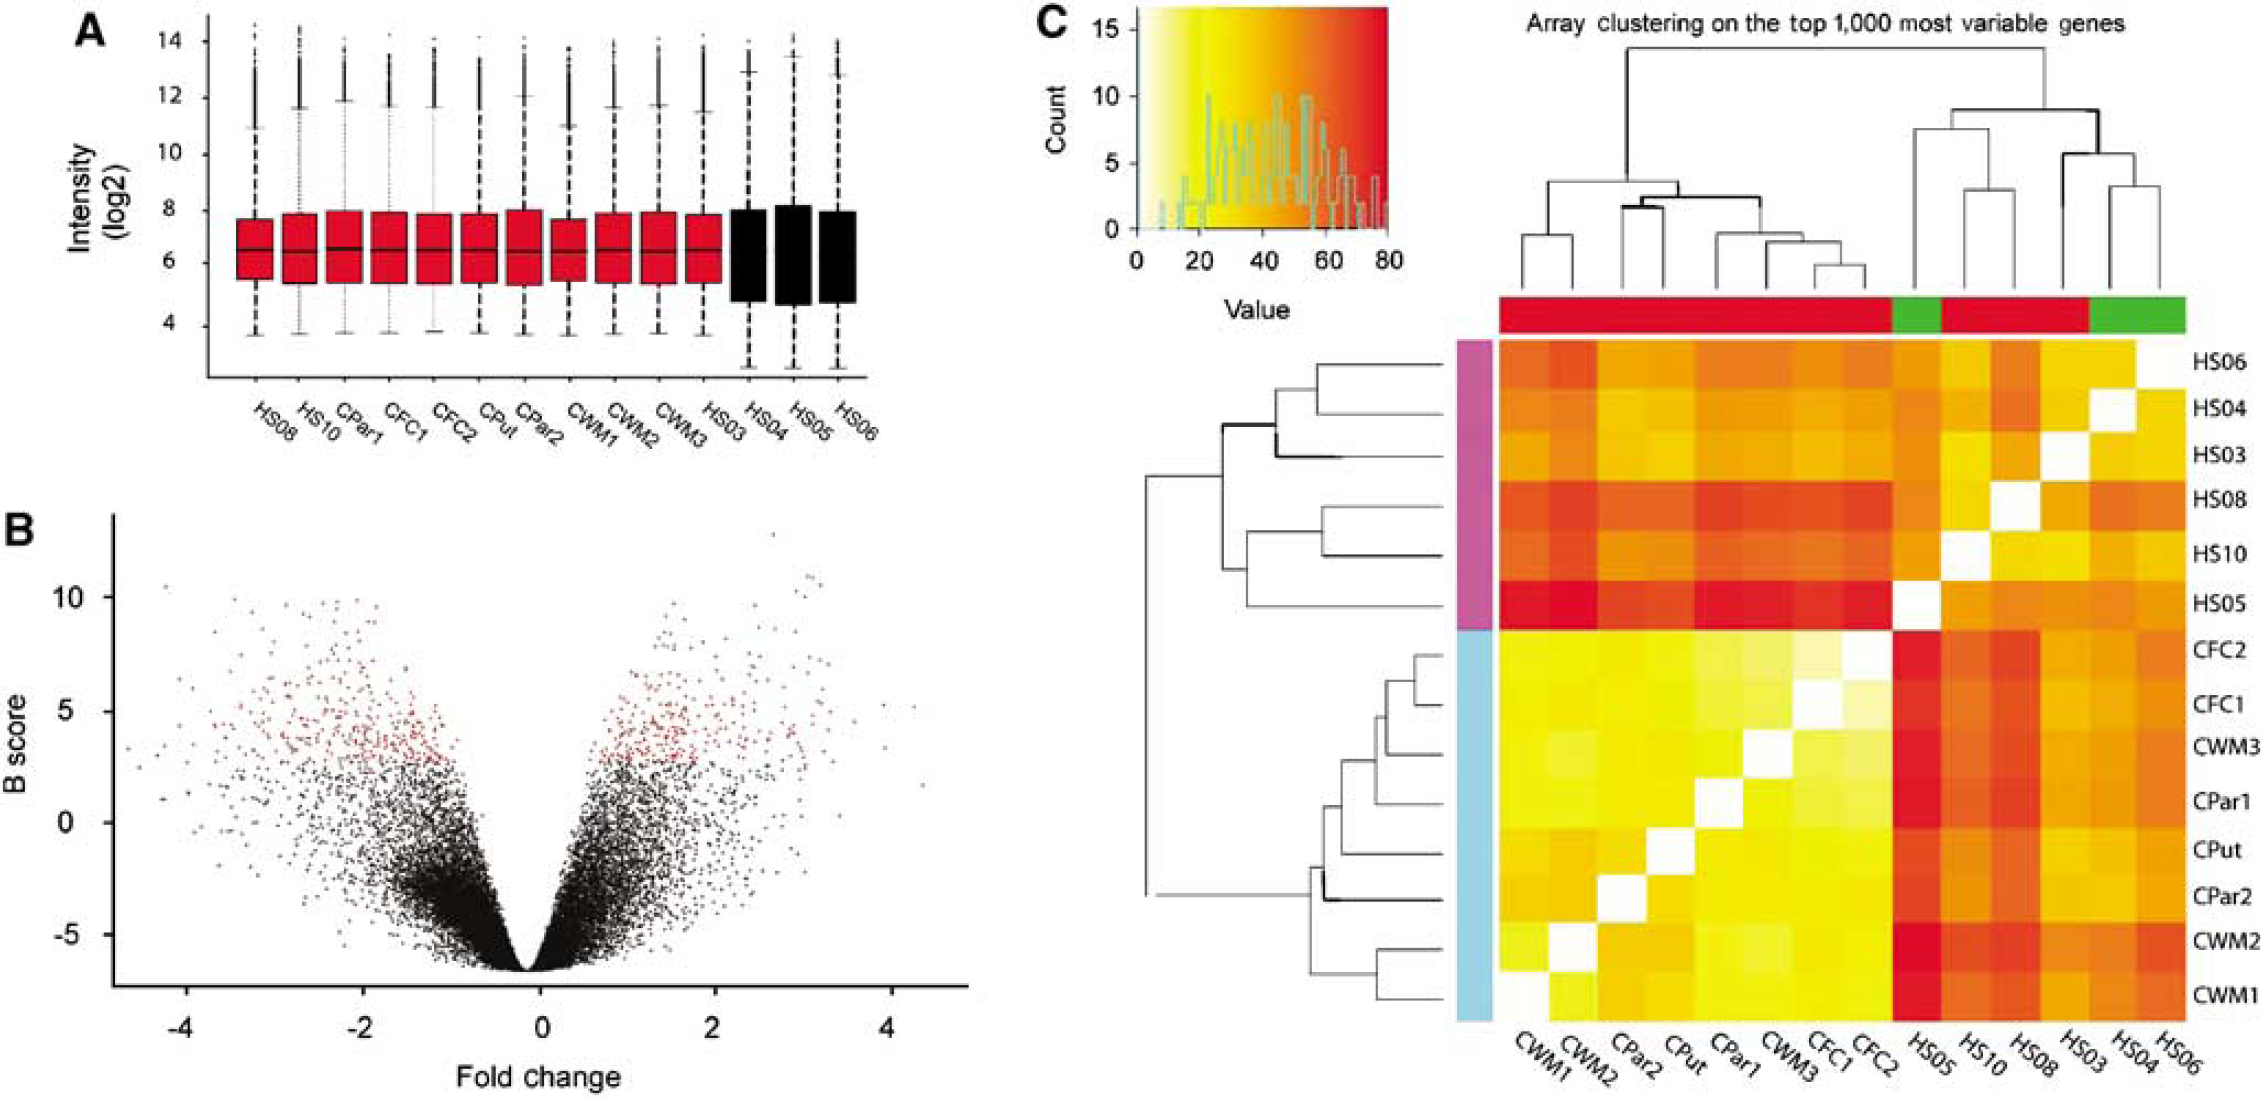
Microarray analysis of human perihematomal brain samples. (
Case
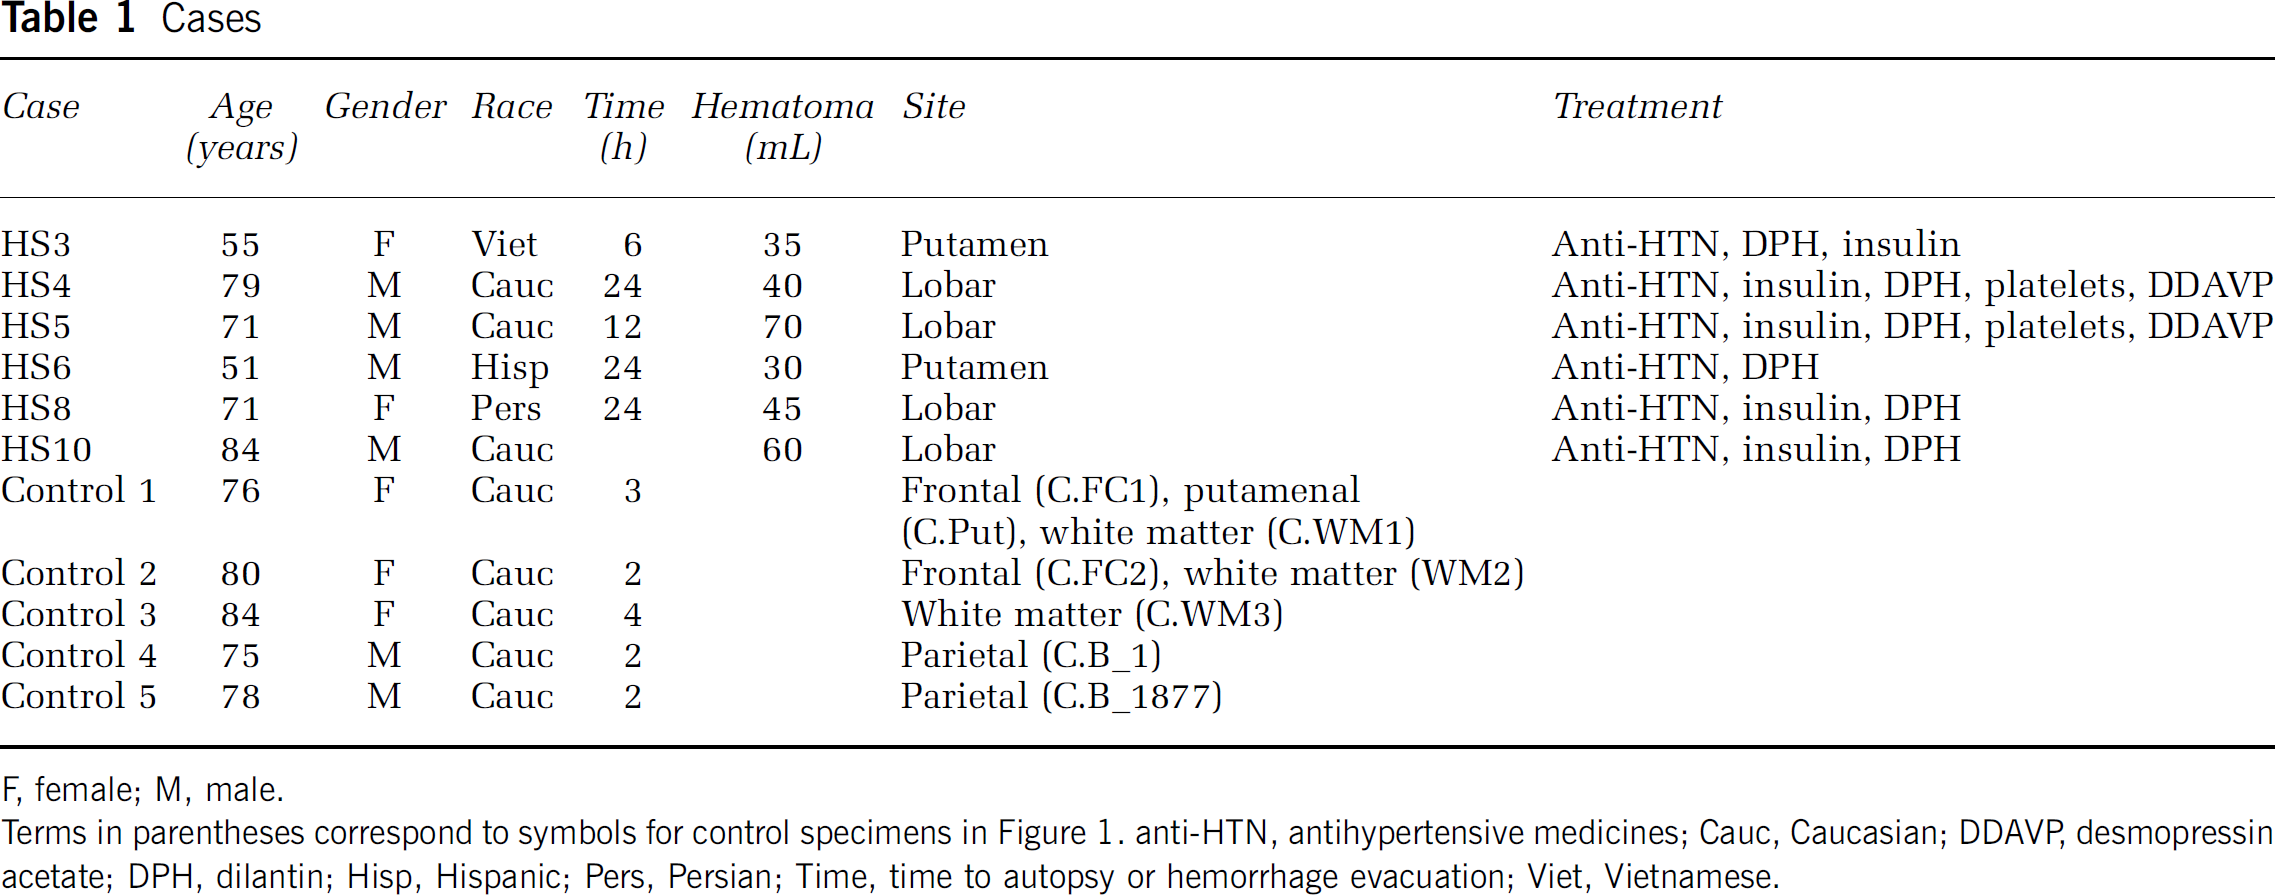
F, female; M, male.
Terms In parentheses correspond to symbols for control specimens In Figure 1. anti-HTN, antihypertensive medicines; Cauc, Caucasian; DDAVP desmopressin acetate; DPH, dilantin; Hisp, Hispanic; Pers, Persian; Time, time to autopsy or hemorrhage evacuation; Viet, Vietnamese.
RNA Isolation and Array Hybridization
Total RNA was isolated with TRIzol reagent (Carmichael et al, 2005) and RNA integrity assayed (Nanochip, Agilent Biotechnologies, Santa Clara, CA, USA). Three samples were rejected because of insufficient RNA quality (28s:18s ribosomal RNA ratio < 1.7). These samples were microdissected and frozen in excess of 10 mins from the time of endoscopic clot retrieval. The remaining six samples and all control samples had excellent RNA quality (ribosomal RNA 28s:18s > 1.7; Supplementary Figure 1). Total RNA was used to generate probes for microarrays following the manufacturer's guidelines (performed in conjunction with the UCLA Microarray Core facility).
Array Analysis and Bioinformatics
The data set included 14 arrays (8 controls on the u133a platform, 3 perihematomal cases on the u133a platform, and 3 perihematomal on the u133plus platform). Raw data from CEL files were loaded in R statistical software using the ‘affy’ package. RNA degradation was estimated using 3ʹ/5ʹ ratios in RNA degradation plots and was not significant (Supplementary Figure 2). Intensity values for individual probes were (1) log2-transformed and background corrected, then (2) normalized using quantile normalization, and (3) summarized in individual probe sets using median polish. Data from the two platforms were merged after normalization (MergeMaid package; http://www.bioconductor.org), and the shared probe sets (22,277) were used for further analyses. Quality assessment was performed looking at interarray Pearson's correlation, and clustering based on top variant genes was used to assess overall data coherence (Figure 1 and Supplementary Figure 2). Contrast analysis of differential expression was performed using the LIMMA package (http://www.bioconductor.org). After linear model fitting, a Bayesian estimate of differential expression was calculated using a false discovery rate (FDR) of 0.001%. Differentially expressed genes were also ranked according to their B score (Figure 2), which ranks genes according to the highest probability of being differentially expressed (Huber et al, 2005). A differentially expressed gene in this FDR of 0.001 data set was accepted only with a B score ≥ 1.5.
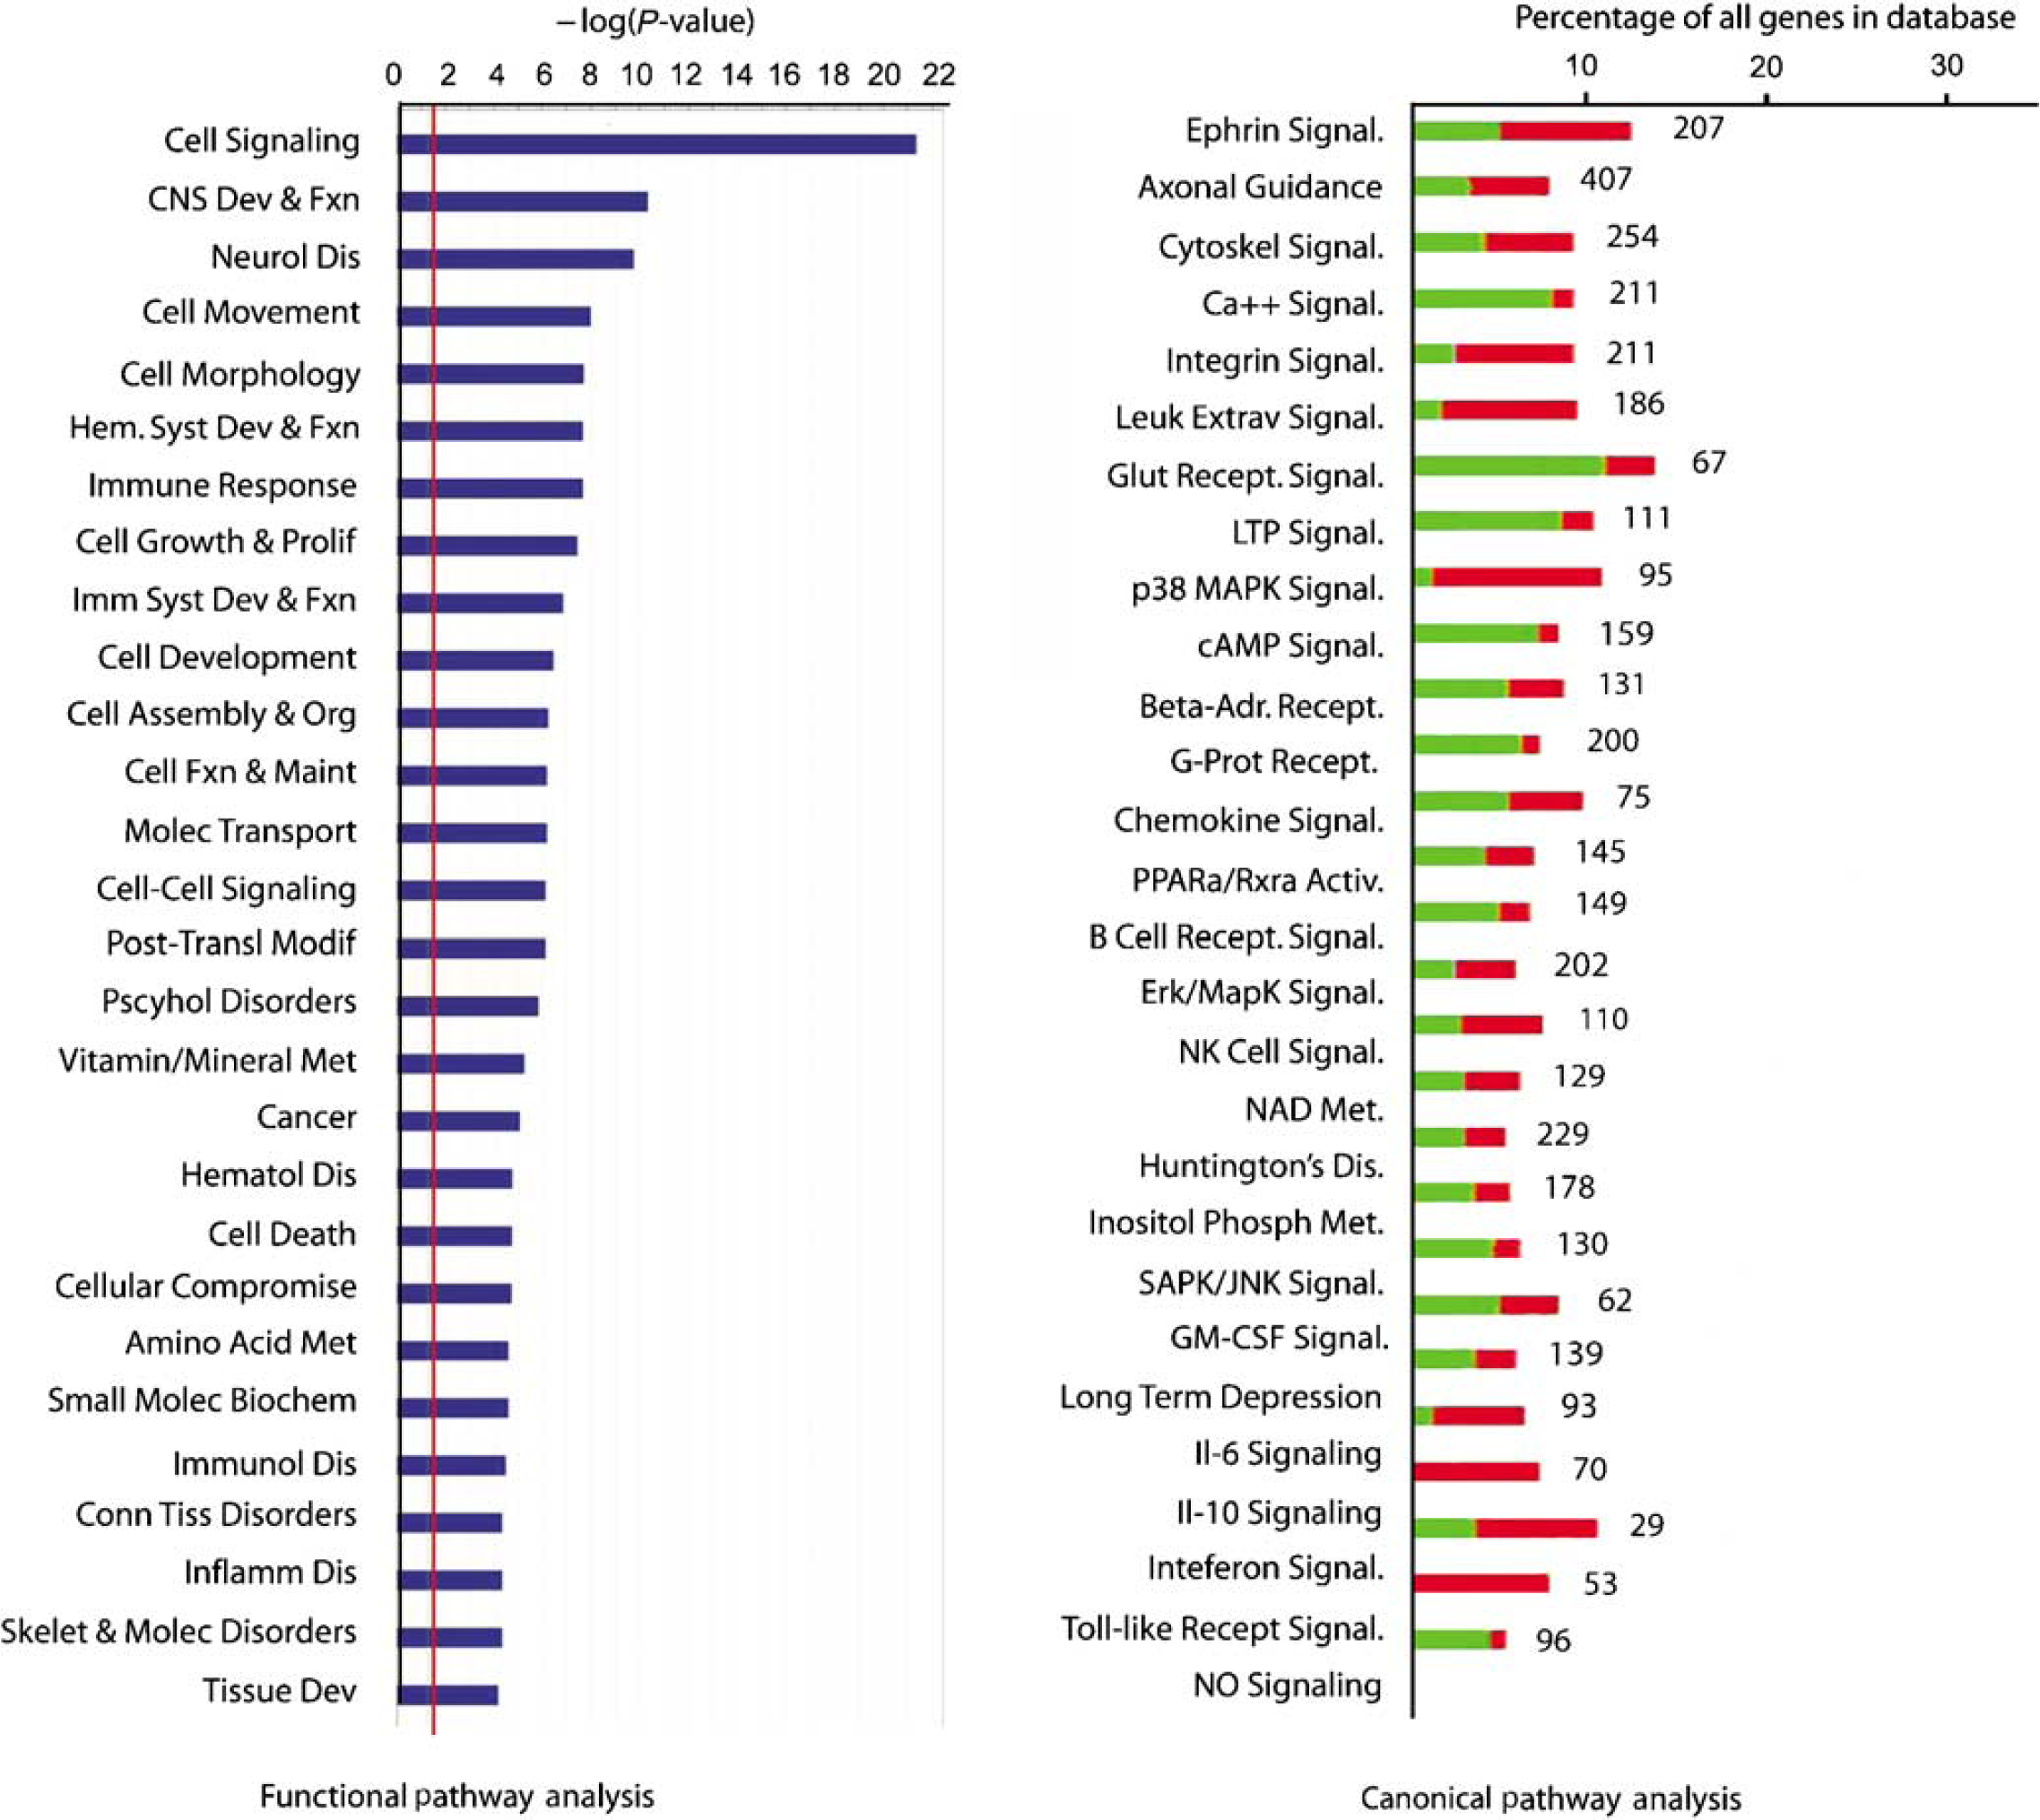
Functional grouping of differentially expressed genes. The red line in the left graph indicates the threshold for a significant association, the -log(0.05). The right plot shows the percentage of genes within a canonical signaling pathway that are differentially regulated by ICH versus the total number of genes in the database for that pathway. Green indicates the number that is downregulated; red is upregulated. The number at the right of the column indicates the total number of genes for that category in the database. All of the association in the canonical signaling pathway are significant (Fisher's exact
Gene Ontology and Pathway Analysis
This set of differentially regulated genes was submitted to gene ontology (DAVID/EASE, http://david.niaid.nih.gov/david/ease.htm) and molecular pathway analysis (Ingenuity Systems, Redwood City, CA, USA; www.ingenuity.com). Molecular pathway analysis was used to classify the significantly regulated genes into coherent biologic systems, and was carried out at two levels. In the first level, the genes differentially expressed after ICH at the FDR of 0.001 level were tested for their association into known functional pathways and canonical receptor/cell signaling pathways. In this analysis, genes were tested for significant association in specific cell functional or signaling pathways versus random chance association in a total curated database of gene interactions of over 23,900 human, rat, and mouse genes by right-tailed Fisher's exact test (Ingenuity Systems). Significance was assessed by testing the number of genes that were regulated by ICH in a specific pathway versus total number of genes in this database for that pathway. Data were plotted both as the significance value and as the ratio of ICH-regulated genes versus total genes (Figure 2). In the second level of analysis, the FDR of 0.001 genes were tested for molecular interactions within this database that forms specific gene networks. This analysis determines individual biologic pathways in which the genes that are induced in perihematomal tissue participate (Figure 3).
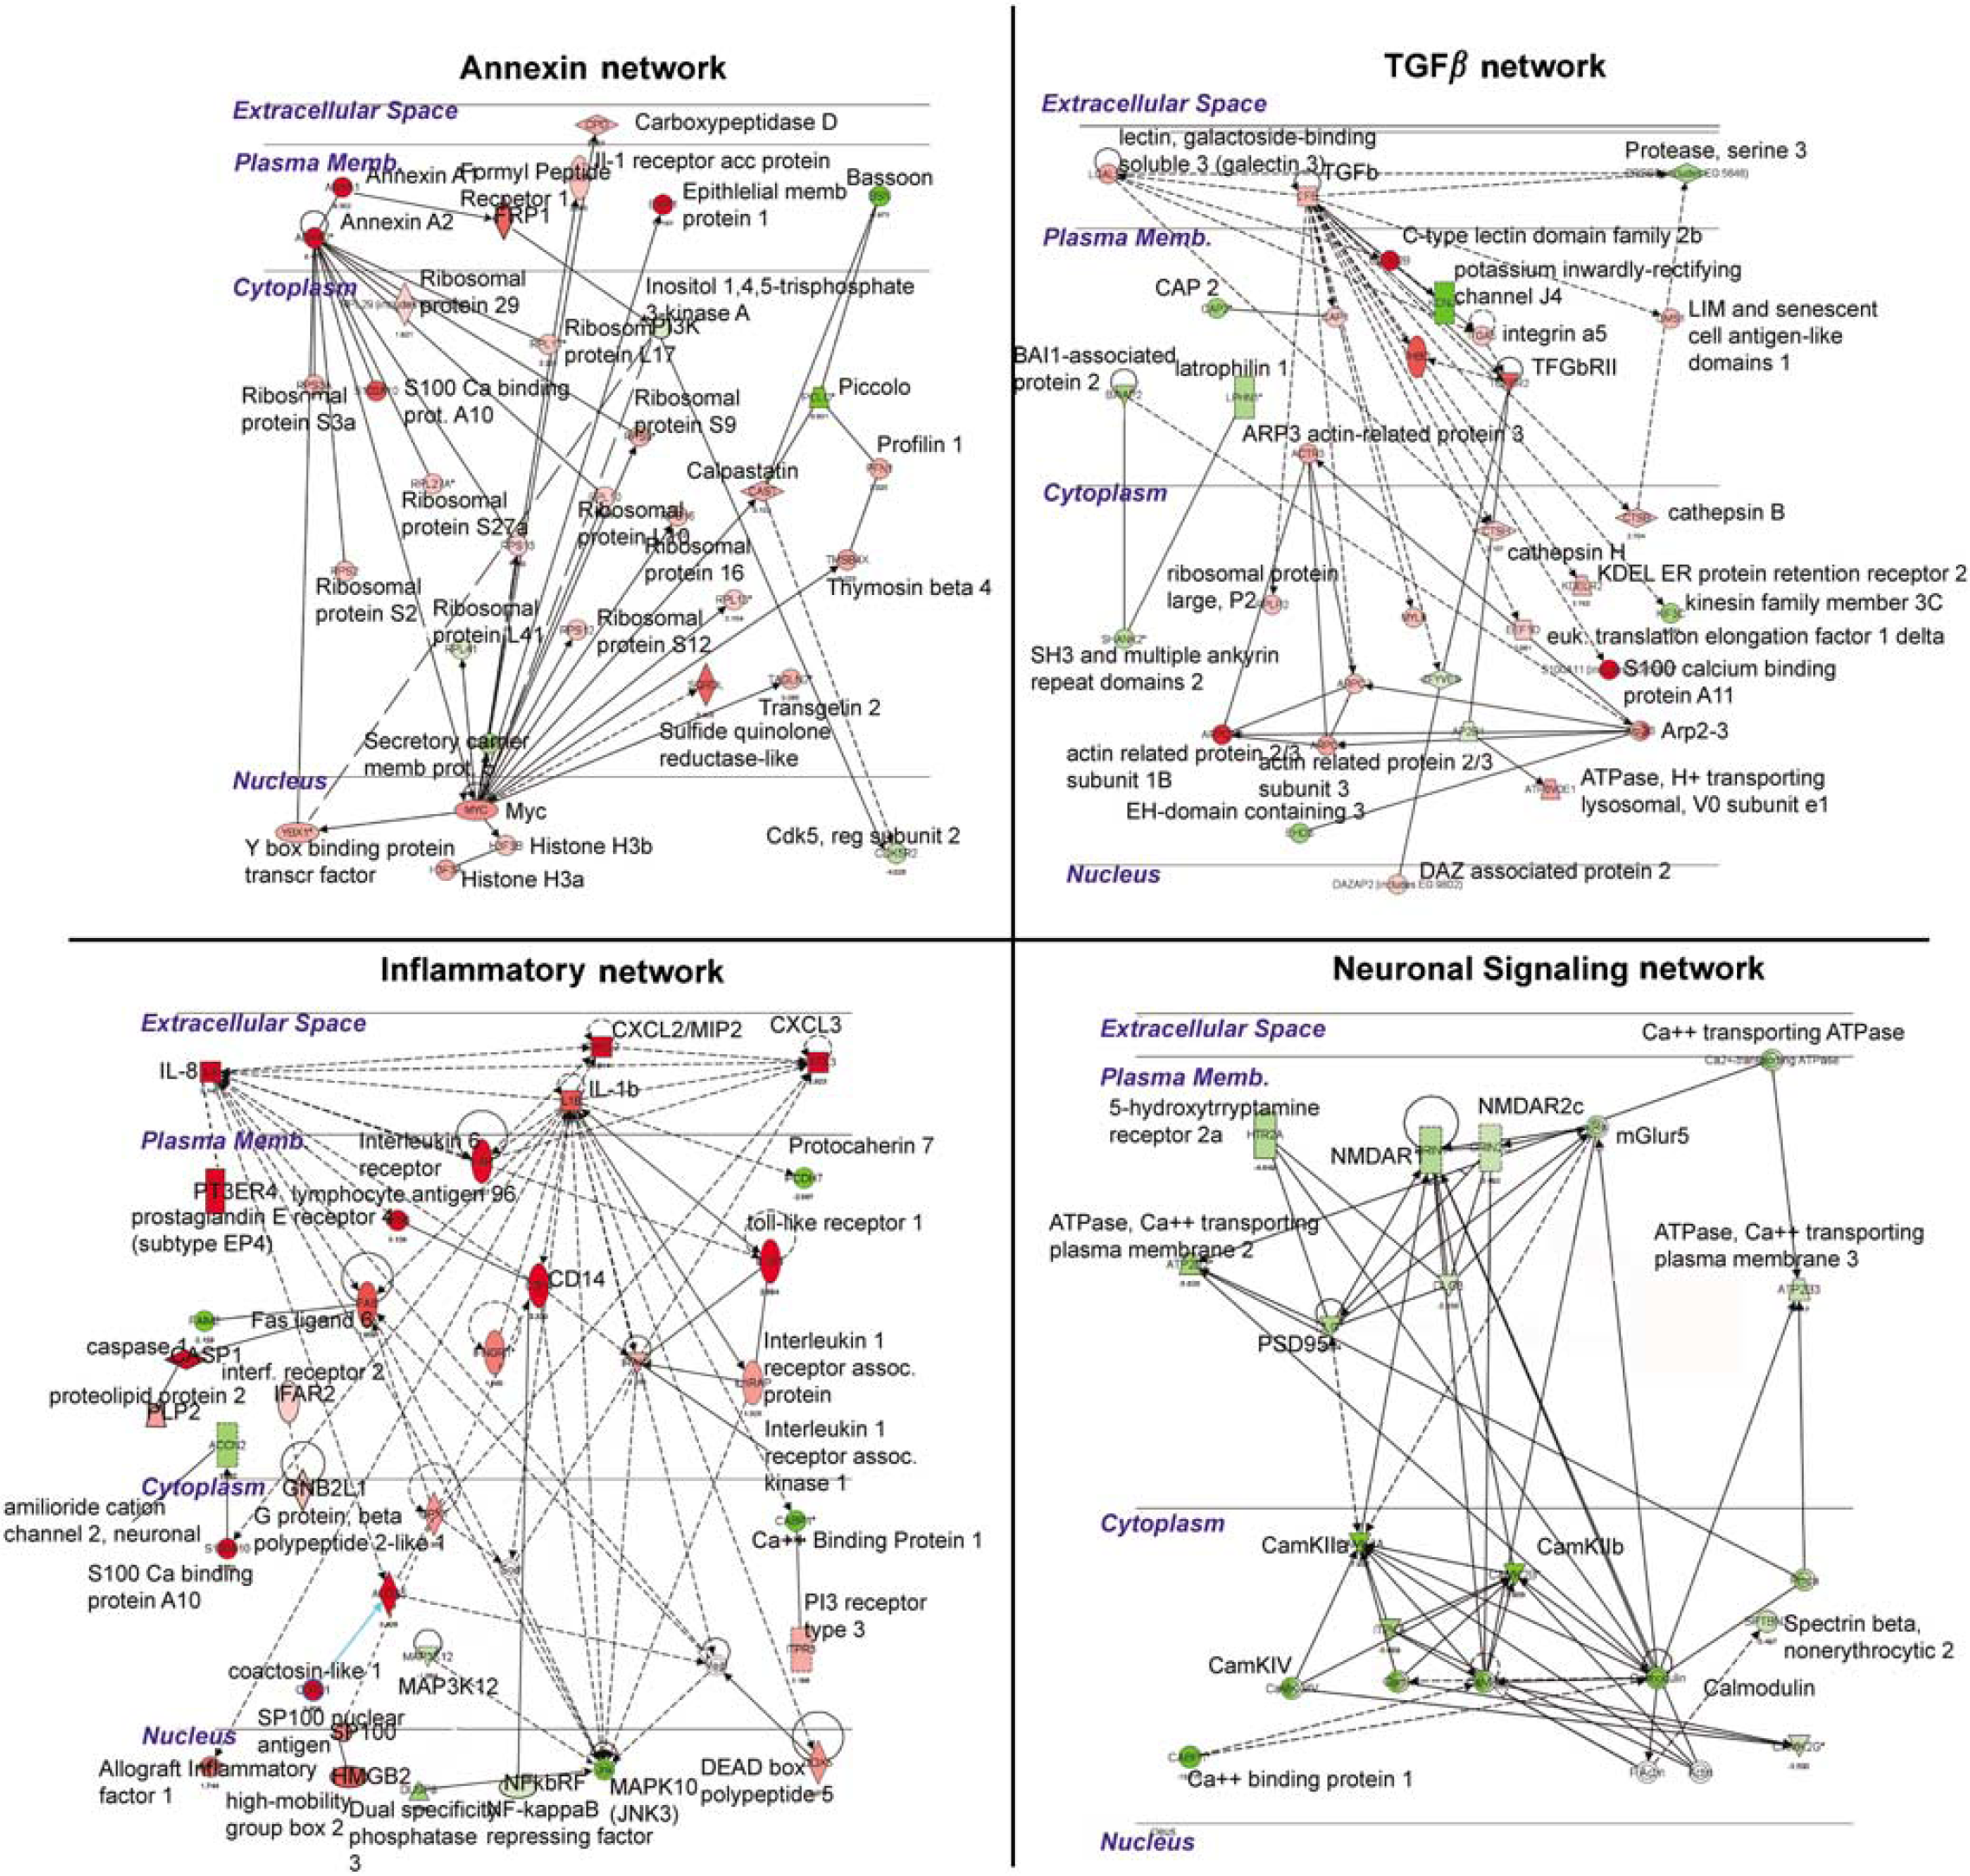
Molecular networks regulated by ICH in perihematomal tissue. Each quadrant shows a network of interacting genes and gene products whose expression is differentially regulated in response to ICH. Genes colored red are upregulated; genes colored green are downregulated. Solid lines depict a direct physical interaction between two proteins, such as annexin A1 directly binding the formyl peptide receptor 1. Dotted lines indicate an indirect interaction, such as an alteration in expression levels, posttranslational modification, or changes in protein localization.
Mouse Intracerebral Hemorrhage Model
One-third of the human brain sample was available for gene expression analysis (two-thirds of each sample being submitted for neuropathological diagnosis), limiting the amount of RNA left over for confirmatory studies. For this reason, a mouse model of ICH was used to study gene expression levels with an independent method, quantitative reverse-transcription polymerase chain reaction (qRT-PCR), and to localize select differentially regulated genes in specific cell types with tissue immunohistochemistry. Mouse ICH was produced using a well-characterized method of a single injection of nonclotted autologous blood (Nakamura et al, 2004; Xue et al, 2006) in a procedure approved by the UCLA Chancellor's Animal Research Committee. Briefly, adult male C57Bl6 mice were anesthetized with isoflurane in N2O/O2, the scalp incised, and a small burr hole opened at A/P 0.86, M/L 2.0 (Paxinos and Franklin, 2001). A volume of 10 μL of blood, drawn from the tail tip, was injected at 0.6 μL/min through a 30 gauge needle attached to a Hamilton syringe that was placed 2.5 mm deep to the surface of the brain. Sham ICH animals received saline injection at the same rate. Control animals underwent skin incision and burr hole drilling but no blood injection. One cohort of animals (
Quantitative Reverse-Transcription Polymerase Chain Reaction
Total RNA was isolated from mouse perihematomal tissue (RNeasy minikit, Qiagen, Valencia, CA, USA) and assayed for integrity (Nanochip, Agilent Technologies, Santa Clara, CA, USA). 28s:18s rRNA ratios were consistently greater than 1.75 (Supplementary Figure 1). Quantitative reverse-transcription polymerase chain reaction was performed as described (Carmichael et al, 2005). A total of 2 μg of total RNA was converted to cDNA in a single-step reverse transcription reaction (Omniscript, Qiagen). This product was used for a PCR reaction using SYBYR green with fluorescence quantification software and compared with mRNA levels of
Immunohistochemistry
Fluorescent immunohistochemistry was performed as described (Ohab et al, 2006). A mouse-on-mouse staining protocol was used according to the manufacturer's guide-lines (Vector Labs, Burlingame, CA, USA) except that streptavidin cy3 (Molecular Probes/Invitrogen, Carlsbad, CA, USA) was used to minimize background staining with mouse primary antibodies. In all experiments, no-primary and no-secondary antibody controls were run in parallel. These showed no specific staining. The primary antibodies were rabbit anti-CCR1 (CC chemokine receptor 1, 1:200; Abeam, Cambridge, MA, USA), mouse anti-IL1R1 (1:100; Abeam), rabbit anti-annexin A1 (1:500; Abeam), mouse anti-annexin A2 (1:100; Zymed, San Franeiseo, CA, USA), rat anti-CD68 (1:100; AbD Serotee, Raleigh, NC, USA), rat anti-glial fibrillary acidic protein (GFAP, 1:500; Zymed/Invitrogen, Carlsbad, CA, USA), mouse anti-NeuN (1:500; Chemieon, Temeeula, CA, USA), ehieken anti-tissue inhibitor of metalloproteinase 1 (TIMP-1; 1:200; R&D Systems, Madison, WI, USA), goat anti-aquaporin 9 (1:200; Chemieon), and sheep anti-earbonie anhydrase II (CAII, 1:300; Abeam). Tissue seetions for each animal were also stained for Nissl substanee using standard protocols.
Results
Gene Expression Characteristics of Human Perihematomal Tissue
Neuroendoscopic clot removal was performed within 24 h of ICH. The evacuated clot tissue contained both gray and white matter components from the region of the hemorrhages: putamen, frontal and parietal cortex, and subcortical white matter. The gene expression profile of perihematomal tissue in this study was obtained from six subjects, ranging in age from 51 to 84 years (Table 1). Control tissue was obtained from autopsy specimens in brain areas that matched the sites of primary hemorrhage in the ICH cases. The arrays showed minimal RNA degradation and a close correlation of signal intensity (Figure 1A, Supplementary Figure 1 and Figure 2). Interarray Pearson's correlation showed no effects of array hybridization batch, array platform, sample accrual time, or postmortem interval on array signals (data not shown). A Bayesian estimate of differential expression was calculated using an FDR of 0.001%. This is a highly stringent statistical cutoff for significance in gene expression levels that controls for multiple comparisons and means that 1 out of 1,000 genes would be expected as false positive in this comparison. At this statistical level, most genes are not significantly different in perihematomal versus control tissue (Supplementary Figure 2B) and show an expected normal distribution around a ‘0‘-fold change in expression level in perihematomal versus control (Figure 1B). The experimental and control tissues contained a potentially large degree of genetic variation in subject characteristics (sex, age, and race), hemorrhage type (lobar versus hypertensive), and tissue origin (putamen, parietal/frontal cortex, and white matter). Unsupervised cluster analysis of arrays was performed to determine whether these genetic variations contribute to gene expression differences that would obscure those related to perihematomal versus control differences. Unsupervised clustering of the 1,000 most variably expressed genes showed a very tight segregation of perihematomal arrays versus control arrays, as assessed by both heat map plots (Figure 1C) and dendrogram plots (Supplementary Figure 2C). This segregation indicates that, despite genetic variation in the subjects, in the types of hemorrhage and in the site of origin of the brain samples, the gene expression profile in human perihematomal tissue is very distinct from the control nonhemorrhagic brain.
Gene Expression Profile of Human Perihematomal Tissue
A total of 624 genes (331 downregulated and 293 upregulated) are differentially expressed in perihematomal tissue versus control (FDR < 0.001, see Supplementary Table 2 for list). This gene set was further analyzed in its organization into functional cellular pathways. Ranking these by significance reveals that most of the genes induced in perihematomal tissue belong to pathways functionally associated with central nervous system development and disease, immune responses and general immune system function, and the cell biology of signaling, cell movement, development, and metabolism (Figure 2, Supplementary Figure 2D). To further break down this gene set, genes were grouped according to their statistical association with known canonical molecular pathways. Intracerebral hemorrhage induces a pattern of gene expression in 27 canonical pathways (Figure 2). A large number of these relate to neuronal or cellular signaling functions, including glutamate receptor signaling, synaptic signaling (long-term depression and potentiation), calcium signaling, and ephrin pathways. Similar to the functional pathway analysis, canonical pathway analysis shows that ICH induces or downregulates genes in several inflammatory pathways, including leukocyte extravasation, chemokine signaling, Toll-like receptor signaling, and the cytokine pathways of
Differential gene expression in perihematomal Tissue
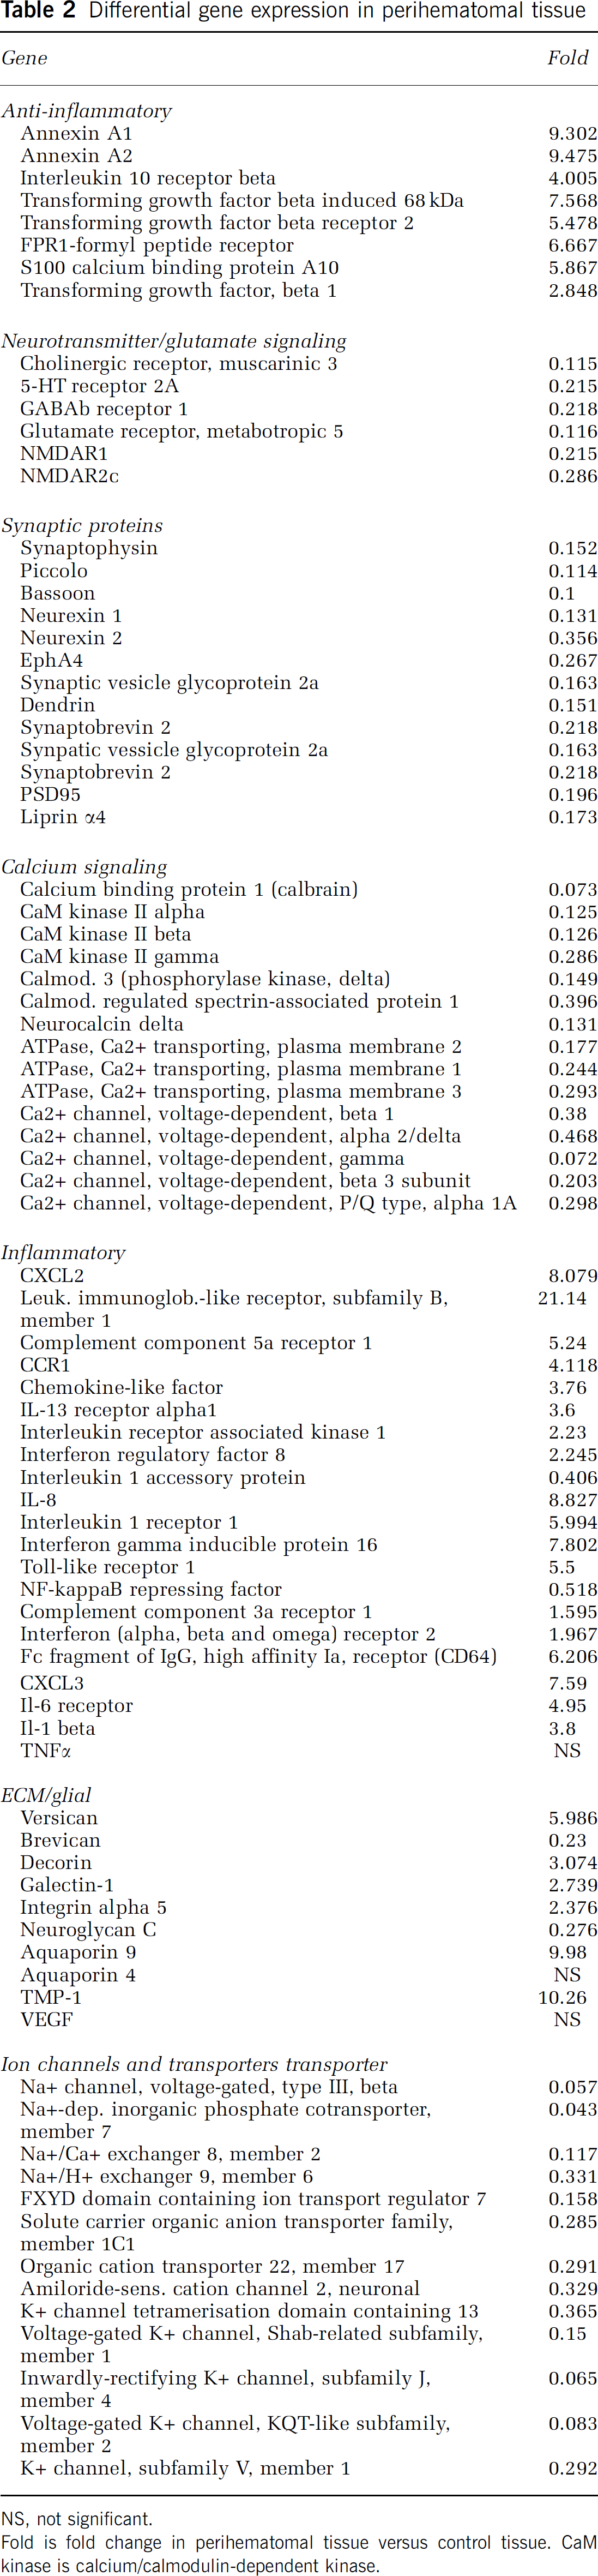
NS, not significant.
Fold is fold change in perihematomal tissue versus control tissue. CaM kinase is calcium/calmodulin-dependent kinase.
To better define specific members of these functional molecular groups in human perihematomal tissue, the genes regulated by ICH at FDR of 0.001 (Supplementary Table 2) were assessed individually for their molecular associations (Table 2). A large number of inflammatory genes are induced in human perihematomal tissue. These include the chemokines
To identify specific relationships between genes that are coordinately regulated by ICH in perihematomal tissues, the differentially regulated genes were submitted to an unsupervised molecular pathway analysis. Seventeen different networks contain 15 or more genes that are significantly regulated by ICH in perihematomal tissue and form specific cellular signaling pathways. Four pathways contain distinct, multilevel, and interrelated gene systems with greater than 25 genes regulated by ICH: Annexin, TGFβ, IL/chemokine, and NMDA/neuronal signaling systems (Figure 3). These will be described in detail. Six additional networks contain several interconnected gene systems with hubs at genes that are regulated by the ICH/fibroblast growth factor (FGF) network, CDC42/TIMP-11 network, PTEN network, G-protein network, mitogen activated protein kinase (MAPK)/RhoA network, and an ID2 network (Supplementary Figure 3).
In the four networks with the most highly interconnected genes, ICH regulates inflammatory, anti-inflammatory (annexin and TGFβ), and neuronal glutamate receptor interactions in perihematomal tissue (Figure 3). In these pathways, ICH induces specific genes that function in signaling from the cell surface through cytoplasmic proteins to nuclear transcription factors. Intracerebral hemorrhage induces a highly integrated network of chemokines
In summary, a relatively small number of all genes tested (624 out of over 14,500) are differentially regulated by ICH after a stringent analysis. Networks of proinflammatory and anti-inflammatory genes are coinduced in human perihematomal tissue. In contrast, major aspects of neuronal synaptic function (membrane receptors and ion channels and their protein kinase second messenger cascades) are downregulated.
Mouse Intracerebral Hemorrhage: Quantitative Reverse-Transcription Polymerase Chain Reaction
Perihematomal gene expression was studied with qRT-PCR in a mouse model of ICH (Figure 3) to test the array findings with an independent technique and to extend the human findings in an experimental brain hemorrhage model. In this model, autologous blood injection into the striatum produces inflammatory cell infiltration, edema, and neuronal cell death within the first 24 h (Nakamura et al, 2004; Xue et al, 2006). Perihematomal tissue from the mouse striatum at 1 day after ICH was compared with sham ICH and with control striatum/subcortical white matter. There was no significant difference in gene expression between sham ICH and control so these two groups were combined. Intracerebral hemorrhage significantly upregulates
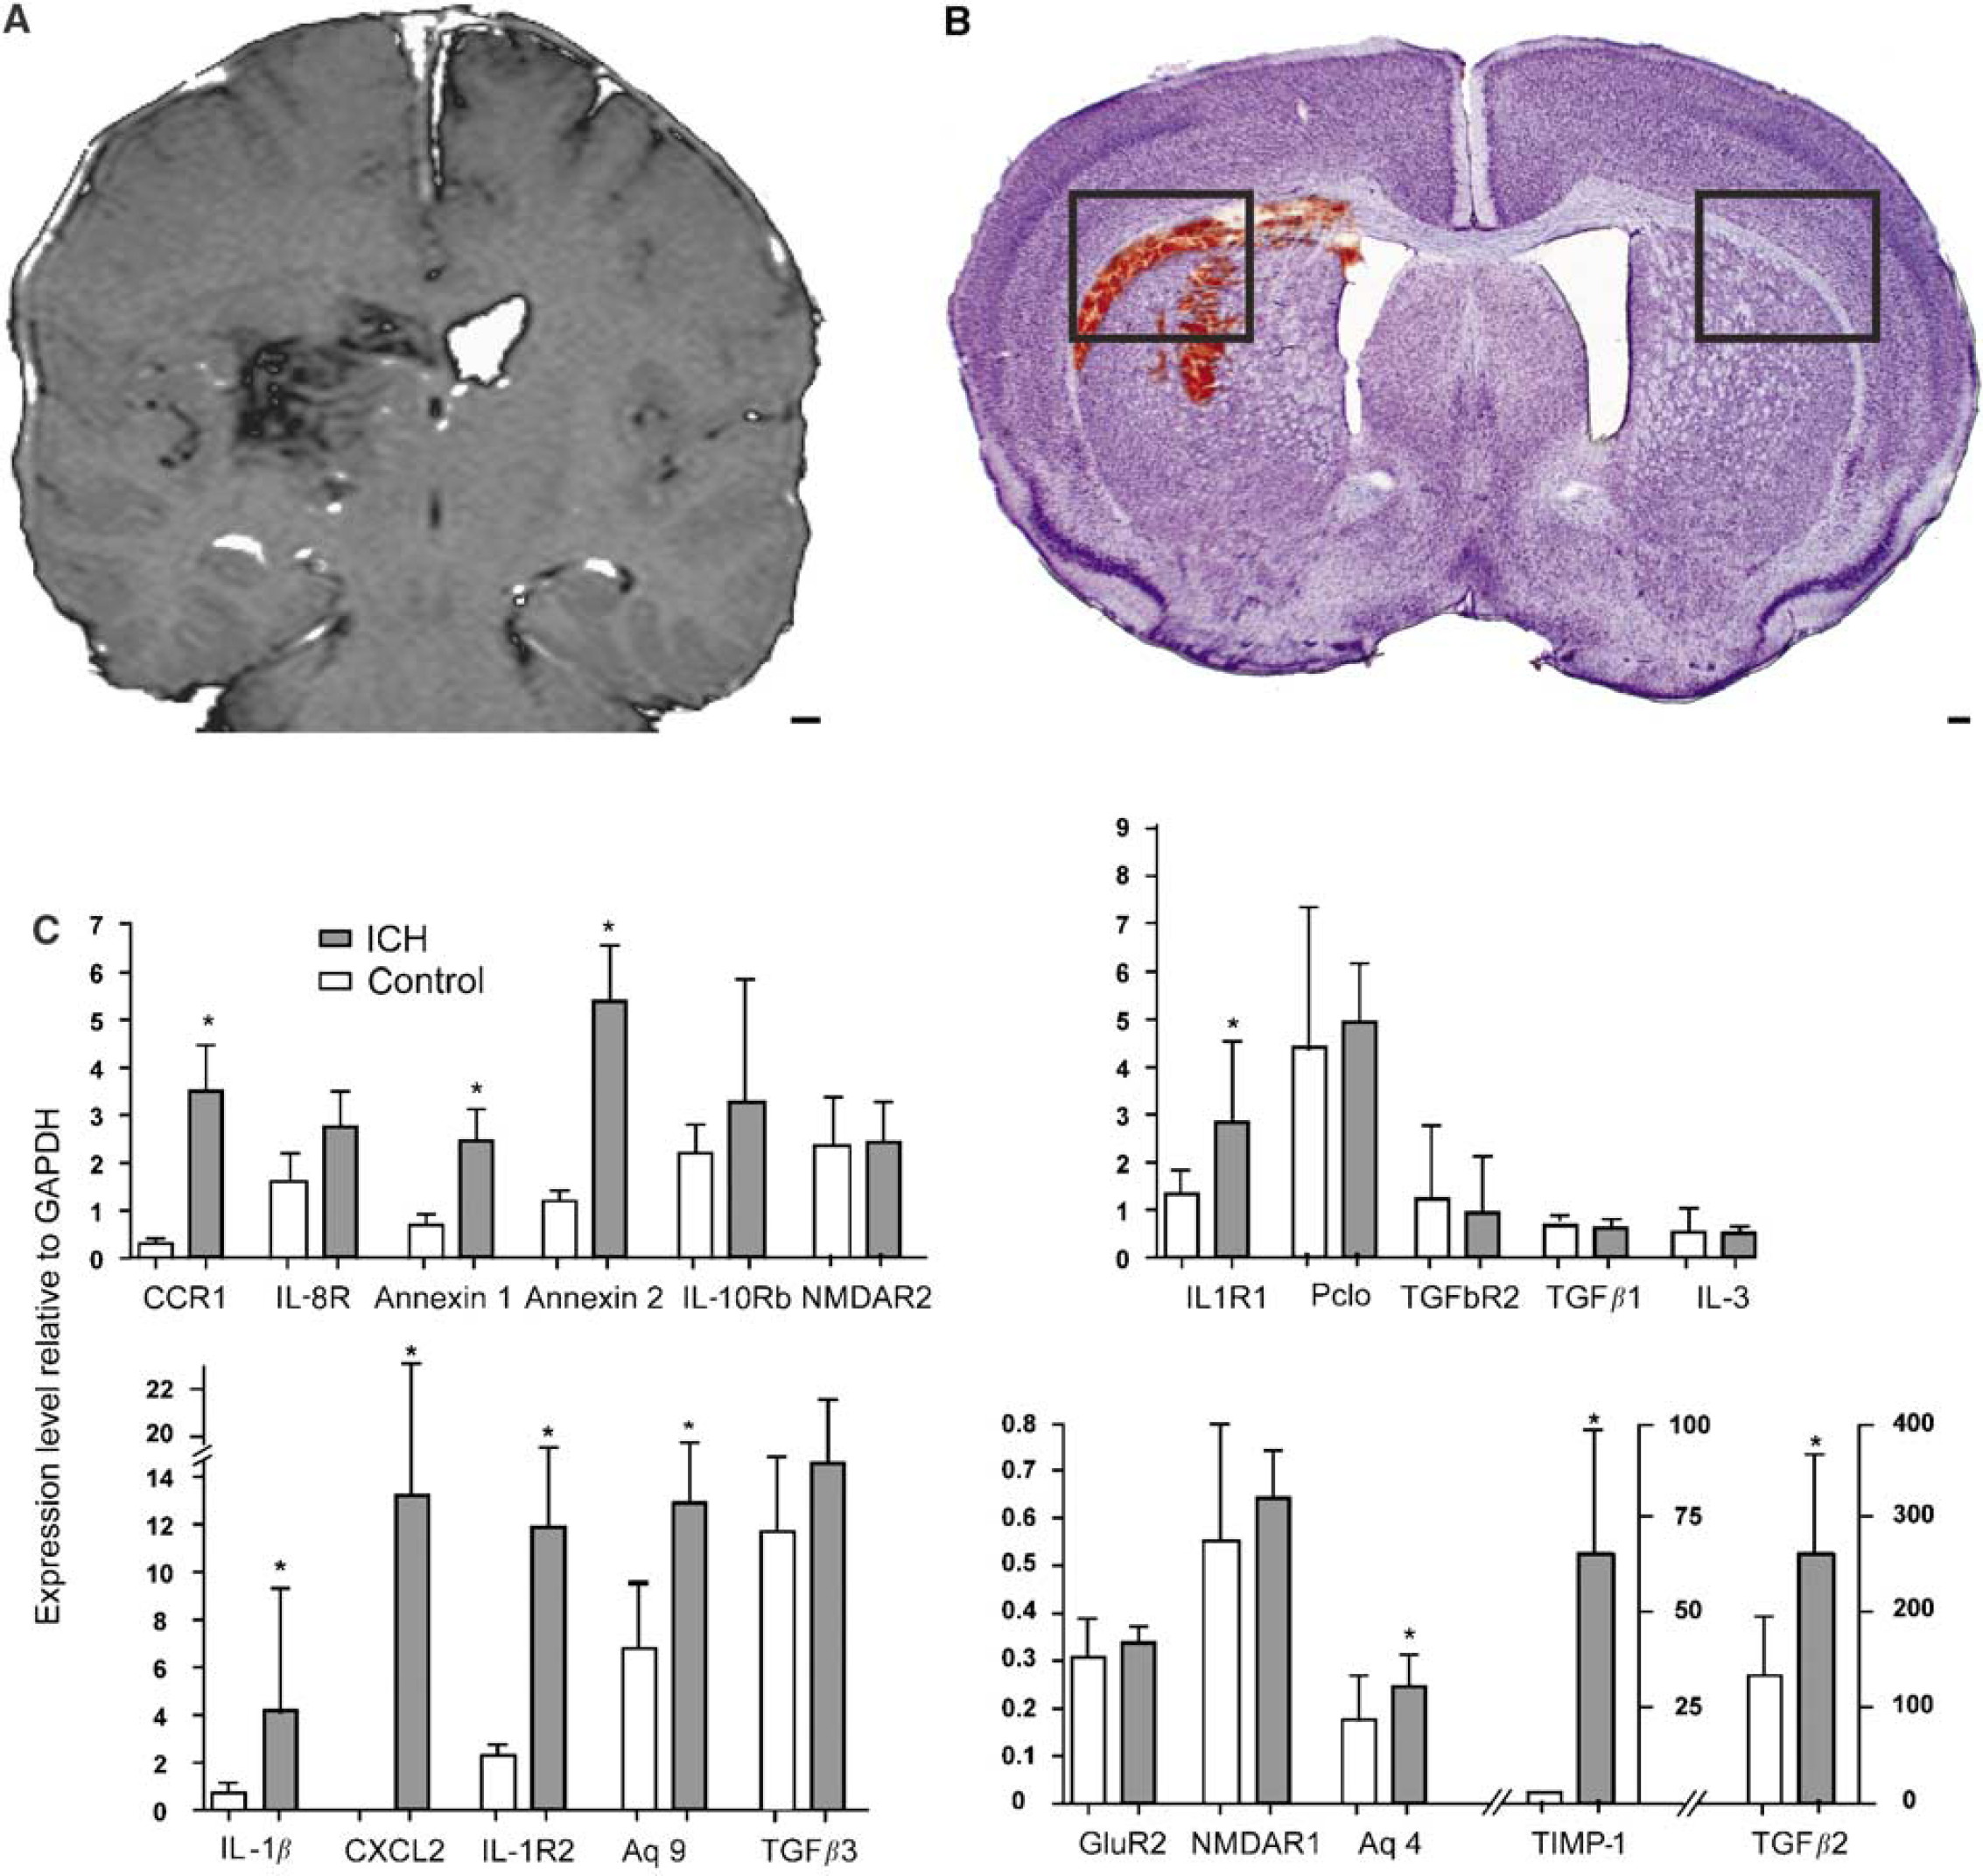
Mouse ICH model and qRT-PCT testing of differentially regulated genes in human perihematomal tissue. (
Mouse Intracerebral Hemorrhage: Cellular Localization of Induced Genes
Multilabel immunofluorescent studies were used to localize protein products of select genes at 1 day after ICH in the mouse. Both annexins A1 and A2 are induced in cells that border the hemorrhage site in the striatum, as well as in the cortex that borders the edematous white matter above the striatum (Figures 5A and Figure 5C). Annexin A2 immunoreactivity is present in cells that are also positive for the mature neuronal marker NeuN (Figure 5D). Annexin A1 staining colocalizes with annexin A2 staining in these same cells (Figure 5E). Baseline annexin staining in the hemisphere contralateral to the ICH (Figure 5A) and in control brains (data not shown) is not present in neurons. Thus, ICH induces annexins A1 and A2 expression in perihematomal neurons in the striatum and the cortex. Tissue inhibitor of metallproteinase 1 immunoreactivity is normally present in endothelial cells and neurons in the striatum and white matter. After ICH, this protein is induced in reactive astrocytes (Figure 5F, Supplementary Figure 4D). CD68-positive inflammatory cells infiltrate the hemorrhage site and both blood-borne macrophages and microglia are present in perihematomal tissue. These cells express IL1R1 (Supplementary Figure 4). Interleukin-1R1 localizes with annexin A2-positive cells and is also present in cells with the neuronal morphology of after ICH (Figure 6B, Supplementary Figure 4B). Aquaporin 9 is weakly present in control tissue in neurons and astrocytes. After ICH, there is increased staining in reactive astrocytes (Figure 5F; Supplementary Figure 4E). The chemokine CCR1 is present in cells that form chains in white matter that is adjacent to ICH and in inflammatory cells that infiltrate the ICH and perihematomal tissue (Figure 6D). These chains of CCR1-immunoreactive cells also stain for markers of mature oligodendrocytes, including myelin basic protein (data not shown) and carbonic anhydrase II (Figure 6C and Figure 6F). Neurons and astrocytes do not express CCR1 (Figure 6E). These data suggest a cell type-specific response in perihematomal tissue, with neurons upregulating annexins, oligodendrocytes upregulating CCR1, and astrocytes upregulating TIMP-1 and aquaporin 9.
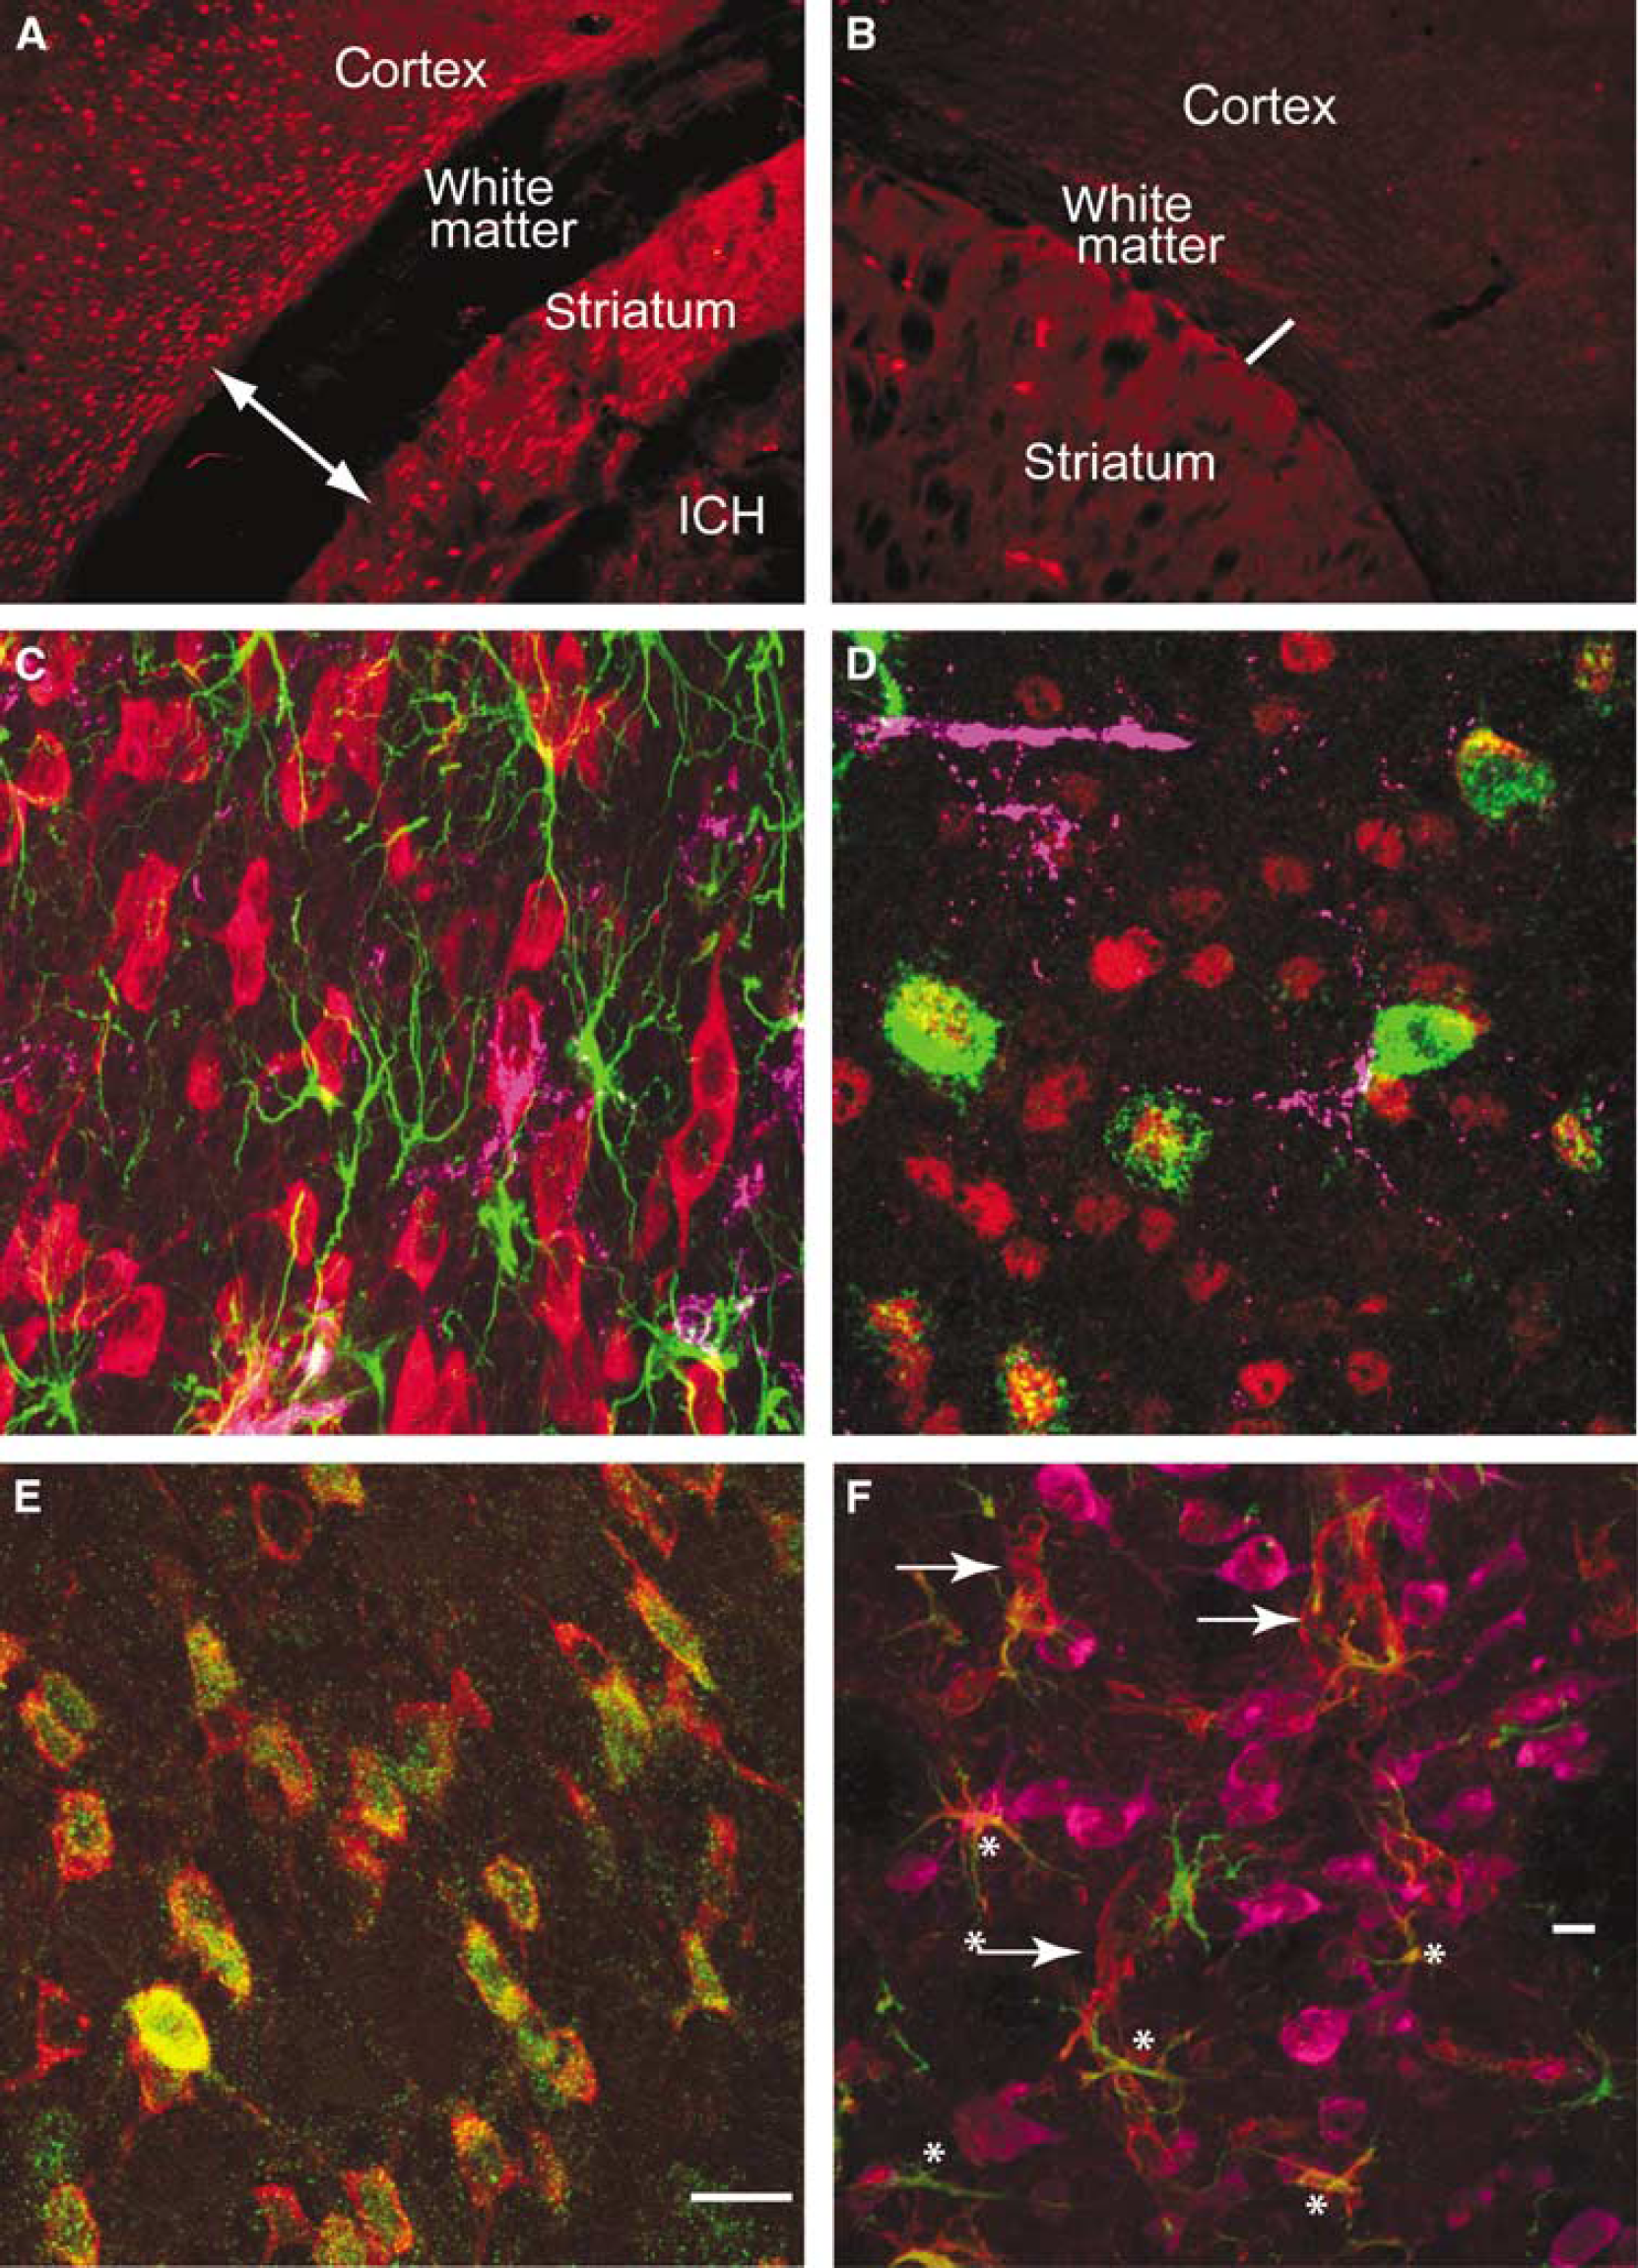
Cellular pattern of annexins and inflammatory cells in perihematomal tissue. Annexin A2 immunoreactivity in the cortex, white matter, and striatum adjacent to ICH (
Discussion
Intracerebral hemorrhage regulates coordinated networks of gene expression in inflammatory, Anti-inflammatory, and neuronal signaling systems in human perihematomal tissue within the first day of the hemorrhage. A molecular network of proin-flammatory signaling starts with the cytokines/chemokines
Annexin A2 is induced in inflammatory cells in the hemorrhage and in neurons that border the hemorrhage site. Oligodendrocytes in injured white matter express the inflammatory chemokine CCR1. Inflammatory and endothelial cells in the immediate perihematomal rim and hemorrhage site express the IL receptor
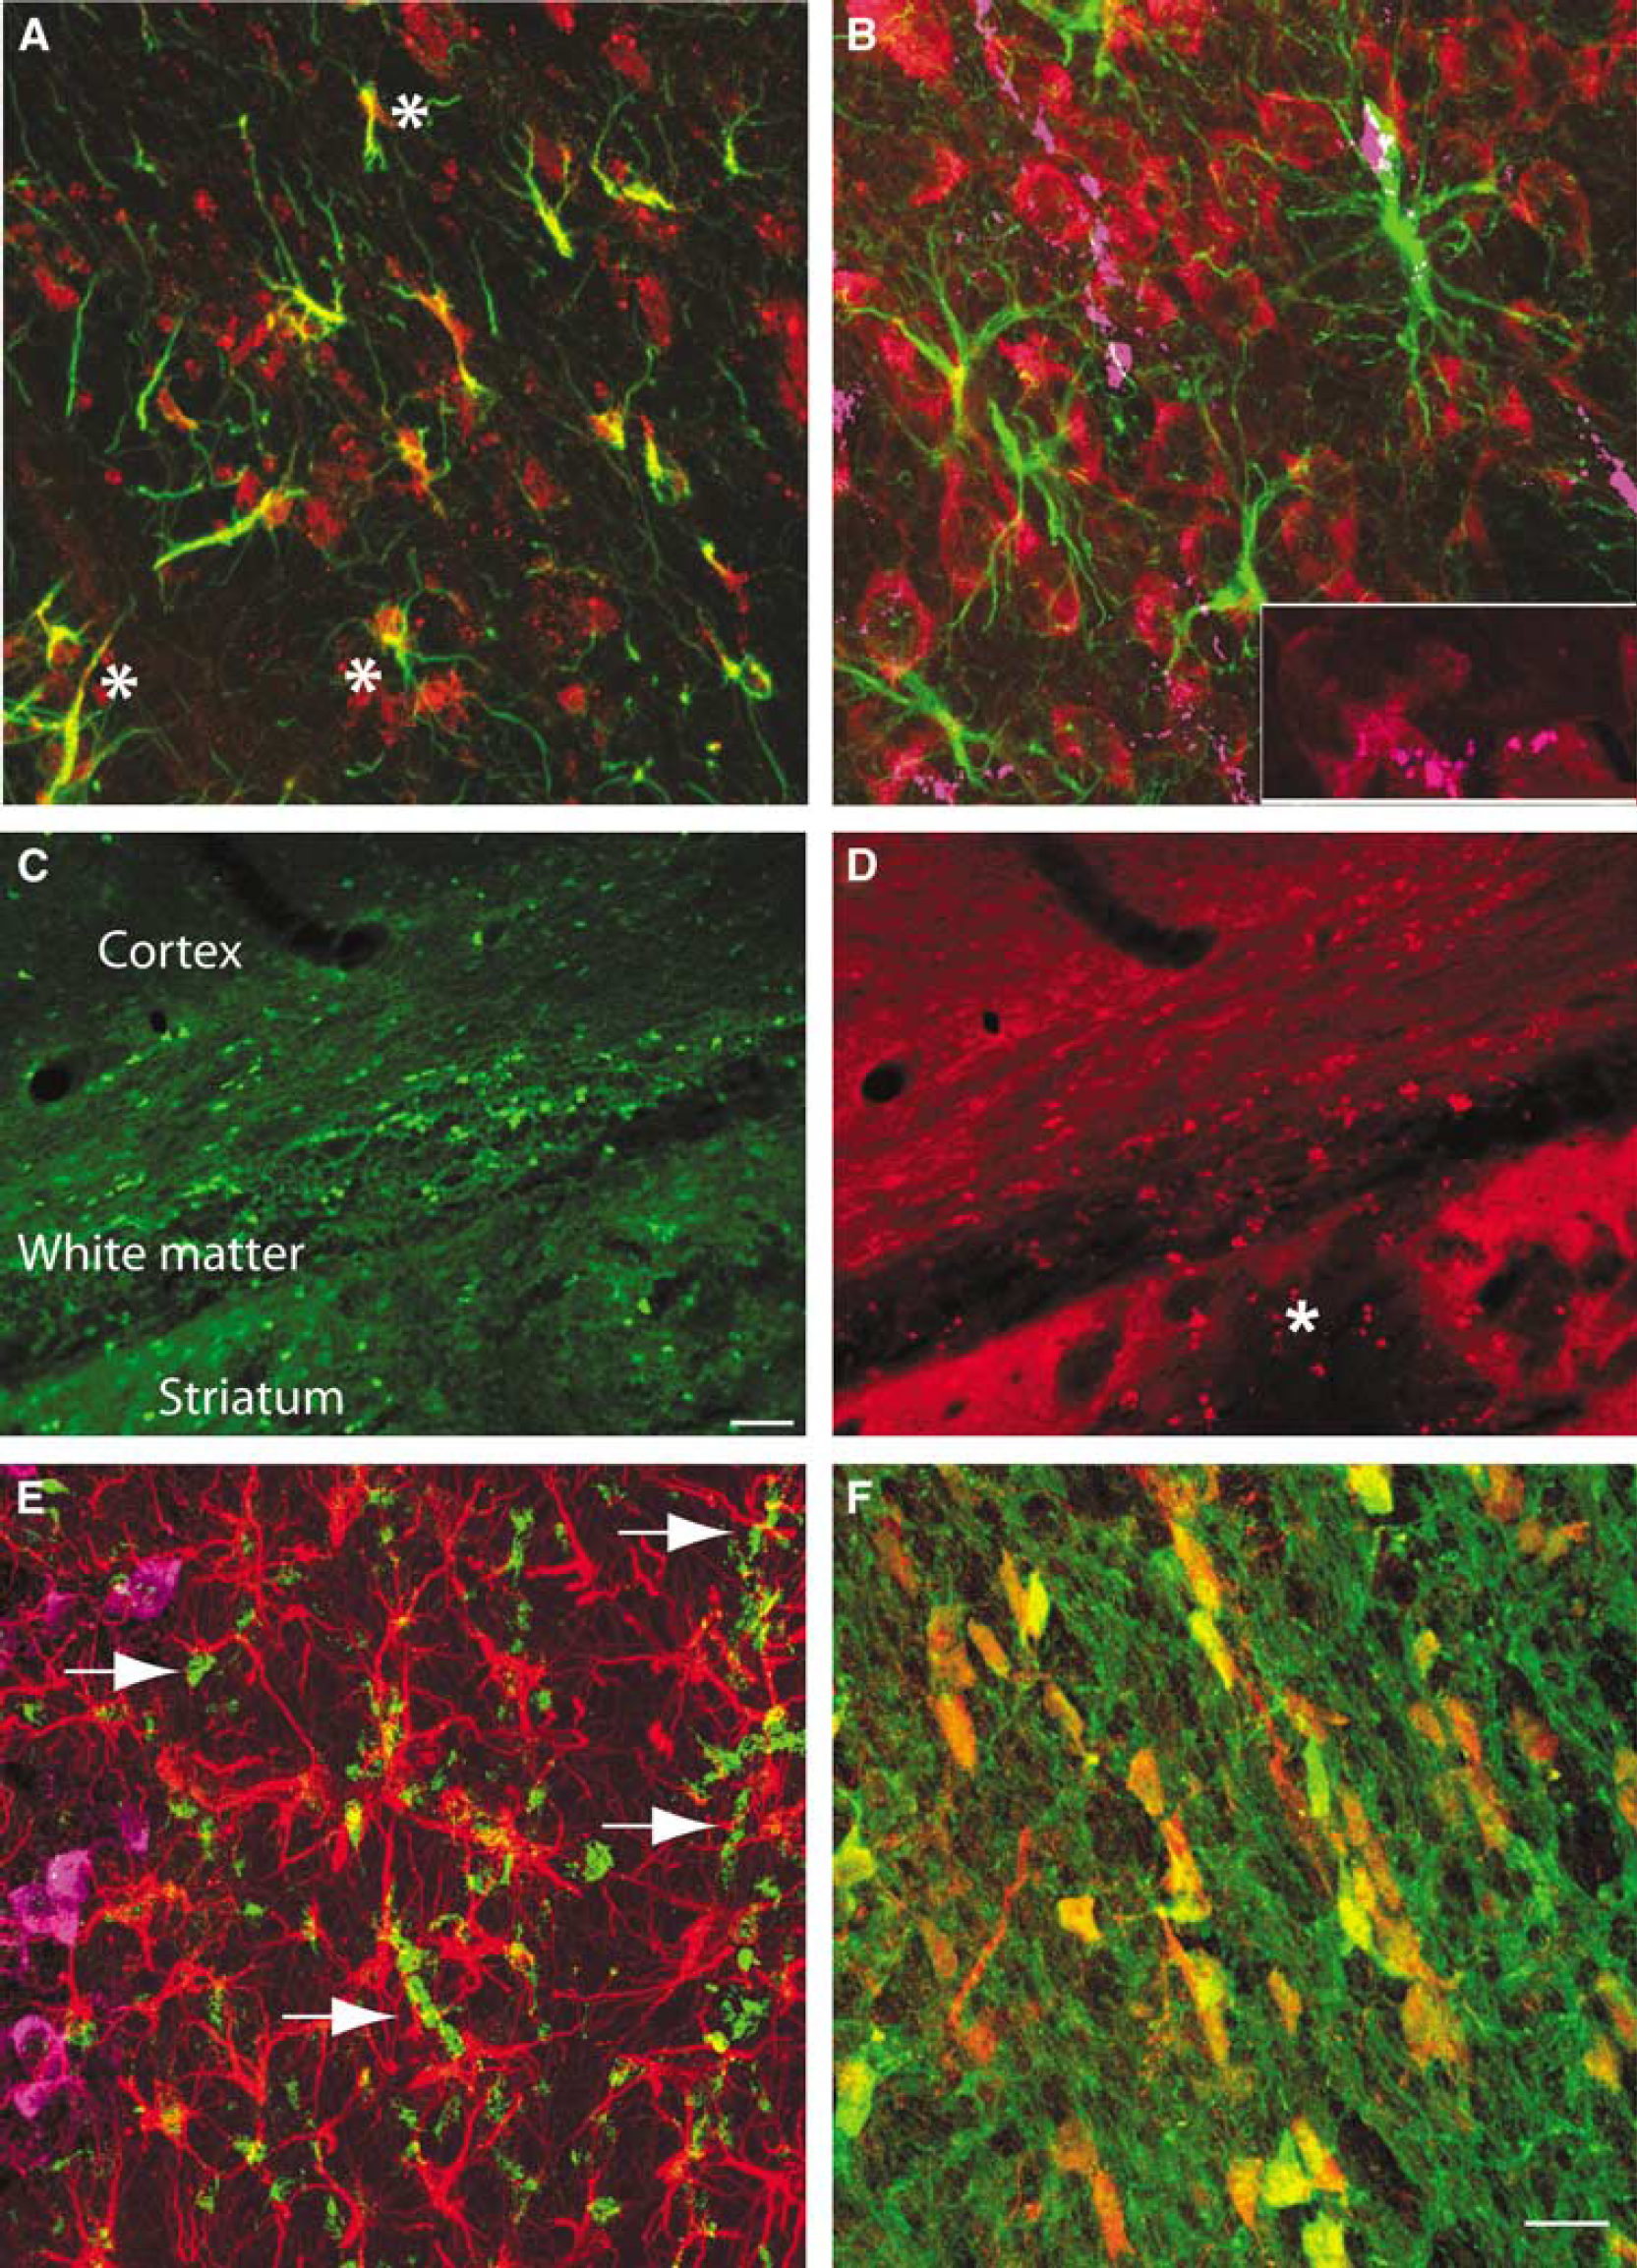
Cellular Expression Pattern of Aquaporin 9, CCR1, and IL1R1 expression in perihematomal tissue. (
Inflammatory signaling is initiated by cytokine and chemokine signaling in both human studies and animal models of ICH. Elevated serum levels of the cytokines IL6 and TNFα correlate with edema and functional deficits in patients (Castillo et al, 2002; Dziedzic et al, 2002; Qureshi et al, 2003a). The IL6 receptor is upregulated in human perihematomal tissue.
Many of the upregulated inflammatory genes in rat perihematomal tissue (Wasserman et al, 2007; Lu et al, 2006) are also increased in this data set in humans after ICH, including
Intracerebral hemorrhage also induces several chemokine systems in human perihematomal tissue, including CCR1, IL8, CXCL2, and CXCL3. CCR1 has been consistently shown to play a role in leukocyte infiltration in the brain in inflammatory disorders, such as in experimental autoimmune encephalo-myelitis (EAE) (Trebst et al, 2003), and was upregulated in oligodendrocytes in perihematomal white matter in this study. The ligands for CCR1,
A novel finding in the present data set is that this initial signaling system of cytokines and chemokines is at the front end of an inflammatory molecular pathway that is coordinately activated in human perihematomal tissue.
In addition to these proinflammatory cascades, ICH induces coordinated upregulation of several networks of anti-inflammatory genes.
Intracerebral hemorrhage induces a downregulation of neuronal signaling systems, including pre- and postsynaptic, ion channel and calcium signaling networks, and the NMDA receptor complex.
Intracerebral hemorrhage induces a massive and early glutamate release (Castillo et al, 2002; Qureshi et al, 2003a, b ; Miller et al, 2007) and elevated serum glutamate in humans after ICH correlates with reduced functional outcome and larger hemorrhage cavity (Castillo et al, 2002). The coordinated downregulation of neuronal excitability genes may serve an endogenous neuroprotective mechanism in the tissue immediately adjacent to and adherent to the hemorrhage, the target tissue obtained in these human studies. Because further adjacent tissue is at-risk for progressive apoptotic cell death (Felberg et al, 2002; Qureshi et al, 2003b; Wasserman et al, 2007), white matter loss, and tissue atrophy (Felberg et al, 2002), future neuropathological studies in humans will need to determine the expression profile of neuronal signaling genes in these adjacent areas.
Intracerebral hemorrhage alters extracellular matrix, glial, and vascular structure in perihematomal tissue during the initiation of cell death and edema. In human perihematomal tissue, ICH induces
From human ICH material to confirmatory studies in a mouse ICH model, this data set provides important conclusions but has limitations. First, this data set has a limited number of experimental samples. A stringent statistical cutoff established a robust data set from these samples but many genes that are known to be upregulated in periinfarct tissue in animal models of ICH and stroke, such as
Footnotes
Acknowledgements
We thank Michal Machniki, Ellen Walker, and Martin Rutkoswski for excellent technical assistance in qRT-PCR and immunohistochemistry, and Jill Haines for patient care coordination.
The authors state no conflict of interest.
References
Supplementary Material
Please find the following supplemental material available below.
For Open Access articles published under a Creative Commons License, all supplemental material carries the same license as the article it is associated with.
For non-Open Access articles published, all supplemental material carries a non-exclusive license, and permission requests for re-use of supplemental material or any part of supplemental material shall be sent directly to the copyright owner as specified in the copyright notice associated with the article.