
Abstract
In the context of ischemic stroke, rescuing neurons can be theoretically achieved with either reperfusion or neuroprotection. Reperfusion works via the rapid restoration of oxygen and glucose delivery. Neuroprotection comprises molecular strategies that seek to block excitotoxicity, oxidative stress or various cell death pathways. Here, we propose the hypothesis that neurons rescued with reperfusion are different from neurons rescued with molecular neuroprotection. Neurons were subjected to oxygen–glucose deprivation (OGD) and then treated with “in vitro reperfusion” (i.e. energetic rescue via restoration of oxygen and glucose) or Z-VADfmk (to block apoptosis) or MK-801 (to block excitotoxicity). Levels of injury were titrated so that equivalent levels of neuronal salvage were achieved with reperfusion or neuroprotection. Gene arrays showed that OGD significantly altered the transcriptomic profiles of surviving neurons. Pathway analysis confirmed that a large spectrum of metabolic, inflammation, and signaling genes were perturbed. In spite of the fact that equal levels of neuronal salvage were achieved, energetic rescue renormalized the transcriptomic profiles in surviving neurons to a larger degree compared to neuroprotection with either Z-VADfmk or MK-801. These findings suggest that upstream reperfusion may bring salvaged neurons back “closer to normal” compared to downstream molecular neuroprotection.
Introduction
Neuroprotection is one of the holy grails in translational stroke research. Over the past two decades, there has been tremendous progress in terms of defining molecular and cellular mechanisms of neuronal cell death after stroke. These complex and overlapping pathways broadly comprise excitotoxicity, oxidative stress, inflammation and various programmed cell death mechanisms such as apoptosis, necroptosis, etc.1–3 However, turning these basic advances into clinical meaning has not been easy. Many targets and therapies appear to work well in cell and experimental animal models but it has been difficult to find neuroprotective strategies that work in clinical stroke trials.4–6
In contrast to clinical failures in neuroprotection, reperfusion therapies have been proven effective in improving patient outcomes. The NINDS trial for tissue plasminogen activator (tPA) showed improved outcomes in stroke patients who received thrombolysis within 3 h of ischemic onset. 7 The third European Cooperative Stroke Study (ECASS 3) suggested that outcomes may even be improved in selected patients reperfused with tPA up to 4.5 h after ischemic stroke onset. 8 More recently, several new trials suggested that reperfusing ischemic strokes with mechanical clot retrieval devices (endovascular thrombectomy) may also be effective in properly selected patients.9,10
The question that arises is why “molecular target-based” neuroprotection has not been clinically successful, whereas “reperfusion-based” therapies have appeared to be consistently efficacious. Cerebral ischemia triggers a complex cascade of intra-cellular and inter-cellular signaling pathways. However, the primary insult is the lack of oxygen and glucose delivery to the brain. Rescuing neurons with reperfusion therapies (tPA or endovascular thrombectomy) involves the rapid return of energy substrates (oxygen and glucose) to starved brain tissue. In contrast, neuroprotective approaches typically target mechanisms that are further downstream from the initial energetic insult. Here, we hypothesize that there may be fundamental differences between neurons that are salvaged by reperfusion and energetic rescue compared to neurons that are salvaged by “molecular” neuroprotection.
Materials and methods
Primary neuron culture
All experiments were approved by the Massachusetts General Hospital (MGH) Institutional Animal Use and Care Committee in accordance with National Institutes of Health (NIH) guidelines, and study design and data analysis follow all appropriate ARRIVE guidelines and requirements. Primary neuron cultures were prepared from the cortices of embryonic day (E)16 C57 mouse embryos as previously described. 11 In brief, the cortical tissues were dissected and digested with Trypsin (Invitrogen), then suspended and plated onto poly-D-lysine-coated multi-well plates. The complete medium is NeuroBasal medium (Invitrogen) supplemented with 2% B-27 (Invitrogen), 0.3 mM L-glutamine and 1% penicillin–streptomycin. Cells were cultured in humidified incubator at 37℃ and 5% CO2, the medium was half-changed every three days. The matured neuron cultures were used at days in vitro 10.
Oxygen–glucose deprivation
To induce oxygen and glucose deprivation, neurons were washed with PBS and maintained in glucose-free Locke's medium (154 mM NaCl, 5.6 mM KCl, 2.3 mM CaCl2, 1.0 mM MgCl2, 3.6 mM NaHCO3, 5 mM HEPES, pH 7.2) with or without neuroprotection drug, Z-VADfmk (20 µM) or MK-801 (2 µM), and incubated in a modular chamber (Billups-Rothenberg) perfused with 90% N2, 5%H2, and 5% CO2 for 30 min at 37℃. 12 The chamber was then sealed and kept at 37℃ for indicated time periods for OGD. At the end of OGD, cells were returned to the regular incubator, after replacing with fresh complete medium for reoxygenation, again with or without the drug. The normal cultures were changed with and stayed in the complete media and regular incubator all the time. At 24 h after the start of the OGD challenge, cell viability was quantified by using standard MTT (Sigma) assay. For gene expression analysis, cells were lysed with buffer RLT plus and RNA prepared with RNeasy Mini Plus kit (Qiagen). Specific parameters for two independent experiments are provided in Supplementary Table S1.
Transcriptional profiling and data analysis
The transcriptome of neurons was screened with Affymetrix GeneChip Mouse Genome 1.0 ST array. RNA samples from three separate experiments were prepared, checking for the quantity and quality by Nanodrop and Agilent Bioanalyzer 2010, respectively. The integrity of RNAs, measured as RNA integrity number (RIN) score was all above 8.0. The amplification and fragmentation of samples, and microarray hybridization and scanning were performed by Translational Genomic core of Partners Healthcare. Raw expression data for each chip were summarized and normalized using RMA algorithm, to allow direct comparison of results obtained among different chips. The quality of each chip was determined by manually checking and all chips passed the quality check. The probes with intensity less than 200 were eliminated; genes whose maximal expression values across all chips were greater than 200 were used for further analysis. 13 The differentially expressed probes/genes were determined by SAM algorithm, and selected with statistic p < 0.05 and fold change > 1.50. 14 Then, gene set enrichment analysis (GSEA) was used to identify the effected canonical pathways under each conditions compared to normal neurons, according to Kyoto Encyclopedia of Genes and Genomics (KEGG).15,16 The normalized enrichment score (NES) and p value were calculated for each pathway, and a canonical pathway is considered as significantly enriched, or significantly changed, with p < 0.05.
Quantitative real-time polymerase chain reaction (qRT-PCR)
Reverse transcription for first strand cDNA was performed with QuantiTect reverse transcription system (Qiagen). Quantitative PCR was performed on an ABI 7500 thermocycler by using TaqMan primers and PCR Master Mix (Applied Biosystems, Foster City, CA). B2M was used as a housekeeping gene for normalization and fold change of specific gene was measured with 2−ΔΔCt method.
Dendrite assessments
Neurons that had been exposed to OGD at days in vitro 10 were washed twice with Neurobasal media and allowed to recover in maintenance media in a regular incubator. At days in vitro 12, cells were transfected with pEGFP-N1 (0.8 µg plasmid/well in 24-well plate) using Lipofectamine 2000 (1.4 µl/well) according to the manufacturer’s instructions. No obvious difference in transfection rates were noted between the groups. At days in vitro 14, cells were fixed in 4% paraformaldehyde/4% sucrose in phosphate buffer saline (PBS) containing 0.1 mM MgCl2 and 1 mM CaCl2. Cell images were captured and the numbers of primary and secondary dendrites were assessed by optical imaging, all performed randomly and blinded to treatment.
Interactomes
The genes from a specific pathway were entered into and analyzed with the protein–protein interactome program STRING (version 10.5, http://string-db.org), that actively curates interaction sources for experiments and databases. The final interactome networks were visualized by Cytoscape software. 17
Results
Primary mouse cortical neurons were subjected to OGD to mimic cerebral ischemia. Then neurons were treated with either reperfusion (rapid restoration of oxygen and glucose) or neuroprotection. Twenty four hours later, gene arrays were used to compare the transcriptomic profiles of normal, damaged, and rescued neurons. Two independent experiments were performed.
In Experiment 1 (performed by SG), neurons were damaged with 2 h of OGD (Supplementary Table S1); 24 h later, the standard MTT assay showed that this level of injury resulted in approximately 50% neuronal death (Figure 1(a) and (b)). For neurons treated with neuroprotection, the broad spectrum caspase inhibitor Z-VADfmk (20 µM) was added at the beginning and again at the end of OGD. For neurons treated with reperfusion, oxygen and glucose were restored after only 30 min of injury in order to achieve energetic rescue. Under these selected conditions, both reperfusion and Z-VADfmk significantly saved neurons to equivalent degrees (Figure 1(b)). Surviving neurons were then collected and gene arrays were used to map their transcriptome for comparison with normal and damaged neurons.
(a) Schematic indicating experimental design in the three groups. Moderate injury was obtained with 2 h transient OGD (black bars) followed by 22 h of reperfusion (white bars). To mimic reperfusion in vitro, OGD was stopped early after 30 min. For neuroprotection, Z-VADfmk was added at the onset of OGD as well as at the onset of reperfusion (arrows). All transcriptome analyses were performed at 24 h. (b) Neuronal cell viability post-OGD quantified with MTT assay, showing equal neuroprotection by reperfusion and Z-VADfmk (mean+SD). *For p < 0.05 compared to OGD; ANOVA followed by Dunnett t test (two-sided). (c) Unbiased clustering analysis of all microarray probes suggests that OGD disrupts the transcriptome in surviving neurons, and in vitro reperfusion or neuroprotection with Z-VADfmk may shift the transcriptome back towards normal. (d) Scatter plot of probes (log2 of microarray signal intensity) after low abundance filtering. OGD induces a dispersion of gene expression around the unity line, indicating both upregulation and downregulation of many genes. In vitro reperfusion or Z-VADfmk may slightly alter gene dispersions, although correlation values remain high throughout (R2 > 0.9).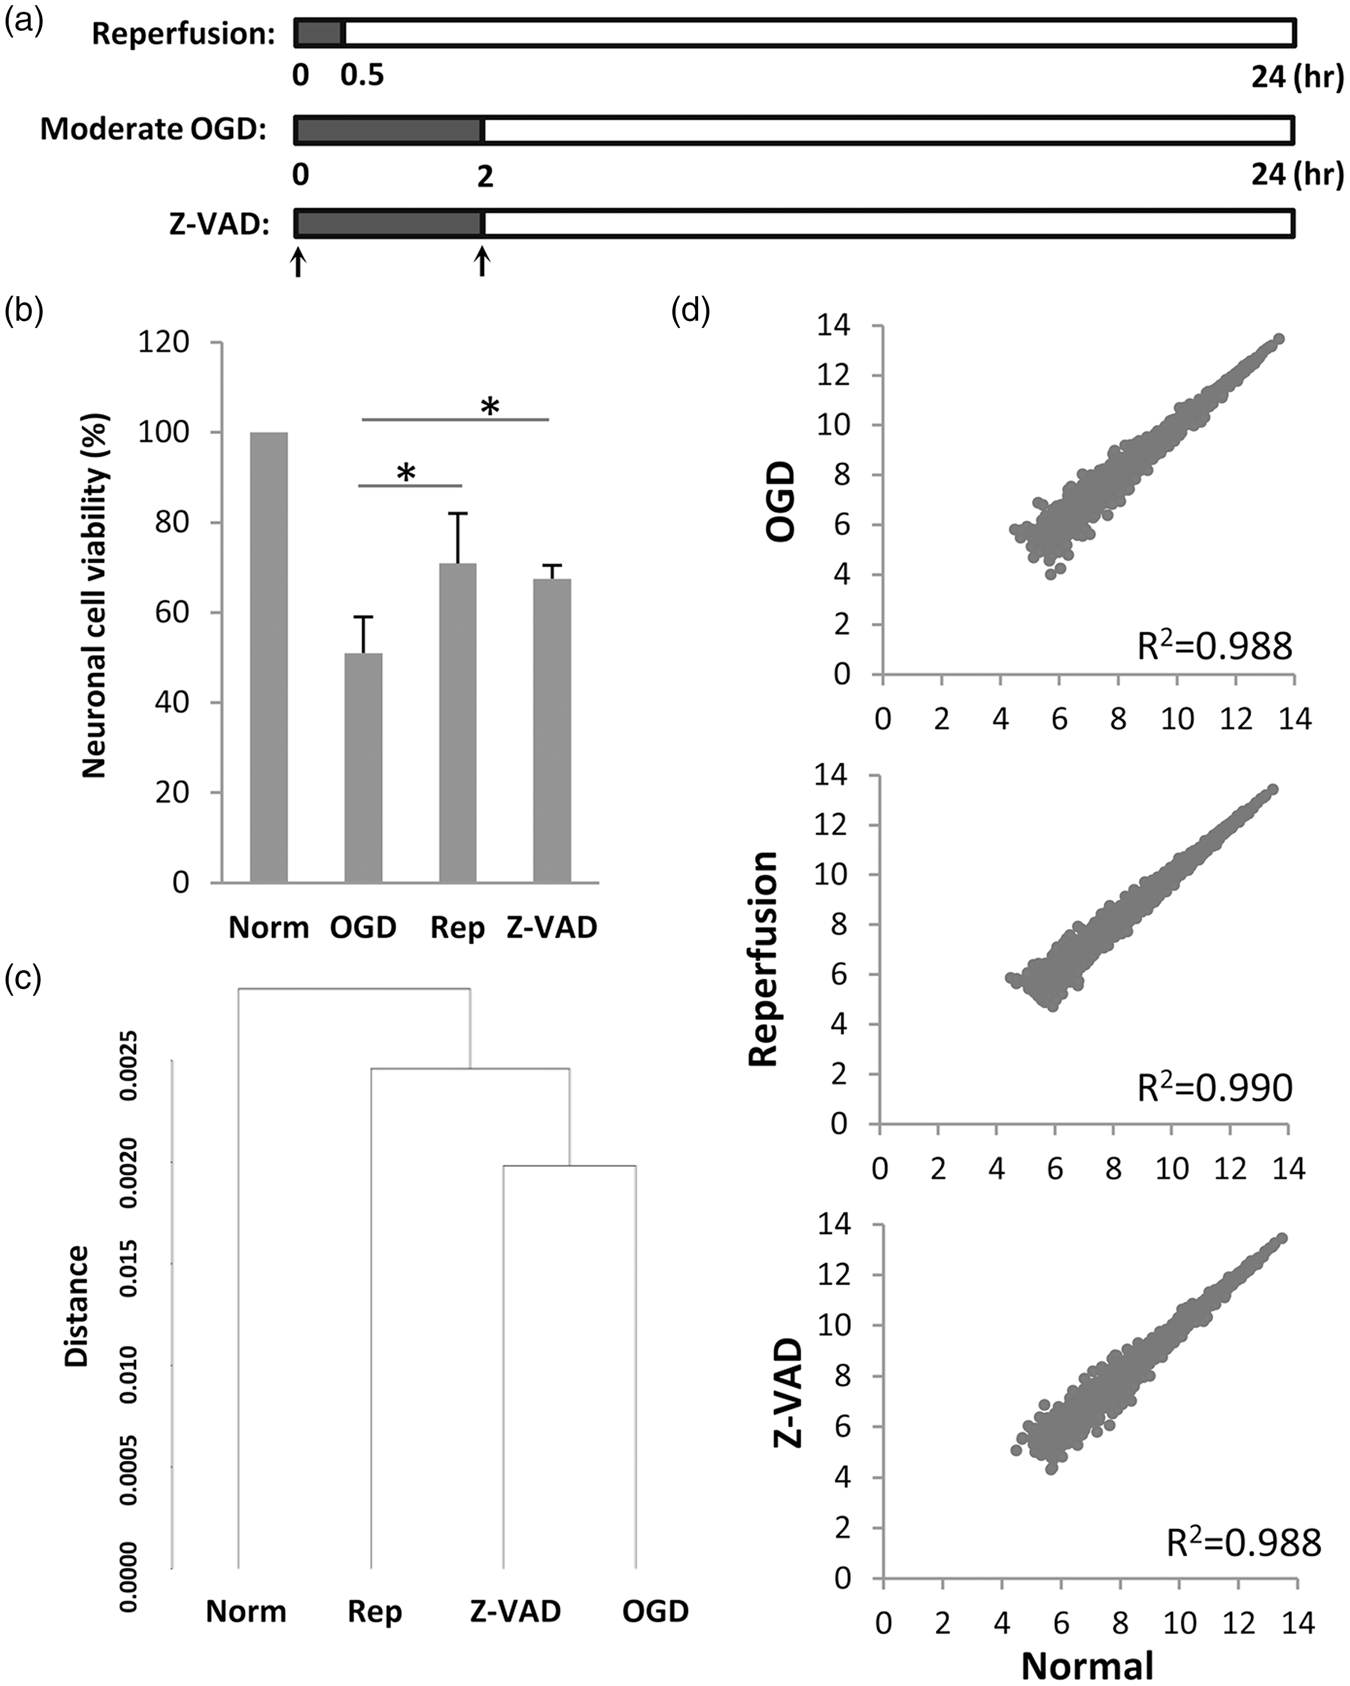
An unbiased clustering analysis of all probes showed that damaged neurons had a more similar transcriptome profile with that of Z-VADfmk-rescued neurons, compared to that of normal undamaged neurons and reperfusion-rescued neurons (Figure 1(c)). Similar changes were observed when probe expression levels were analyzed using a scatter plot. OGD induced a dispersion in the neuronal transcriptome when compared to normal neurons; some probes were increased and some were decreased (Figure 1(d)), while reperfusion seemed to narrow the dispersion to a larger degree compared with Z-VADfmk treatment (Figure 1(d)). Statistical comparisons demonstrated that the overall perturbations in the neuronal transcriptome induced by OGD were renormalized to a greater extent by reperfusion/energetic rescue compared with Z-VADfmk neuroprotection (Figure 2).
(a) Scatter plot of differentially expressed probes (log2 of microarray signal intensity) after OGD (p < 0.05, greater than 1.5-fold-change. Only significantly altered genes are plotted here so there is a “gap” around the unity line. In vitro reperfusion may “fill in the gap” more than Z-VADfmk. (b) Probes significantly changed by OGD expressed as fold-change versus undamaged normal. A slightly larger shift may occur with reperfusion compared to Z-VADfmk. (c) Histogram of probe counts for differentially expressed probes post-OGD. Dotted line indicates the threshold for significantly altered genes. (d) Shaded portion of the bar graph indicates the number of probes that were “shifted back” beyond the dotted line threshold in Figure 1(c) by reperfusion versus Z-VADfmk; *p < 0.01 via proportion test.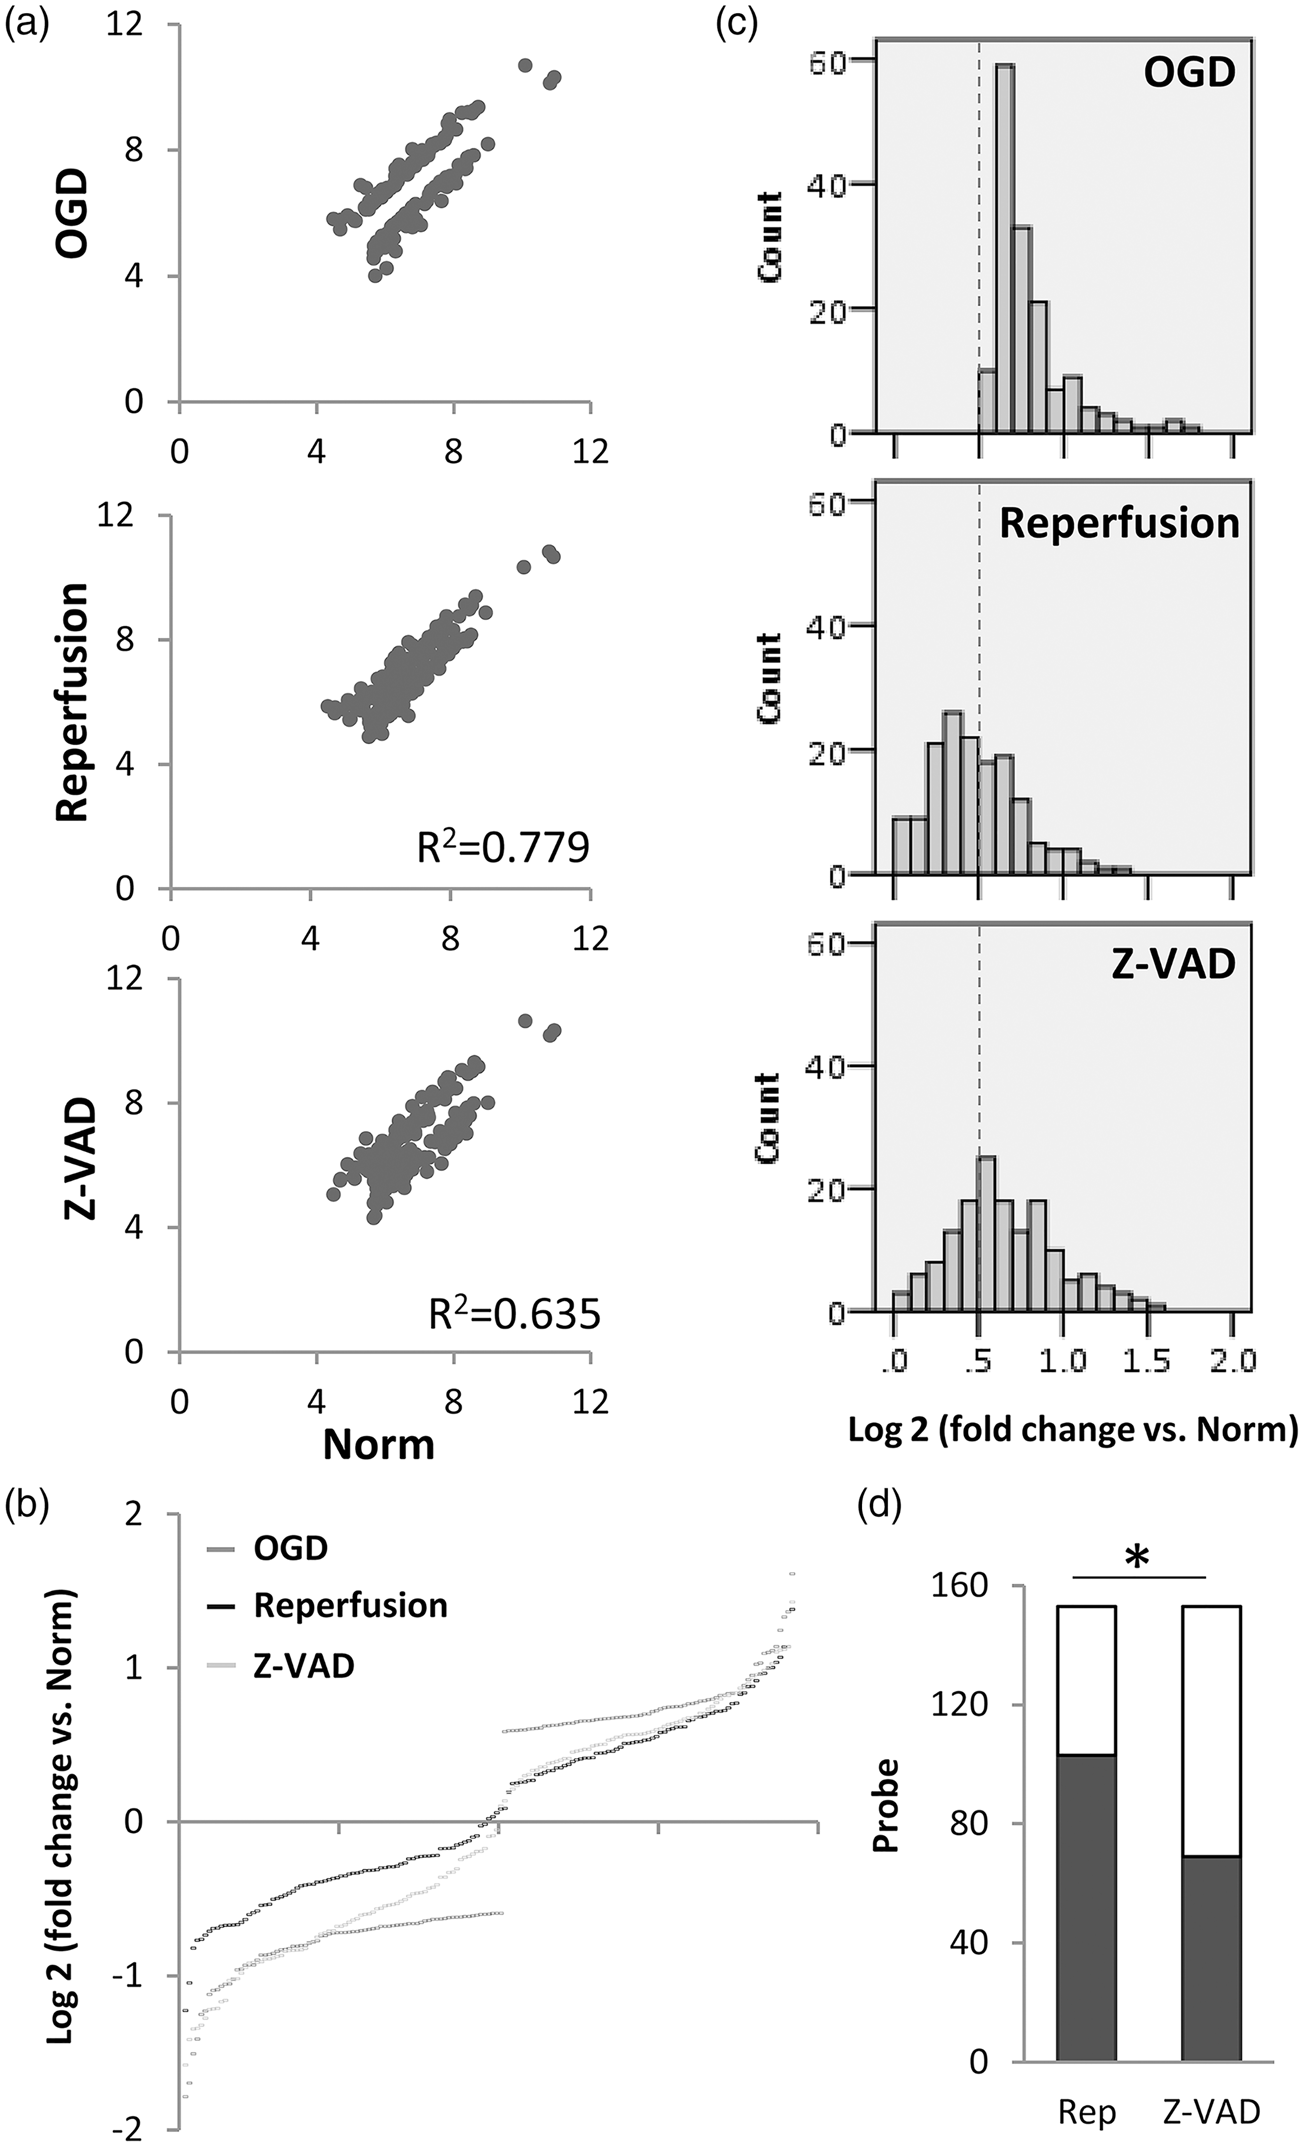
To partially check the reliability of our microarray measurements, RT-PCR was performed to quantify changes in selected representative genes. In general, there was reasonable agreement between microarray and RT-PCR data (Supplementary Figure S1(a)). Importantly, the directionality of all gene changes was in agreement, i.e. increased or decreased by OGD and then partially renormalized by reperfusion or Z-VADfmk (Supplementary Figure S1(b)).
Next, we asked whether our findings were generalizable. Experiment 2 was performed by a different operator (ATW) under slightly more severe injury condition (Supplementary Table S1). This time, neurons were damaged with a longer period (4 h) of OGD, and a different approach was tested for neuroprotection. We attempted to block excitotoxicity by adding the well-characterized NMDA antagonist MK-801 (2 µm, at the beginning and again at the end of the oxygen-glucose deprivation period). Reperfusion was achieved by restoring oxygen and glucose after 2 h. As expected, the more severe injury conditions resulted in more neuronal death, approximately 75% cytotoxicity (Figure 3(a) and (b)). Once again, our selected conditions resulted in equivalent levels of neuronal salvage with either reperfusion/energetic rescue or MK-801 neuroprotection (Figure 3(b)).
(a) Schematic indicating experimental design in the three groups. Severe injury was obtained with 4 h transient OGD (black bars) followed by 20 h of reperfusion (white bars). To mimic reperfusion in vitro, OGD was stopped early after 60 min. For neuroprotection, MK-801 was added at the onset of OGD as well as at the onset of reperfusion (arrows). All transcriptome analyses were performed at 24 h. (b) Neuronal cell viability post-OGD quantified with MTT assay, showing equal neuroprotection by reperfusion and MK-801 (mean+SD). *For p < 0.05 compared to OGD; ANOVA followed by Dunnett t test (two-sided). (c) Unbiased clustering analysis of all microarray probes suggests that OGD disrupts the transcriptome in surviving neurons, and in vitro reperfusion or neuroprotection with MK-801 may shift the transcriptome back towards normal. (d) Scatter plot of probes (log2 of microarray signal intensity) after low abundance filtering. OGD induces a dispersion of gene expression around the unity line, indicating both upregulation and downregulation of many genes. In vitro reperfusion or MK-801 may slightly alter gene dispersions, although correlation values remain high throughout (R2 > 0.9).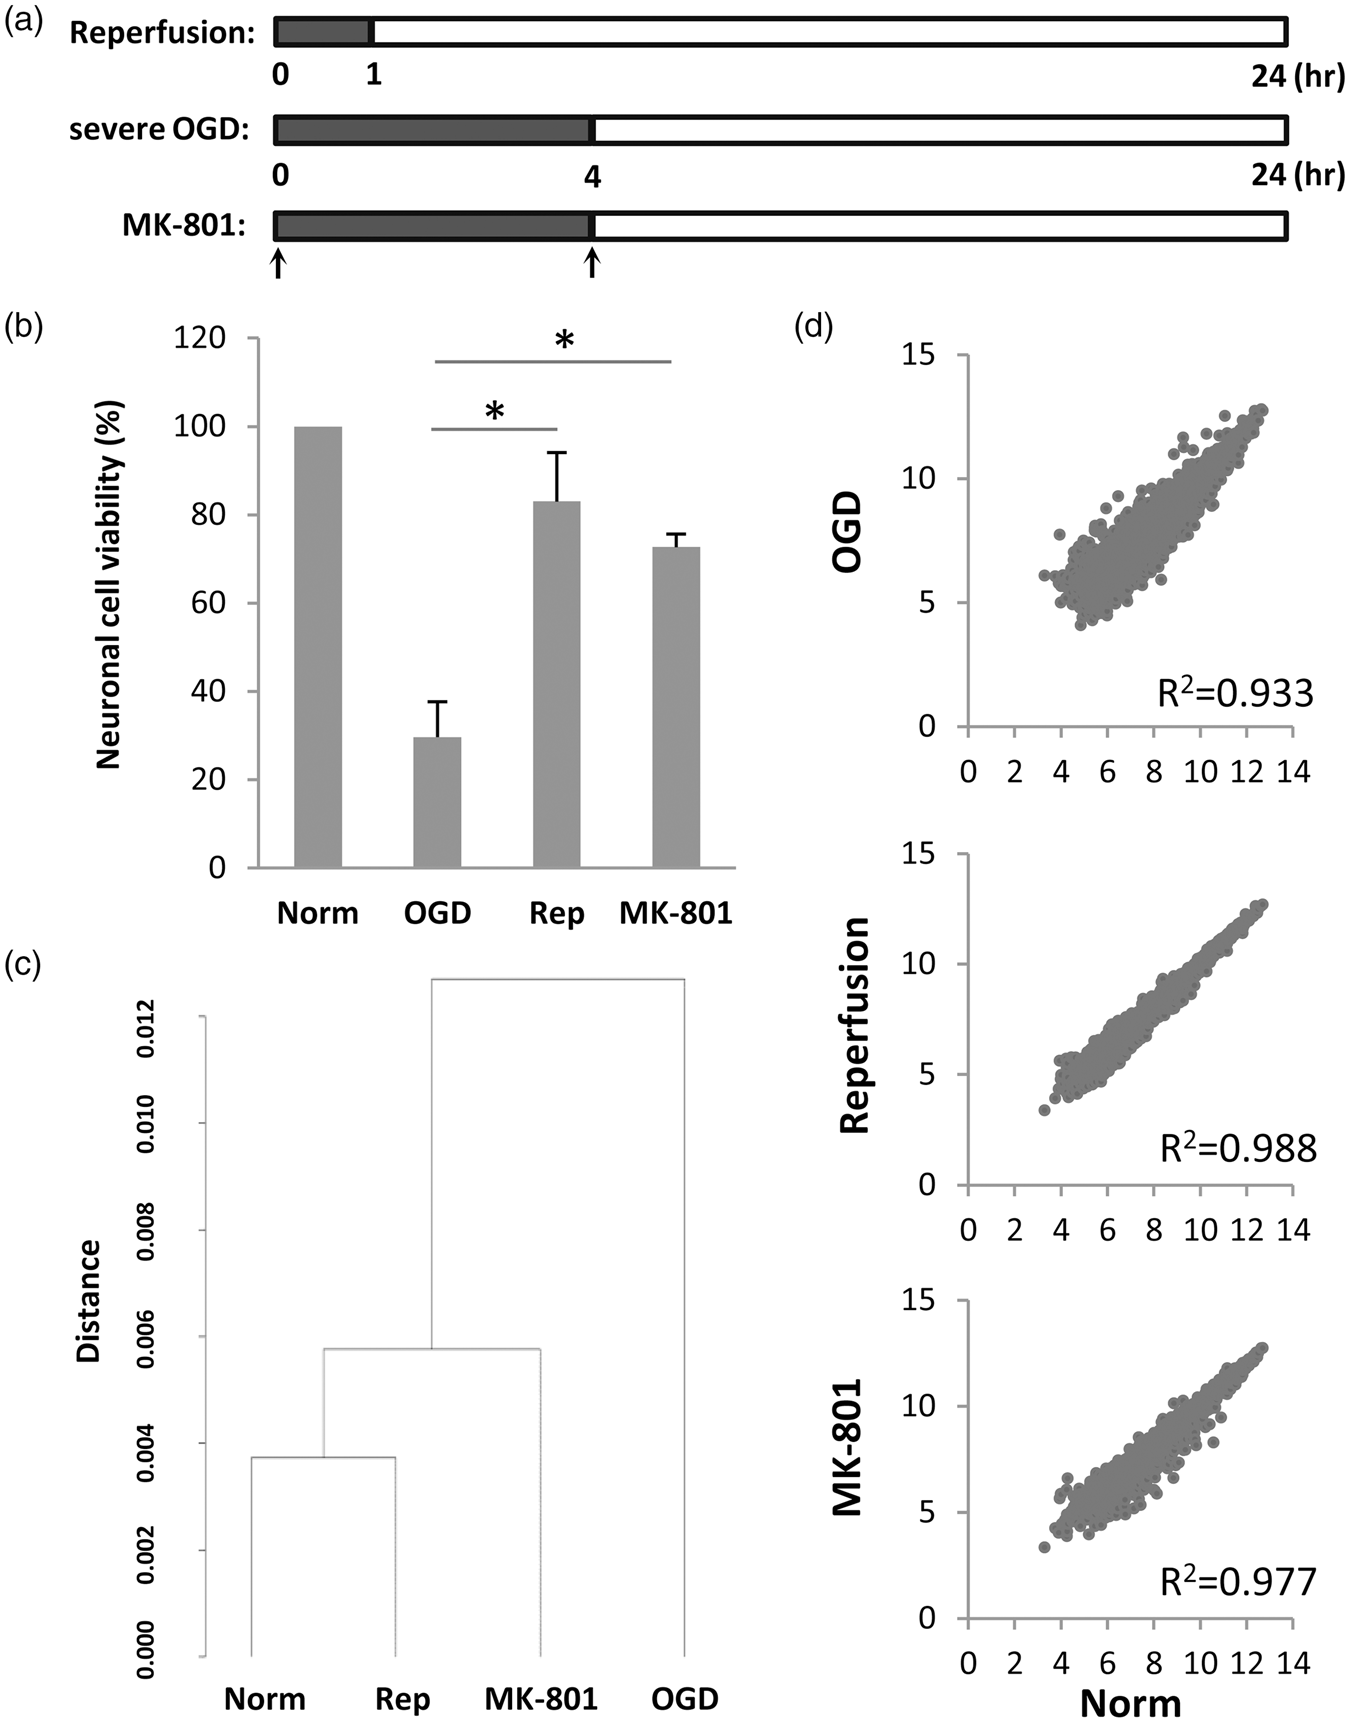
Unbiased clustering analysis showed that the reperfusion transcriptome was closer to normal compared with the MK-801-treated or severe OGD-damaged transcriptome (Figure 3(c)). Scatter plot analysis showed that, as expected, the more severe 4-h period of OGD in Experiment 2 led to a larger dispersion of the neuronal transcriptome (Figure 3(d)) compared with the milder 2-h period of OGD in Experiment 1 (Figure 1(d)). However, even under this more severe injury condition, reperfusion may still narrow the transcriptome dispersion to a slightly greater degree compared with MK-801 neuroprotection (Figure 3(d)). Statistical comparisons confirmed that the perturbations in the neuronal transcriptome induced by OGD were indeed renormalized to a greater extent by reperfusion/energetic rescue compared with MK-801 neuroprotection (Figure 4).
(a) Scatter plot of differentially expressed probes (log2 of microarray signal intensity) after OGD (p < 0.05, greater than 1.5-fold-change. Only significantly altered genes are plotted here so there is a “gap” around the unity line. In vitro reperfusion may “fill in the gap” more than MK-801. (b) Probes significantly changed by OGD expressed as fold-change versus undamaged normal. A slightly larger shift may occur with reperfusion compared to MK-801. (c) Histogram of probe counts for differentially expressed probes post-OGD. Dotted line indicates the threshold for significantly altered genes. (d) Shaded portion of the bar graph indicates the number of probes that were “shifted back” beyond the dotted line threshold in Figure 2(c) by reperfusion versus MK-801; *p < 0.01 via proportion test.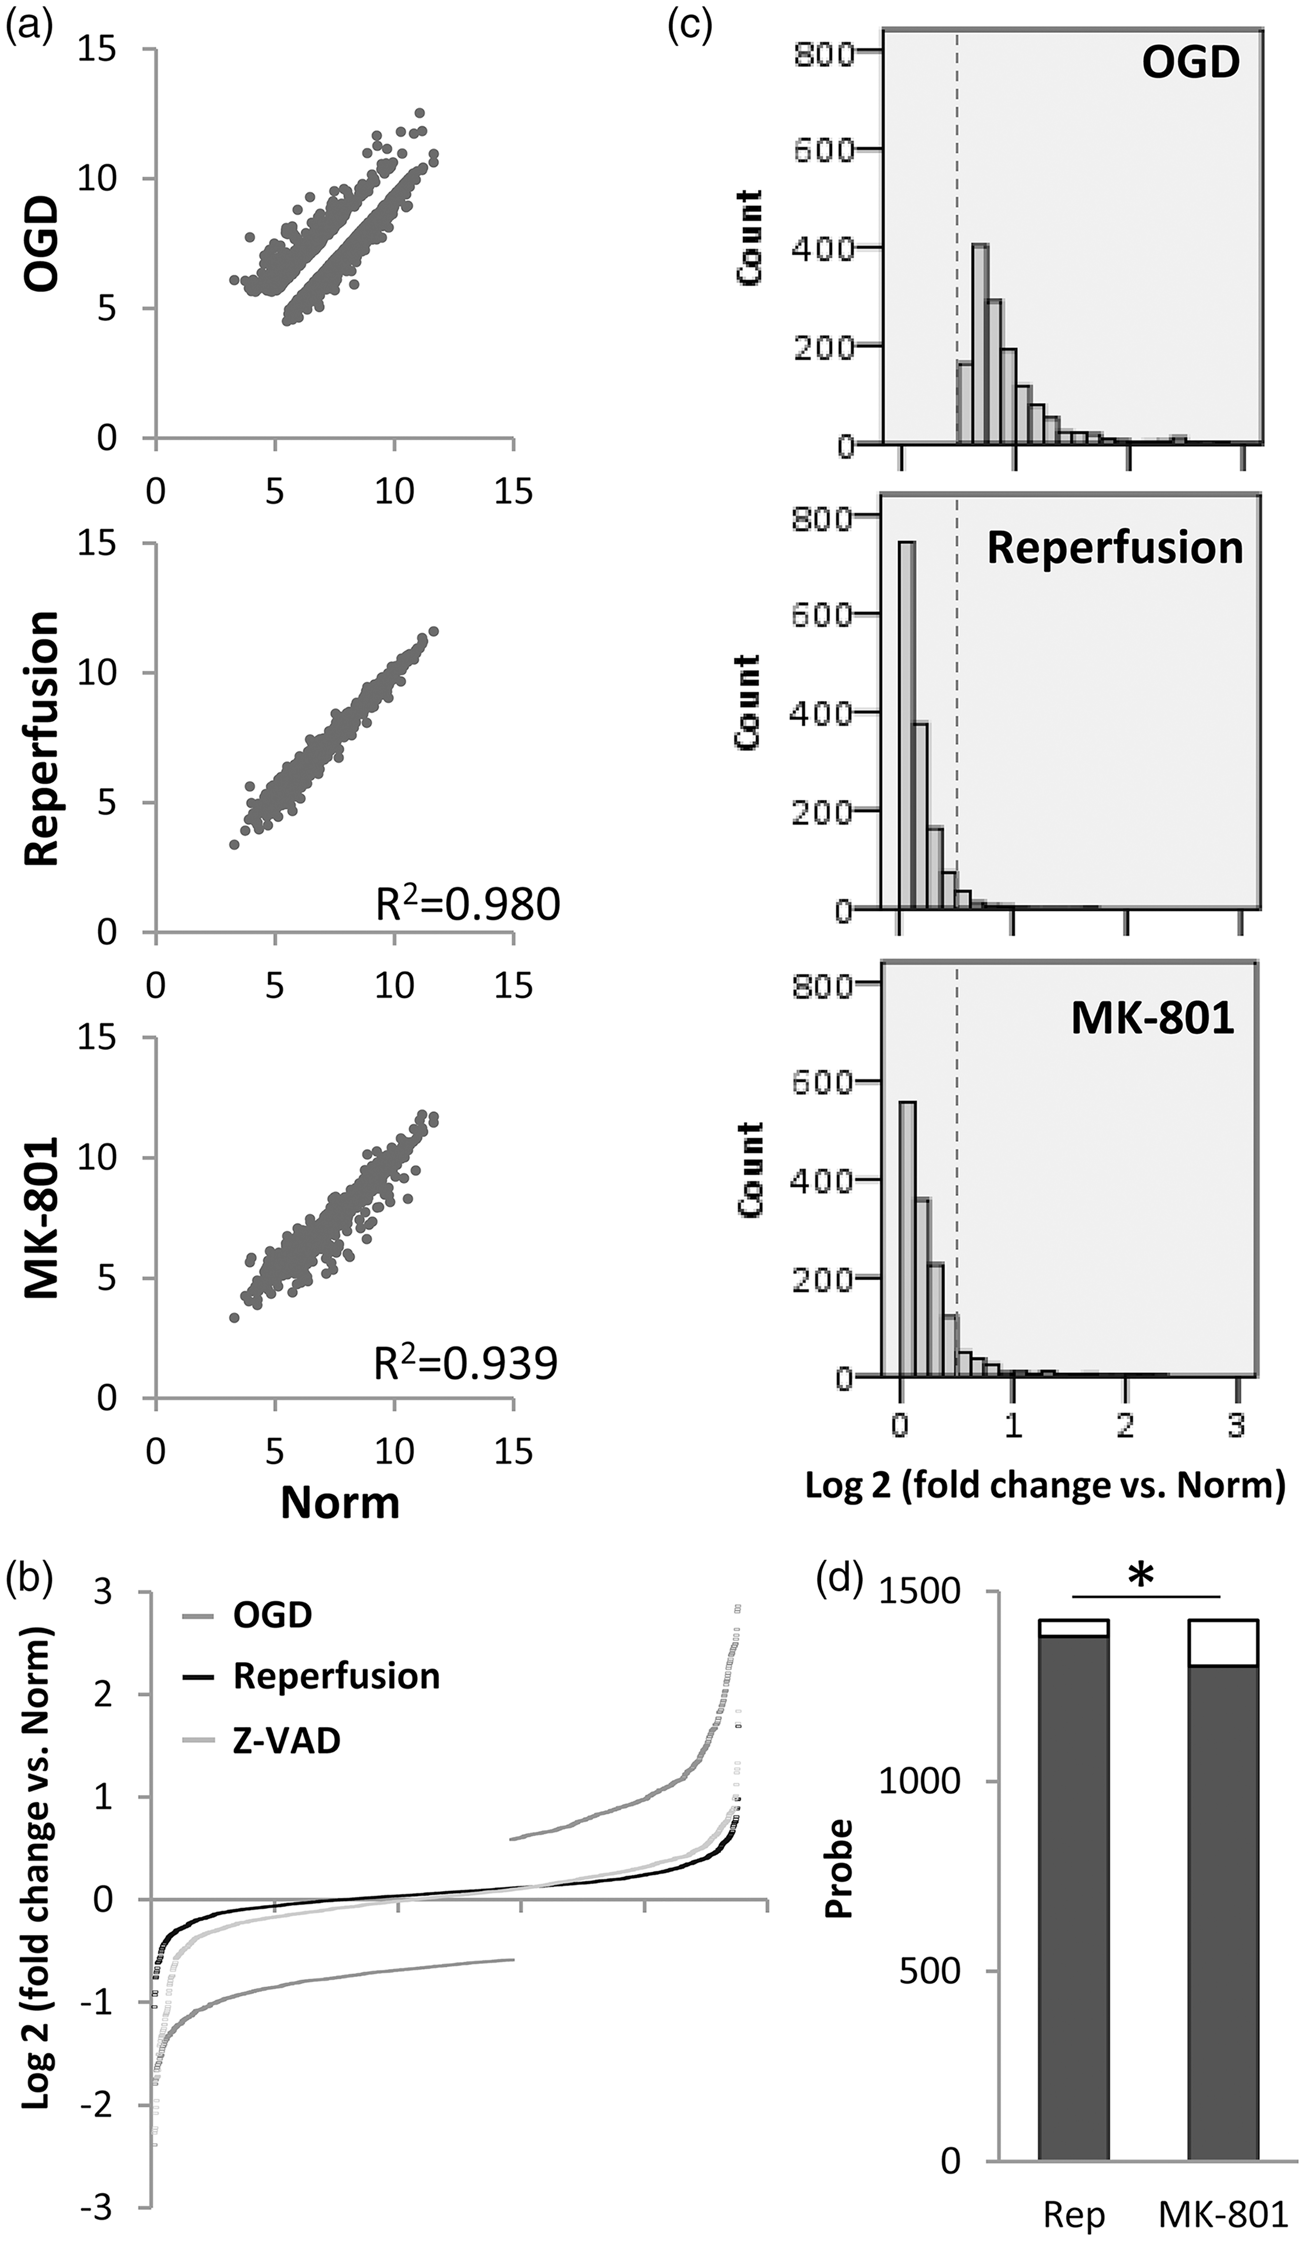
Consistent with these shifts in the transcriptome, neurons rescued by reperfusion appeared to be morphologically healthier compared to those rescued by MK-801 (Figure 5(a)). Quantitation of secondary and primary dendrite counts as well as the secondary-to-primary dendrite ratios suggested that process complexity in the surviving neurons was significantly improved after reperfusion/energetic rescue compared to MK-801 treatment (Figure 5(b)).
(a) Representative image of GFP-transfected neurons that survived after OGD. (b) Quantitation of dendrites performed four days post-OGD with either reperfusion or MK-801 treatment (mean+SEM), n = 184 for reperfusion and n = 156 for MK-801; *p < 0.001.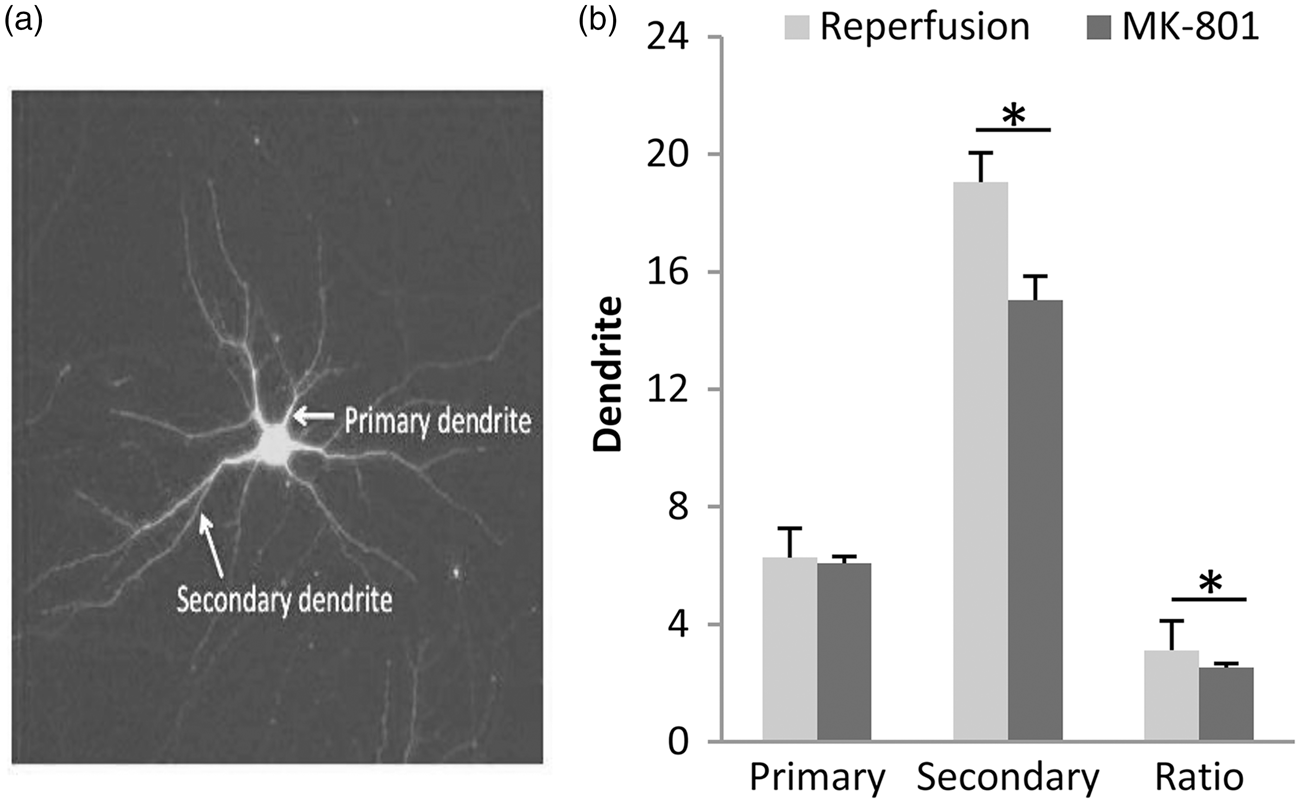
Taken together, these gene array results from two independent experiments with two different neuroprotectants suggest that in the context of OGD, blocking cell death or excitotoxicity mechanisms may lead to similar degrees of neuronal salvage compared with the alternative approach of restoring energy substrates via reperfusion. However, even though equal levels of neuronal rescue were achieved, there may be fundamental differences between neurons that are salvaged by energetic rescue compared to neurons that are salvaged by “neuroprotection.” To further dissect this phenomenon, gene and pathway analyses were performed to compare normal, damaged, “reperfused” and “neuroprotected” transcriptomes in surviving neurons.
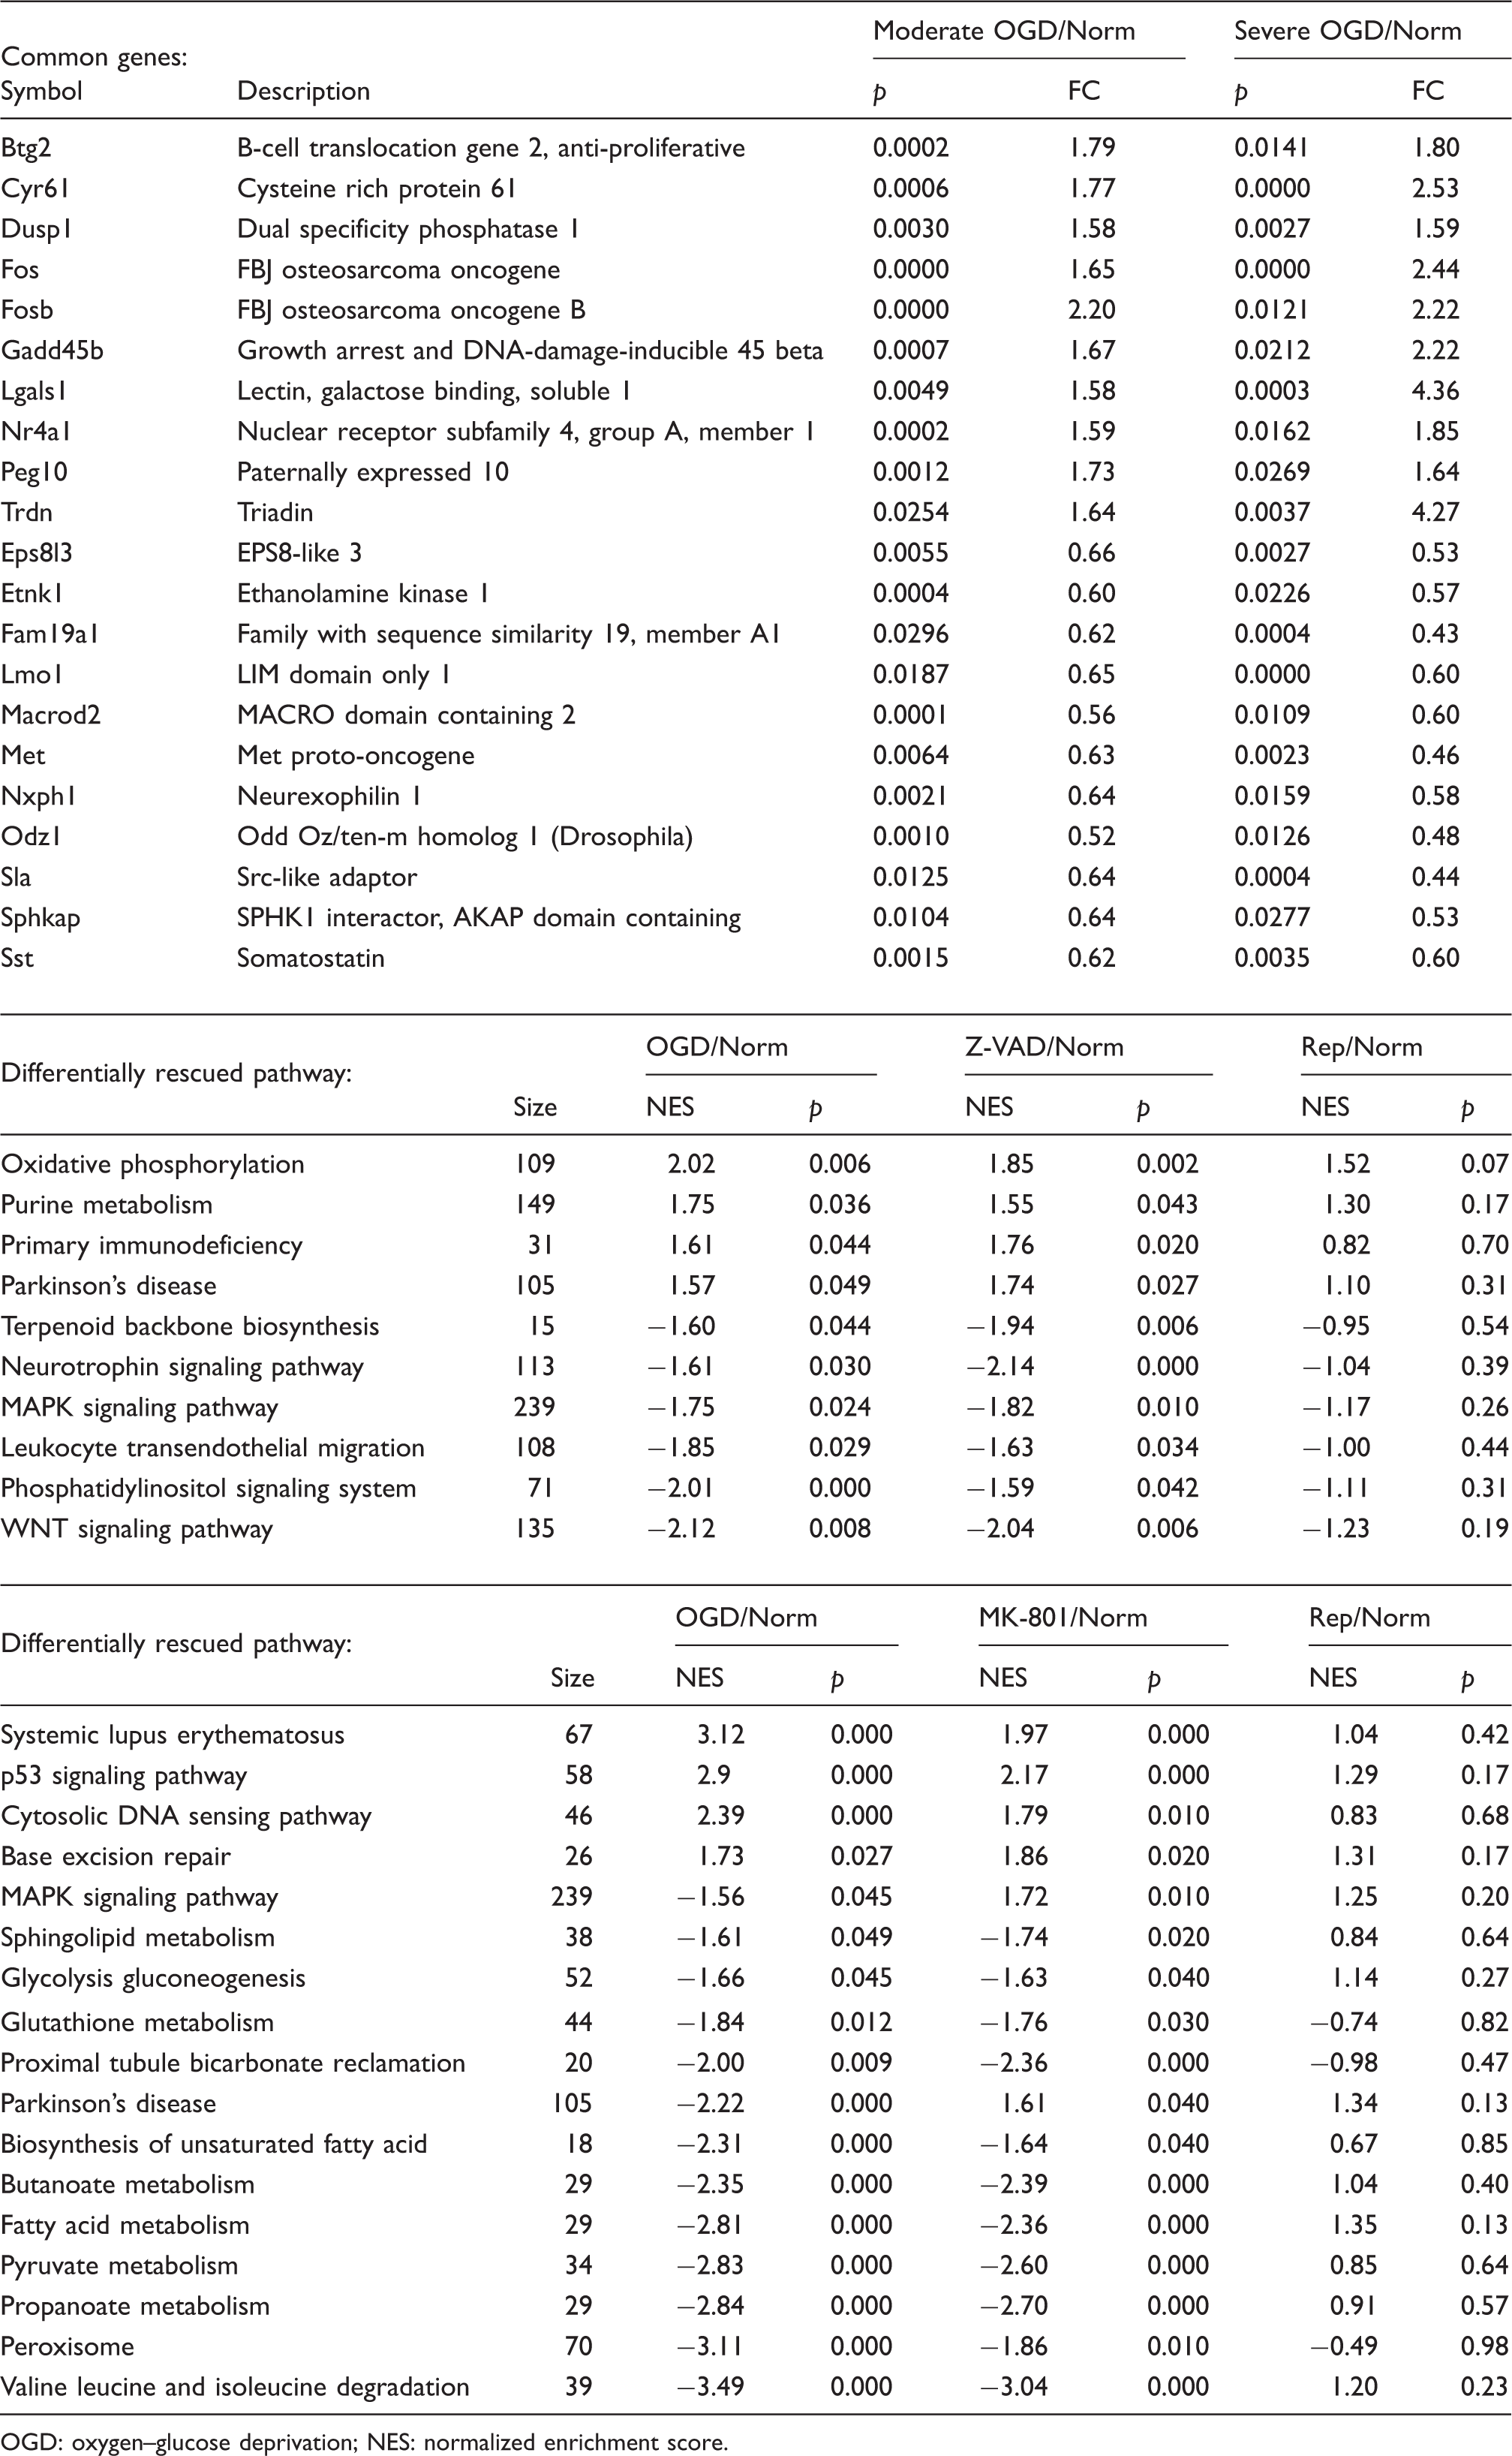
First, we compared neuronal perturbations after moderate injury in Experiment 1 versus severe injury in Experiment 2. As expected, many more genes were significantly altered in severe versus moderate injury (Figure 6(a)). However, a common set of differentially expressed probes could be detected (Table 1), and some of these genes are broadly involved in stress response, calcium, HIF and MAP kinase signaling. Similarly, severe injury also altered more pathways compared to moderate injury (Figure 6(b)). Moderate injury led to about an equal mix of upregulated and downregulated pathways, whereas severe injury led to more downregulated pathways (Figure 6(b)). GSEA analysis demonstrated that, after both moderate and severe injury, many common pathways could be detected. Consistent with the list of differentially expressed genes, these pathways seemed to mostly reflect a downregulation of neuronal function, calcium and MAP kinase signaling, and a general upregulation of DNA repair mechanisms in both experiments (Figure 6(c)). However, it was interesting to note that amongst these common responses, some pathways appeared to move in opposite directions (Figure 6(d)). Oxidative phosphorylation and proteasome pathways were upregulated after moderate injury but downregulated after more severe injury. Opposite responses were also noted in some disease pathways (e.g. Parkinson’s, amyotrophic lateral sclerosis, Huntington’s) with upregulation and downregulation in moderate and severe injury conditions, respectively. Beyond these common pathways, differential responses were also detected. For example, after moderate injury in Experiment 1, there was upregulation in PPAR signaling and transcriptional factors and downregulation in VEGF signaling and cell adhesion (Figure 6(e)). After more severe injury in Experiment 2, there was upregulation in cell cycle pathways, p53 and cytokine receptor interactions, and downregulation in N-glycan synthesis, fatty acid metabolism and pyruvate metabolism, etc. (Figure 6(f)).
(a) Distribution of differentially expressed probes in both experiments indicates that severe injury altered more genes than moderate injury. (b) Distribution of differentially altered pathways (KEGG) in both experiments confirmed the large response after severe 4 h OGD compared with moderate injury after 2 h OGD. (c) Common pathways that responded in similar directions after both moderate and severe OGD. (d) Common pathways that responded in opposite directions after both moderate and severe OGD. (e) Pathways that were unique in moderate OGD. (f) Pathways that were unique in severe OGD. (g) Reactive oxygen species (ROS)-related pathways were examined in the gene ontology (GO) database (see Supplementary Table 3). Bar graph shows the total number of GO categories significantly affected by OGD, reperfusion and neuroprotection. NES indicates normalized enrichment score. Note: GO categories contain many overlaps in gene members so that truly quantitative comparisons cannot be obtained between categories. The number of pathways plotted here only provides indirect information on potential patterns of response. Gene and pathway responses in neurons after oxygen–glucose deprivation, reperfusion and neuroprotection. OGD: oxygen–glucose deprivation; NES: normalized enrichment score.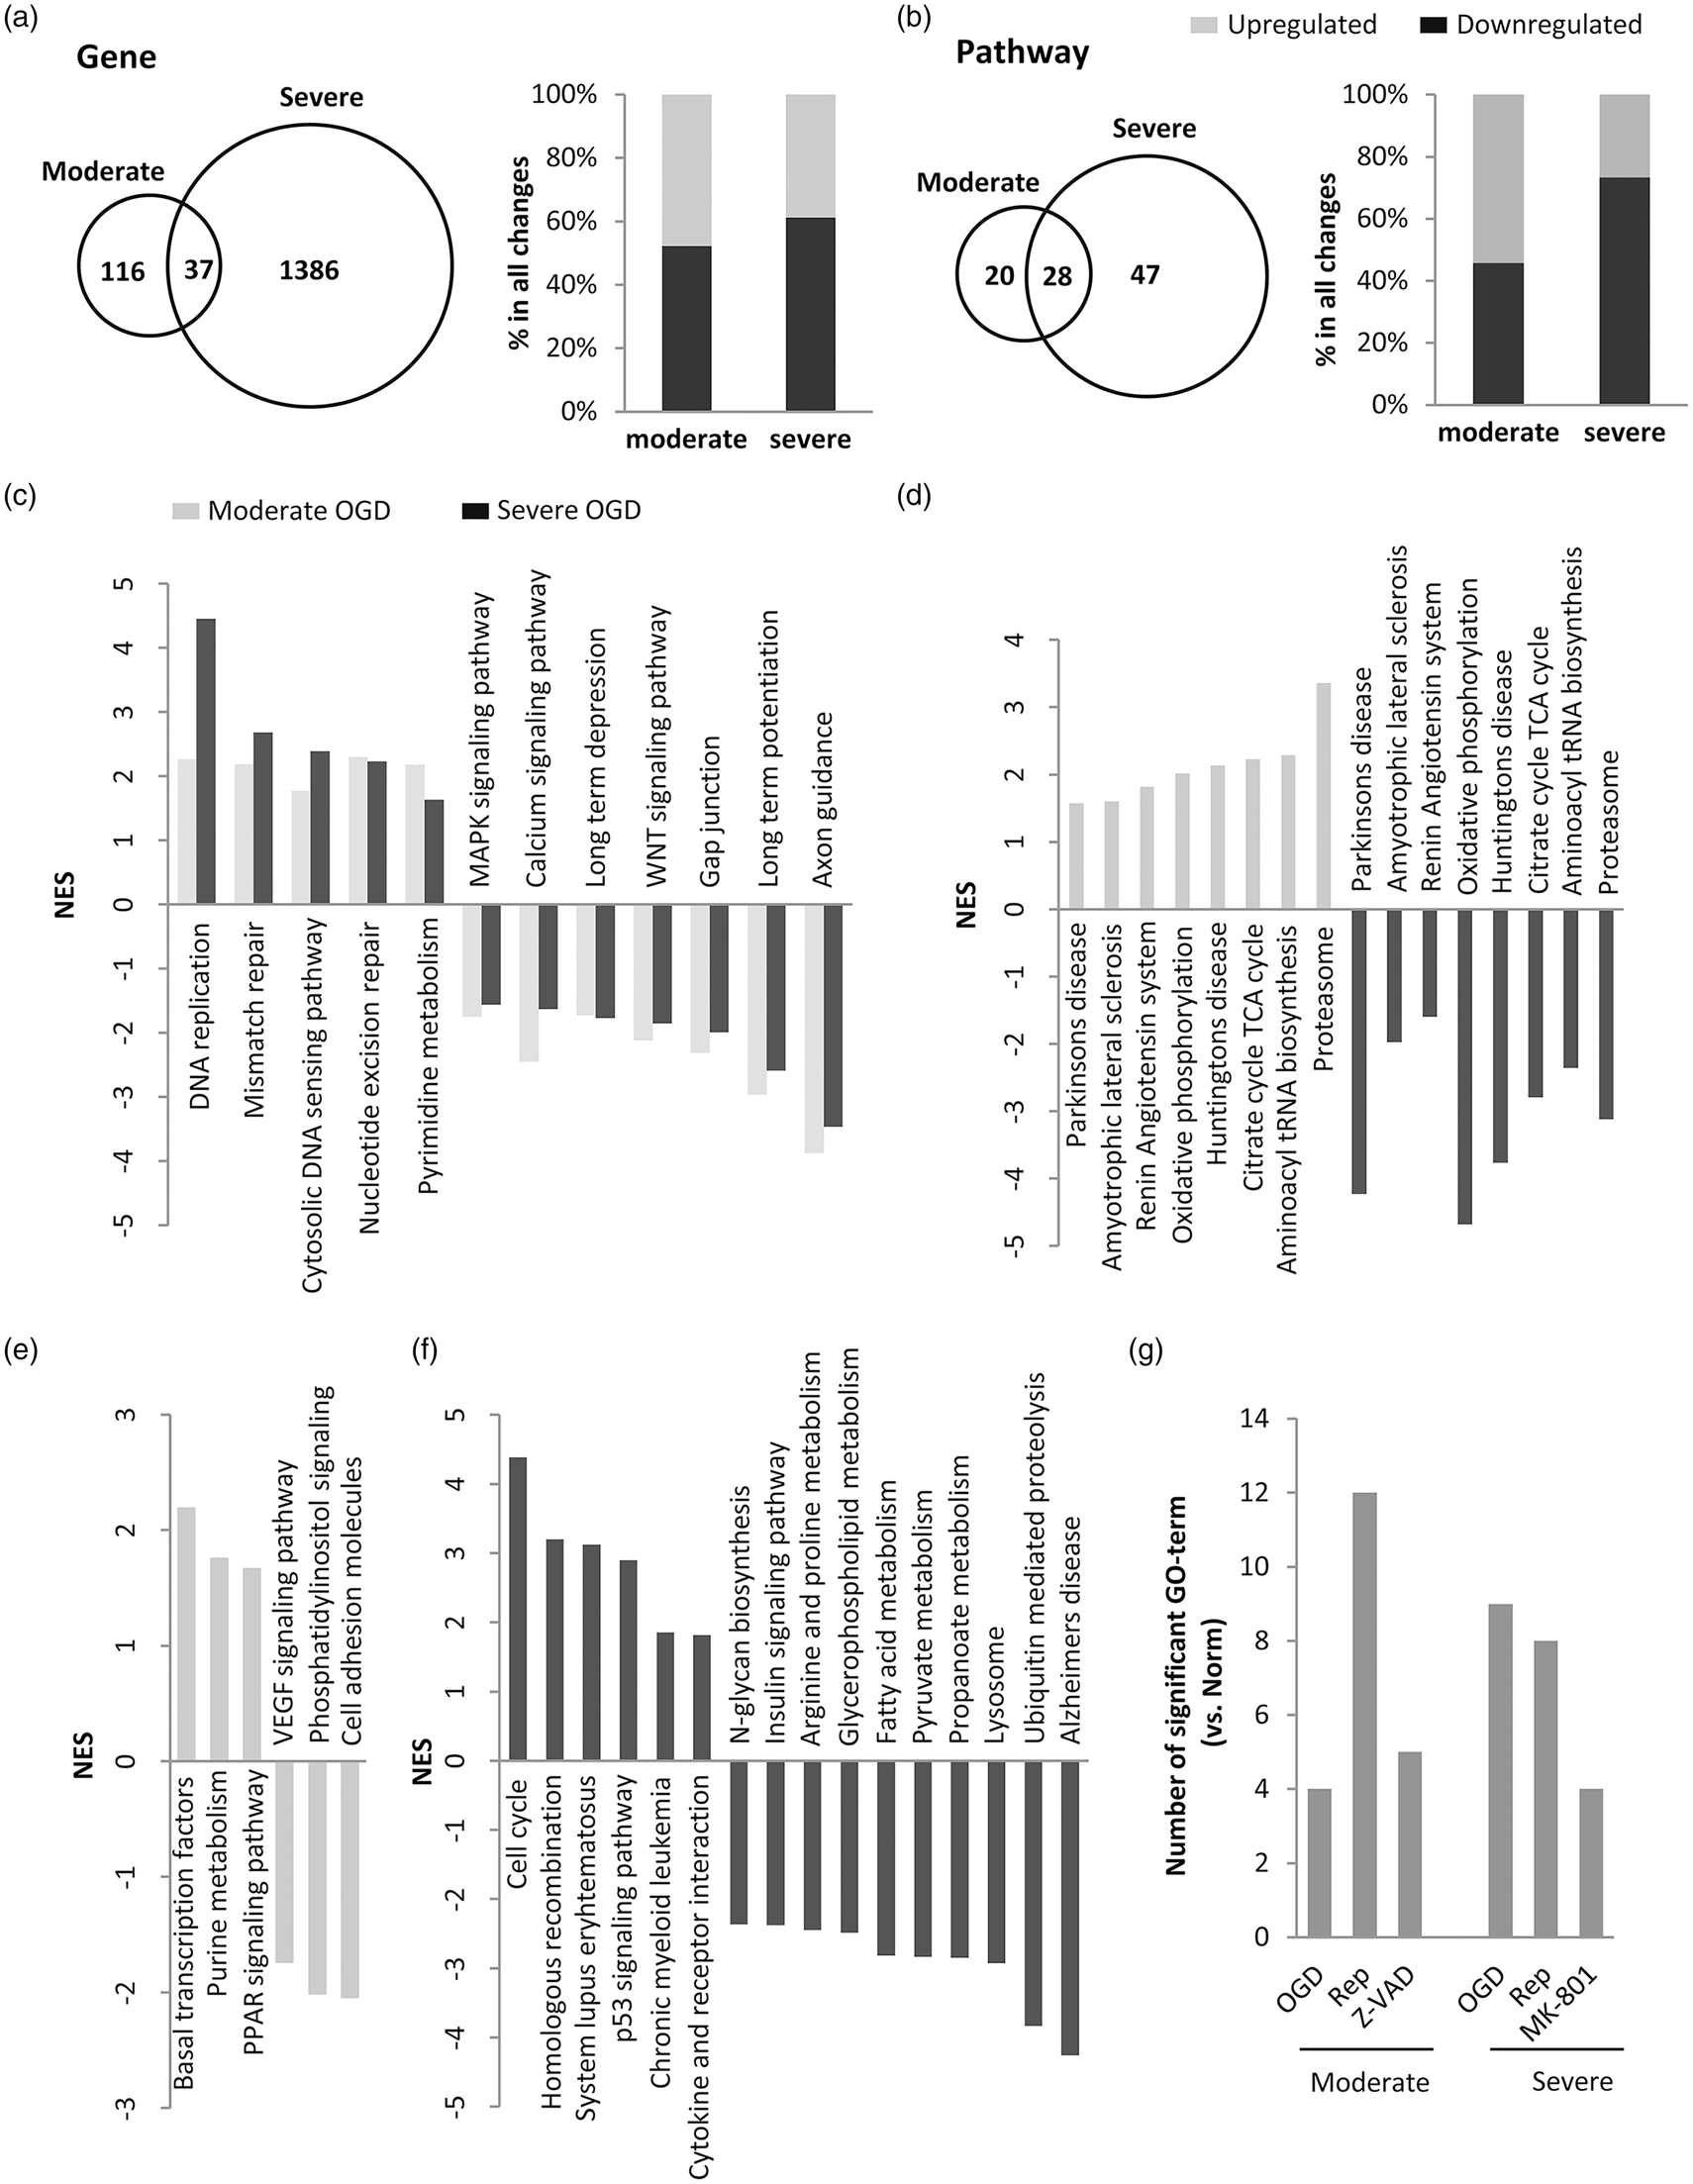
A major issue related to the rapid restoration of oxygen and glucose is the worry of reperfusion injury and oxidative/nitrosative stress. Therefore, we assessed the responses of anti-oxidant enzymes in our experiments, comprising catalase, glutathione peroxidase, glutathione-S-transferase, peroxiredoxin, superoxide dismutase, thioredoxin and thioredoxin reductase. In general, heterogeneous shifts were detected in these anti-oxidant systems, with some genes being upregulated and some genes being downregulated, and no obvious differences were detected between reperfusion versus neuroprotectant drug treatments (Supplementary Table S2). Besides individual gene responses, gene ontology pathways related to reactive oxygen species (ROS) were also examined. Overall, many ROS-related pathways were significantly altered by OGD, reperfusion and neuroprotectant treatments (Supplementary Table S3). It is important to note that gene ontology pathways contain multiple overlaps in gene members within each category, so that quantitative comparisons between pathways cannot be strictly obtained. Nevertheless, three potential “indirect patterns” may emerge (Figure 6(g)). First, severe OGD injury may alter more pathways than moderate injury. Second, reperfusion may tend to affect more ROS-related pathways compared to neuroprotection with either Z-VADfmk or MK-801. Third, reperfusion may increase the number of significant ROS-related pathways after moderate but not severe injury.
Finally, we asked whether pathway analyses could provide initial insights into potential differences between energetic rescue versus molecular neuroprotection. To accomplish this goal, we assessed the collection of pathways that were altered after OGD, and looked for those that were differentially renormalized by reperfusion and not by neuroprotection (Table 1). Moderate neuronal injury in Experiment 1 downregulated MAP kinase signaling and neurotrophin signaling, and upregulated oxidative phosphorylation. Reperfusion appeared to renormalize these pathways to a greater extent compared to caspase inhibition via Z-VADfmk (Table 1, Figure 7(a)). Similar patterns were noted in Experiment 2. After more severe injury, fatty acid metabolism and glycolysis pathways were suppressed, and once again, reperfusion renormalized these perturbations to a greater extent compared to the NMDA antagonist MK-801 (Table 1, Figure 7(b)).
(a) Gene expression in the differentially rescued “neurotrophin signaling” interactome, after moderate OGD and either reperfusion or Z-VADfmk. (b) Gene expression in the differentially rescued “fatty acid metabolism” interactome, after severe OGD and either reperfusion or MK-801. These two representative interactomes may illustrate that, in general, alterations may be “renormalized” to a greater extent after in vitro reperfusion compared with neuroprotectant treatments.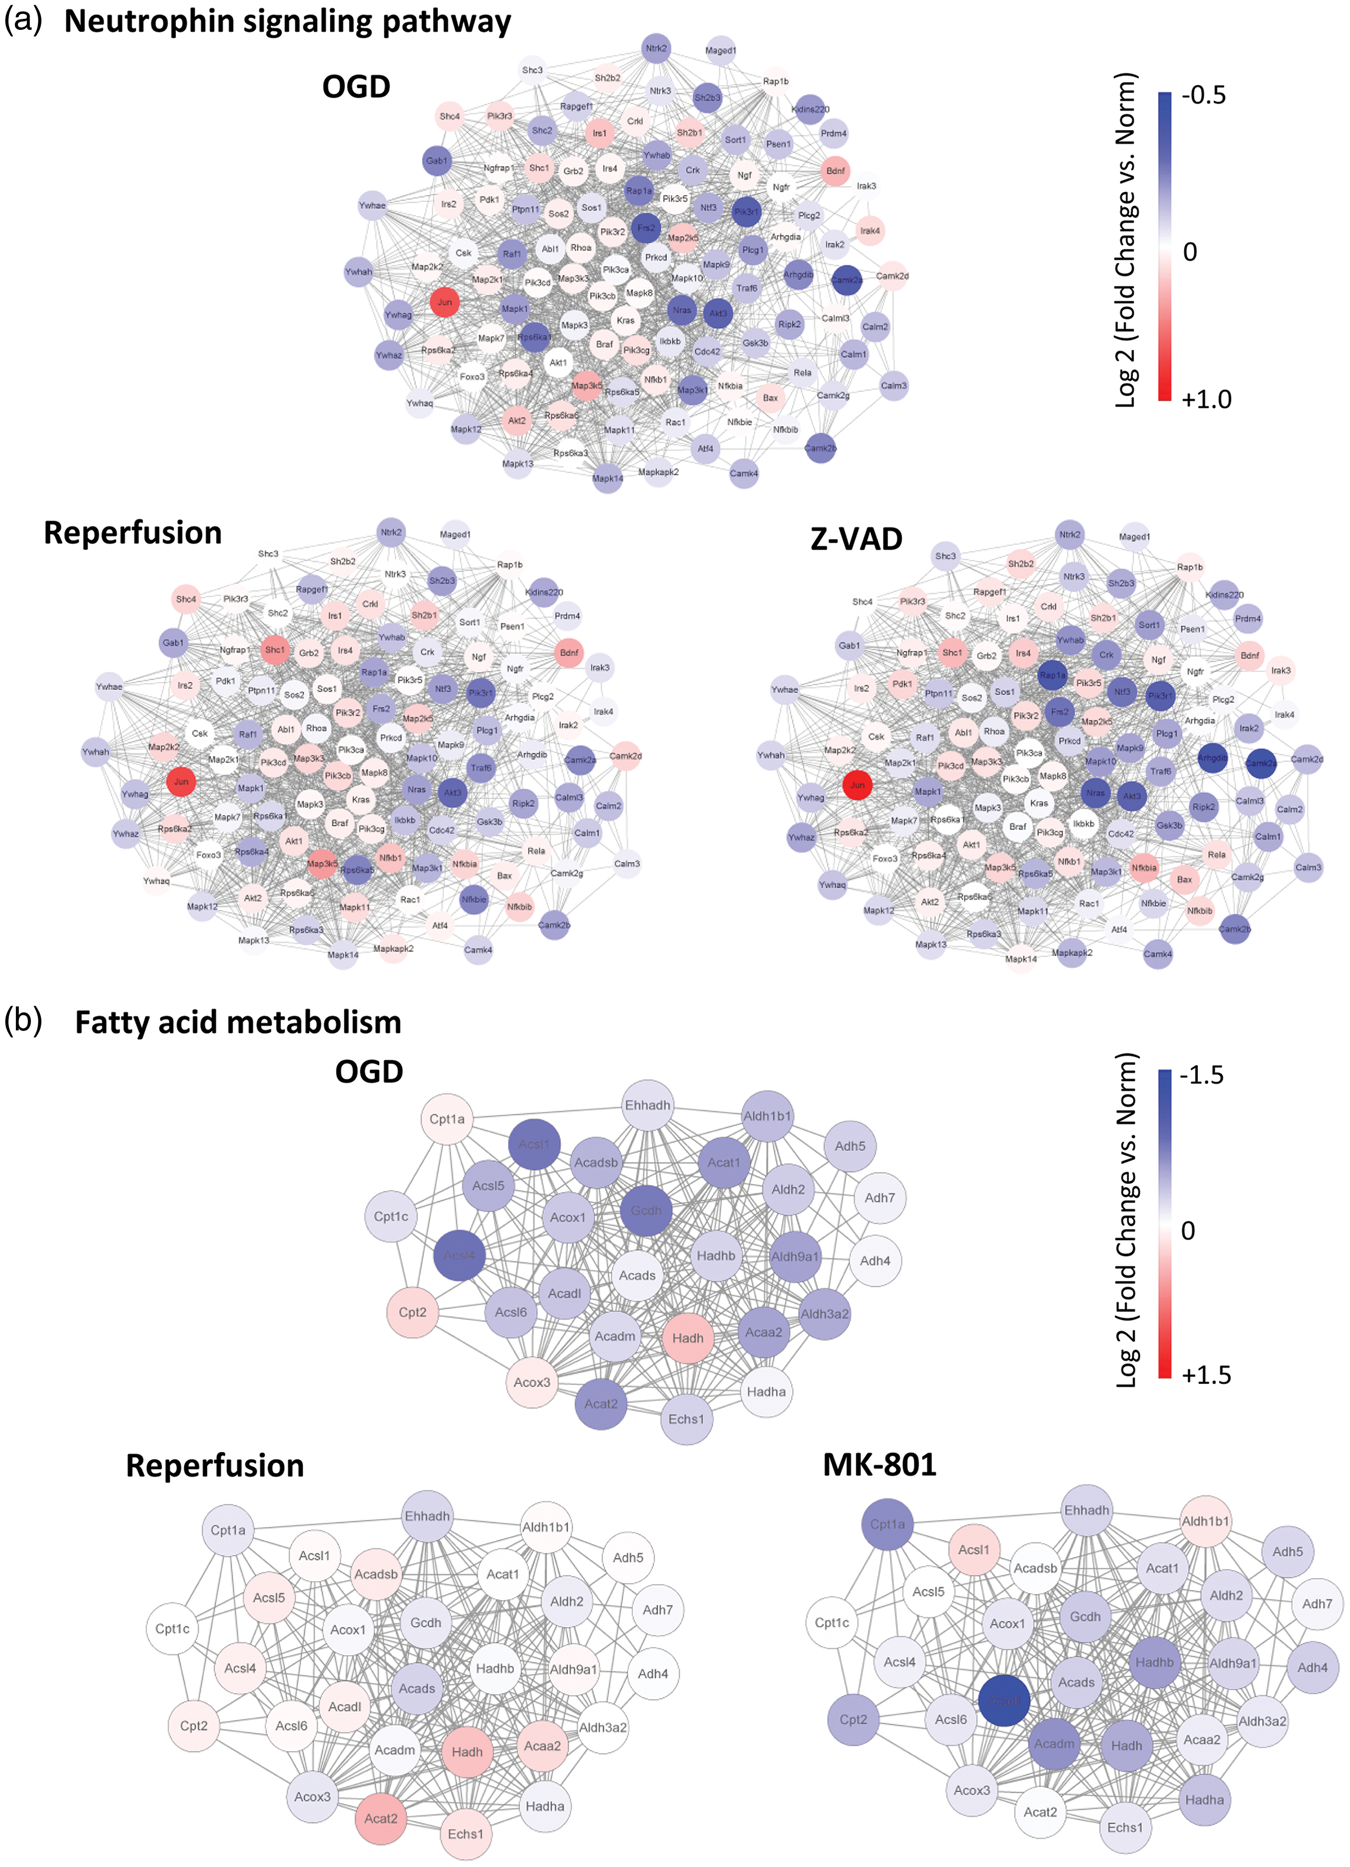
Discussion
Although many molecular mechanisms have been effectively targeted in cell and animal models of cerebral ischemia, it has been challenging to find “molecular” neuroprotectants that robustly show positive signals in clinical trials. In contrast, reperfusion therapies have worked in cells, animal models and human stroke patients. Is it because there are fundamental differences between neurons that are salvaged via energetic rescue (i.e. reperfusion) versus those that are protected by blocking cell death pathways? Our findings here suggest that this hypothesis may be worth exploring further. After OGD in primary cultures, in vitro reperfusion appeared to renormalize the neuronal transcriptome to a greater extent compared to neuroprotection with either Z-VADfmk or MK-801, suggesting that lack of cytotoxicity does not necessarily equal normal restitution of function per se.
The term “neuroprotection” itself may also be somewhat misleading. It is now generally recognized that preventing cell death in neurons alone may not be enough for stroke. First, the concept of the neurovascular unit suggests that in stroke pathophysiology, all neuronal, glial and vascular cells are affected, and so all cell types must be rescued.1–3 Indeed, a potential difference between reperfusion and some modes of neuroprotection is the fact that reperfusion or energetic rescue is “cell-agnostic,” i.e. energetic rescue should be beneficial to all cell types, not just neurons alone. Second, beyond preventing cell death per se, clinical efficacy should require the ability of the rescued cells to communicate with each other. In this regard, our present gene expression data may raise the possibility that under some conditions, the “neuroprotected” neuron may be “alive” but not necessarily normal.
How do the present findings compare with the literature? Two recent studies also used microarrays to map the transcriptome in primary neurons after OGD.18,19 Responses in cell culture are known to be highly sensitive to experimental conditions. So, the significant overlap in differentially expressed genes and pathways between these two previous studies and our present findings provide reassurance that the detected changes in stress response genes and MAP kinase pathways represent highly conserved mechanisms that allow neurons to react to injury. Comparisons with in vivo models of cerebral ischemia may be more difficult because of the variability in animal model species (usually rat or mouse) and protocols (permanent or transient ischemia of varying durations, different locations in core versus penumbral regions, different times of brain removal post-ischemia etc). Furthermore, all published findings to date involve mRNA collected from whole brain homogenates which comprise a mix of all neuronal, glial and vascular cell types. Nevertheless, this large literature is best summarized by two reviews/meta-analyses. Cox-Limpens et al. 20 found a large range of genes altered by cerebral ischemia, including those involved in stress response, cell death, neurotrophic signaling, cytoskeleton, ribosome, and ion channels and neurotransmission. However, across the 11 micro-array studies that were reviewed, only 15 common genes were detected in two or more studies. Among these, Dusp1, Nr4a1, and Fos were also present in our present study as common genes perturbed in both moderate and severe OGD. Fos is a well-known immediate early stress response gene that is rapidly upregulated after cerebral ischemia. 21 Dusp1 is a HIF target gene 22 so this response after OGD or stroke makes sense. Nr4a1 is a neuron activity-inducible gene associated with CREB signaling, 23 which is known to be triggered by cerebral ischemia. 24 Regardless of the relatively small set of common genes across the literature, pathway analyses revealed that MAP kinase signaling was a prominent and common pathway triggered by cerebral ischemia, in agreement with our cell culture findings here. Similar conclusions were reached by Zhou et al., 25 who identified MAP kinase, cytokine-cytokine receptor interactions, and neurotrophin signaling as common pathways in a meta-analysis of four microarray datasets. Again, these pathways were detected in our present study. Cytokine–cytokine receptor interaction was altered in the severe injury condition. Neurotrophin signaling was altered in the moderate injury condition. MAP kinase signaling was altered after both moderate and severe injury. Of interest is the observation that after moderate injury in Experiment 1, in vitro reperfusion renormalized MAP kinase and neurotrophin signaling but neuroprotection with Z-VADfmk did not.
It is important to note that for an initial proof-of-principle study, it would not be practical to study all variables and options. We only tested Z-VADfmk and MK-801. Other neuroprotectants may offer different transcriptomic effects. However, even in this initial analysis, some common pathways may already be discerned across different neuroprotectants. A recent study in a nonhuman primate model of focal cerebral ischemia found that neuroprotection with a PSD-95 inhibitor altered MAP kinase, axon guidance, focal adhesion and cytokine pathways. 26 All four pathways were also significantly rescued by MK-801 in our cell culture experiments. Whether some neuroprotectants offer a greater renormalization of the injured neuronal transcriptome warrants further study. Furthermore, the observed transcriptomic differences between reperfusion and neuroprotection may also be affected by timing. It should be interesting to compare early versus late reperfusion, with the potential expectation that delayed reperfusion profiles may eventually converge with neuroprotection profiles. Ultimately, one might envision that these profiling experiments may be used to study and develop optimized combinations of neuroprotectants plus reperfusion.
Taken together, our data suggest that after OGD, neurons rescued by in vitro reperfusion may have a different gene expression profile compared with neurons rescued by Z-VADfmk or MK-801. Nevertheless, there are several caveats. First, our primary endpoint here is based on the neuronal transcriptome. We did observe differences in neuronal dendritic complexity when comparing MK-801 against reperfusion, suggesting that functional differences may indeed be present. Nevertheless, future studies are warranted to apply electrophysiology to rigorously compare the various functional states of rescued neurons. Second, we only examined neuronal responses in isolation. The emerging concept of help-me signaling suggests that neuronal recovery from injury depends on non-cell-autonomous signals from adjacent cells. 27 For example, cerebral endothelium is now known to be an important source of neurotrophic signals,13,28–30 and astrocytes significantly contribute to neuroprotection and neurorepair.31,32 How gene responses evolve in the entire neurovascular unit (including glial and vascular cells) remains to be determined. Third, there will always be differences between cell culture models and the in vivo situation. In vitro, all cells are subjected to uniform insults, whereas in vivo gradients in core-to-penumbral injury and evolution will be critical. 33 Furthermore, cell cultures are typically derived from very young brains, whereas strokes tend to occur in older patients. 34 How all these potential differences in reperfusion versus neuroprotection are manifested in vivo remains to be explored, especially in terms of functional recovery. Fourth, this initial study focused on detectable changes in gene arrays. It will be important to ask whether differential responses between neuroprotection and reperfusion may also be present for the emerging areas of non-coding RNA and post-translational modifications.35,36 Fifth, there may be key differences between species. Neuroprotection seems to work in rodents but it has been difficult to achieve positive effects in human. A previous study has suggested that when comparing rodent versus human cellular responses to OGD, some pathways are the same and some pathways are different. 37 The present study uses only primary neuronal cultures from mice. It remains possible that human neurons may show different transcriptomic profiles after OGD. Further investigations are warranted to examine responses in human cells. Furthermore, it should be important to eventually map all responses across different cell types both in culture as well as in vivo. Finally, this study provides proof-of-concept rather than final conclusions. The present experiments do not prove a specific hypothesis. Instead, the findings here should help with further hypothesis-generation, in terms of understanding the potential limitations of neuroprotection versus reperfusion for stroke.
In conclusion, this study supports the idea that there may be potential differences between reperfusion therapies versus molecular neuroprotection in stroke. Rescuing neurons by reperfusion involve an upstream event, i.e. re-establishing the supply of oxygen and glucose. Molecular neuroprotection tends to involve more downstream events, i.e. blocking the cascades of cell death and inflammation that are triggered by the loss of oxygen and glucose. Is it possible that an upstream therapy may bring salvaged neurons back “closer to normal” compared to downstream therapies? There may also be translational implications. If different pathways are indeed involved, one can envision combination therapies that target differentially expressed pathways, and these can then be productively added onto existing tPA and endovascular thrombectomy protocols for stroke patients. 38
Supplemental Material
Supplemental Figure - Supplemental material for Comparative transcriptome of neurons after oxygen–glucose deprivation: Potential differences in neuroprotection versus reperfusion
Supplemental material, Supplemental Figure for Comparative transcriptome of neurons after oxygen–glucose deprivation: Potential differences in neuroprotection versus reperfusion by Shuzhen Guo, Anna Tjärnlund-Wolf, Wenjun Deng, Emiri Tejima-Mandeville, Lauren J Lo, Changhong Xing, Ken Arai, MingMing Ning, Yiming Zhou and Eng H Lo in Journal of Cerebral Blood Flow & Metabolism
Supplemental Material
Supplemental Table S1 - Supplemental material for Comparative transcriptome of neurons after oxygen–glucose deprivation: Potential differences in neuroprotection versus reperfusion
Supplemental material, Supplemental Table S1 for Comparative transcriptome of neurons after oxygen–glucose deprivation: Potential differences in neuroprotection versus reperfusion by Shuzhen Guo, Anna Tjärnlund-Wolf, Wenjun Deng, Emiri Tejima-Mandeville, Lauren J Lo, Changhong Xing, Ken Arai, MingMing Ning, Yiming Zhou and Eng H Lo in Journal of Cerebral Blood Flow & Metabolism
Supplemental Material
Supplemental Table S2 - Supplemental material for Comparative transcriptome of neurons after oxygen–glucose deprivation: Potential differences in neuroprotection versus reperfusion
Supplemental material, Supplemental Table S2 for Comparative transcriptome of neurons after oxygen–glucose deprivation: Potential differences in neuroprotection versus reperfusion by Shuzhen Guo, Anna Tjärnlund-Wolf, Wenjun Deng, Emiri Tejima-Mandeville, Lauren J Lo, Changhong Xing, Ken Arai, MingMing Ning, Yiming Zhou and Eng H Lo in Journal of Cerebral Blood Flow & Metabolism
Supplemental Material
Supplemental Table S3 - Supplemental material for Comparative transcriptome of neurons after oxygen–glucose deprivation: Potential differences in neuroprotection versus reperfusion
Supplemental material, Supplemental Table S3 for Comparative transcriptome of neurons after oxygen–glucose deprivation: Potential differences in neuroprotection versus reperfusion by Shuzhen Guo, Anna Tjärnlund-Wolf, Wenjun Deng, Emiri Tejima-Mandeville, Lauren J Lo, Changhong Xing, Ken Arai, MingMing Ning, Yiming Zhou and Eng H Lo in Journal of Cerebral Blood Flow & Metabolism
Footnotes
Funding
The author (s) received no financial support for the research, authorship, and/or publication of this article.
Declaration of conflicting interests
The author(s) declared no potential conflicts of interest with respect to the research, authorship, and/or publication of this article.
Authors’ contributions
Experimental performance (SG, ATW, ETM, CX, KA, MMN, YZ, EHL), data analysis (SG, ATW, WD, LJL, CX, YZ), study design (SG, ATW, ETM, CX, KA, YZ, EHL), manuscript preparation (SG, ATW, WD, MMN, EHL).
References
Supplementary Material
Please find the following supplemental material available below.
For Open Access articles published under a Creative Commons License, all supplemental material carries the same license as the article it is associated with.
For non-Open Access articles published, all supplemental material carries a non-exclusive license, and permission requests for re-use of supplemental material or any part of supplemental material shall be sent directly to the copyright owner as specified in the copyright notice associated with the article.