
Abstract
The vascular effects of antiangiogenic treatment may pose problems for evaluating brain tumor response based on contrast-enhanced magnetic resonance imaging (MRI). We used serial dynamic contrast-enhanced MRI at 12 T to assess vascular responses to antiangiogenic versus steroid therapy. Athymic rats with intracerebral U87MG human glioma (n = 17) underwent susceptibility-weighted perfusion MRI with ferumoxytol, a solely intravascular ultrasmall superparamagnetic iron oxide (USPIO) nanoparticle, followed by T1-weighted dynamic gadodiamide-enhanced MRI to measure vascular permeability. Rats were imaged before and after 24, 48, and 72 h of treatment with the antiangiogenic agent bevacizumab or the corticosteroid dexamethasone. Contrast agent extravasation was seen rapidly after gadodiamide, but not with ferumoxytol administration. Bevacizumab significantly decreased the blood volume and decreased permeability in tumors as determined by increased time-to-peak enhancement. A single dose of 45 mg/kg bevacizumab resulted in changes analogous to dexamethasone given in an extremely high dose (12 mg/kg per day), and was significantly more effective than dexamethasone at 2 mg/kg per day. We conclude that dynamic perfusion MRI measurements with ferumoxytol USPIO to assess cerebral blood volume, along with dynamic gadodiamide-enhanced MR to assess vascular permeability, hold promise in more accurately detecting therapeutic responses to antiangiogenic therapy.
Introduction
Neovascularization is an essential factor of tumor blood supply and consequently disease progression. One of the key regulators of angiogenesis is the vascular endothelial growth factor (VEGF), which is often overexpressed in high-grade gliomas (Huang et al, 2005). Vascular endothelial growth factor inhibitors have been successfully used in patients with high-grade gliomas (Reardon et al, 2008). Along with various antiangiogenic drugs, bevacizumab (BEV, Avastin™), a monoclonal antibody targeting VEGF, has been investigated in numerous preclinical and clinical studies (Duda et al, 2007; Ignoffo 2004; Jahnke et al, 2008). Although the mechanism of these antiangiogenic agents is still not fully understood, decreasing edema by decreasing the blood–brain barrier (BBB) permeability may play an important role (Pope et al, 2006).
At present, the standard criteria of treatment response in glioma are based on the enhancement from gadolinium-based contrast agents (GBCAs) (Macdonald et al, 1990; Shah et al, 2006). Contrast enhancement of central nervous system tumors derives from two, usually combined factors, namely an intravascular component, representing increased vascularity, and an extravascular component, indicative of BBB defects (Sartor 1996). Assessing intravascular and extravascular spaces separately in high-grade gliomas is problematic because of the rapid extravasation of GBCAs. However, it would be beneficial to assess the spaces separately, as the intravascular cerebral blood volume (CBV) may correlate better with tumor grade than does GBCA enhancement as a measure of BBB defects (Law et al, 2004).
When antiangiogenic drugs act on hyperpermeable tumor blood vessels, the apparent decrease in enhancing tumor volume may represent decreased tumor vascular permeability without affecting the underlying tumor mass. This is sometimes referred to as a ‘steroid-like’ effect, as glucocorticoids are used routinely in brain tumors to decrease intracranial pressure and edema by decreasing BBB permeability. Therefore, the standard criteria for glioma response by measuring changes in contrast enhancement may not be adequate when evaluating antiangiogenic treatment. It is critical to investigate the utility and reliability of alternative response measures, such as CBV, as measured by dynamic susceptibility contrast (DSC) perfusion magnetic resonance imaging (MRI), and permeability, as measured by dynamic contrast enhanced (DCE) MRI (Batchelor et al, 2007; Wong and Brem 2007).
Perfusion MRI with GBCAs could result in inaccurate tumor volumes by under- or overestimating CBV values in highly permeable tumors (Neuwelt et al, 2007), because the CBV calculation assumes no extravasation. Measuring CBV independently from BBB permeability, by using an agent restricted to the vasculature (blood pool) at early time points (seconds to minutes), would be beneficial, especially when evaluating treatment in which macro- and microvasculature is targeted (Claes et al, 2008; Gambarota et al, 2008).
The objective of this study was to test ferumoxytol, a blood pool ultrasmall superparamagnetic iron oxide (USPIO) nanoparticle contrast agent, for MR perfusion measurements in monitoring antiangiogenic treatments in comparison with glucocorticoid treatments. Ferumoxytol was chosen in this study for its safety profile, as it does not cause mast cell degranulation with the rapid infusion needed for DSC MR. This imaging protocol has been modified from that of Pike et al (2006) with the USPIO and GBCA contrast agents being administered in the same imaging session, but beginning with a short ferumoxytol bolus to capture the first pass using a T2*-based DSC perfusion sequence (Neuwelt et al, 2007), followed by a gadodiamide bolus and repeated T1-weighted scans for DCE imaging.
Materials and methods
Animal Model
The care and use of animals was approved by the Institutional Animal Care and Use Committee and were supervised by the Oregon Health and Science University (OHSU) Department of Comparative Medicine. The U87 human glioma intracerebral xenograft model was selected for the study because it is known to be a vascular tumor that overexpresses VEGF (Valter et al, 1999) and has previously been used to study antiangiogenic treatment response (Claes et al, 2008). U87MG human glioma cells were cultured in Dulbecco's Modified Eagle's (DME) medium supplemented with 10% fetal bovine serum and antibiotics. Male athymic nude rats (rnu/rnu, 252 to 332 g; from the OHSU Blood-Brain Barrier Program in-house colony) were anesthetized with intraperitoneal ketamine (60 mg/kg) and intraperitoneal diazepam (7.5 mg/kg). All rats were treated with cyclophosphamide (300mg/m2 i.p.) 24h prior to tumor implantation to increase tumor growth (Wu et al, 2009). Animals received 1.2 to 1.5 × 10⁶ of >90% viable U87MG cells in a volume of 15µL, stereotactically injected in the right caudate nucleus (vertical, bregma 5mm; lateral, bregma 3mm). The needle was initially advanced to a depth of 6.5mm and then withdrawn to a depth of 5mm to limit reflux up the needle track. The animals were examined daily and weighed at least weekly. Animals were killed if they showed severe clinical signs or symptoms, or >20% weight loss. Tumor growth was monitored weekly using MRI starting 14 days after implantation. Studies were started when tumor volumes reached at least 50mm3 (achieved 14 to 42 days after implantation).
Dynamic Contrast Magnetic Resonance Imaging
Tumor-bearing animals were anesthetized using intraperitoneal medetomidine (0.6 mg/kg, Domitor®, Pfizer Animal Health, Exton, PA, USA) and ketamine (15 mg/kg). After the jugular vein catheter insertion, animals were placed in the 12-T MRI scanner (Bruker, Billerica, MA, USA). Throughout MR scans, warm water was circulated under the animals to keep them warm, and oxygen saturation and heart rate were monitored. A 7-cm quadrature birdcage coil was used to transmit radiofrequency, and a 2-cm surface coil, placed on the animal's head, was used to receive radiofrequency. Both coils were actively decoupled. High-resolution anatomical T2-weighted scans were performed in both the coronal and axial planes for accurate planning of the DSC and DCE studies. To ensure precise contrast agent delivery, the end of the catheter was preloaded with 60 µL of undiluted ferumoxytol (∼6 mg/kg) (provided by AMAG Inc., Cambridge, MA, USA; 30mg Fe per mL; total dose 1.8mg Fe). For the DSC gradient echo images, the following parameters were used: TR (repetition time) 9.7 msecs, TE (echo time) 4.0 msecs, flip angle 5°, slice thickness 1.4mm, rectangular FOV (field of view) 3.6 × 2.6cm2, 128 read-out points, and 64 phase encode lines, zero filled to 128 lines. These resulted in a 0.6-sec per image time-resolution and an in-plane (zero filled) spatial resolution of 280 × 200 µm. During this rapid single-slice coronal T2*-weighted image acquisition, ferumoxytol was injected as a short bolus using an infusion pump, followed by a saline flush of 240 µL at a 3 mL/min flow rate. After 5 to 15 mins, the permeability measurement was performed using 60 µL of preloaded, twofold diluted (250 mmol/L) gadodiamide bolus (Omniscan®, GE Healthcare, Waukesha, WI, USA) followed by 240 µL saline flush administered at a 1 mL/min flow rate during rapid repeated single-slice T1-weighted image acquisition. For these DCE gradient echo images, the following parameters were used: TR 25.0 msecs, TE 1.7 msecs, flip angle 20°, slice thickness 1.0mm, rectangular FOV 5.1 × 2.6cm2, 128 read-out points, and 64 phase encode lines. These resulted in a 1.6-s per image time-resolution, and an in-plane (zero filled) spatial resolution of 400 × 400 µm. Inflow saturation slices, having a thickness of 3.0mm and a gap of 1.0mm from the slice of interest, were applied both anterior and posterior to the slice of interest. Rats were scanned before treatment and after 24, 48, and 72 h of treatment. After each time point, jugular catheters were flushed with 1mL of heparinized saline (5 to 50 U/mL), and then sealed by heat and were preserved under the back skin for the dynamic MR session the next day. After the MRI, medetomidine was reversed using 1mg atipamezole (Antisedan®, Pfizer Animal Health).
Treatment Groups
Five animals received BEV (45 mg/kg) as a single intravenous injection (through the jugular catheter) in a volume of ∼0.6 mL. Four animals were treated with a standard animal dose of dexamethasone (DEX 2, 2 mg/kg per day, intramuscularly, twice a day) (Guney et al, 2007) and five animals received a higher dose of dexamethasone (DEX 12, 98 mg/m2 per day, intramuscularly, twice daily (Neuwelt et al, 1984), equivalent to 12 mg/kg per day in a 300 g rat). Three control animals (CTR) received saline only. Before the study, two additional U87 tumor-bearing animals were used to test the feasibility of the study, comparing ferumoxytol and gadodiamide injections in both DSC and DCE MRIs.
Histology
Pilot animals were killed at 24 h and study animals were killed after the 72-h time point MRI. The brains were excised and fixed in 10% buffered formalin for vibratome sectioning at 100 µm in the coronal plane. Histology sections were stained with hematoxylin for tumor volumetrics. For USPIO localization, iron histochemistry was performed using the Diaminoben Zidine-(DAB)-enhanced Perl's stain (Muldoon et al, 2005).
Image Processing
From the perfusion data, CBV maps were processed using Lupe (Lund, Sweden) perfusion software. At each time point, relative CBV (rCBV) values were calculated on a region of interest basis as a ratio of the tumor blood volume to a normal appearing (contralateral) brain tissue. To compare the rCBV changes between treatment groups, rCBV values were normalized in each posttreatment time point to the pretreatment value with a formula of (Posttreatment (24, 48, or 72 h) rCBV–1)/(Pretreatment rCBV–1). Using the information from the serial T1-weighted scans, the vessel permeability was evaluated by determining the time-to-peak (TTP) enhancement (de Crespigny et al, 1999) (Figure 1) in the same tumor region of interest used for perfusion measurement. Region of interest-based analysis was performed using MIPAV software (Medical Image Processing, Analysis and Visualisation; http://mipav.cit.nih.gov).
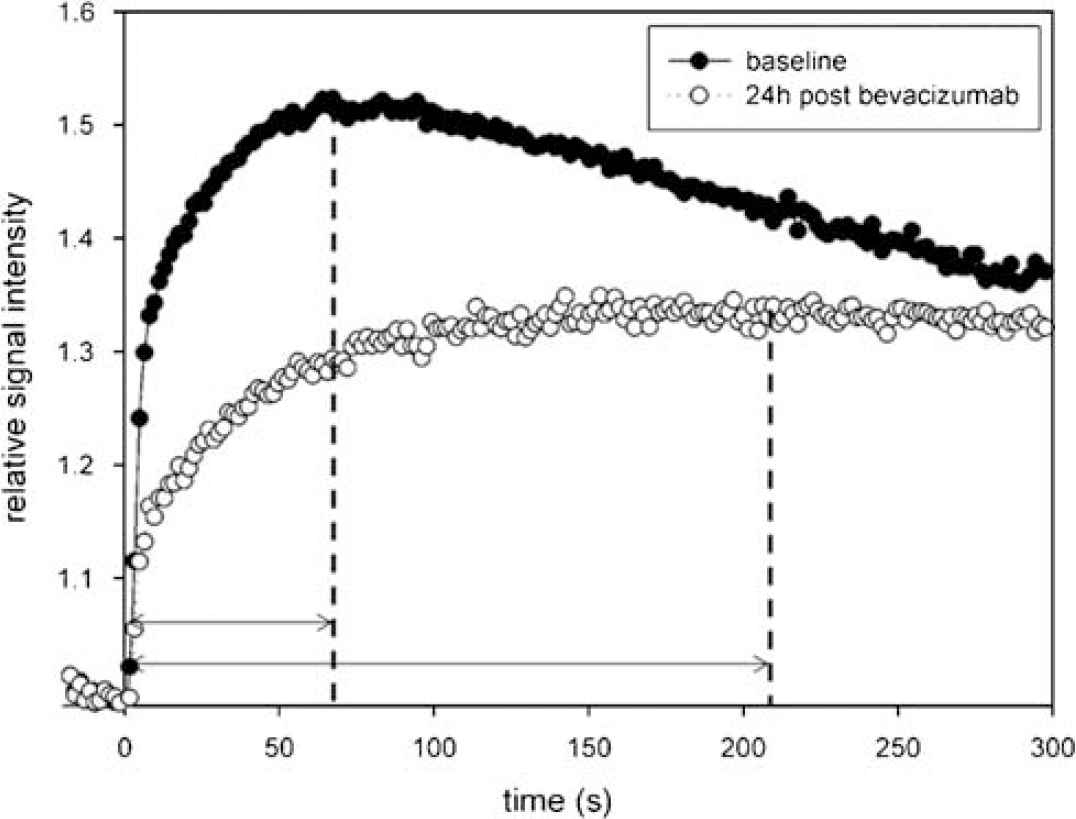
Effect of bevacizumab on gadodiamide permeability. The time to maximum gadodiamide enhancement is shown in an animal before (closed circles) and 24 h after (open circles) administration of bevacizumab (45 mg/kg, intravenously) to assess time-to-peak enhancement as a marker of tumor vascular permeability.
Statistics
Changes in rCBV and TTP enhancement were statistically analyzed throughout the study using repeated measurements of two-way analysis of variance with Tukey's post hoc statistical test. Relative cerebral blood volume and TTP enhancement are displayed as means±s.e.m. P > 0.05 was considered significant.
Results
Testing the Model
Intracerebral U87 xenografts appeared to be highly permeable to gadodiamide, but not to ferumoxytol (Figure 2). Owing to the high permeability of gadodiamide, the T2*-based CBV measurement was remarkably affected by contrast agent leakage, as indicated by the rising slope of the plateau following GBCAs (Figure 3A, between arrowheads). No leakage was detected at these early time points when the blood pool agent, ferumoxytol, was used (Figure 3B). The tumor region of interest time course and plateau differences between the two contrast agents reflect differences in tumor blood volume, permeability, and agent half-life, but are primarily because of the mixed T1/T2 weighting of the rapid MRI data acquisition sequences. The location of the plateau differs between Figures 3A and 3B because GBCAs have mainly T1 effects, whereas iron oxide nanoparticles have mainly T2 effects. All tumors showed enhancement with gadodiamide on T1-weighted scans peaking at 63±9.1 secs after the contrast bolus reached the brain. Ferumoxytol did not show enhancement on T1-weighted images, and BBB permeability was not measurable (Figure 2). On histological sections 24 h after ferumoxytol injection, U87 tumors showed only minimal iron uptake at the tumor periphery and necrotic areas (Figure 4).
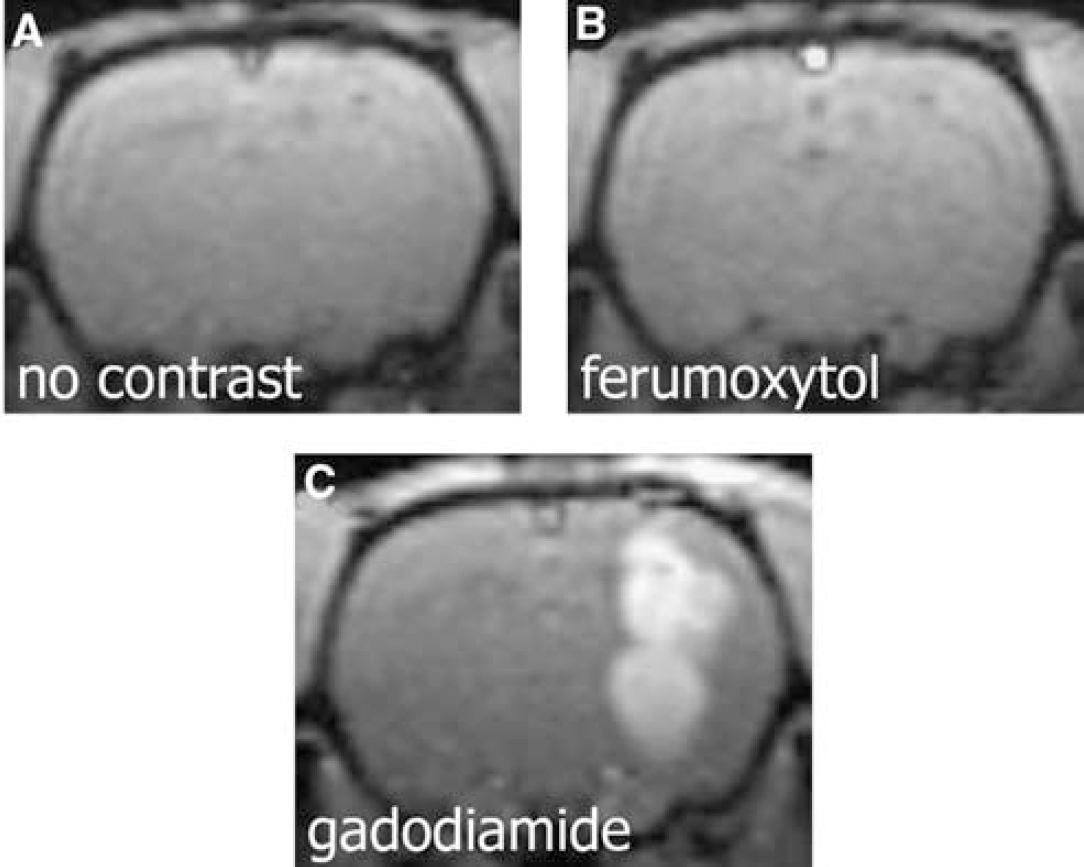
Comparison of ferumoxytol and gadodiamide enhancement in the rat U87 glioma xenographed model. (
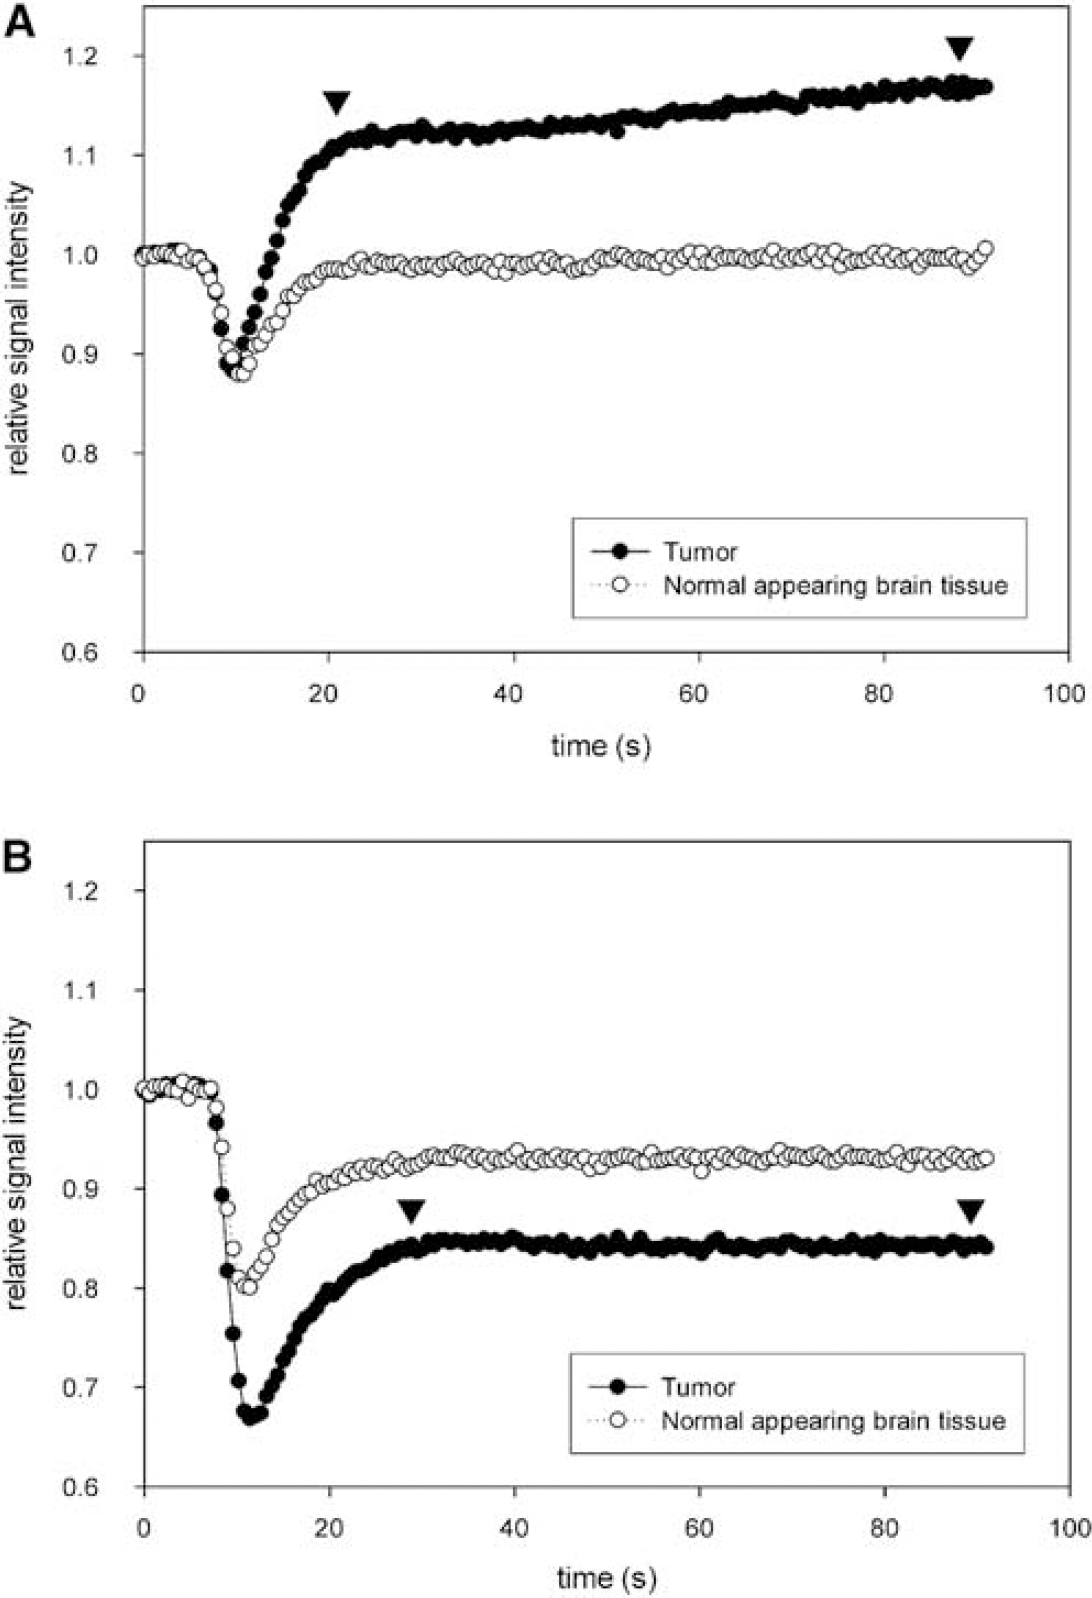
First-pass time-intensity curves of perfusion. (
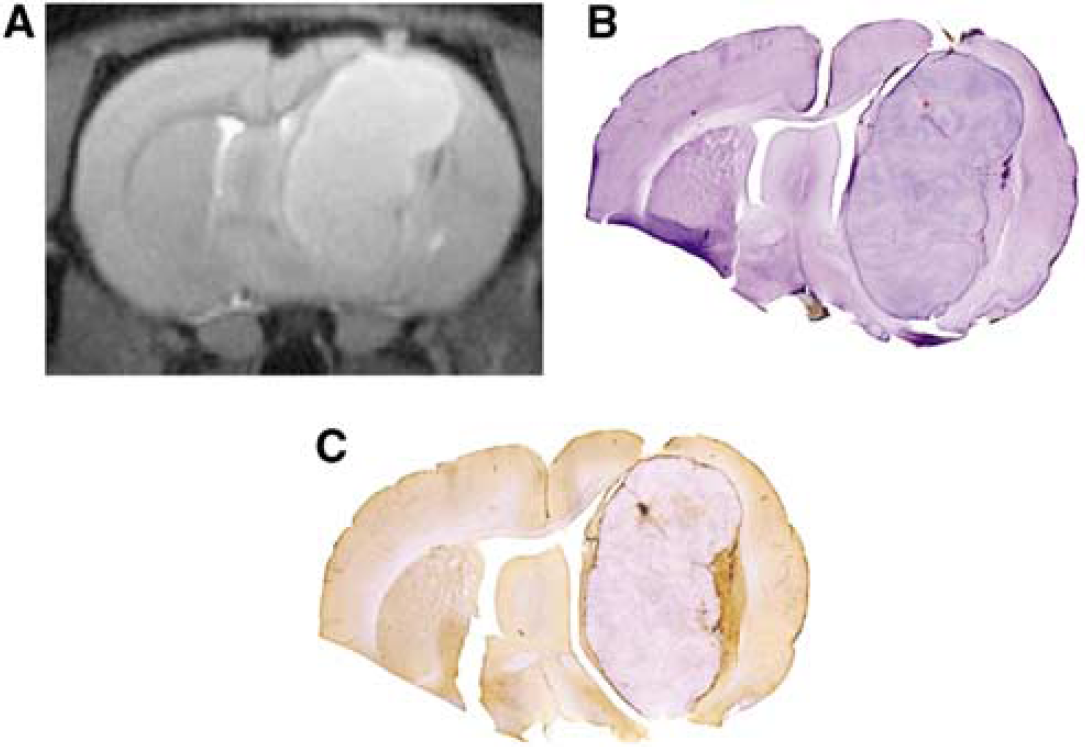
Minimal ferumoxytol uptake in the rat U87 glioma xenographed model. (
Ferumoxytol Perfusion for Measurement of Relative Cerebral Blood Volume
Relative cerebral blood volume was found to decrease in the three treatment groups, namely BEV, DEX 2, and DEX 12, but not in the CTR group (Figure 5A). In the BEV group, the initial rCBV (1.628±0.091) decreased significantly in all 24, 48, and 72 h time points to 1.214±0.061, 1.082±0.064, and 1.084±0.052, respectively. In the DEX 2 group, the initial rCBV of 2.130±0.180 showed significant decrease in the 48 and 72 h time points (1.755±0.040 and 1.725±0.098, respectively). In the DEX 12 group, the initial 1.800±0.072 rCBV value decreased significantly at all time points, to 1.380±0.029 at 24 h, 1.286±0.028 at 48 h, and 1.272±0.041 at 72 h. In the CTR group, there was no significant change found from the initial 1.927±0.363 rCBV value.
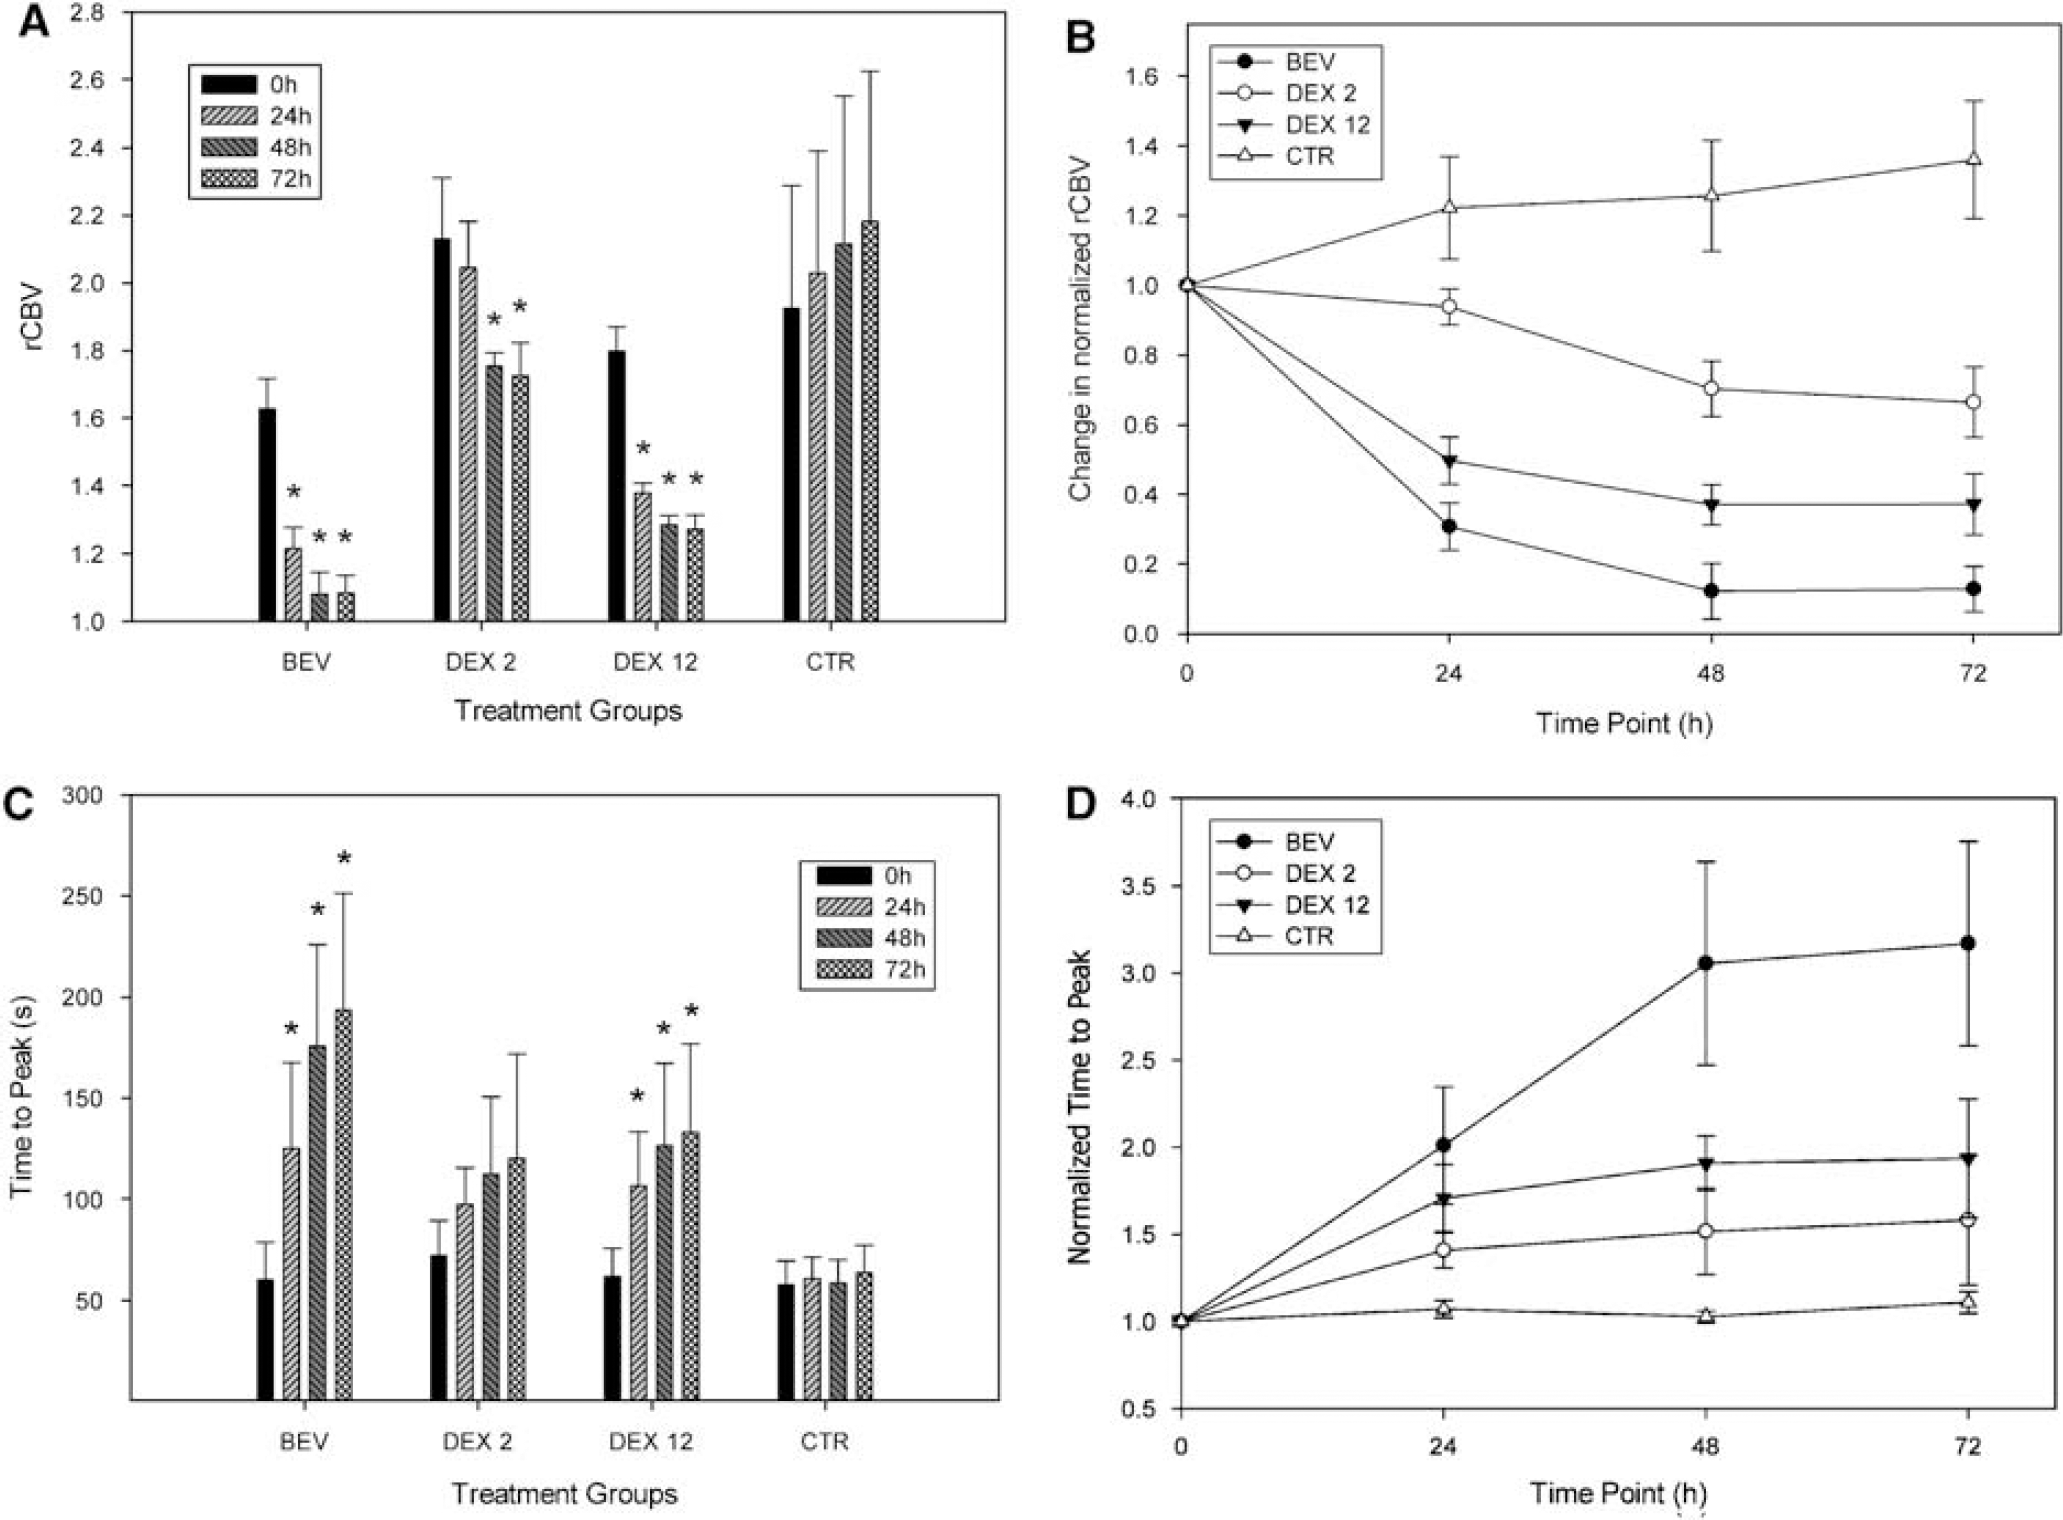
Dexamethasone and bevacizumab reduce rCBV and increase time-to-peak gadolinium enhancement. (
The normalized rCBV in BEV and DEX 12 groups appeared to be significantly decreased compared with the CTR and DEX 2 groups in all the three posttreatment time points (Figure 5B). The difference between the BEV and DEX 12 groups was not significant. The DEX 2 group became significantly different from the CTR group at the 48 and 72 h time points.
Time-to-Peak Gadodiamide Permeability
In the BEV group, the initial TTP of 60±19 secs increased significantly in all 24, 48, and 72 h posttreatment time points to 125±42, 176±50, and 194±58 secs, respectively (Figure 5C). Similarly, in the DEX 12 group, the initial 62±14 secs increased to 107±27, 127±41, and 133±44 secs, respectively. The baseline TTP of 72±17 secs in the DEX 2 group and the 58±12 secs in the control group has not shown significant changes throughout the study.
After normalizing the TTP data to the pretreatment value in each treatment group, there was no significant difference between the groups 24 h after the start of treatment (Figure 5D). At the 48 h time point in the BEV treatment group, the TTP increased significantly to 3.023±0.58 compared with the CTR (1.071±0.05) and also compared with the DEX 2 TTP (1.517±0.25), but was not significantly different from DEX 12 (1.907±0.16, P = 0.051). At 72 h posttreatment time point, the normalized TTP in the BEV group increased to 3.313±0.59, and was found to be significantly higher than that in all the three other groups (CTR: 1.110±0.06, DEX 2: 1.581±0.37, and DEX 12: 2.064±0.34). There were no other significant differences between groups.
Discussion
In this study, we tested dual-agent dynamic contrast MRI to assess early vascular changes after antiangiogenic therapy in comparison to corticosteroid treatment. Our purpose was to separate the measurements of vascular permeability and perfusion, thus minimizing the confounding effects that can cause substantial errors and potential misinterpretation of the rCBV results.
As rapid changes in tumor vascularity and permeability were expected, it was important to assess the two contrast agents during the same imaging session. First, using a T2*-based technique, the blood pool USPIO agent ferumoxytol provided information about the tumor vasculature. Second, DCE T1-weighted imaging was performed using GBCAs to monitor BBB leakage. This dual-agent technique could help in the early assessment of treatment response after antiangiogenic drugs, as it allows independent evaluation of tumor blood volume and vascular permeability in the same imaging session (Pike et al, 2006).
Ferumoxytol is the first USPIO nanoparticle imaging agent that can be given to human subjects as a rapid intravenous bolus without any known toxicity (Neuwelt et al, 2008). Ferumoxytol has a strong T2* relaxation time decreasing effect, allowing for relatively small injected volumes with lower flow rates. An additional benefit of ferumoxytol is that because of its large particle size (∼30nm compared with GBCA ∼1 nm) along with a complete carbohydrate coating, it does not extravasate rapidly to the interstitial space. Therefore, it could provide a more accurate assessment of the intravascular compartment. The slow extravasation of this nanoparticle alters the T1-weighted scans only at later time points after injection. In a study of ferumoxytol for brain tumor imaging in humans, the USPIO leaked slowly into the tumor, with maximum parenchymal enhancement observed at 24 h post-administration (Neuwelt et al, 2007), and enhancement could be seen even after 72 h. The fact that ferumoxytol stayed intravascularly in the early phase after bolus administration, in contrast to the GBCA, is essential for avoiding the confounding effects of tissue enhancement.
The U87 intracerebral xenograft model proved to be a suitable tumor type for this study, as it is highly vascular, but showed only minimal iron accumulation in the parenchyma after 24 h. This replicates our findings in earlier U87 tumor studies (Muldoon et al, 2005), but differs from other tumor models such as the LX-1 lung cancer brain metastasis model. Differences in USPIO imaging between tumor types may be because of the lower iron dose in this study, the different characteristics of ferumoxytol compared with other USPIO agents, or the difference in the magnetic field strength. Minimal iron uptake in the tumors made it possible to perform multiple ferumoxytol injections 24 h apart with only minimal confounding effect on the MR scans. Iron accumulation was only found in tumors with larger necrotic areas. The mechanism of late USPIO enhancement is not fully understood. Blood–brain barrier defects—similar to those affecting GBCA extravasation—seem to play an important role. However, the presence of inflammatory components and activity of the reticulo-endothelial system are also key factors (Manninger et al, 2005; Neuwelt et al, 2004, 2007; Varallyay et al, 2002; Stoll et al, 2008).
Corticosteroids are often used in central nervous system tumor patients. High-dose bolus therapy can be indicated in emergencies (e.g., spinal shock) to rapidly decrease edema to prevent irreversible tissue damage and regain neurologic functions. It remains unclear whether changes in CBV play an important role in the rapid clinical effects of glucocorticoids (Bastin et al, 2006; Leenders et al, 1985; Ostergaard et al, 1999). Our results show analogous effects of dexamethasone and BEV on both glioblastoma permeability and blood volume in the early phase of treatment, although the effects differ in magnitude at the tested doses. Both BEV and the higher-applied dose of dexamethasone (12 mg/kg/day) acted rapidly, decreasing the tumor rCBV and extending TTP within 24 h. Bevacizumab appeared to be significantly more effective than dexamethasone in the 2 mg/kg per day dose (which is an accepted animal dose, but would be too high for humans). The higher 12 mg/kg per day dose was used to test if increasing the steroid dose could reach the effects of BEV, although this high steroid dose would never be tolerated in humans.
The profound effect of BEV, and small-molecular-weight antiangiogenic drugs, as recently reported (Claes et al, 2008; Gambarota et al, 2008), on tumor vasculature call into question the use of contrast enhancement alone as an adequate measure of tumor response. It also calls into question whether BEV decreases chemotherapy delivered to brain tumors, as opposed to non-central nervous system tumors. The increased survival when BEV is used with chemotherapy in glioblastoma, both preclinically (Jahnke et al, 2008) and clinically (Wong and Brem, 2007), is likely due to both a ‘steroid-like effect’ and a cytotoxic effect. However, as pointed out by Jahnke et al (2008) in animals and Norden et al (2008) in patients, progression after BEV was often associated with a larger ratio of nonenhancing to enhancing tumor. Indeed, rodents given BEV and carboplatin died with larger tumor volumes than control animals, possibly because of the ‘steroid-like effect’ on tumor-associated vasogenic edema of bevacizumab.
Our current study analyzed the microvascular changes in early time points after BEV versus dexamethasone treatment. A single high dose of BEV resulted rCBV and TTP changes, which was significant in all posttreatment time points. The mechanism behind this rapid effect is still not fully understood. Further investigations (including long-term follow-up and survival analysis) will clarify the usefulness of USPIO perfusion and DCE with GBCAs in monitoring antiangiogenic treatment. There is an urgent need to find alternative imaging markers, as it is becoming increasingly clear that enhancement alone may no longer be adequate.
Footnotes
The studies were entirely funded by the Veterans Administration and the NIH research grants, with the ferumoxytol USPIO nanoparticles donated by AMAG pharmaceuticals. In light of the results from this study, and subsequent to completion of the manuscript, OHSU has received a sponsored research agreement from AMAG to conduct clinical trials of MRI with ferumoxytol. None of the authors has financial interest in this agent or in its developer AMAG.