
Abstract
Cerebral blood volume (CBV) measurement complements conventional magnetic resonance imaging (MRI) to indicate pathologies in the central nervous system (CNS). Dynamic susceptibility contrast (DSC) perfusion imaging is limited by low resolution and distortion. Steady-state (SS) imaging may provide higher resolution CBV maps but was not previously possible in patients. We tested the feasibility of clinical SS-CBV measurement using ferumoxytol, a nanoparticle blood pool contrast agent. SS-CBV measurement was analyzed at various ferumoxytol doses and compared with DSC-CBV using gadoteridol. Ninety nine two-day MRI studies were acquired in 65 patients with CNS pathologies. The SS-CBV maps showed improved contrast to noise ratios, decreased motion artifacts at increasing ferumoxytol doses. Relative CBV (rCBV) values obtained in the thalamus and tumor regions indicated good consistency between the DSC and SS techniques when the higher dose (510 mg) ferumoxytol was used. The SS-CBV maps are feasible using ferumoxytol in a clinical dose of 510 mg, providing higher resolution images with comparable rCBV values to the DSC technique. Physiologic imaging using nanoparticles will be beneficial in visualizing CNS pathologies with high vascularity that may or may not correspond with blood–brain barrier abnormalities.
INTRODUCTION
The use of gadolinium-based contrast agent (GBCA)-enhanced magnetic resonance imaging (MRI) to visualize blood–brain barrier (BBB) dysfunction has improved the diagnosis and treatment of human brain tumors and other central nervous system (CNS) lesions. Perfusion imaging with GBCA can be used to generate cerebral blood volume (CBV) maps that correlate with tissue vascularization, an important physiologic marker of neoplasms. 1 Cerebral blood volume is useful for tumor grading,1–4 assessment of glioma prognosis, 5 differentiation of active tumor and necrotic tissue,6,7 and stereotactic biopsy targeting. 8
Dynamic susceptibility-weighted contrast-enhanced (DSC) MRI, using rapid serial T2*-weighted images to track the first pass of a contrast bolus through the vasculature, is the most common perfusion imaging technique for relative CBV (rCBV) calculation. However, CBV maps generated via DSC experience low spatial resolution, and spatial distortion tends to corrupt CBV maps obtained with echo planar imaging (EPI) sequences.9,10 Additionally, CBV calculation using GBCA is affected by extravascular contrast leakage in patients with a compromised BBB, 11 making leakage-correction techniques necessary to isolate the effect of extravascular contrast. 12
Ultrasmall superparamagnetic iron oxide nanoparticles have the potential to overcome some of these inherent challenges in perfusion imaging.13,14 Ferumoxytol, an ultrasmall superparamagnetic iron oxide that is approved for iron replacement therapy, has shown promise as an magnetic resonance (MR) contrast agent in the CNS.14,15 Because of its large particle size, ferumoxytol acts as a blood pool agent on post injection MR sequences, with no significant leakage in areas of compromised BBB. 16
Steady-state (SS) imaging does not rely on the first pass of contrast through the brain, therefore, this technique can generate high-resolution CBV maps. 17 The SS-CBV has been applied in animal studies using ultrasmall superparamagnetic iron oxides to detect CBV changes caused by neuronal activation 18 and to test pharmacological CBV changes, 19 and to assess the microvascularity of various tumor models. 17 The high spatial resolution and distortion-free SS-CBV maps could help differentiate active tumor from necrotic tissue and better localize most malignant tumor regions, therefore increase accuracy of targeted biopsy, separate from BBB abnormalities. The SS-CBV mapping has not previously been evaluated in the clinical setting.
The aim of this study was to test the feasibility of SS-CBV measurement using a long circulating iron oxide nanoparticle, ferumoxytol at clinically applicable doses. For this purpose, SS-CBV measurement was analyzed at various ferumoxytol doses and compared with DSC-CBV using gadoteridol.
MATERIALS AND METHODS
PATIENTS
Sixty-five patients with brain neoplasms (
Patient characteristics
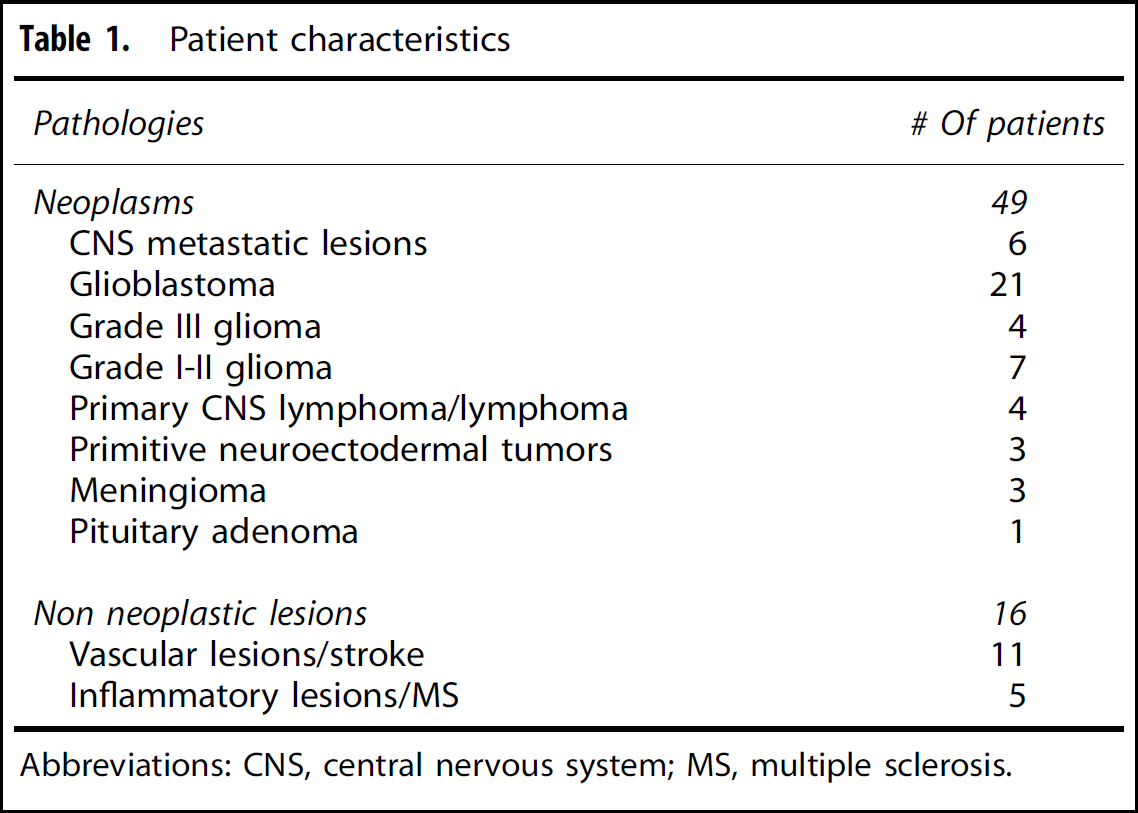
Abbreviations: CNS, central nervous system; MS, multiple sclerosis.
Magnetic Resonance Imaging
The imaging protocol consisted of cranial MRI scans on 2 consecutive days using a 3-tesla clinical scanner (TIM Trio, Siemens, Erlangen, Germany) with a 12 channel matrix receive-only head coil. Axial images were acquired in all sequences. For anatomic imaging, T2-weighted (T2w) turbo spin echo and T1-weighted (T1w) 3D magnetization prepared rapid gradient-echo (MPRAGE) sequences were acquired (Table 2). On day 1 DSC imaging, a gradient-echo, EPI sequence was used with a temporal resolution of 1.5 seconds using a short IV bolus of gadoteridol (ProHance, Bracco Diagnostic Inc., Princeton, NJ, USA) in a standard dose of 0.1 mmol/kg. Post gadoteridol MPRAGE T1w images were acquired to depict areas with BBB defects. For the purpose of SS imaging, the magnitude images of susceptibility weighted imaging (SWIMAG) were used, which is a highresolution, fully flow-compensated, spoiled gradient-echo sequence with substantial T2* weighting. These were acquired on the second day, when gadoteridol was normally completely eliminated from the system. The SWIMAG scans were acquired pre and post IV ferumoxytol (Feraheme; AMAG Pharmaceuticals Inc., Cambridge, MA, USA) injection in doses from 2 to 10.7 mg/kg: in protocol 2753 a constant of 2 mg/kg was used, whereas in protocol 1562 a total of 510 mg was given. Therefore, patients in the latter protocol received variable doses per body weight. Nine patients received somewhat lower doses (225 to 460 mg) in this protocol.
MR sequence parameters
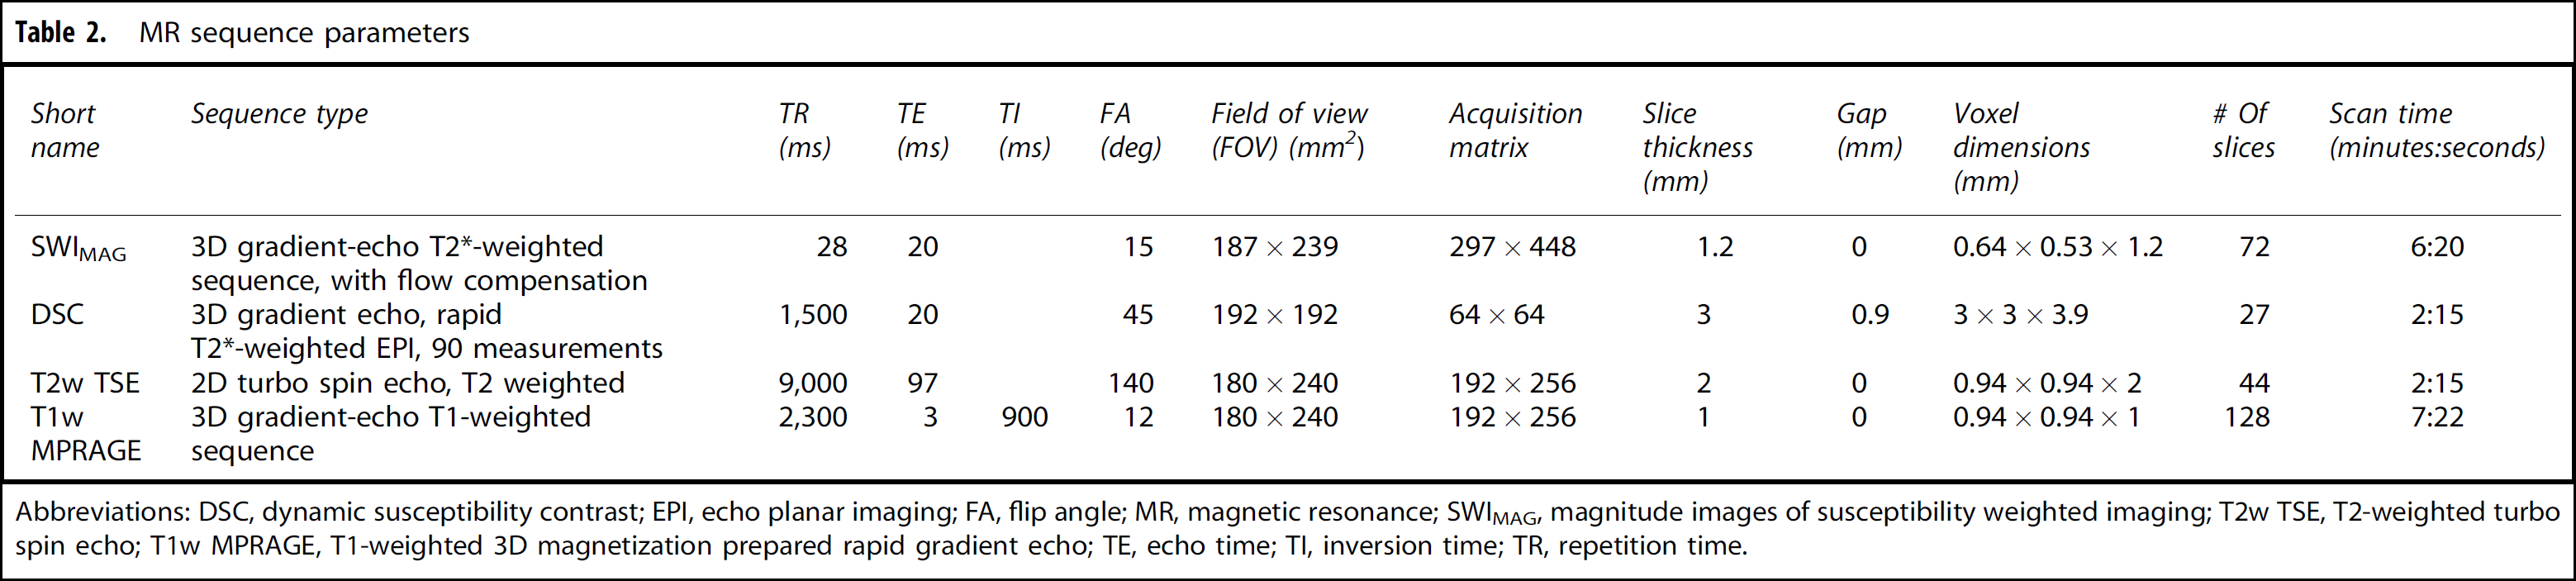
Abbreviations: DSC, dynamic susceptibility contrast; EPI, echo planar imaging; FA, flip angle; MR, magnetic resonance; SWIMAG, magnitude images of susceptibility weighted imaging; T2w TSE, T2-weighted turbo spin echo; T1w MPRAGE, T1-weighted 3D magnetization prepared rapid gradient echo; TE, echo time; TI, inversion time; TR, repetition time.
Image Processing
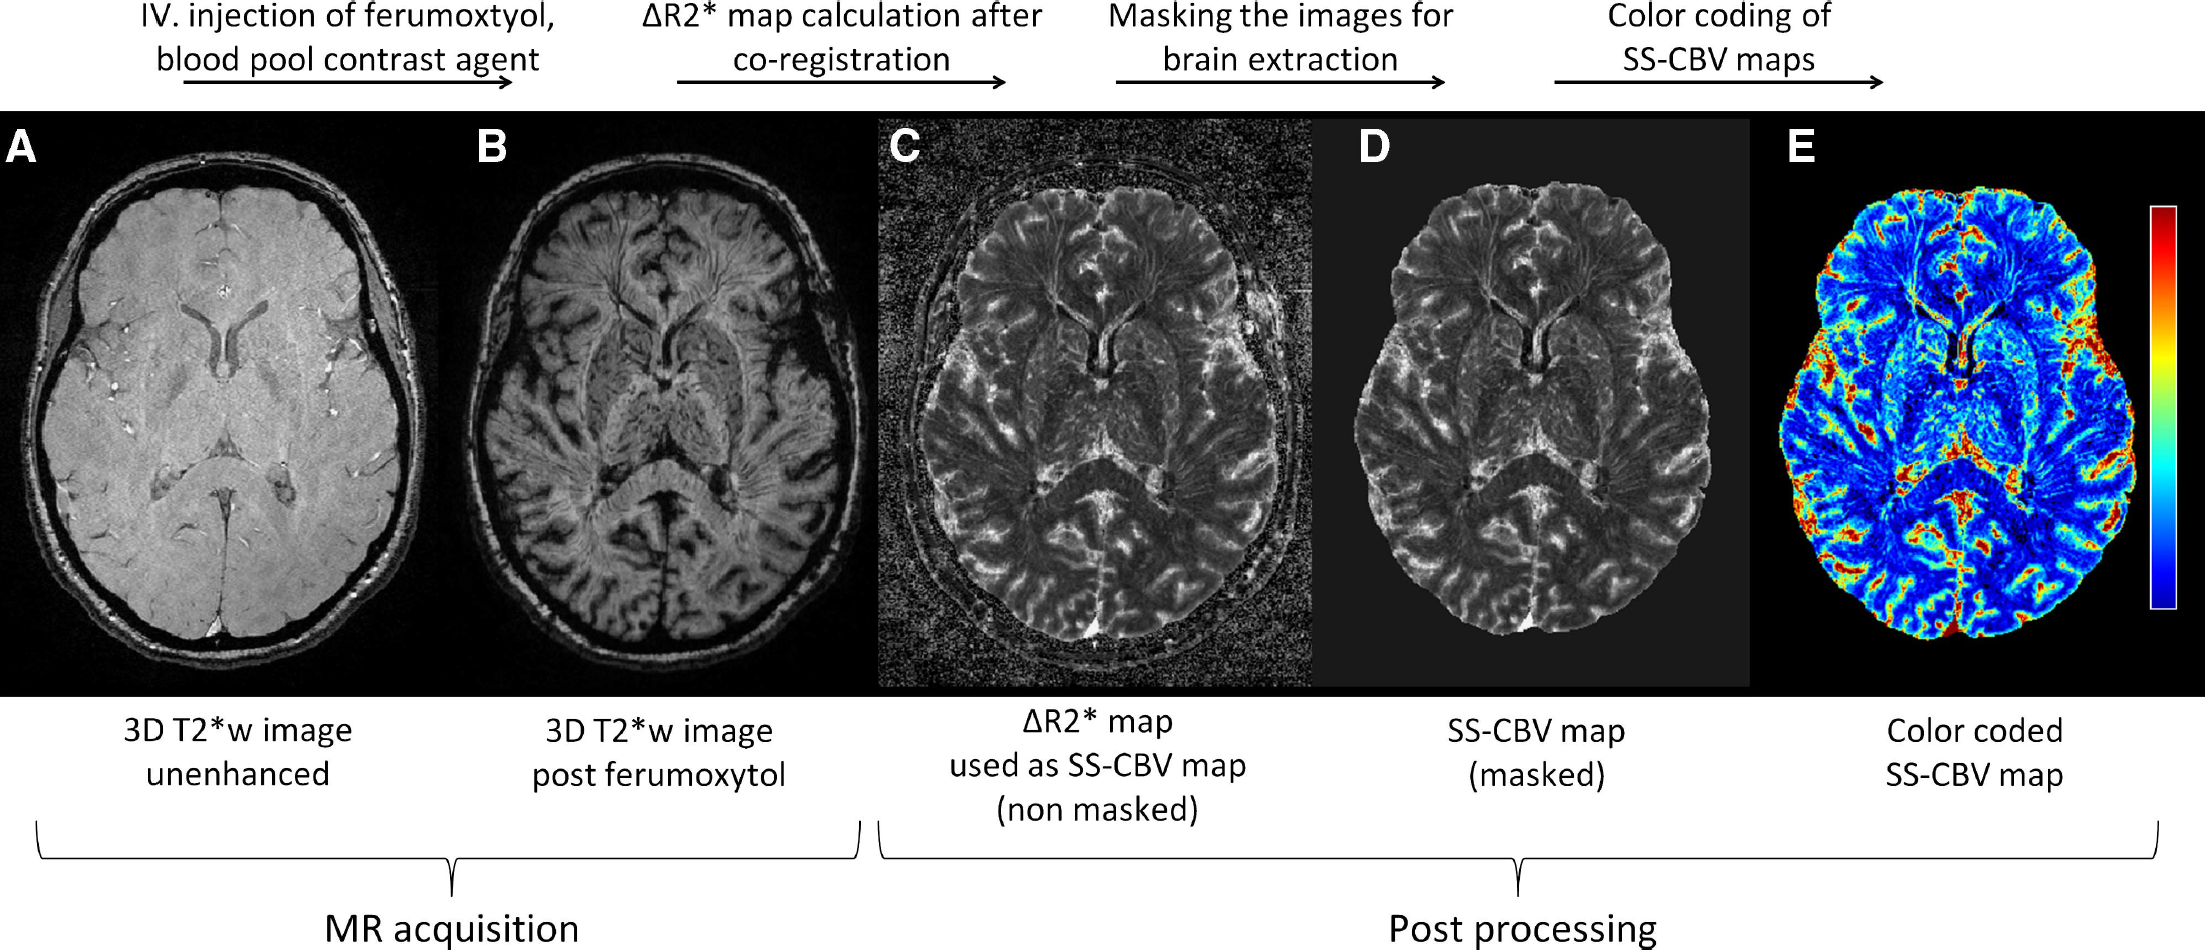
The process of creating SS-CBV maps. Using pre (
Image Analysis
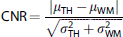
Contrast-to-noise ratio (CNR) was calculated as ‘conspicuity of the thalamus’ using the formula:
Statistical Analysis
Since there were patients contributing more than one MRI study in the evaluation, the correlation among multiple MRI studies within the same patient was taken into account in all analyses. A linear mixed model was to used to evaluate the change of motion-related artifacts of SS-CBV maps with ferumoxytol doses, with the patients grouped into five dose groups (ranging from 2 to >8 mg/kg in 2 mg/kg increments). A linear mixed model was also used to evaluate the dose dependency of CNR in SS-CBV maps with ferumoxytol doses as a continuous variable. The identification variable for each patient entered the linear mixed model as a random effect to account for the correlation among multiple MRI studies. The difference between SS-rCBV and DSC-rCBV in the thalamus at each dose group was similarly determined using a linear mixed effects model with identification variables for both patients and cases as random effects. Interclass correlation coefficient (ICC) was calculated to assess the consistency between SS-CBV and DSC-CBV techniques, using the rCBV values obtained in the tumoral VOIs. As a rule of thumb, ICC above 0.8 is considered as excellent, those in the range of 0.7 to 0.8 are considered as good, and those in the 0.5 to 0.7 range are considered as fair.
24
Data are displayed as least square mean (s.e.), if not indicated otherwise.
RESULTS
Visual Assessment of Steady-State Cerebral Blood Volume Maps
High-resolution SS-CBV maps could be obtained in all 99 MRI studies. Visually, the overall quality of SS-CBV maps increased with increasing ferumoxytol dose (Figure 2A) Artifacts related to patient motion were significantly less pronounced at higher ferumoxytol doses (Figure 2B).
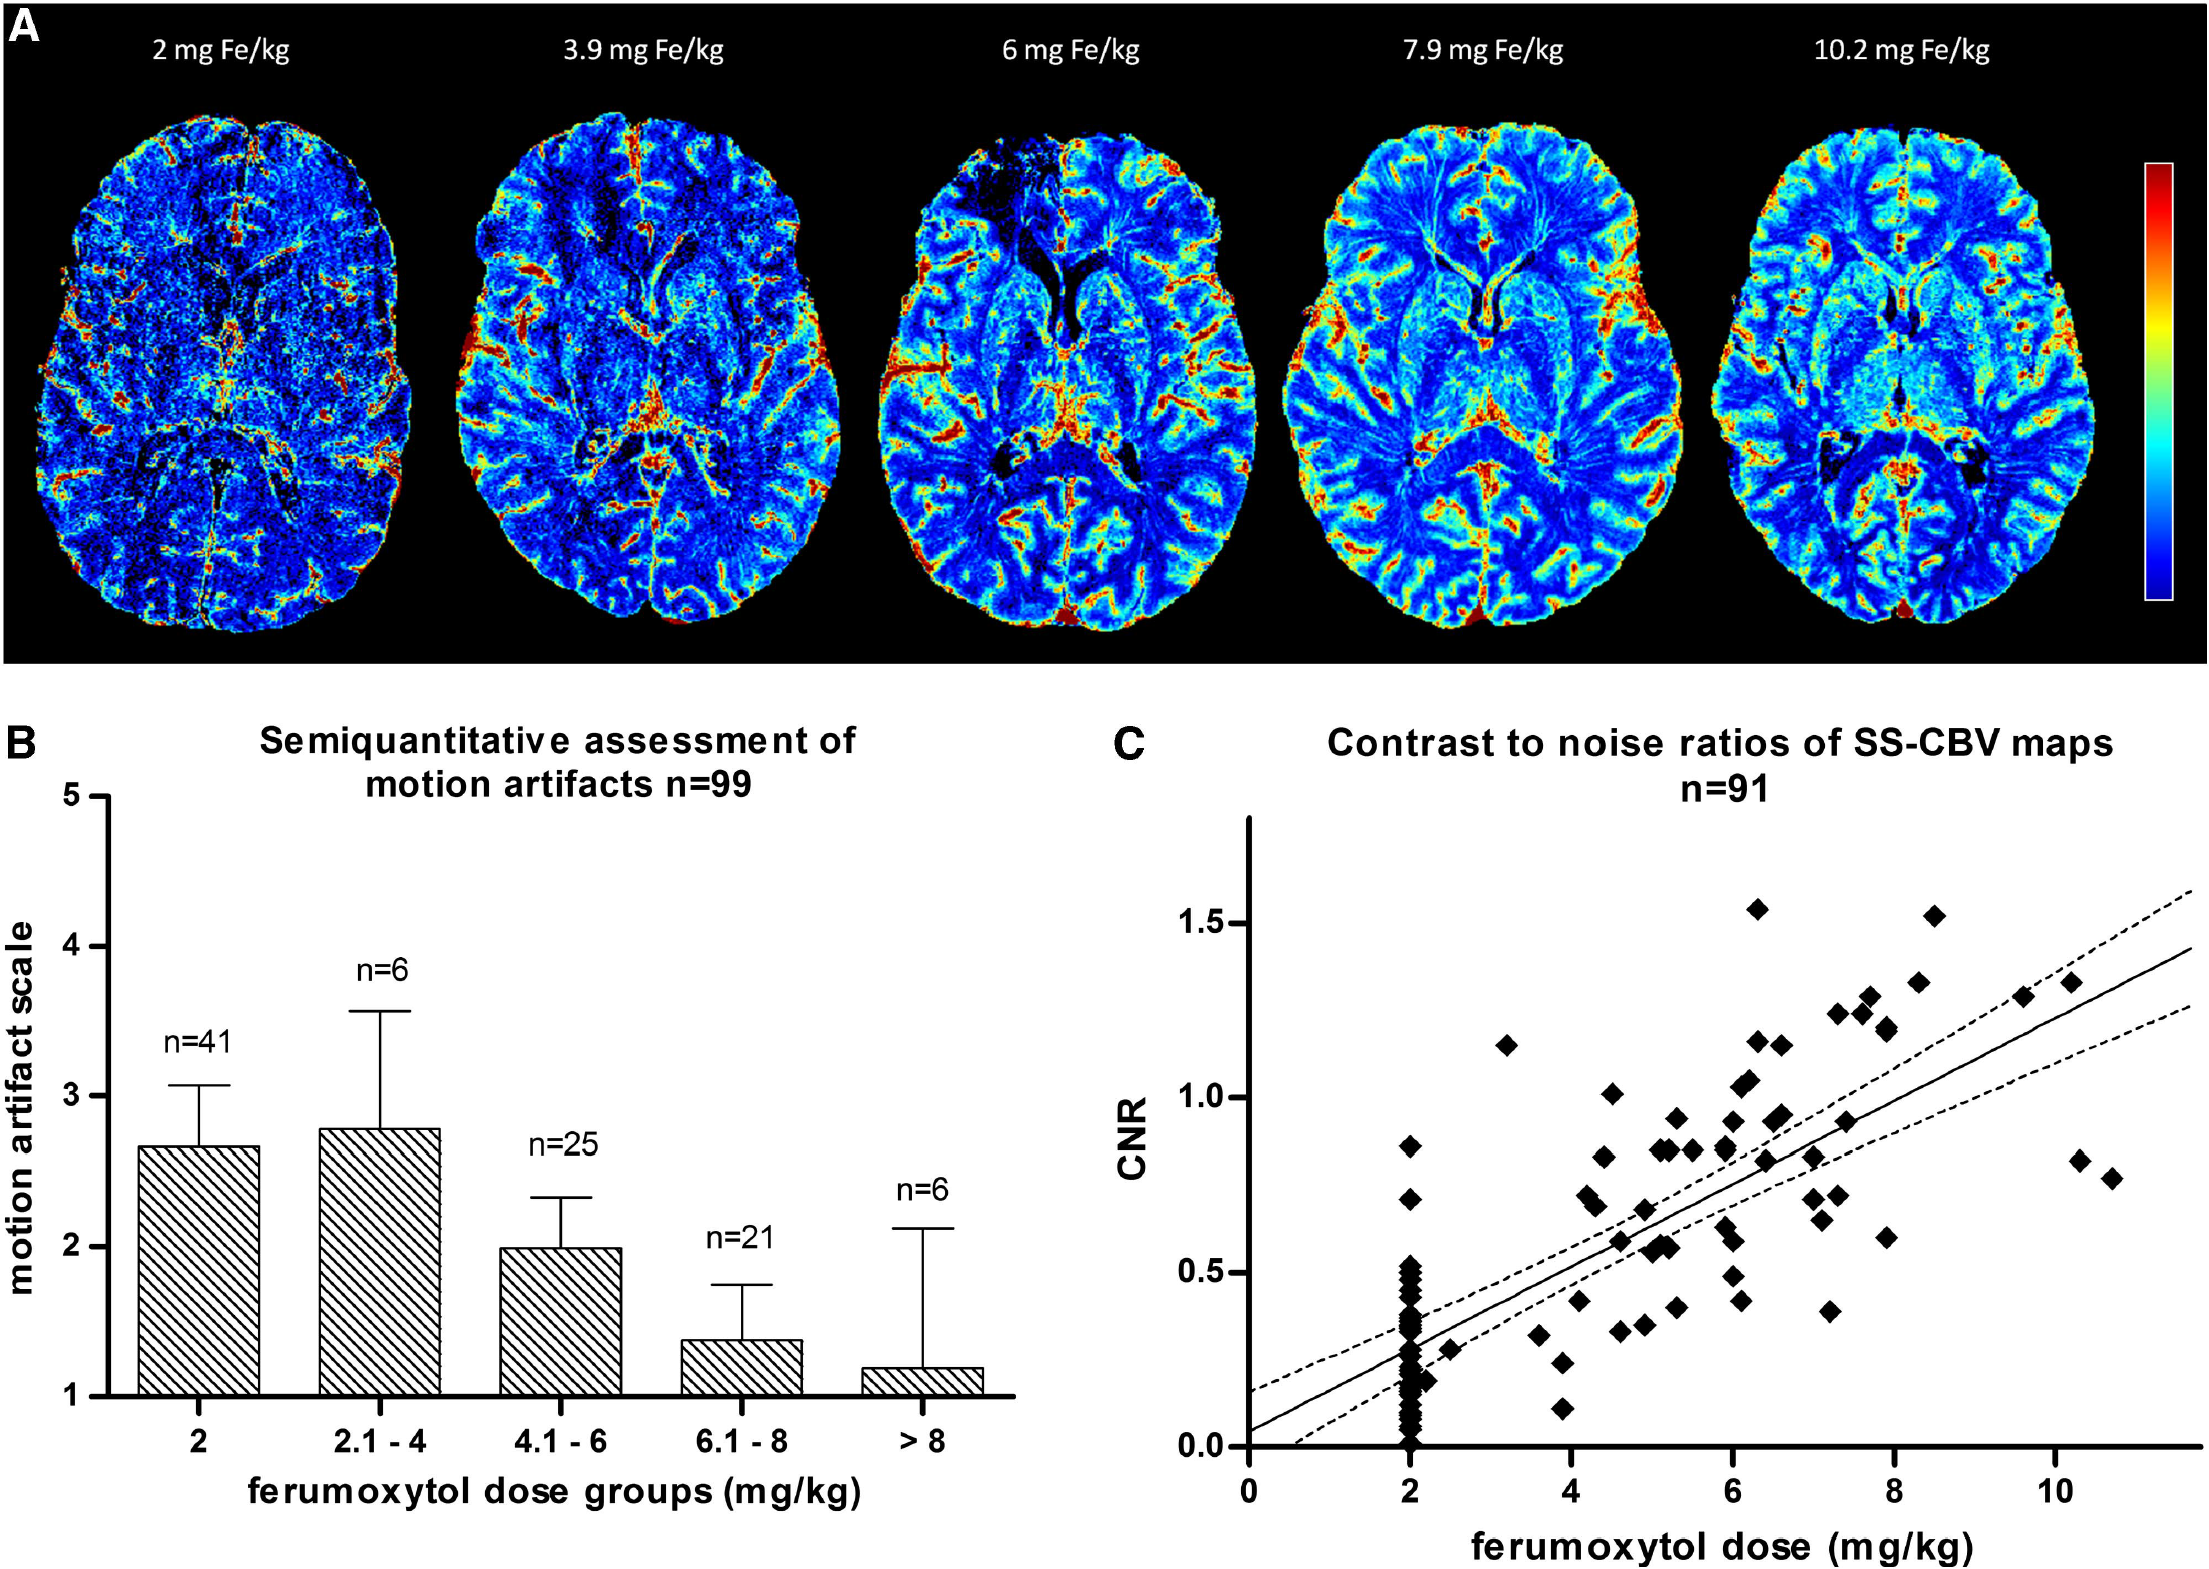
Impact of dose on SS-CBV map quality. Axial SS-CBV maps with five different doses (
Contrast-to-Noise Ratio Assessment of Steady-State Cerebral Blood Volume Maps
Quantitative assessment using CNR was performed in 91 studies, since thalamus was not imaged in 1 patient and in 7 patients (all in the 2-mg/kg group) pronounced imaging artifacts precluded analysis. The CNR of the SS-CBV maps showed a linear relationship with ferumoxytol dose, with a 0.12 (s.e. 0.01) increase for each mg/kg ferumoxytol dose increase (
Visual Assessment of Steady-State Cerebral Blood Volume and Dynamic Susceptibility Contrast Cerebral Blood Volume
Visually assessed, CBV parametric maps were comparable between the SS and DSC techniques (Figure 3). The CBV maps could be overlaid on anatomic 3D MPRAGE data sets with high accuracy. The high resolution of SS-CBV maps appeared beneficial in differentiating blood vessels from tissue with high CBV, and the ‘blooming’ effect was less pronounced around vascular structures than with the DSC technique. The DSC-CBV maps often suffered from distortions especially in the frontal region, coregistration of DSC-CBV maps to anatomic images had to be corrected in 11 cases. No remarkable distortion was found in the SS-CBV maps. Susceptibility artifacts were present with both techniques especially near air-filled bone compartments, as well as in areas near surgery-related bone defects. These artifacts were more pronounced on DSC-CBV maps.
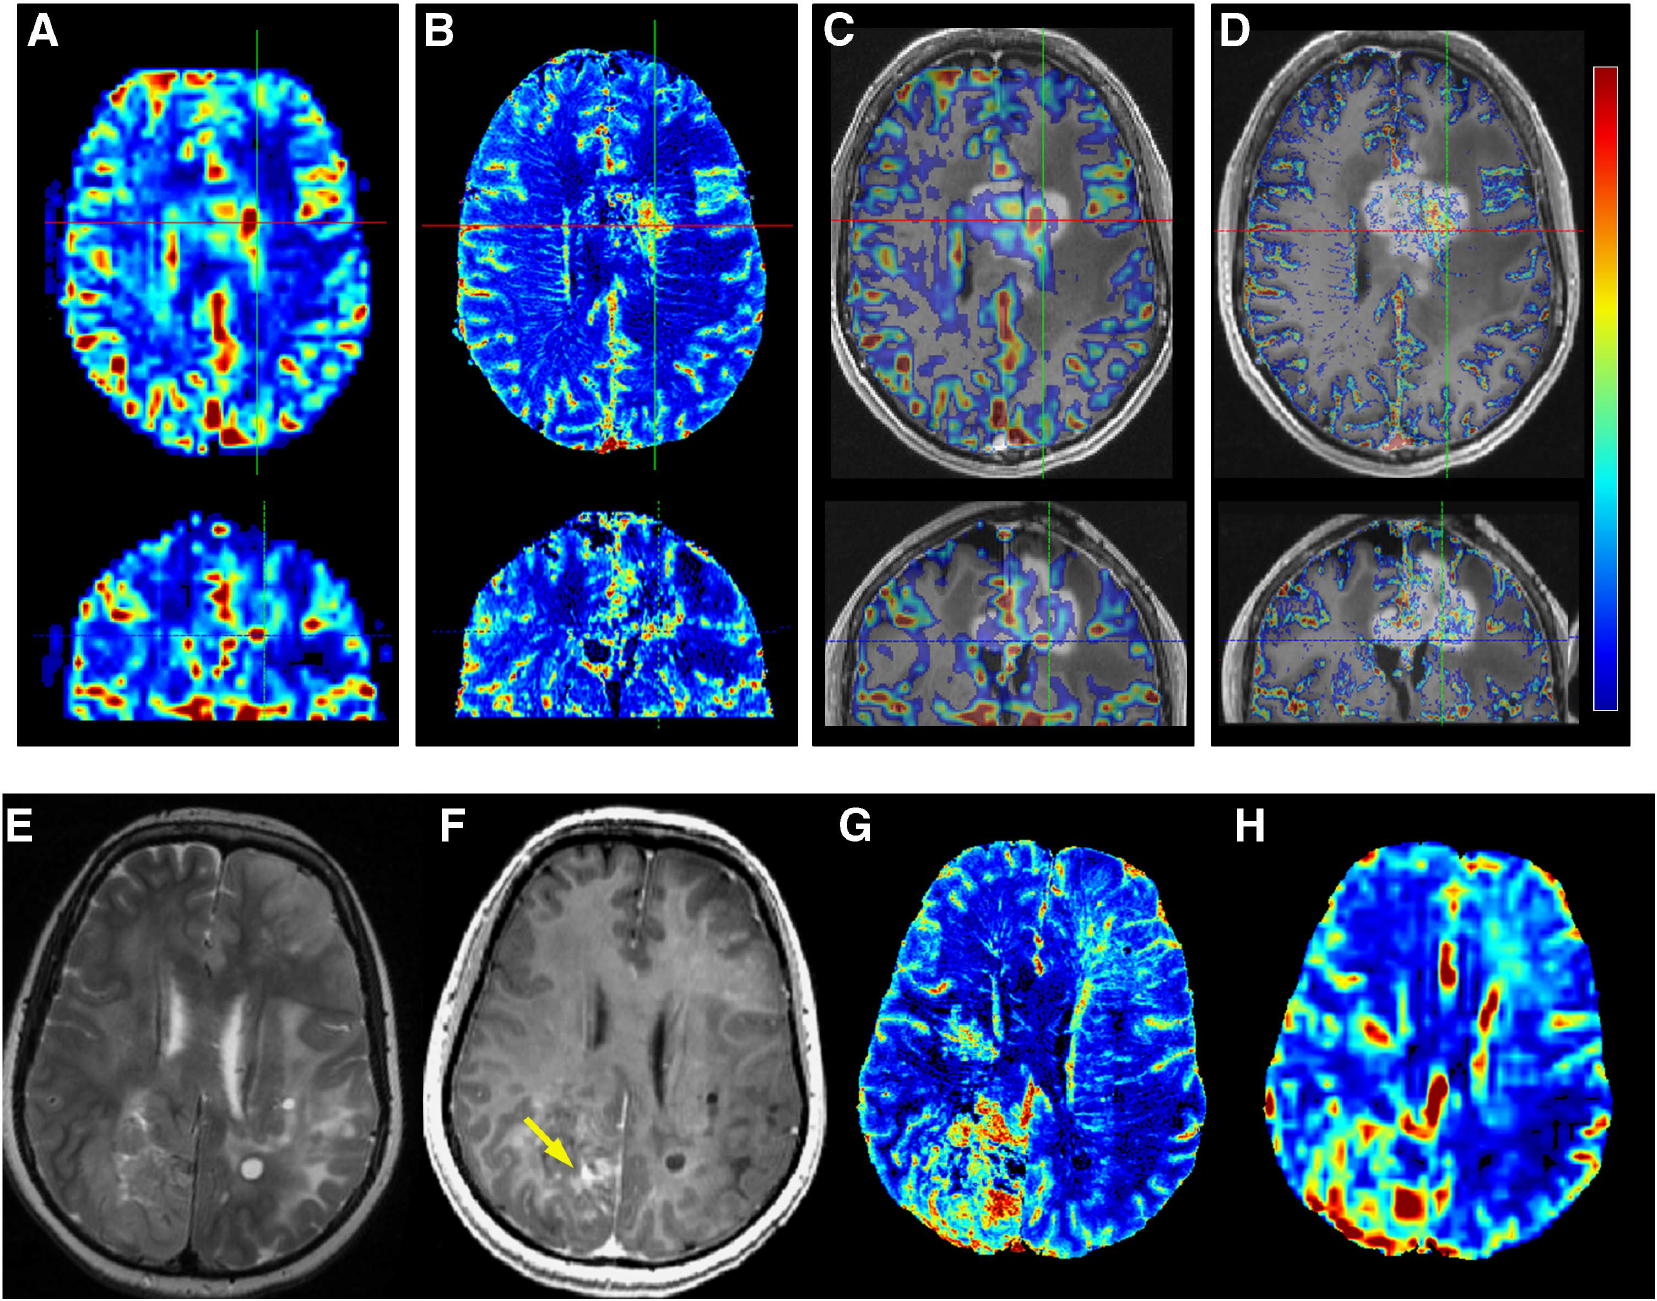
Comparison of SS-CBV and DSC-CBV maps. (
Comparison of Steady-State Relative Cerebral Blood Volume Versus Dynamic Susceptibility Contrast Relative Cerebral Blood Volume in the Thalamus
Figure 4 shows the least square mean of rCBV in the thalamus in various dose groups. The mean (s.e.) SS-rCBV was 1.42 (0.08) at the 2-mg/kg dose group, significantly lower (
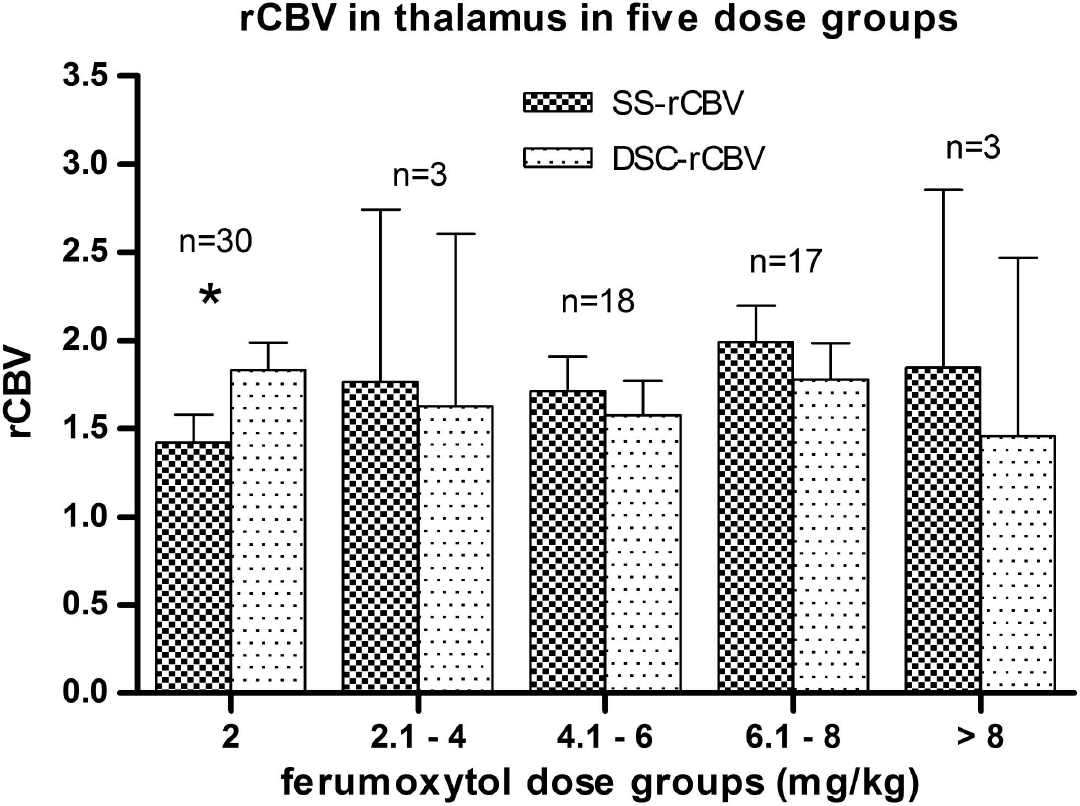
Comparison of relative cerebral blood volume (rCBV) values in the thalamus between steady-state (SS) (using various doses of ferumoxytol) and dynamic susceptibility contrast (DSC) (using the standard gadoteridol dose with leakage correction) techniques. In the lowest dose group (2 mg/kg), SS-rCBV shows a significantly lower value (*) compared with DSC-rCBV. In higher doses, no significant difference was found between the two techniques (error bars indicate the 95% confidence interval (CI)).
Comparison of Steady-State Relative Cerebral Blood Volume and Dynamic Susceptibility Contrast Relative Cerebral Blood Volume in the Tumor Regions
Gadoteridol-enhancing solid tumors were found in 57 of the 83 tumor cases. The overall ICC was 0.41, which indicates a poor consistency between the two methods. However when analyzing by subgroups (Figure 5), in the study (protocol 1562) in which higher doses of ferumoxytol were administered (510 mg in total), an excellent consistency was found between the two methods with ICC of 0.84. The ICC at the 2 mg/kg was only 0.29.
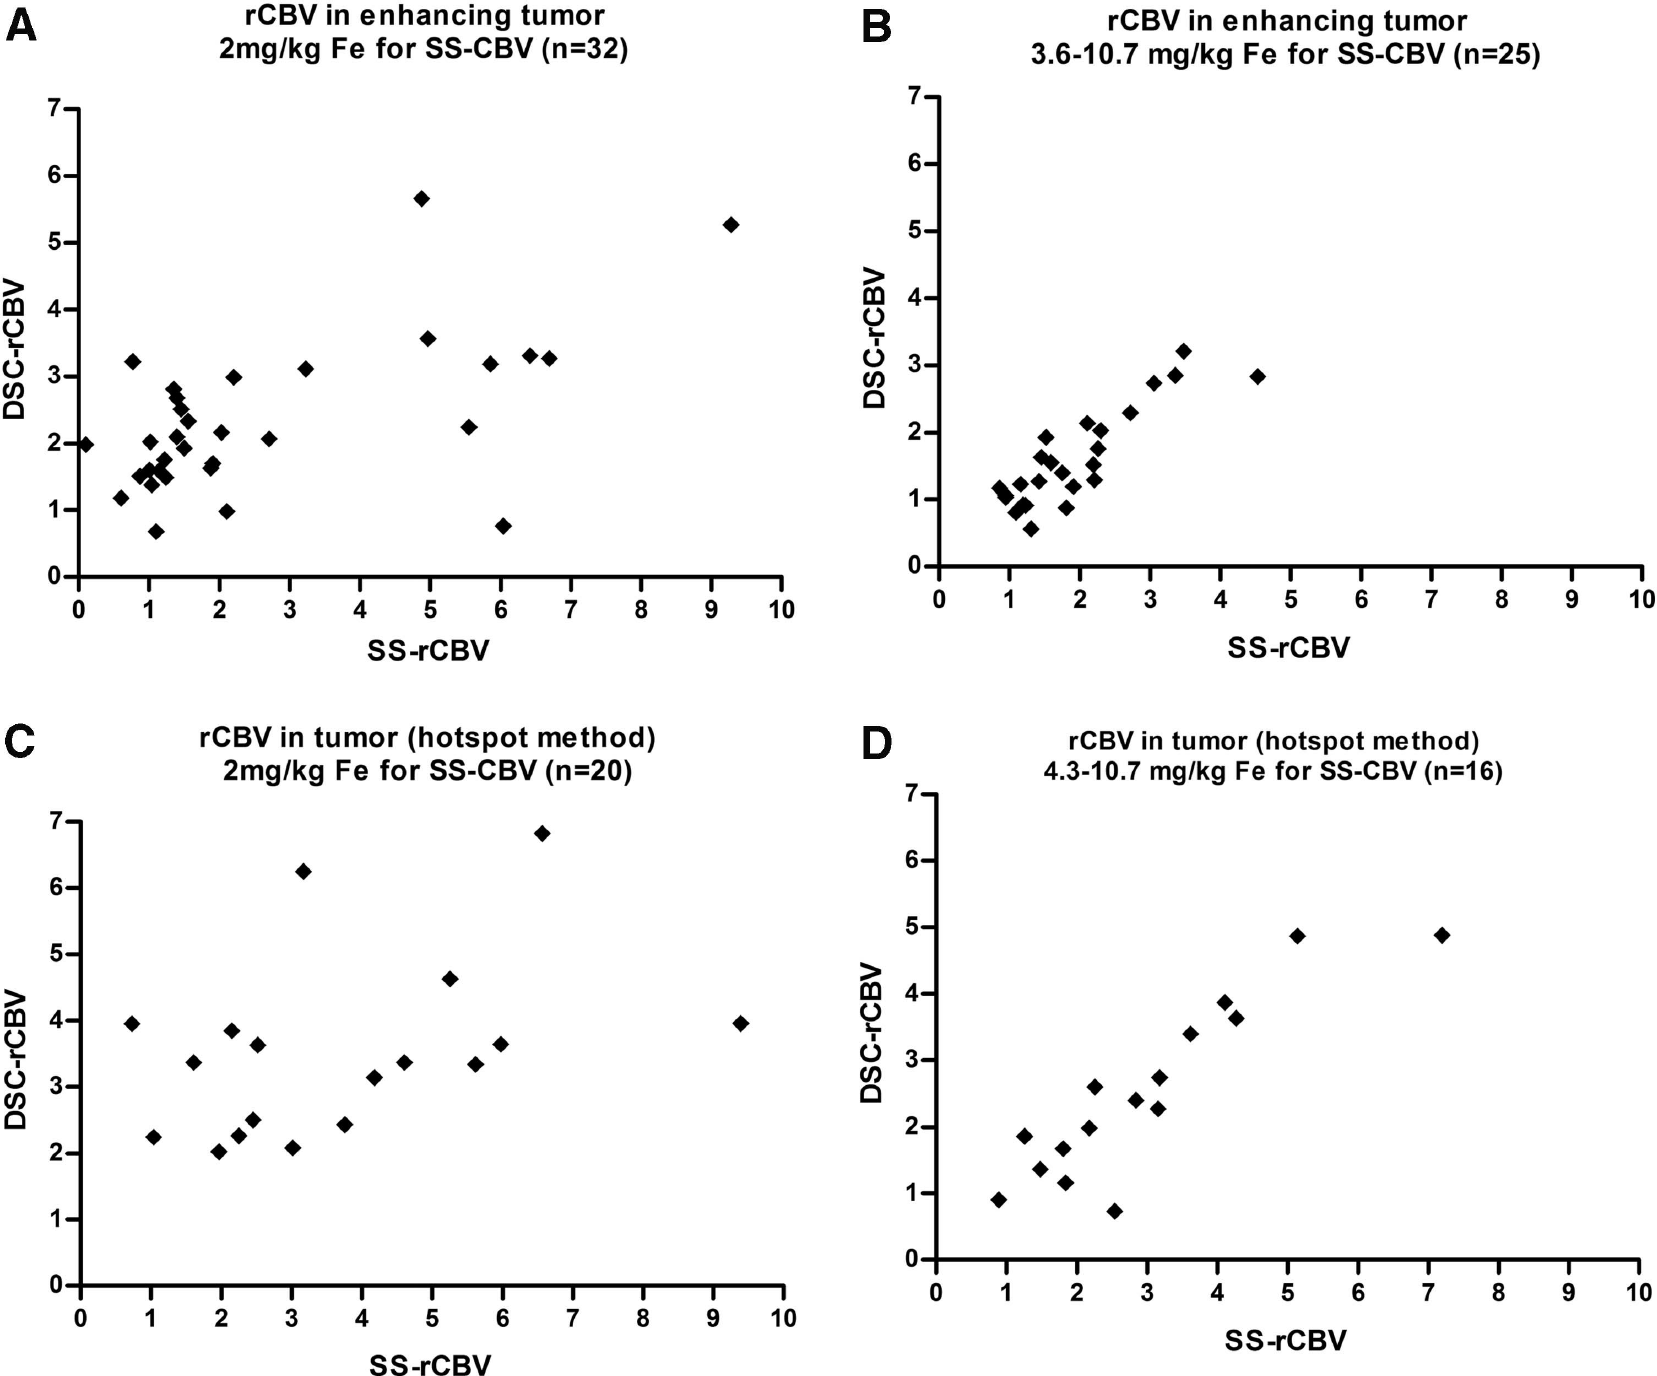
Comparison of SS-rCBV and DSC-rCBV values in the tumor volumes of interest (VOIs). Scatter plots show the rCBV values obtained using ferumoxytol-SS measurements compared with Gadoteridol-DSC. Both in the enhancing tumor and in the hot spots there was an excellent consistency between SS-rCBV and DSC-rCBV values in the studies in which higher doses were used (
In 36 studies, tumors showed visually higher CBV values on the parametric maps compared with the surrounding areas. In these cases, hotspot analysis was also performed. Within this subset of tumors, an overall poor consistency was found (ICC = 0.42) between the two techniques. At the 2-mg/kg ferumoxytol dose, the ICC was only 0.30 but in the higher dose group the two techniques showed an excellent consistency, with ICC of 0.88.
DISCUSSION
In this clinical study, we analyzed the feasibility of creating highresolution SS-CBV maps using ferumoxytol in a clinically applicable dose in patients with CNS pathologies.
The SS-CBV maps using iron oxide nanoparticles have been used in preclinical studies;17,20 however, no clinical studies have been reported, most likely due to the lack of a suitable blood pool imaging agent. Ferumoxytol is a long circulating iron oxide nanoparticle, which has been approved by the FDA for iron replacement therapy in a dose of 2 × 510 mg. Ferumoxytol can be used off label for MRI, including anatomic and dynamic imaging. We evaluated MR scans from two imaging protocols, 2753 and 1562, thus SS-CBV from ferumoxytol doses ranging from 2 to 10.7 mg/kg could be analyzed and compared. The quality of SS-CBV maps was evaluated in normal appearing brain regions regardless of pathology.
Generally, 2 mg/kg ferumoxytol was not satisfactory for SS imaging with poor SS-CBV map quality and low consistency with the DSC technique. Higher doses per body weight improved the image quality, which was detected visually and further supported by CNR values that increase linearly with dose. Overall, in patients with a 510-mg total dose the image quality and the consistency with DSC was good, and the motion-related artifacts were less pronounced.
Although there is no ‘gold standard’ for CBV estimation using MRI, the most common technique is DSC using a short bolus of 0.1 mmol/kg GBCA, and most of the clinical publications use this method. Therefore, this study compared SS-CBV maps obtained with ferumoxytol with leakage-corrected DSC-CBV maps obtained with gadoteridol. Previous publications have used ferumoxytol in DSC imaging,14,16,25 which has the advantage of strong T2* shortening, no substantial T1 effect during the first pass, and absence of contrast leakage. Nevertheless, the DSC technique with ferumoxytol has to be verified first, by comparing it with DSC with GBCA in a larger patient population.
For comparison of rCBV values, we described VOIs in the white matter, the tumor area, and in the thalamus. Thalamus was chosen to compare values in normal appearing gray matter, and its rCBV has been estimated with various techniques. 21 Technically, the thalamus was not affected by distortions or susceptibility artifacts of bone or air-filled structures. The rCBV in the thalamus with both SS and DSC techniques was somewhat lower than in the literature, 21 probably because we excluded larger vessels from the VOIs.
Measuring rCBV values in the enhancing tumor areas versus hot spots can potentially give different results between various techniques; 4 therefore, we analyzed two different VOI selection methods. The first technique used gadoteridol-enhanced T1w MPRAGE scans to describe contrast-enhancing regions. Intense enhancing, obviously necrotic regions, or linear enhancement along the resection margin were often found, these were not included in the VOI. Still, in many cases enhancing areas did not represent high CBV values. The second method was the so-called ‘hotspot’ method. Similarly to clinical practice, we performed hotspot analysis in cases in which there were visually higher CBV areas on the parametric maps (potentially representing the most malignant tumor regions) compared with the surrounding areas. This also allowed us to test the consistency of SS-CBV and DSC-CBV at higher values. Both in the enhancing area and in the tumor hot spots SS-rCBV values showed an excellent consistency with DSC-rCBV in patients receiving 510 mg ferumoxytol, and poor consistency in patients given 2 mg/kg.
Although both SS and DSC techniques are based on changes in transverse relaxation rate constants and the assumption of a linear relationship with contrast agent concentration, differences in individual rCBV values between DSC and SS methods could arise from several factors: (1) The DSC technique, which generally uses gradient-echo EPI sequences, is known to accentuate large vessels caused by the so-called ‘blooming artifact’ . 26 This is less pronounced on SS-CBV maps, because of the high spatial resolution of the source SWIMAG images. 27 Using spin-echo EPI sequences for DSC perfusion imaging would also decrease the susceptibility thus the accentuation of large vessels, 4 but this is not widely used due to its lower overall sensitivity. (2) Coregistration of DSC-CBV maps to the anatomic images cannot be performed with high accuracy due to the low spatial resolution and the inherent distortion of EPI sequences. B0 field map acquisition along with a mathematical correction algorithm could compensate for this distortion, 28 this is however rarely used in clinical practice. Determining the quality of co-registration of individual images was crucial to this study. We applied a method by overlaying co-registered images in red-cyan to effectively screen poorly coregistered images. (3) Motion artifacts affect the two scan types differently. Patient motion during DSC acquisition can usually be compensated for offline by a ‘motion correction’ algorithm while this kind of postacquisition correction is not possible in the SS technique. Thus, the longer MR acquisition for SS-CBV must be virtually free of patient motion, particularly at lower ferumoxytol doses. (4) Areas with contrast agent leakage could be compromised in DSC technique using standard GBCAs.
The CBV is usually underestimated due to the T1 relaxation time shortening effect of interstitial contrast media. Nevertheless, overestimation could also occur in highly vascular tumor regions with strong T2* effects, where extravasation further decreases the signal intensity. There are leakage correction methods for both underestimation and overestimation, which may be used successfully in most cases. Steady-state imaging can only be performed with a contrast agent that is virtually free of vascular leakage during the observed period of time.
The high spatial resolution of SS-CBV maps could make this technique clinically relevant. Albeit DSC imaging can additionally provide various dynamic perfusion measures besides CBV, such as mean transit time, blood flow, time to peak, these are rarely used in tumor perfusion assessment. The good consistency between the two techniques indicates that SS-CBV may serve the same purpose as DSC-CBV, including differential diagnosis, tumor grading, and evaluation of early treatment responses in longitudinal studies. Furthermore, potential uses of SS-CBV include stereotactic biopsy planning using fusion images with MPRAGE, which may or may not correlate with BBB abnormality.
DISCLOSURE/CONFLICT OF INTEREST
Dr Neuwelt's studies involving ferumoxytol were entirely funded by Veterans Administration and NIH research grants, with the ferumoxytol USPIO nanoparticles partially donated by AMAG pharmaceuticals. None of the authors has financial interest in this agent or in its developer AMAG.
Footnotes
ACKNOWLEDGEMENTS
The authors thank Aliana Culp for helping with the manuscript preparation.