
Abstract
This study investigates 5-hydroxytryptamine 4 (5-HT4) receptor binding in the minipig brain with positron emission tomography (PET), tissue homogenate-binding assays, and autoradiography in vitro. The cerebral uptake and binding of the novel 5-HT4 receptor radioligand [11C]SB207145 in vivo was modelled and the outcome compared with postmortem receptor binding. Different models for quantification of [11C]SB207145 binding were evaluated: One-tissue and two-tissue compartment kinetic modelling, Logan arterial input, and three different reference tissue models. We report that the pig autoradiographic 5-HT4 receptor distribution resembles the human 5-HT4 receptor distribution with the highest binding in the striatum and no detectable binding in the cerebellum. We found that in the minipig brain [11C]SB207145 follows one-tissue compartment kinetics, and the simplified reference tissue model provides stable and precise estimates of the binding potential in all regions. The binding potentials calculated for striatum, midbrain, and cortex from the PET data were highly correlated with 5-HT4 receptor concentrations determined in brain homogenates from the same regions, except for hippocampus where PET-measurements significantly underestimate the 5-HT4 receptor binding, probably because of partial volume effects. This study validates the use of [11C]SB207145 as a promising PET radioligand for in vivo brain imaging of the 5-HT4 receptor in humans.
Keywords
Introduction
The 5-hydroxytryptamine 4 (5-HT4) receptor is a G-protein-coupled receptor positively linked to adenylate cyclase activity. Its endogenous ligand is serotonin (5-hydroxytryptamine, 5-HT). The receptor has been detected in the brain of several mammalian species, including rat, mouse, pig, monkey, and human, with the highest 5-HT4 receptor densities in the hippocampus and striatum. Several studies have suggested involvement of the 5-HT4 receptor in cognitive processes (for review see Bockaert et al, 2004). Specifically, administration of the partial 5-HT4 receptor agonist RS-67333 improves acquisition of place and object recognition and accelerates learning in the Morris water maze task by rats (Lamirault and Simon, 2001; Lelong et al, 2001). Furthermore, in an olfactory associative discrimination task in the rat RS-67333 prevents memory deficits induced by the 5-HT4 receptor antagonist RS-67532 (Marchetti et al, 2000). 5-HT4 agonists have also been shown to reverse memory deficits induced by the muscarinic antagonists atropine and scopolamine (Fontana et al, 1997; Matsumoto et al, 2001). In 5-HT4 receptor knockout male mice, stress-induced anxiety-like behaviour is enhanced (Compan et al, 2004), and using the 5-HT4 receptor knockout mice it has further been shown that 5-HT4 receptors mediate a tonic and positive influence on the activity of dorsal raphe serotonergic neurons (Conductier et al, 2006). On a molecular level, 5-HT4 receptor stimulation cause acetylcholine release in the frontal cortex and the hippocampus (Consolo et al, 1994; Bianchi et al, 2002), and dopamine release in striatum (Steward et al, 1996).
On the basis of these findings, it can be anticipated that in vivo brain imaging of the 5-HT4 receptor distribution and density would be an important tool to study the 5-HT4 receptor in normal human learning and memory as well as in animal models of neurologic and psychiatric diseases. Recently, a novel 5-HT4 positron emission tomography (PET) ligand—[11C]SB207145—for studies in vivo by PET imaging was developed (Gee et al, 2008). This innovation should potentially enable quantification of radioligand binding in vivo, as well as repeated examinations of the same individual over time.
The use of the pig (Sus scrofus) in neuroscience and also more specifically for PET brain studies is increasing (for review see Lind et al, 2007). The pig brain is the size of a macaque brain, and it is gyrencephalic. Furthermore, animal facilities fulfilling all the pig's needs are more easily established and cheaper to run than primate facilities. The 5-HT4 receptor is present in high density in pig caudate nucleus homogenates, and several 5-HT4 compounds have similar affinities to pig and human 5-HT4 receptors (Schiavi et al, 1994). This suggests a high similarity between 5-HT4 receptors from pig and human tissue, although the regional brain distribution of 5-HT4 receptors in the pig brain has not hitherto been described.
This is the first paper to present an evaluation of in vivo imaging data obtained in the Göttingen minipig with the radioligand [11C]SB207145 and PET, where different quantification methods are assessed. The outcome of the quantified imaging data are compared with tissue homogenate-binding studies where Bmax and Kd are determined in six brain regions.
Materials and methods
Experimental Animals
Eleven Göttingen minipig adult (> 1 year) boars (Ellegaard, Denmark) weighing between 20 and 35 kg were used. The pigs were housed as pairs, fed twice a day with standard minipig pellets (no. 811584, Ellegaard, DK), and had unlimited access to water. Circadian rhythm was ensured by electrical lighting from 0630 to 1930 hours, with gradual increase and decrease more than 30 mins. To minimize stress, animals were provided with straw bedding and environmental enrichment, in the form of metal chains and plastic balls.
The pigs were deprived of food 12 h before the PET/CT scan. On the day of the scan, the pigs were sedated with an i.m. injection of midazolam (0.1 mg/kg). After 10 to 15 mins, full anaesthesia was induced with 0.15 mL/kg i.m. of a mixture of midazolam and Zoletil 50 vet. (Virbac Animal Health, France: 125 mg tiletamin and 125 mg zolazepam in a total volume of 8 mL midazolam (1 mg/mL)), and a catheter was installed in an ear vein. Thereafter, anaesthesia was maintained with propofol i.v. (1 mL/kg/h). The pig was endotracheally intubated and ventilated (250 mL, frequency 10 to 12 per minute) during the entire experiment. Furthermore, the animal was placed on a heating carpet and covered by a blanket and sheets to maintain body temperature. Catheters (Ultimum, 5F, St Jude Medical) were surgically inserted in a femoral artery and vein.
Infusions of isotonic saline and glucose were administered i.v. throughout the experiment. Body temperature and physiologic functions (blood pressure, blood oxygenation, and heart rate) were monitored continuously. Haematocrit, blood glucose, and acid—base parameters (pH, pCO2, pO2, H2CO3, and O2 saturation) were measured in whole-blood samples on an ABL system (625, Radiometer, Denmark) with regular intervals. Deviations from normal values were corrected by appropriate procedures (e.g., changes in ventilation parameters and/or changes in infusion rates).
After the PET scanning session, the pigs were administered analgesics (carprofen dose 0.1 mL/kg) and antibiotics (streptocillin 0.08 mL/kg) and allowed to recover. On the day of killing, the pigs were again sedated with an i.m. injection of midazolam (0.1 mg/kg). After 10 to 15 mins, full anaesthesia was induced with the same mixture of midazolam and Zoletil 50 vet as described above. Pentobarbital (20 mL) was injected i.v. to induce immediate cardiac arrest, and the brains were removed as quickly as possible (< 15 mins). All animal experiments were performed in accordance with the European Communities Council Resolves of 24 November 1986 (86/609/ECC) and approved by the Danish Animal Research Inspectorate (journal number 2003/561-745).
Radiosynthesis
[11C]SB207145 was synthesized by N-methylation of the piperidine ring of the precursor (SB206453A, 1 mg, kindly supplied by GlaxoSmithKline, London, UK) with [11C]methyl-iodide in a modification of the published method (Gee et al, 2008), using a fully automated radiosynthesis system (Gillings and Larsen, 2005). After preparative HPLC purification, 3 to 4 GBq [11C]SB207145 (formulated in 10% ethanol in 25 mmol/L citrate buffer) could be produced within 30 mins. The specific activity at the end of synthesis was 22 to 107 GBq/μmol (mean 75GBq/μmol), and the radiochemical purity was > 99%.
PET/CT Protocol
The pigs were scanned in a combined PET/CT scanner (Discovery LS scanner, General Electric, Milwaukee, WI, USA). This was performed to achieve coregistered PET and CT images and to facilitate the subsequent coregistration of PET data to the Göttingen minipig magnetic resonance image (MRI)-based brain atlas, as described below. In addition, the CT-scan was used for attenuation correction. First, the CT-scan was performed (helical scan, 140 kV, 110 mA, 0.8 secs rotation time, 15 mm per rotation, pitch: 0.75:1) and reconstructed to a slice thickness of 4.25 mm. After conducting the CT scan, a dynamic emission recording in two-dimensional acquisition mode was initiated on bolus-injection of 500 MBq [11C]SB207145. We used a dynamic protocol consisting of 42 frames (10 × 6, 6 × 10, 3 × 20, 4 × 30, 5 × 60, 5 × 120, 6 × 300, and 4 × 600 secs) with a total scan duration of 90 mins. Arterial whole blood was sampled with increasing intervals during the entire scan. During the first minute, samples were drawn at 2 secs intervals with an automated sampling machine (Ole Dich Instrument-makers, Hvidovre, Denmark) and the remaining samples were drawn manually. Radioactivity concentration was measured in both whole blood and plasma using a well counter (Cobra 5003, Packard Instruments, Meriden, CT, USA) cross calibrated to the tomograph. The potent esterase inhibitor dichlorvos was added to all blood sampling tubes (1 μg/mL blood) to inhibit further metabolism of the parent compound in vitro. Whole-blood samples were collected at 2.5, 5, 10, 20, 30, 50, 70, and 90 mins for measurement of radioactive metabolites in plasma. After centrifuging the blood samples for 7 mins at 3000 g the plasma fractions were filtered through a 0.45 μm filter before analysis using a column-switching HPLC set-up with online radioactivity detection, as previously reported (Gillings et al, 2007). For late plasma samples, HPLC fractions were collected and the radioactivity was measured in a well counter. We had an initial problem with obtaining reliable measurements of the fraction of parent compound because of in vitro metabolism that was only incompletely solved in the first pig studies. This was effectively solved with the protocol described above and the three datasets used for comparing kinetic models were obtained using this final protocol.
The free fraction of [11C]SB207145 in plasma, fP, was estimated using equilibrium dialysis. The dialysis was performed using Teflon-coated dialysis chambers (Harvard Bioscience, Amika, Holliston, USA) with a cellulose membrane that retain proteins > 10,000 Da. Small amounts of [11C]SB207145 (~2 MBq) and dichlorvos were added to a 10 mL plasma sample drawn from the pig. Plasma (500 μL) was then dialysed at 37°C for 2.5 h against an equal volume of buffer, because pilot studies had shown that 2.5 h equilibration time yielded stable values. The buffer consisted of 135 mmol/L NaCl, 3.0 mmol/L KCl, 1.2 mmol/L CaCl2, 1.0 mmol/L MgCl2, and 2.0 mmol/L KH2PO4 (pH 7.4). After the dialysis, counts per minute (CPM) from 400 μL of plasma and buffer was determined in a well counter, and fP of [11C]SB207145 was calculated as the ratio of CPMbuffer/CPMplasma. In all experiments total counts were above 5,000 (count time 2 mins).
Quantification of PET Data
Images were reconstructed using a standard iterative method (OSEM, 2 iterations, 28 subsets) including all usual corrections, that is, dead time, detector normalization, randoms, attenuation and scatter (based on the CT), absolute activity calibration factor, and finally decay correction. Images consisted of 35 planes of 256 × 256 voxels of 2 × 2 × 4.25 mm3.
The CT image from each pig was coregistered to a Göttingen minipig brain MRI-based atlas (Watanabe et al, 2001), using the program Register, a tri-planer viewer developed at the Montreal Neurological Institute, McGill University, Canada. Registration was achieved by manually marking homologue anatomic positions in the two scans and minimizing the root mean square distance between the landmarks. Then, time-activity curves from the regions-of-interest (ROIs) were calculated as previously described (Andersen et al, 2005). The following ROIs were used: right striatum, left striatum, right hippocampus, left hippocampus, thalamus, mesencephalon, diencephalon, entire right cortex, entire left cortex, right frontal cortex, left frontal cortex, right occipital cortex, left occipital cortex, right temporal cortex, left temporal cortex, and cerebellum. The anatomic nomenclature used in this paper is the one defined in the Göttingen minipig brain atlas (Watanabe et al, 2001). The hippocampal regions (not defined in the original paper) were added to the atlas using the same method as described previously (Watanabe et al, 2001).
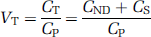
In three pigs, we derived a metabolite-corrected input function from the measured plasma curve. The metabolite data were interpolated by fitting a biexponential function to the fraction data. We calculated distribution volumes (VT) for the ROI's on the basis of a two-tissue compartment (2-TC) model, which includes the metabolite-corrected plasma compartment (CP), the intracerebral nondisplaceable (nonspecifically bound and free) compartment (CND), and the intracerebral specifically bound compartment (CS). The total concentration of radioligand in the tissue (CT) is then:

and VT is:
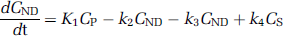
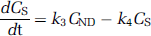
The 2-TC model also includes four rate constants: k1 and k2 denote the rate constants for transfer between CP and CND; k3 and k4 denote the rate constants for transfer between CND and CS. It is well known that for many PET-ligands VT is a more stable outcome parameter than the individual rate constants (Carson et al, 1993). If CPET is the measurement from the PET scanner in each frame then:

VT can then be calculated using (2), (3), (4), and (5) as:
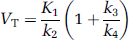
In (3) blood volume VB was fixed to 4%, and CWB was the total radioactivity concentration in whole blood.
Provided that the concentrations CND and CS equilibrate rapidly then the 2-TC model simplifies into a one-tissue compartment (1-TC) model with one single compartment (CT). The 1-TC model was also tested on our data; it includes only one differential equation:
and VT is then calculated as:

Goodness-of-fit was evaluated using the Akaike Information Criterion (Akaike, 1974), where a decreased Akaike Information Criterion value indicates the better fit. The graphical approach described by Logan et al (1990) for the analysis of reversible radioligand binding was also applied to the quantification of the data (Logan et al, 1990). We used both a varying and a fixed starting point for the linearization.
The concentration of tracer in CND was assumed to equal the concentration of tracer in an ROI devoid of receptors (CRef). As both our autoradiography data and data from the homogenate-binding study showed no displaceable binding in the cerebellum, we used this as reference region and then calculated the binding potential (BPND) as:
Finally, we calculated the binding potential using different tissue reference methods also with cerebellum as the reference region. For this, we used the multilinear reference tissue model (MRTM) (Ichise et al, 2003), the simplified reference tissue model (SRTM; Lammertsma and Hume, 1996; Wu and Carson, 2002) and the Logan noninvasive model (Logan et al, 1996). For all three models, we calculated binding potentials using a fixed k2 (k2'). For MRTM2, we used MRTM to calculate k2' and for SRTM2 and the Logan noninvasive model, we calculated k2' using SRTM. In both cases, we fixed k2' as the mean value from five high-binding regions: right striatum, left striatum, thalamus, mesencephalon, and diencephalon.
As a quality control criteria, we calculated the standard error coefficient of variation (COV) for VT or BPND results for all models. Only fits where COV was smaller than 25% of the estimate was used for the comparisons between models. Fits that did not converge were also not included in the analysis. Because of the high sensitivity to noise in the reference tissue models, we included fits where the COV was up to 75% for calculation of k2' values. In 2 of the 11 pigs, only 1 of the high-binding regions had an acceptable fit with SRTM. In these two cases, we also included k2 estimates from right and left cortex. All kinetic modelling was performed using the software PMOD version 2.85 (PMOD Technologies Ltd., Zurich, Switzerland).
Receptor Distribution Determined by Autoradiography
As rapidly as possible after lethal overdose, the brains (n = 3) for autoradiography were removed, frozen on dry ice, and stored at −80°C until further processing. The brains were cut in 16 μm thick horizontal sections on a cryostat, thaw mounted on poly-L-lysin-coated slides (85 × 76 mm, Histolab, Sweden) and allowed to dry at room temperature for a minimum of 30 mins before storage at −80°C. Before the autoradiography procedure, the slides were thawed and dried at room temperature. The sections were preincubated in freshly prepared incubation buffer (50 mmol/L Tris-HCl, 0.01% ascorbic acid, 10 μmol/L pargyline, pH = 7.4) for 15 mins at room temperature, and then incubated for 60 mins in the same buffer containing 1.5 nmol/L [3H]SB207145 (kindly supplied by GlaxoSmithKline, London, UK). Nonspecific binding was determined in adjacent sections by addition of 10 mmol/L RS39604 to the incubation buffer. After a quick wash in ice cold 50 mmol/L Tris-HCl buffer, pH=7.4, the slides were dried and coated overnight in paraformaldehyde vapour at 4°C. Radioactivity in the slices was determined by exposing an Imaging Plate (BAS-TR2040) for 14 days at 4°C. [3H]-microscales (Amersham Biosciences, Piscataway, NJ, USA) were placed on the same plates, and used for calculating absolute radioactivity concentrations. The image plates were scanned in a BAS-2500 scanner at resolution 100 μm, gradation 16 bit and dynamic range selector L5 S30000. The images were processed using Image J (Image Processing and Analysis in Java, http://rsb.info.nih.gov/ij/, version V.1.38x) and radioactivity in the regions: striatum, hippocampus (whole and CA3), frontal cortex, and cerebellum was determined as fmol/mg tissue equivalent (t.e.).
Receptor Binding in Brain Homogenate
In eight of the pigs, right after lethal overdose, the brains were taken out, quickly dissected into several regions, and frozen on dry ice. The saturation-binding parameters Bmax and Kd values were calculated for [3H]SB207145 in tissue homogenates from striatum, hippocampus, mesencephalon, frontal cortex, remaining cortex, and cerebellum. For homogenization the tissue was first crushed with a mortar on dry ice and mixed. Tissue (500 mg) was then transferred to a tube and homogenized gently with a polytron for 5 secs in 1:10 v/w homogenization buffer (50 mmol/L Trisma base, 150 mmol/L NaCl, 5 mmol/L EDTA, 2 mmol/L EGTA, pH = 7.4). After centrifugation (33,000g, 10 mins, 0°C to 2°C, Sorvall RC26 Plus centrifuge, rotorhead SS-34), the pellet was homogenized for 10 secs in 1:10 v/w lysis buffer (5 mmol/L Trisma base, 2 mmol/L EDTA, 2 mmol/L EGTA, 50 μg/g tissue of protease inhibitor cocktail (P8340, Sigma, St Louis, USA), pH = 7.4) and left on ice for 10 mins. The solution was centrifuged twice at 1,000g for 1 min at 0°C to 2°C with an intermediate short wash in lysis buffer. The two supernatants were combined and after centrifugation (33,000g, 10 mins, 0°C to 2°C), the pellet was resuspended in assay buffer, 4 mL per gram tissue (50 mmol/L Trisma base, 120 mmol/L NaCl, 5 mmol/L KCl, 5 mmol/L EDTA, 2 mmol/L EGTA, pH = 7.4), and stored at −80°C until further analysis. Protein concentration was measured with the Bradford method (Bio-Rad Protein Assay, Bio-Rad Laboratories, Hercules, CA, USA) immediately before the receptor-binding measurements.
Binding of [3H]SB207145 was measured at 37°C in a final volume of 200 mL of assay buffer, which contained 50 mL of brain homogenate suspension and [3H]SB207145 at one of six concentrations between 0.125 and 4 nmol/L. Nonspecific binding was determined using 10 μmol/L RS39604 (Batch no: 2A/65435, Tocris, Bristol, UK) as antagonist. The binding at each concentration was determined in duplicate. After 10 mins of incubation, the samples were filtered through Whatman GF/B glass microfibre filters using a 24-channel cell harvester (model m-24, Brandel, USA), and washed for 5 secs with approximately 20 mL of assay buffer. The filters were soaked with 0.1% polyethylenimine before filtration to reduce and stabilize nonspecific binding to the filters. The filters were removed from the harvester and soaked in 2.5 mL Ultima Gold overnight before counting in a liquid scintillation analyser (Tri-carb 2900TR, Packard Instrument Co., USA). The 5-HT4 receptor concentration was determined as Bmax, and Kd was also calculated in each area. Kd and Bmax values were estimated by GraphPad Prism (version 5.00 for Windows, GraphPad Software, San Diego, CA, USA). For all Bmax calculations, Kd was fixed to the mean striatal value, because there was no significant difference between Kd across regions and pigs. The density of binding sites was calculated as fmol/mg protein by dividing by the protein concentration in the sample. The results from this analysis was furthermore compared with 5-HT4-binding potentials (BPND) calculated from PET data using SRTM2 as described above.
Results
5-HT4 Distribution in the Pig Brain
We found that the distribution of the 5-HT4 receptor in the pig brain resembles the distribution in the human brain as measured with [125I]SB207710 (Varnäs et al, 2003), with the highest binding in the striatum and the hippocampus (Table 1 and Figure 1). From the autoradiographic images, we determined the following receptor concentrations (Bmax) 40.2 fmol/mg t.e. in striatum, 26.8 fmol/mg t.e. in hippocampus, and 19.3 fmol/mg t.e. in the frontal cortex (Table 1). As the hippocampus showed a high binding in the pyramidal cell layer (stratum pyramidale) and less in the other layers (stratum oriens, stratum radiatum, and stratum moleculare et sub-stratum lacunosum), we quantified binding in the pyramidal cell layer of CA3 alone. In this area, the concentration of 5-HT4 receptors is similar to the concentration in the striatum (Table 1).
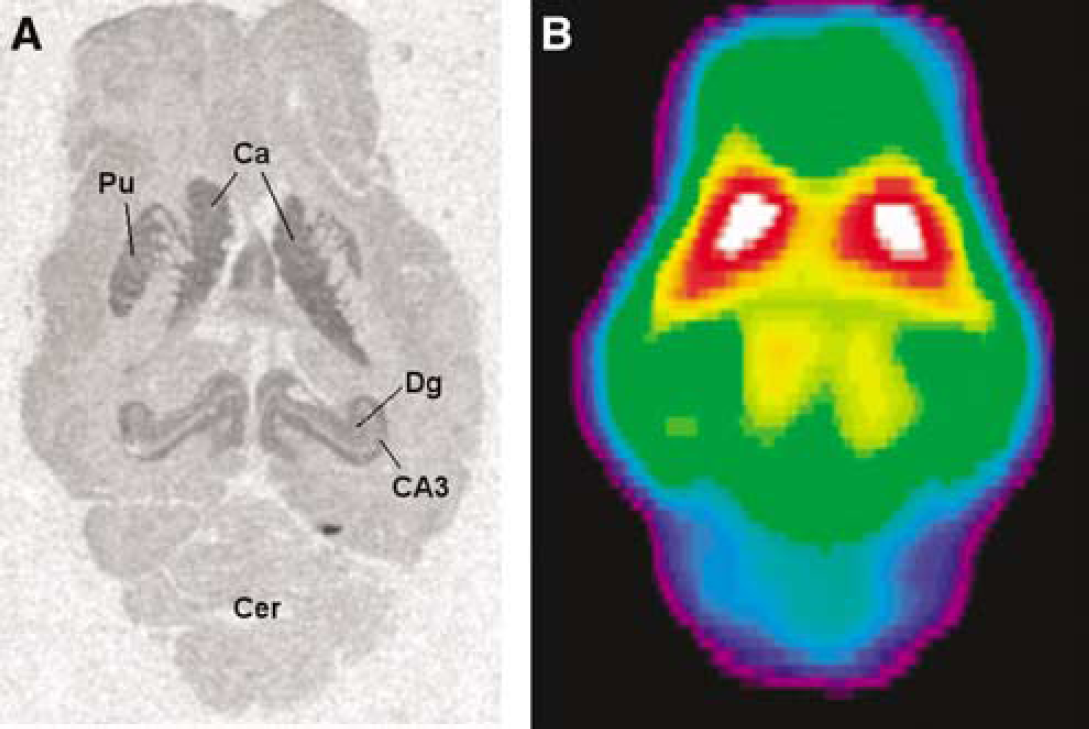
Horizontal sections of the Göttingen minipig brain showing the distribution of the 5-HT4 receptor at the level of the striatum and hippocampus as detected by (
5-HT4 concentrations (mean ± s.d.) in different brain regions as determined by autoradiography or homogenate receptor binding with [3H]SB207145
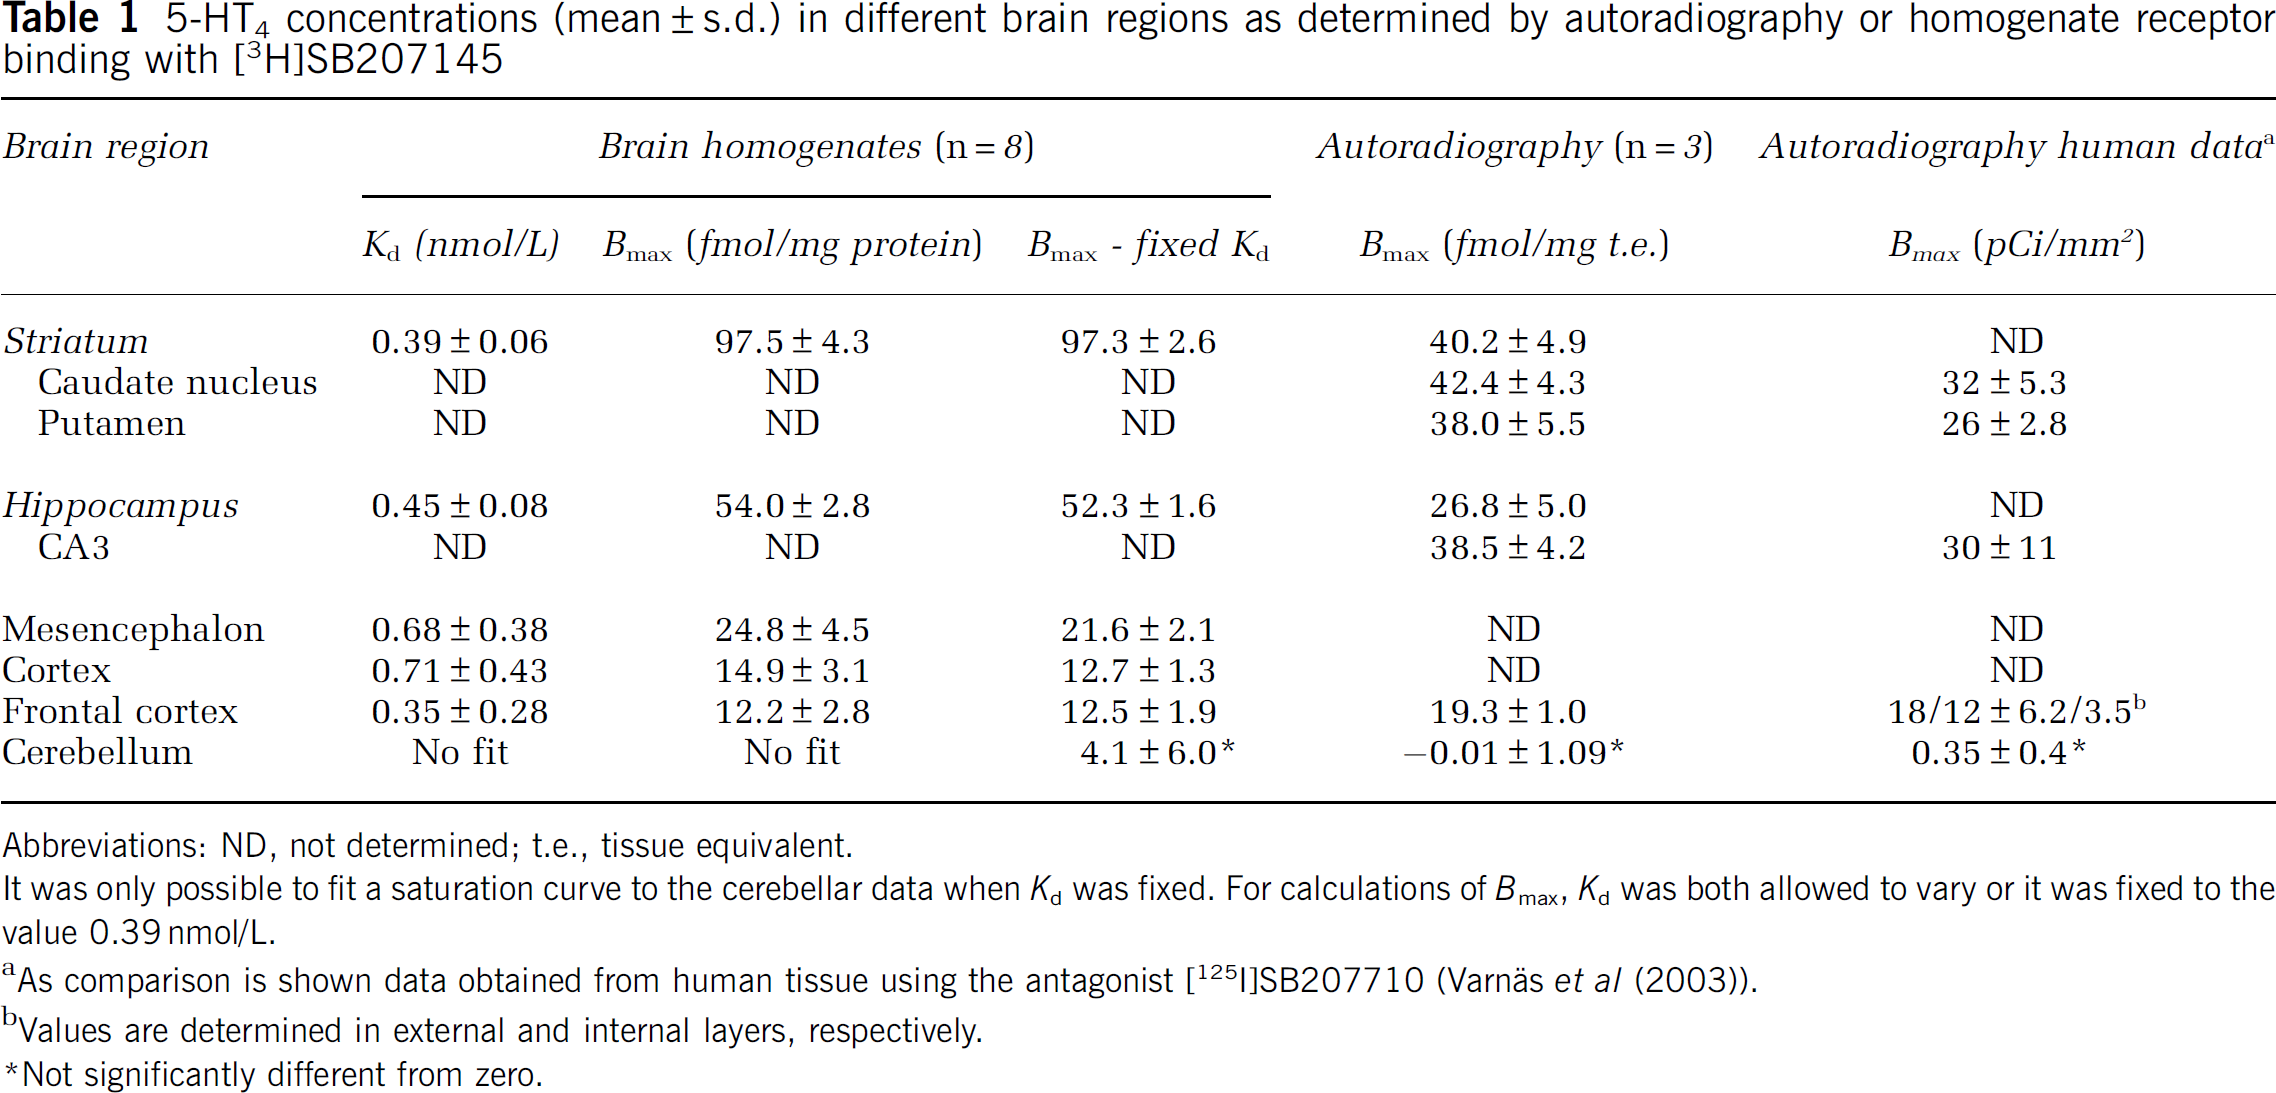
Abbreviations: ND, not determined; t.e., tissue equivalent.
It was only possible to fit a saturation curve to the cerebellar data when Kd was fixed. For calculations of Bmax, Kd was both allowed to vary or it was fixed to the value 0.39 nmol/L.
As comparison is shown data obtained from human tissue using the antagonist [125I]SB207710 (Varnäs et al (2003)).
Values are determined in external and internal layers, respectively.
Not significantly different from zero.
The densities of 5-HT4-binding sites were measured in tissue homogenates, and with this method, we found the highest concentration of receptors in the striatum (97.5 fmol/mg protein) and the lowest in the frontal cortex (12.5 fmol/mg protein). In the other areas, we found: 52.3 fmol/mg protein in the hippocampus, 21.6 fmol/mg protein in the mesencephalon, and 12.7 fmol/mg protein in cortex (Table 1). We detected no specific binding of [3H]SB207145 in cerebellum, neither in homogenate nor with autoradiography. The Kd of [3H]SB207145 was 0.39 ± 0.06 nmol/L in the striatum (n = 8), and there was no significant difference between Kd across regions.
PET Data
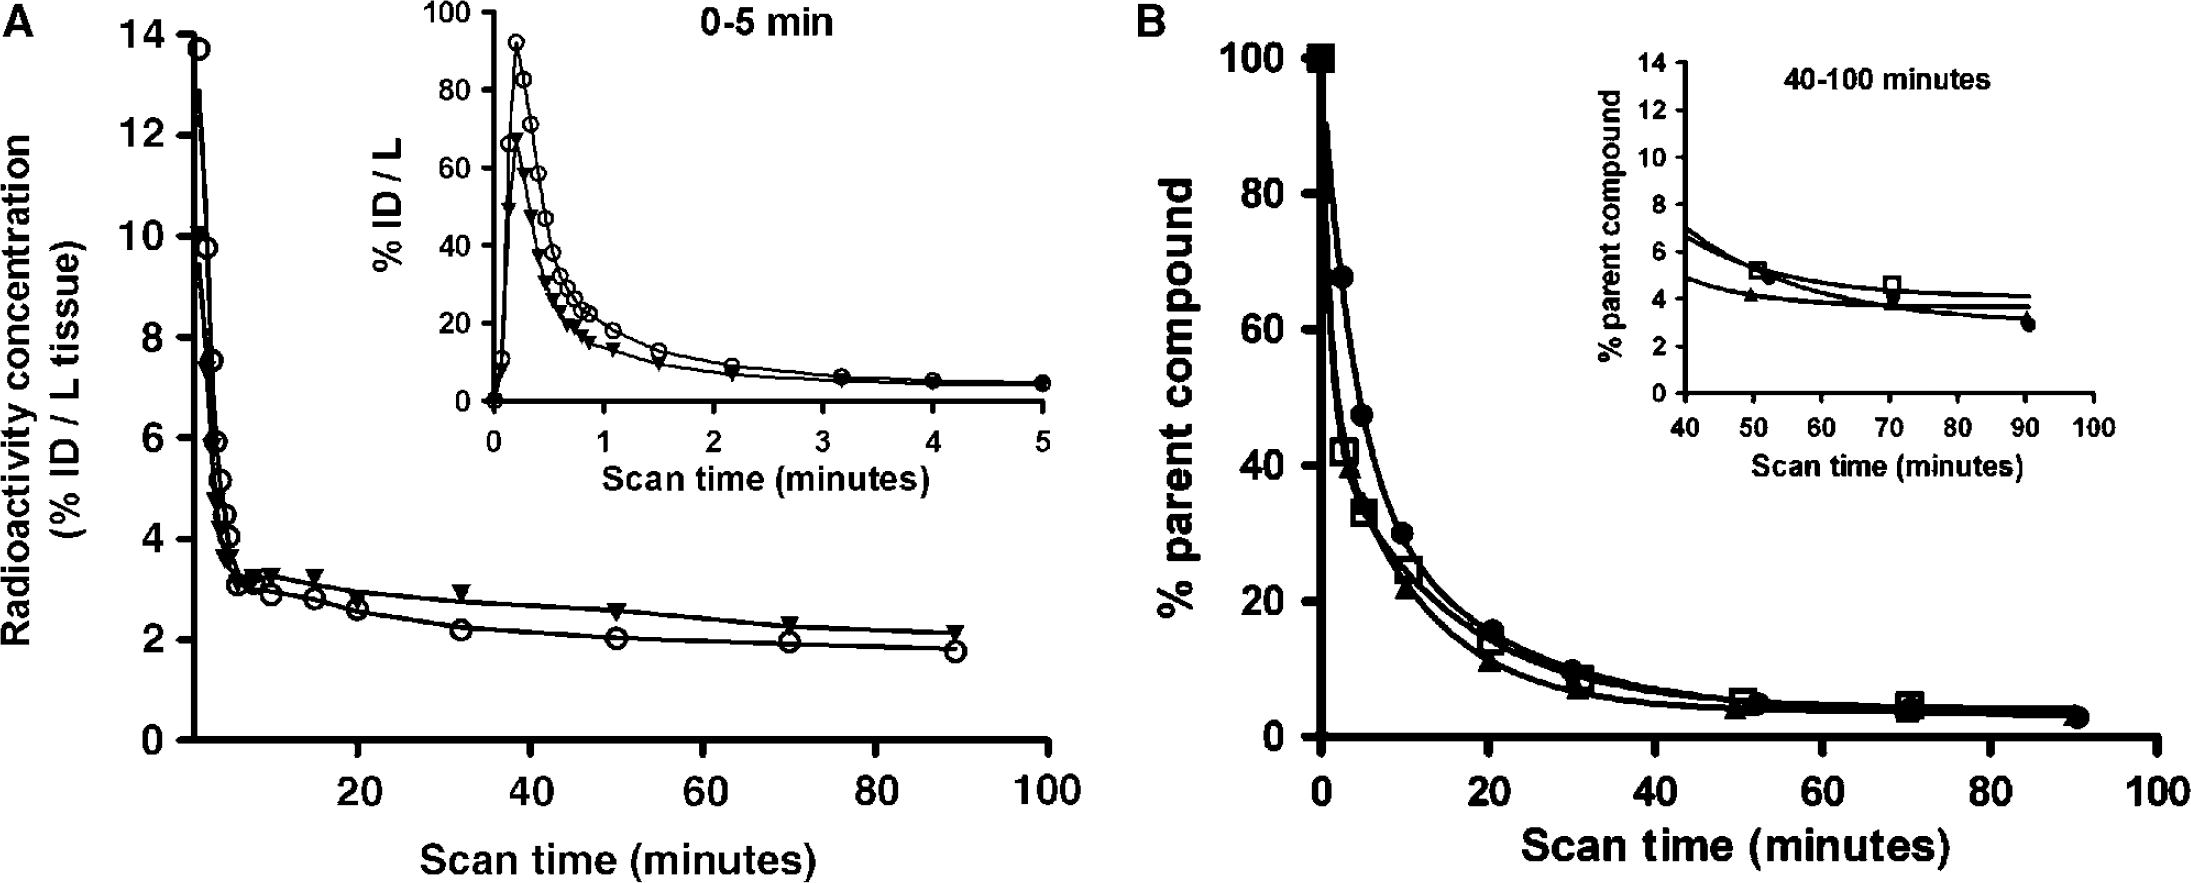
Eleven pigs were PET scanned with [11C]SB207145. Plasma and whole-blood curves were obtained during all scan sessions; a representative example is shown in Figure 2. Whole-blood radioactivity concentration peaked during the first 5 mins and was initially higher than the plasma concentration, thereafter it shifted and for the rest of the scan time, radioactivity concentration was highest in plasma samples. The mean (± s.d.) free fraction of [11C]SB207145 in plasma, fP was found to be 47.1 ± 5.3%. The percentage of parent compound in recovered radioactivity was measured in three pigs at eight time points (Figure 2). The metabolite curves from the three pigs were fitted individually using biexponentials, and this resulted in near-perfect fits.
Blood input curves and parent compound metabolism. (
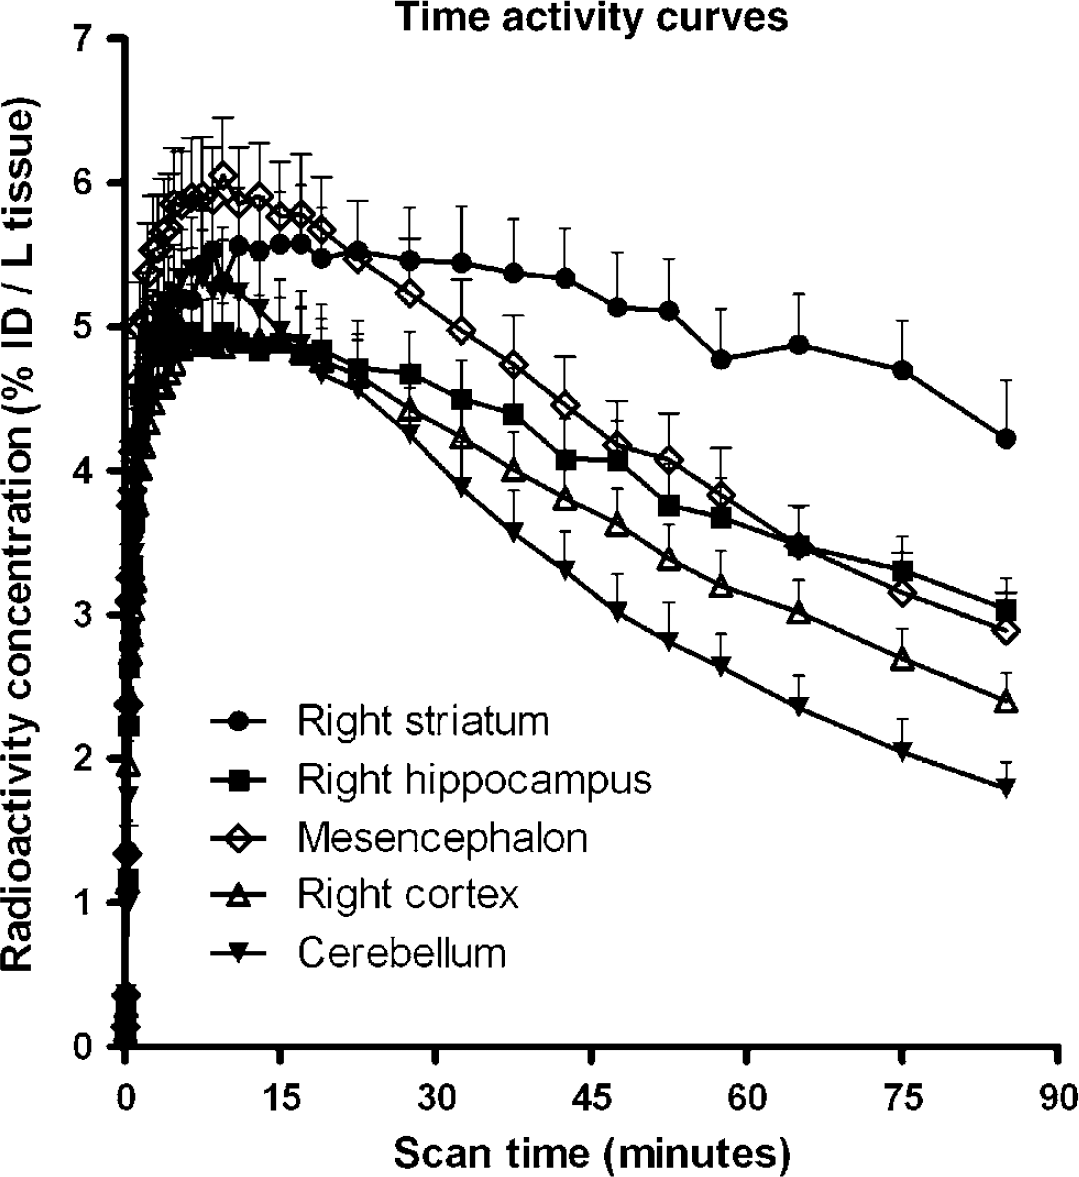
These curves were used to correct the plasma input curves for metabolites. From the dynamic PET images (Figure 1), we obtained time activity curves from right striatum, left striatum, right hippocampus, left hippocampus, thalamus, mesencephalon, diencephalon, entire right cortex, entire left cortex, right frontal cortex, left frontal cortex, right occipital cortex, left occipital cortex, right temporal cortex, left temporal cortex, and cerebellum. Figure 3 shows average time activity tissue curves from five of these regions.
Brain time activity curves of [11C]-SB207145. Shown are means (+ s.e.m.) from all pigs, n = 11.
Kinetic Modelling
Analysis with arterial parent compound input function and kinetic modelling is considered the gold standard for quantification of radioligand binding. For all regions, there was no significant difference (P = 0.37) between VT obtained with the 1-TC and the 2-TC models (Table 2) and the mean ratio between estimates outputs from the two models was 1.00. With the 1-TC, all regions had COV < 16.9%. In 1 case (out of 48 regions), the 2-TC model gave a COV of 48%, for the rest of the regions COV was < 17.5%. For all regions, the Akaike Information Criterion gave nearly similar results for the 1-TC and the 2-TC model, but the 1-TC model was still preferred in 44 out of 48 regions. Because of a small difference in the calculated VT for cerebellum with either model, we found slightly higher BPND values with the 2-TC model compared with the 1-TC model, but the results were highly correlated with a Pearson product moment correlation coefficient (R2) of 0.99, Figure 4). With the Logan plot, VT was underestimated in the high-binding region striatum, but overestimated in the midbrain regions. Except for one region, COVs were < 25%. The correlation between 1-TC and Logan data improved slightly when the starting point for linearization was fixed to approximately 17 mins, rather than leaving the start time of the linearization as a free variable (R2 = 0.94 versus R2 = 0.84); this effectively solved the problem with overestimation of midbrain regions.
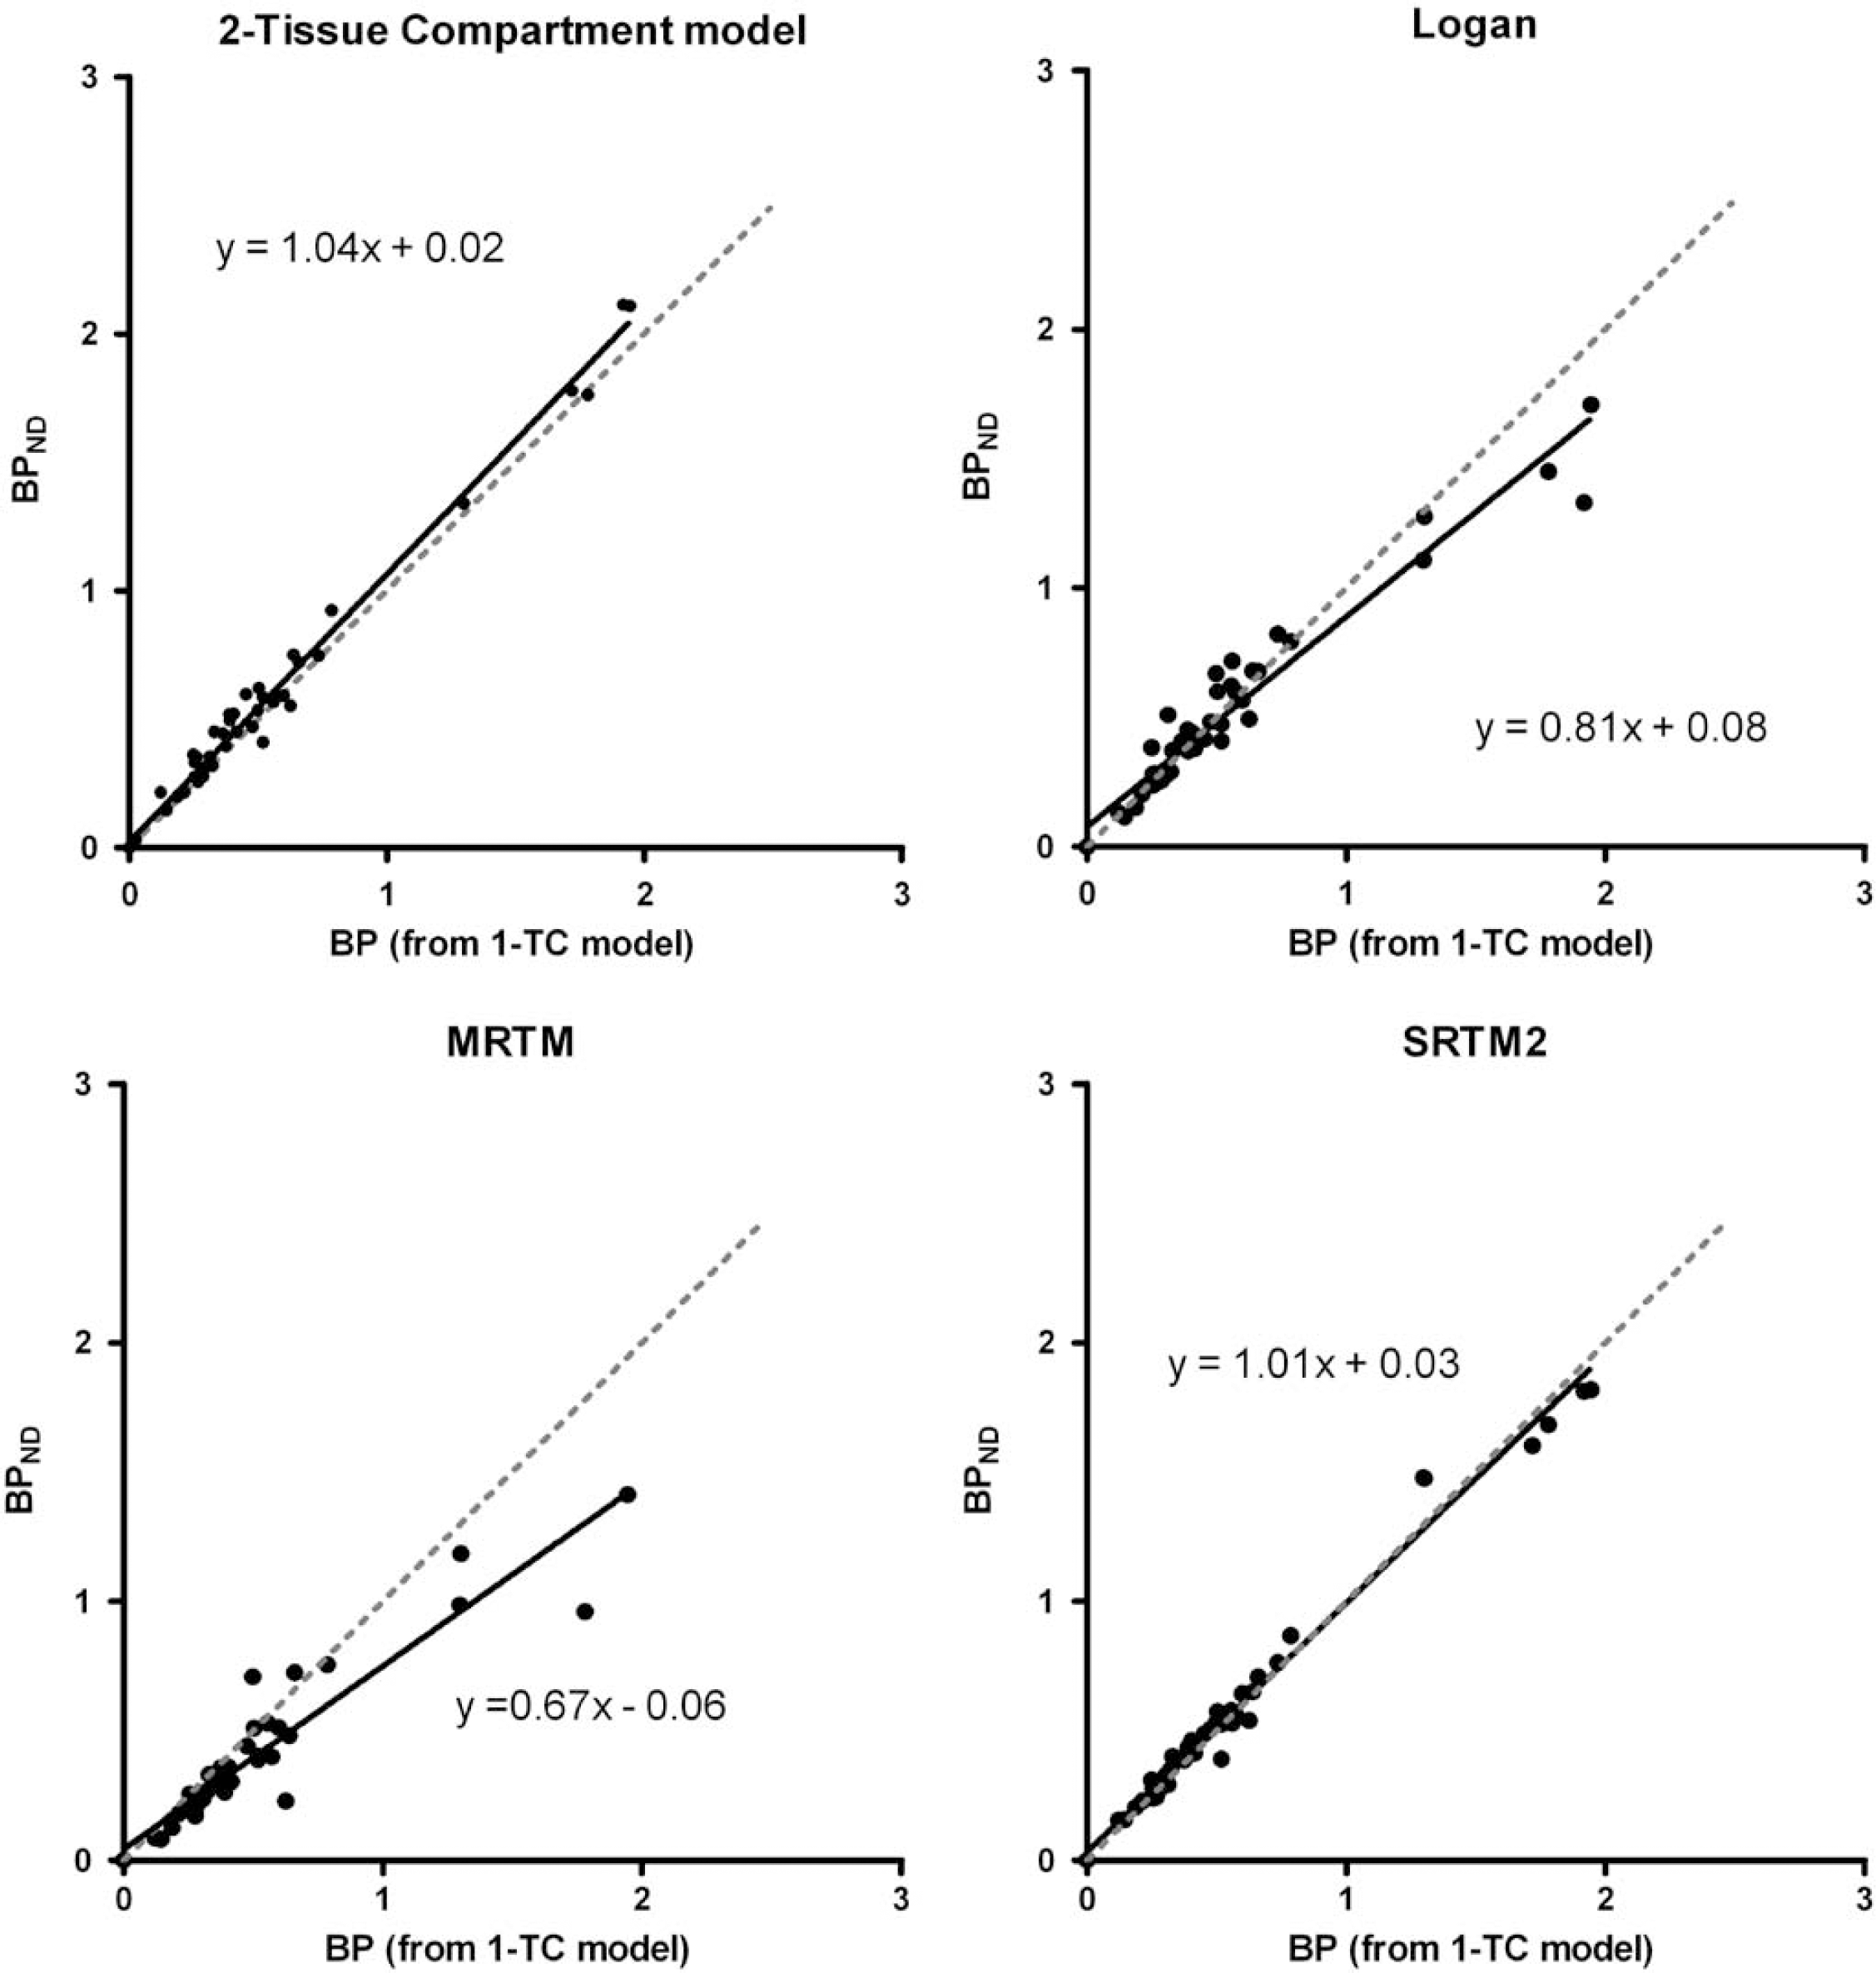
Correlations between 5-HT4-binding potentials (BPND) calculated from PET data using different kinetic models. For 1-TC and 2-TC models, and the Logan graphical method BPNDS were calculated from VTS using the cerebellar distribution volume as Vref. For MRTM and SRTM2, cerebellum was also used as reference region. 1-TC: One-tissue-compartment model. Logan: distribution volumes are calculated using a fixed starting point (t = 17 mins) for the linearization. SRTM2: simplified reference tissue model as modified by Wu and Carson (2002) with k2' fixed to an average value from the five high-binding regions (right and left striatum, thalamus, mesencephalon, and diencephalon). Pearson product moment correlation coefficients (R2) are 0.99, 0.94, 0.88, and 0.98, respectively.
Average distribution volumes (VT) for 1-TC and 2-TC plasma input models and Logan graphical analysis
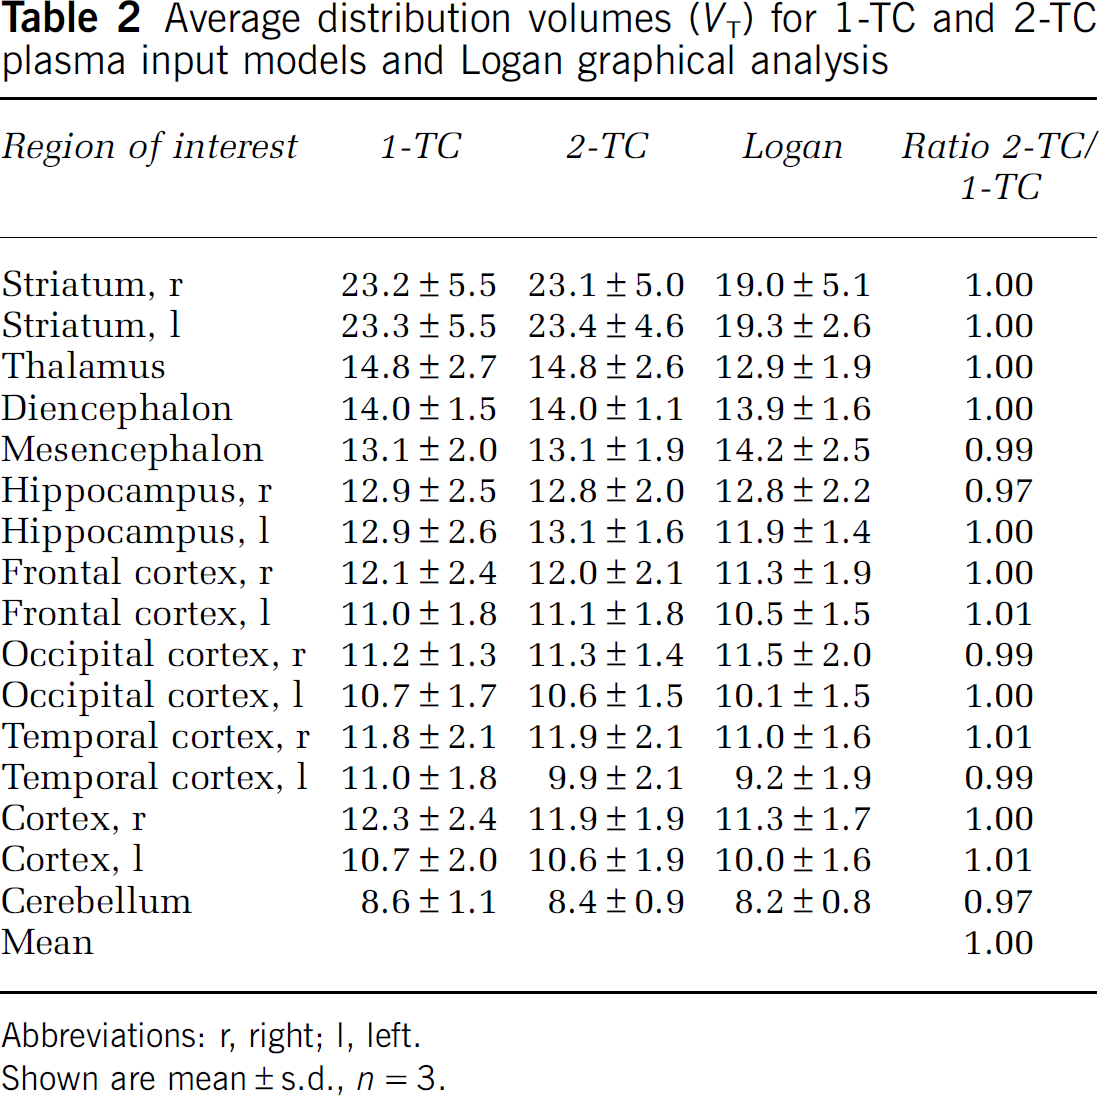
Abbreviations: r, right; l, left.
Shown are mean ± s.d., n = 3.
To evaluate if blood sampling is required in future studies, we calculated BPND using different reference tissue models as well. With both the MRTM and the SRTM, we noted a higher sensitivity to noisy data. With MRTM fitting failed to reach convergence in two regions and only 26 of the remaining 43 regions had a COV < 25%. With SRTM 6 regions out of 45 did not converge and of the remaining 39 regions only 3 had a COV < 25%. To be able to compare these models to the 1-TC model, we decided also to include regions with a COV between 25% and 50%. This increased the number of acceptable fits to 38 for MRTM and to 17 for SRTM. When comparing the results obtained with MRTM to the 1-TC model, we found a significant underestimation of BPND (9.5%, P = 0.0007) with MRTM and a correlation coefficient of R2 = 0.88. Because of the low number of acceptable fits, we did not compare SRTM data to the 1-TC model data. To improve modelling with MRTM and SRTM, we fixed k2' for all regions (MRTM2 and SRTM2; Wu and Carson 2002). With MRTM2 fitting failed in five high-binding regions, and COV were > 25% in two regions. For SRTM2 only one region had a COV > 25% and all regions converged. With this approach, the correlation between MRTM2 and the 1-TC model improved (R2 = 0.91), but BPNDS were still significantly underestimated (11%, P = 0.0005). With SRTM2 we found a high correlation with BPND calculated with the 1-TC model and no bias (R2 = 0.98, Figure 4). With MRTM we found an average k2' of 0.034 ± 0.001 min−1, with SRTM we found 0.023 ± 0.002 min−1. Compared with the k2' estimated from the 1-TC model with a parent compound input function (0.023 ± 0.005 min−1), we found that the best estimate was achieved with SRTM. There was a linear correlation between the results of the Logan noninvasive model and the 1-TC model with the linear regression function y= 0.81x + 0.81 and R2 = 0.92. As with the Logan plot, we saw an underestimation of the high-binding regions, but we did not find overestimation of midbrain regions.
PET Results Validated Against In Vitro Measurement of Receptor Concentration
To further validate the obtained PET results, we determined the 5-HT4 receptor concentrations in tissue homogenates from six different brain areas (striatum, hippocampus, mesencephalon, frontal cortex, rest of cortex, and cerebellum) from eight pigs and compared the outcome to the binding potentials calculated from the PET data (Figure 5). For all regions, except hippocampus where a significant underestimation was seen, we found a high correlation between the two measurements (R2 = 92, P < 0.0001). We could not identify a correlation between tissue homogenate data and PET data in individual regions.
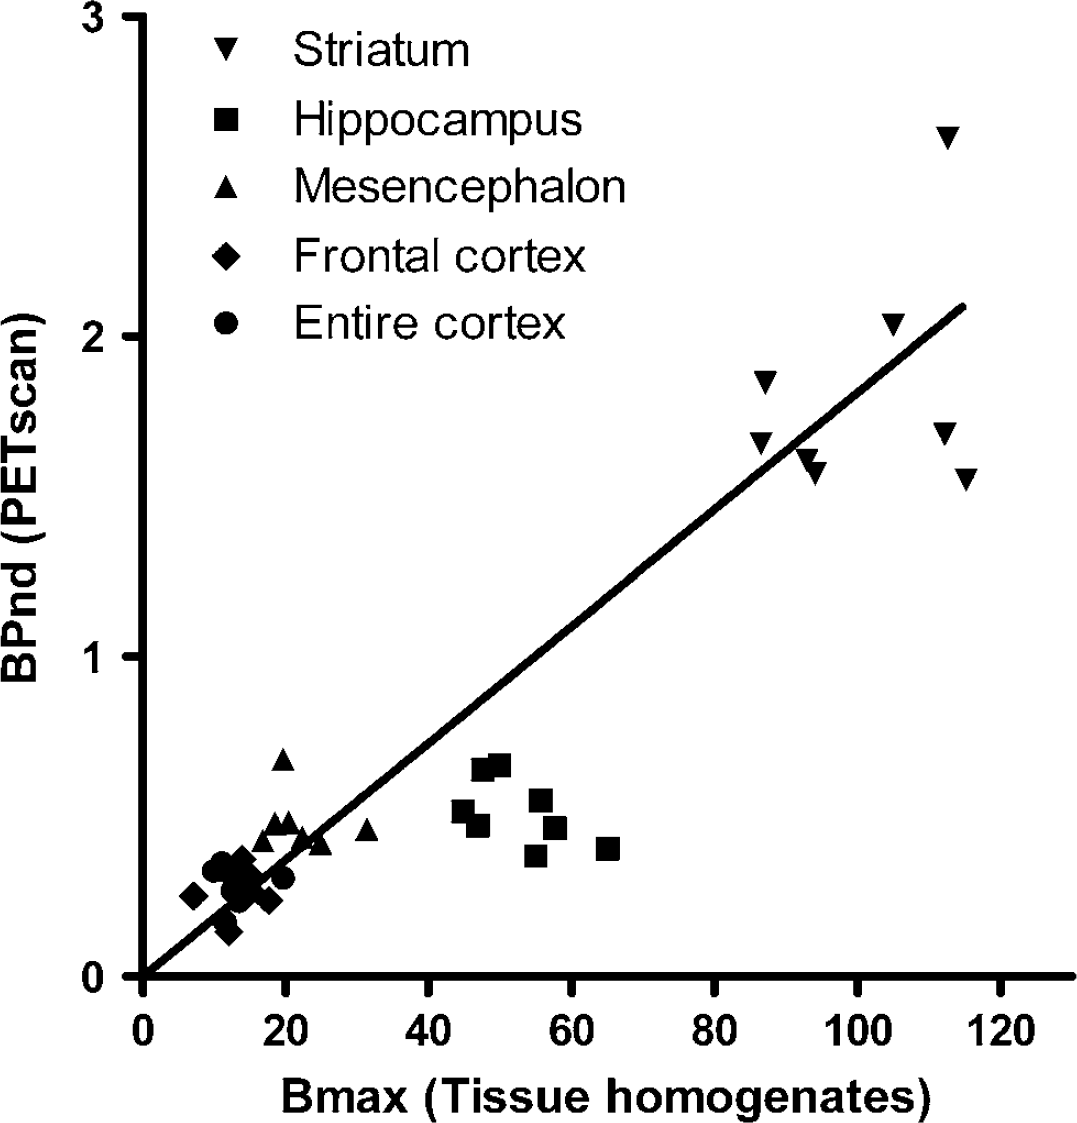
Comparison of 5-HT4 concentrations in brain tissue homogenates and 5-HT4-binding potentials (BPND) as measured with PET. The PET data were modelled using a simplified reference tissue model with fixed k2'. The outcome of the linear regression analysis (without hippocampal data) is shown. R2 = 0.92.
Discussion
This is the first paper to present in vivo and in vitro measurements of the 5-HT4 receptor in the same animal (Göttingen minipig), and also to compare different kinetic modelling approaches for the PET tracer [11C]SB207145.
We found that the Göttingen minipig has a 5-HT4 receptor distribution that resembles the human distribution as reported by Varnäs et al (2003) (Arranz et al, 1998). When evaluating [11C]SB207145 as a possible PET radioligand, Gee et al (2008) performed in vivo PET scans in the Yorkshire and Danish Landrace crossbreed pig. They report an overall distribution similar to the one we present here, but they do not report any quantitative measurements. In one previous study, the 5-HT4 receptor affinity of several 5-HT4 ligands were determined in homogenates from pig striatum, but no receptor concentrations were determined (Schiavi et al, 1994). We have determined the 5-HT4 receptor concentrations in different brain areas with both tissue homogenate binding and autoradiography. With both methods, we find the highest binding in the striatum, low binding in cortex, and no specific binding in the cerebellum. In the hippocampus, we observed that the 5-HT4 receptors were mostly found in the pyramidal cell layer. For several reasons, it is difficult to compare results obtained with tissue homogenate binding and autoradiography. First, for tissue homogenate binding larger tissue areas are often used whereas for autoradiography thin brain slices are used. This makes it difficult to compare the exact same areas. Second, both procedures include a washing step where excess radiolabelled ligand is removed. In this step, there is a risk that specifically bound ligand is also washed away, and this step obviously differs between the procedures. Third, with tissue homogenate, the measurement is related to the total protein concentration in the sample, whereas in autoradiography the radioactivity concentration is converted to fmol/mg estimated wet t.e. via [3H]microscales. We find that measuring receptor binding in tissue homogenates is more precise in large areas, if these are accurately dissected, whereas autoradiography is the superior method for investigating regional differences, and smaller ROIs. For this reason, we primarily focused on tissue homogenate receptor binding, and also used these data to compare with the in vivo PET data.
To validate different models for quantification of the PET data, we first compared VT data from 1-TC and 2-TC models calculated using arterial parent compound input functions. We used a biexponential function to fit the metabolite data and found near-perfect fits. For some tracers it has been shown that with human data a more physiologic description of the early time course of parent compound metabolism is given by a Hill function (Gunn et al, 1998; Wu et al, 2007). As in our case, a biexponential function lead to a near-perfect fit at all time points, we did not test the Hill function.
According to the Akaike criteria the 1-TC model gave a slightly better fit than the 2-TC model. There was a very high correlation between results of the two models and no mean difference in the VT values. This implies that the 1-TC model should be the preferred model for [11C]SB207145 when used in minipigs, and suggests that the exchange rates between the nondisplaceable and specific compartments must be fast so that the specific binding cannot readily be distinguished. With the Logan graphical method, we found a fairly good correlation to data from the 1-TC model but with an underestimation of VT especially in high-binding regions. This phenomenon is well described and is caused by the statistical bias associated with linear transformation of binding data (Slifstein and Laruelle, 2000). This effect is more pronounced in highdensity regions.
In general, reference tissue models benefit from not requiring arterial blood sampling, but a suitable reference region where radioligand uptake represents only the nonspecific uptake must exist. In our in vitro assays, we did not detect any specific binding in the cerebellum with [3H]SB207145, supporting that cerebellum serves as a suitable reference region in the pig. This notion is also in line with the data from in vivo blocking study reported by Gee et al (2008).
Using cerebellum as reference region we found both MRTM and SRTM to be more sensitive to noise in the data than the arterial input function models, and this shortcoming was in both cases improved substantially by fixing k2 to a global mean value k2'. Using this approach require accurate a priori estimation of k2', and our approach was using the full MRTM and SRTM models to obtain this estimate. As shown by Ichise et al (2003) using a single-tissue ROI to estimate k2 potentially induces bias in BPND values because of noise. To reduce this noise we estimated k2 for several ROIs and used a mean of these values as k2'. This improved the stability of the models and reduced the variance, but did not improve bias. Both MRTM and MRTM2 were found to underestimate the binding potential, and MRTM also significantly overestimated k2'. It has also previously been shown, that bias in k2' estimation transfers to bias in the binding potential (Ichise et al, 2003). With SRTM2 we found a very good correlation to 1-TC model data with no bias (Figure 4), and also we found that using SRTM to estimate k2' gave a result very similar to k2 estimated from the 1-TC model. This is consistent with one of the major assumptions of the SRTM approach: that the kinetics follow a 1-TC model, the other being that the level of nondisplaceable binding in the reference and the target regions is similar (Lammertsma and Hume, 1996).
In conclusion, we suggest that SRTM2 with a fixed k2 for modelling pig be used for the standard analysis on future studies of [11C]SB207145 uptake in pig brain. Generally, for radiotracers k2' should be modelled over a large high-binding region or taken as the averaged value from several high-binding regions to get robust estimates of k2'.
To further evaluate the simplified reference tissue model used on [11C]SB207145 uptake data, we compared BPNDS from eight pigs to in vitro tissue homogenate receptor-binding data from the same individuals. We found a good correlation between the datasets in most of the examined regions, that is, in striatum, mesencephalon, frontal cortex, and remaining cortex. By contrast, a significant underestimation of the PET-determined hippocampal distribution volume in comparison with in vitro data from the same animals was seen. We did not see any robust correlation between the in vivo PET data and the in vitro homogenate-binding data within the individual brain regions. This finding is not unexpected because both measurements, particularly PET, are noisy. However, the expected correlation between in vivo and in vitro data, except for hippocampus, was found. The hippocampus is the smallest region in the dataset, it lies adjacent to the lateral ventricles where no binding is present, and, as we show with autoradiography, binding in this region is further confined to the narrow band of pyramidal cells. This makes it very difficult to quantify accurately with PET because of partial volume effects. This phenomenon is caused by the limited spatial resolution of PET, which leads to an underestimation of regional radioactivity distribution in regions with high radioactivity concentration relative to the surroundings, and also to the converse situation with overestimation in regions with low radioactivity concentration (Hoffman et al, 1979). With a coregistered MRI, it is possible to correct for these effects of partial volume (Muller-Gartner et al, 1992), and this will be necessary in the future if accurate binding potentials are to be obtained from hippocampus and other small regions.
From this study, we conclude that the Göttingen minipig has a 5-HT4 receptor distribution similar to the human distribution. The novel PET-ligand [11C]SB207145 is suitable for measuring this receptor in vivo directly in larger brain areas, in smaller areas it will be necessary to correct for partial volume effects.
Footnotes
Acknowledgements
Precursor for [11C]SB207145 and tritiated SB207145 was kindly supplied by GlaxoSmithKline, London, UK. The authors acknowledge Roger Gunn and Rob Comley for valuable scientific discussion of the data.