
Abstract
Venous-arterial lactate differences across the brain during lactate infusion in rats were studied, and the fate of lactate was described with a mathematical model that includes both cerebral and extracerebral kinetics. Ultrafiltration was used to sample continuously and simultaneously arterial and venous blood. Subsequent application of flow injection analysis and biosensors allowed the measurement of glucose and lactate concentrations every minute. Because of the high temporal resolution, arteriovenous lactate kinetics could be modeled in individual experiments. The existence of both a cerebral lactate sink and a lactate exchangeable compartment, representing approximately 24% of brain volume, was thus modeled.
Lactate is a universal metabolic product of diverse organs in the body. It is released when oxygen supply is insufficient, but can also be used as an energy source (Maran et al., 1994; Chen et al., 2000; Jones et al., 2000). Although lactate is formed in virtually every organ in the body, including the brain (Bouzier et al., 2000), its metabolic breakdown mainly takes place in the liver (Naylor et al., 1984). Time courses of arterial lactate concentrations and lactate elimination kinetics have been described after both lactate infusions and exercise in animals and humans [for example, (Freund and Zouloumian, 1981; Connor et al., 1982; Oyono-Enguelle et al., 1989; Freund et al., 1990; Messonnier et al., 2001)]. Although venous-arterial differences of the brain have been measured, no comparative studies on brain venous-arterial lactate kinetics have appeared. The brain can accumulate, metabolize, and release lactate, so the simultaneous measurement of arterial and venous lactate kinetics allows the description of the fate of lactate and the brain's ability to exchange lactate.
We studied venous-arterial glucose and lactate differences across the brain in rats after lactate infusion, and divided the results into two parts. First, we studied the brain's ability to use lactate as an energy source, which was published recently (Leegsma-Vogt et al., 2003); the present article will focus on a mathematical model to describe lactate kinetics. We applied ultrafiltration and biosensor technology, allowing glucose and lactate levels to be measured in the same sample, and aorta and jugular vein blood levels to be monitored at the same time. This approach allows 4 simultaneous measurements every minute, resulting in almost 1,000 values in a 4-hour experiment. The high temporal resolution allows calculations on kinetics in individual experiments. We developed a mathematical model to describe arterial and venous lactate concentrations, and we observed that a lactate sink can be modeled in the brain, and that the lactate distribution volume increases with infusion length. Calculations suggest the existence of a small sink in the brain (apparent metabolism of lactate) and of a cerebral lactate distribution volume (comprising approximately 24%, allowing the exchange of cerebral lactate with that of the blood).
MATERIALS AND METHODS
Animals
The experimental methods section is essentially the same as described in Leegsma-Vogt et al. (2003), and is briefly summarized. Rats (n = 7) were anesthetized and mechanically ventilated during the experiment. The rat was heparinized; lactate infusion was administered in the tail vein. pH and blood gas were measured in the femoral artery (n = 4). Ultrafiltration probes were placed in the aorta and in the right jugular vein for the measurement of venous-arterial differences. Both probes are connected to the flow injection analysis (FIA) system. The potential of the two-probe system for the measurement of brain arteriovenous measurements was demonstrated previously by us (Leegsma-Vogt et al., 2001, 2003). Glucose and lactate were electrochemically measured using microreactors containing glucose oxidase and lactate oxidase, respectively, together with horseradish peroxidase. An in vitro calibration curve was run on the FIA (glucose: 0, 2.5, 5, 10, 20 mmol/L; lactate: 0, 1.25, 2.5, 5 and 10 mmol/L). The glucose and lactate concentration was measured every minute and the currents (in nanoamperes) were recorded.
A baseline was recorded for at least 30 minutes. Lactate (1 mol/L, sodium-L-lactate) was infused at a rate of 100 μL/min (equivalent to 100 μmol/min) for 5 to 33 minutes (n = 7). Similar protocols have been used in humans as well as in rats (e.g., Peskind et al., 1998; Wikander et al., 1995; Olsson et al., 2002). In the present and the previously published experiments with rats (Wikander et al., 1995; Olsson et al., 2002), the amount of infused Na salt ranges between 0.5 and 3 mmol (or 2 mmol to 12 mmol per kilogram body weight). If sodium was undiluted after intravenous infusion, increases between 50 and 300 mmol/L were expected. In the human, similar infusions (expressed per kilogram body weight) lead to an increased levels in plasma of (only) 8 mmol/L (Peskind et al., 1998). In the rat, similar amounts of intravenously infused Na increased blood pressure with about 15 mm Hg, but had no effect on the heart rate (e.g., Wikander et al., 1995). The physiologic variables have extensively been described in Leegsma-Vogt et al. (2003). That study (Leegsma-Vogt et al., 2003) showed that even with long infusion times there were no major effects on various physiologic variables. Furthermore, it appeared that the kinetic model developed here was essentially independent of the amount of sodium lactate infused. These observations together may indicate that infused Na is rapidly distributed over a relatively large body volume. Therefore, we exclude a major influence of the disturbance of the sodium homeostasis on the conclusions of our previous (Leegsma-Vogt et al., 2003) and present study. To reach steady-state levels of lactate during infusion, one experiment was done at an infusion rate of 50 μL/min for 80 minutes. After the infusion, blood lactate level was allowed to return to baseline. The rats were killed at the end of the experiment. In short, during lactate infusion, lactate influx is seen, which turns into an even higher than baseline efflux immediately after lactate infusion, and then returns to stable arterial-venous (VA) lactate levels (example in Fig. 1).
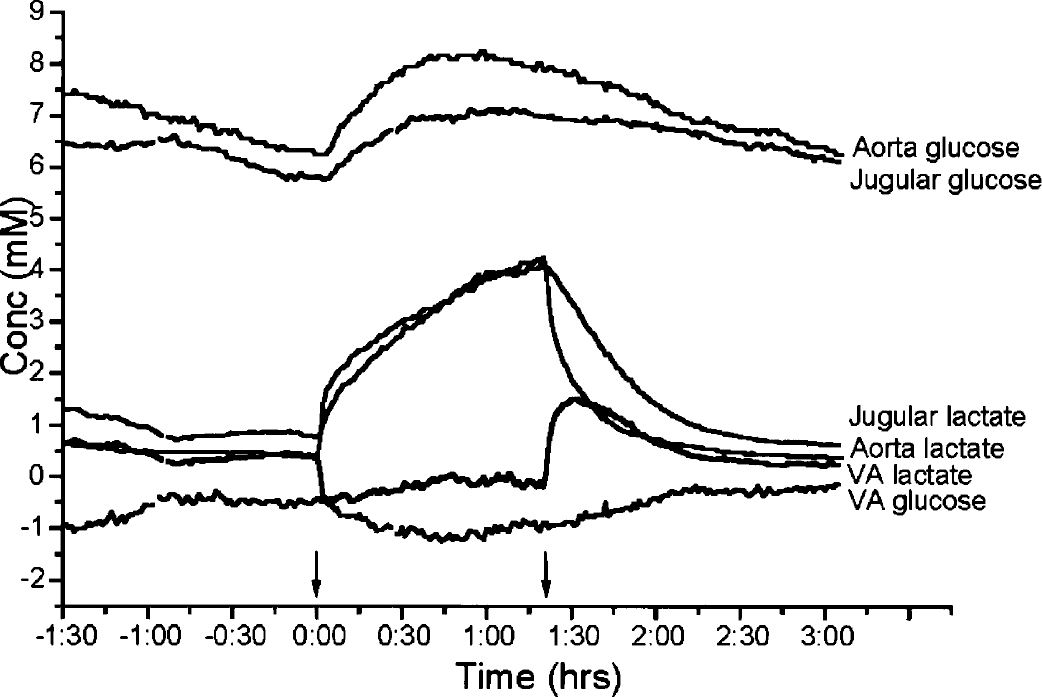
Ultrafiltrate samples are measured every minute; connecting all minute-to minute samples creates a graphical representation as shown in this figure. The time-period in hours is presented on the x-axis. Arrows indicate infusion start and ending. There is glucose influx throughout the experiment. Before lactate infusion there is lactate efflux, which turns to a stable influx during infusion. In this experiment, a steady state is visible during infusion. Immediately after the infusion is stopped, the lactate level starts to decrease, and a high efflux of lactate is seen. Another example of an experiment can be found in Leegsma-Vogt et al. (2003).
Mathematical model
The mathematical model used to describe the lactate infusion curves is explained as follows. Figure 2 shows a schematic representation of the body's blood circulation; arrows indicate the blood flow direction. Organs that are relevant in our present calculation are indicated by circles, numbered 0–3, and they are thought of as reservoirs that can take up and release a lactate flux. Reservoirs 0 and 1 together stand for the brain and the head, and reservoir 2 stands for all other organs and limbs, with the exception of the lungs, which is reservoir 3. Because the lungs take up oxygen to provide to the rest of the body, they are placed in series with all other organs and limbs, whereas the latter are all in parallel with each other. Hence, in Figure 2, the two heart chambers are placed directly to the right and to the left of reservoir 3 (HC1 and HC2).
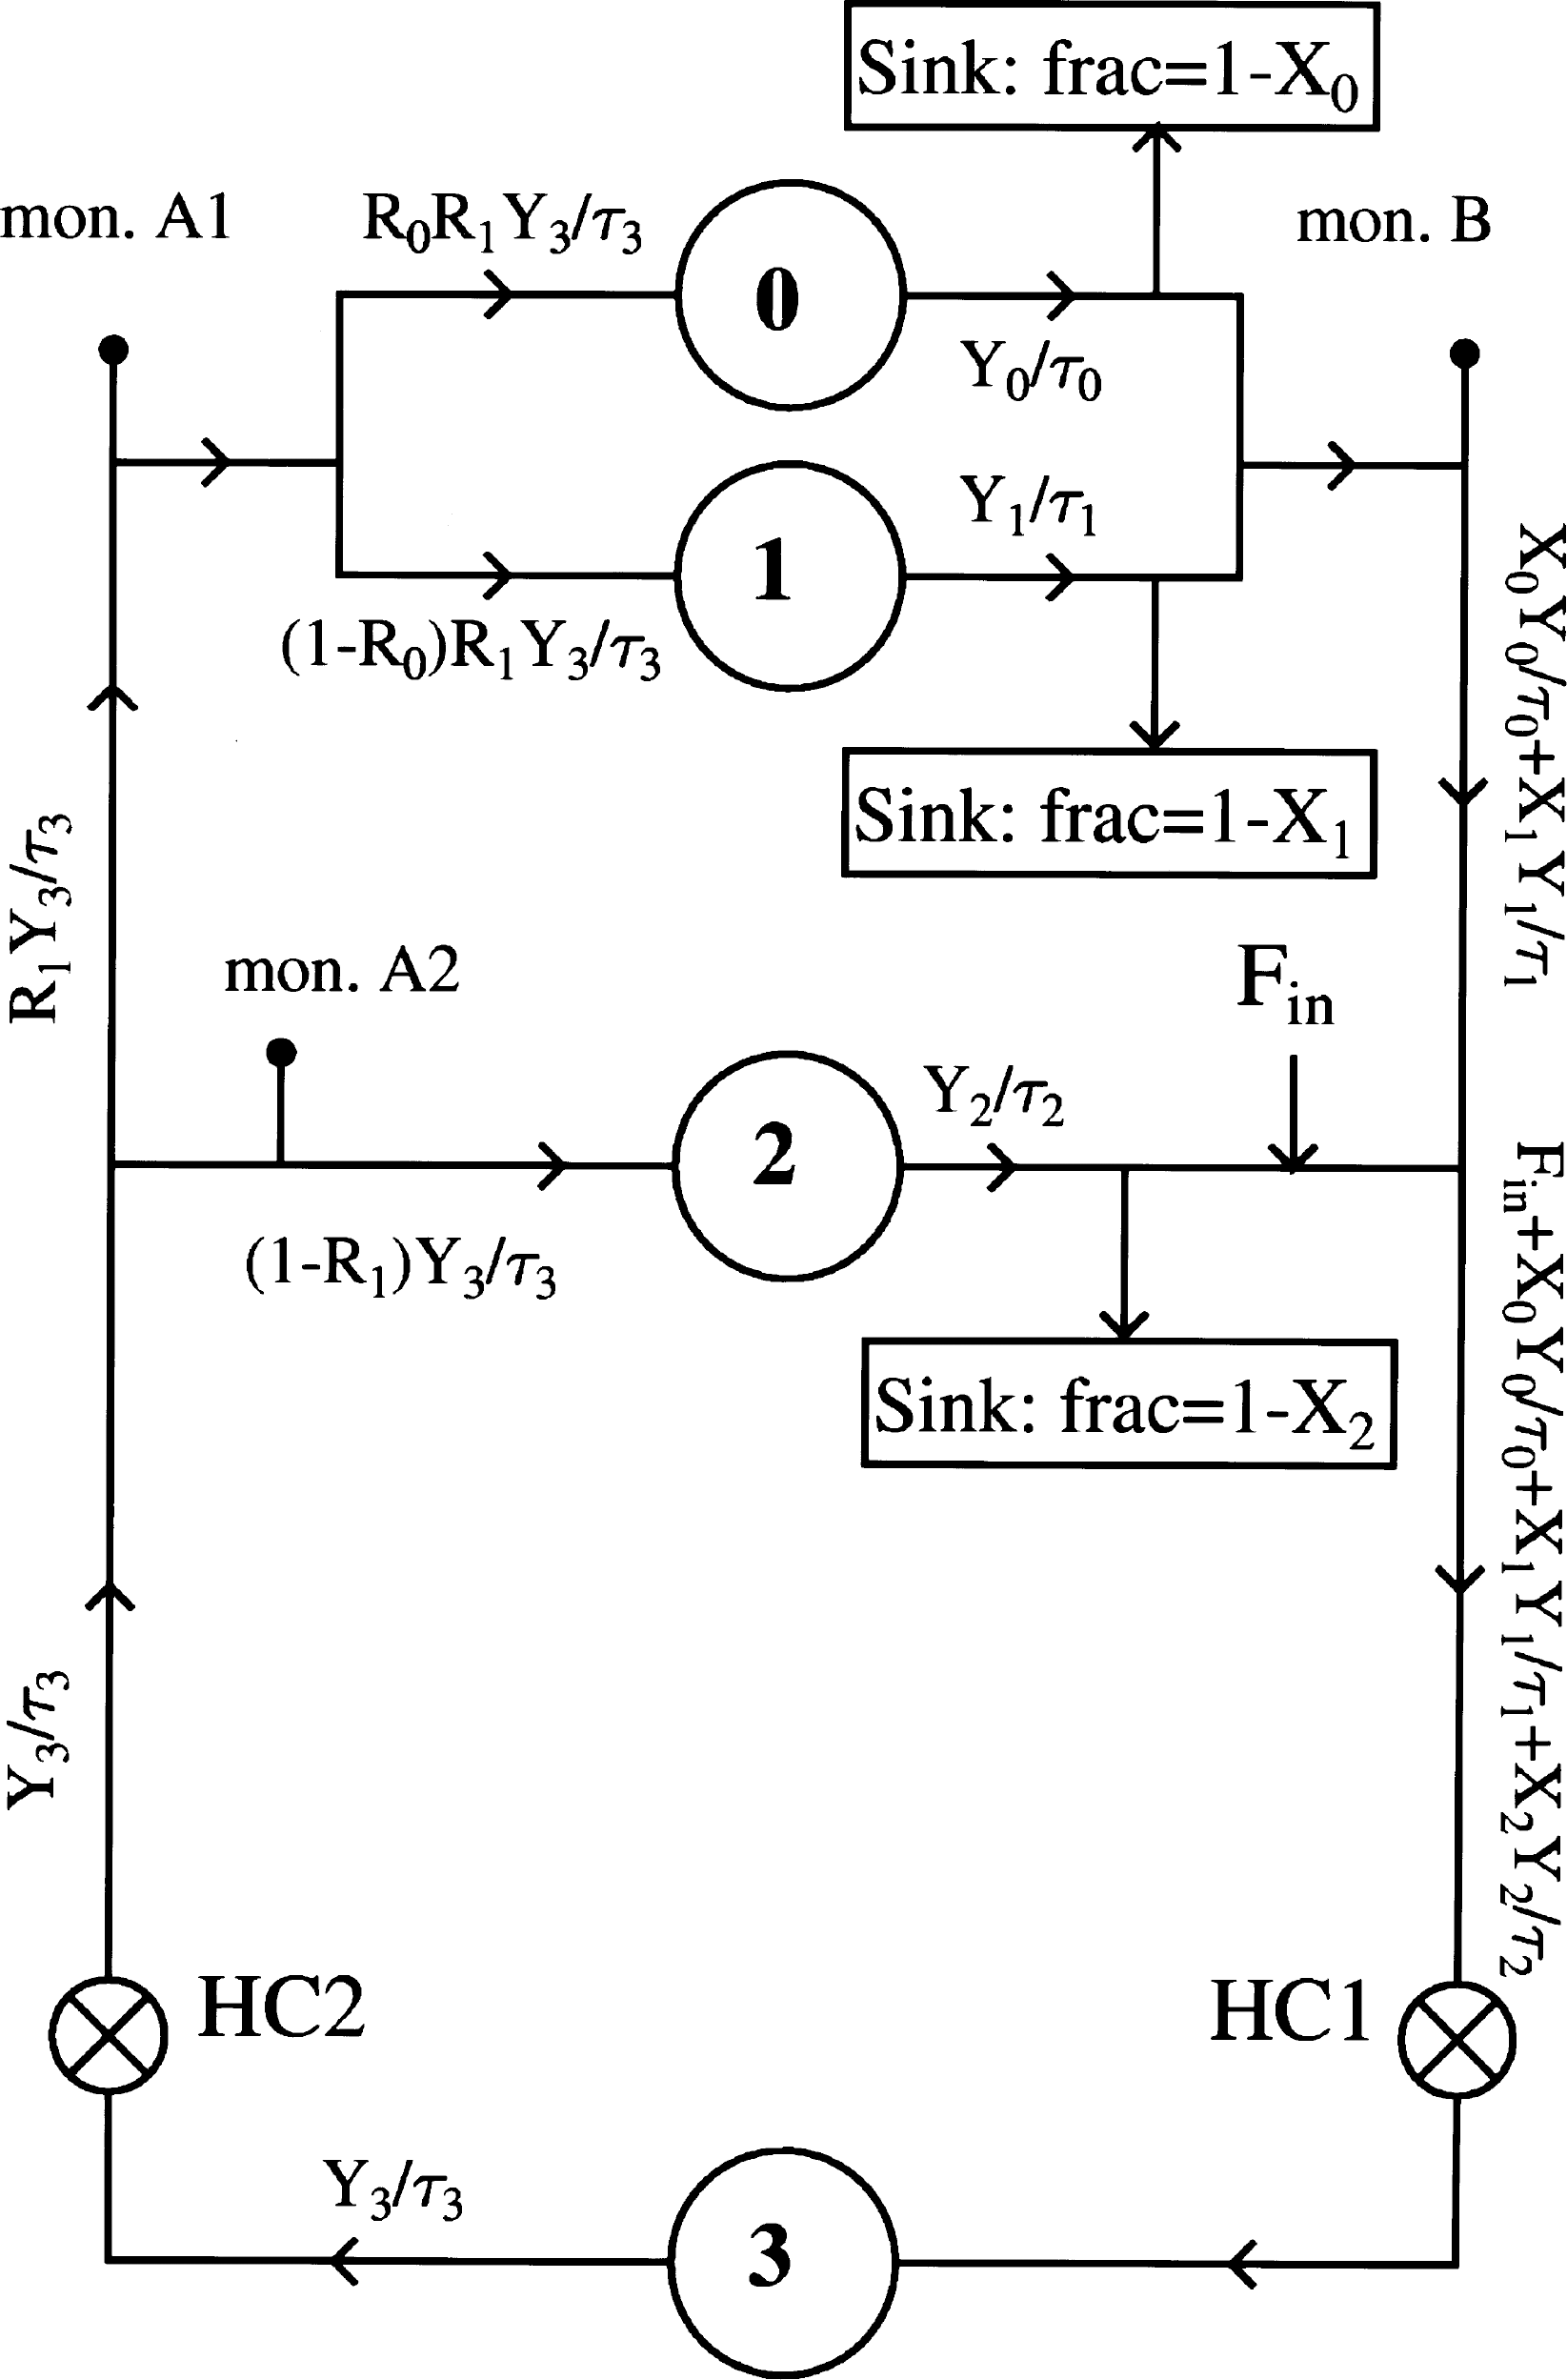
A graphic representation of the mathematical model. Reservoir 0 represents the head, and reservoir 1 represents the brain. Reservoirs 2 and 3 represent the parallel organs and the lungs, respectively. The lungs are placed in series with the rest of the body; the right (HC1) and the left heart chamber (HC2) are placed at both sides of reservoir 3. The lactate flux from the infusion into the body is represented by Fin. The breakdown of lactate in the different branches is simulated by Sinks, which absorb fractions 1 – X0, 1 – X1, and 1 – X2 of the respective lactate fluxes. The sink in branch 2 represents the liver. The arterial and venous ultrafiltration probes are situated at monitors A2 and B, respectively. For a detailed clarification, refer to the Materials and Methods section.
Denoting the lactate content (units: mmol) of reservoir k as Yk for k = 0, 1, 2, 3, then its time derivative is the difference between the lactate influx and the outflux:

Explicit dependence on time is suppressed in this notation, but here and in the following the time dependence will be understood for Yk and for the fluxes. We use the word “flux” for the lactate transport, expressed as mmol/min, to distinguish it from “flow” with dimension L/min, which will be reserved for the blood.
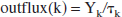
We make the working hypothesis that the lactate outflux will, at any time, be proportional to lactate content: outflux(k) Yk. The proportionality constant must have the dimension of an inverse time and we will denote it as 1/τk. Thus:
τk is a relaxation time, characteristic of the organ. It is the time after which the content Yk has fallen to 1/e of its value after the influx has been switched off. It is also the time after which Yk reaches a fraction (e–1)/e of its saturation value after switching on a constant influx. Hence, names such as rise time, decay time, or relaxation time are all appropriate.
Lactate is infused in the tail vein during a time Tinf. The injected lactate flux is given by:

where F0 will be expressed in mmol/min.
The oxygenated blood from the heart (flux = Y3/τ3) is divided into two streams: a fraction R1 flows to the head (reservoirs 0 and 1) via the carotid artery. R1 is set at 12% (Martini et al., 2001).
In the head, blood flows to the brain (reservoir 1) and to the rest of the head (reservoir 0). Denoting the split proportion of lactate as R0, the amount of lactate going into the brain (reservoir 1) is:

and the amount of lactate going to the rest of the head (reservoir 0) is:

The blood that did not flow into the head goes to the other organs (reservoir 2):

Metabolic breakdown of lactate mainly takes place in the liver (Naylor et al., 1984), which is part of reservoir 2. The metabolic breakdown is simulated by a Sink, placed after reservoir 2: a fraction X2 of the outflux remains in the bloodstream, but a fraction (1 – X2) of the lactate flux is removed from the circulation. To simulate the concentration-dependent uptake of the Sink, X2 is made time dependent:

where X2 = X20 before infusion and X2 → X20 + X21 at t → ∞. The time τS is the relaxation time of the Sink.
At time t >Tinf, there are two options: either to keep X2 constant at the value that it had reached at t = Tinf or to let it exponentially decay back to its base value X20. Calculations with both options were done and the differences were found to be minimal. We choose here for the former option and state:

Similarly, we put sinks behind reservoirs 0 (head) and 1 (brain), anticipating that they may also exhibit a metabolism for lactate. Their recycled fractions will be denoted as X0 and X1, respectively.
The amount of lactate flowing back to the heart and into the lungs is then:

Having established the expressions for all ingoing and outgoing fluxes, the following set of coupled linear differential equations has to be solved:


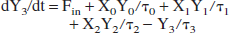
The model is numerically solved using the fourth-order Runge-Kutta method.
The ultrafiltration monitoring probes are placed in the jugular vein (monitor B) and in the arterial blood. Although we monitored in the aorta (monitor A2), we assume that the substrate concentration in the aorta is equal to the substrate concentration in the arteria carotis (a fictitious monitor A1). The ratio between the fluxes at A2 and A1 is (1 – R1)/R1. Thus, no matter where A2 is placed, the measured flux differs by a constant factor from the flux in monitor A1.
From the mathematical model, we can compute the blood flow. Lactate flux is calculated as

In our model, we calculate flux and scale it (scaleB) to numerically fit the measured concentration:

Equations 13 and 14 result in

which is the flow at the position of monitor B.
Distribution volume
During the infusion time, the influx exceeds the outflux for each of the reservoirs k. Hence, the total content of lactate, reached at t = Tinf, is
which is the integral form of Eq. 1 in the previous section. After closing the infusion, the reservoir returns to its normal state and the lactate is released:
To convert this excess content (which has dimension: mmol) to an effective volume occupied by the excess lactate, we divide Y(Tinf) by the average of the influx and the outflux (for arguments, see Calculations section) at time t = Tinf, and multiply it with the blood flow through the reservoir, BF(k).

In our model, the blood flows through the different organs are related to the total blood flow, BFtot, which goes through the heart, by:


Calculations
Because the number of parameters in our model is large, we first conducted a search with only a sink for reservoir 2, because the bloodstream through the organs that it represents is much larger than the bloodstream through the head and the brain together. Having found consistent sets of parameters for all three experiments, we then proceeded to adjust the fractions X0 and X1 that pass through the sinks 1 and 2. It was found that a sink in branch 0 did not optimize results, and hence we kept X0 = 1. On the other hand, the fit is slightly, but significantly, improved when allowing absorption of lactate flux in the branch that represents the brain. Best values for the three experiments are X1 = 0.65 (5-minute infusion), 0.75 (18-minute infusion), and 0.45 (80-minute infusion). The improvement is mainly in the first part of the descending curves, just after the infusion is stopped. This is understandable, because the relaxation time or decay time for branch 1 is short compared to branch 0. By selectively suppressing the efflux from reservoir 1, the net decay of the combined efflux, as measured by monitor B, is lengthened.
To calculate the distribution volume independently of the mathematical method, the area under the curve (AUC) after infusion was calculated from the deltas of the venous-arterial difference (thus minus baseline), taking the sum of the minute-to-minute delta concentrations. We assumed the curve to be divided into 1-minute-wide columns, in which the AUC is the sum of the height of these columns. The AUC after infusion was taken over a period of 60 minutes. The amount of lactate that has left the brain after infusion is described as AUC*blood flow. In our previous article, we explained the use of a blood flow of 1.5 mL·g−1·min because of anesthesia conditions (Leegsma-Vogt et al., 2003). Lactate can easily cross the blood–brain barrier (BBB) (Oldendorf, 1971; Lear and Kasliwal, 1991; Qu et al., 2000), implicating that brain lactate concentration rapidly equals with the blood concentration. We assume that there is a brain compartment that has the same lactate concentration as that of the blood at the end of infusion (thus before the gradual net efflux of lactate from the brain). The distribution volume is described as the ratio of the amount of lactate that left the brain via the venous route and the maximal brain concentration, thus, being the blood lactate concentration at the end of infusion. Both the highest arterial and jugular blood lactate levels were mostly close together, but for standardizing reasons the average blood concentration was chosen over, for example, the aorta or jugular concentration. The percentage deviation between measured and modeled curves was calculated per simulated experiment.
RESULTS
A graphic representation of a lactate infusion experiment is presented in Figure 1. Arrows indicate infusion start and ending. After infusion, a difference in the lactate decrease between the aorta and jugular vein can be seen.
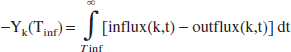
Examples of measured versus modeled curves are displayed in Figure 3, with the accompanying parameters used to model the three experiments in Table 1. The deviation between the calculated and measured curves is less than 35%, with the largest difference in the descending component of the 18-minute infusion experiment (all others are less than 10%). For the 5-minute infusion experiment, the deviation is 8.4 ± 17.9% in the aorta, and 5.2 ± 9.7% in the jugular vein. In the 18-minute infusion experiment, the relative difference is 33.1 ± 34.8% for the aorta and 9.7 ± 11.5% for the jugular vein; finally, in the steady-state experiment of 80 minutes, the deviation is 5.7 ± 6.3% for the aorta and 4.2 ± 4.9% for the jugular vein.
The fitting of our mathematical model in three lactate infusion experiments, of 5-minute infusion
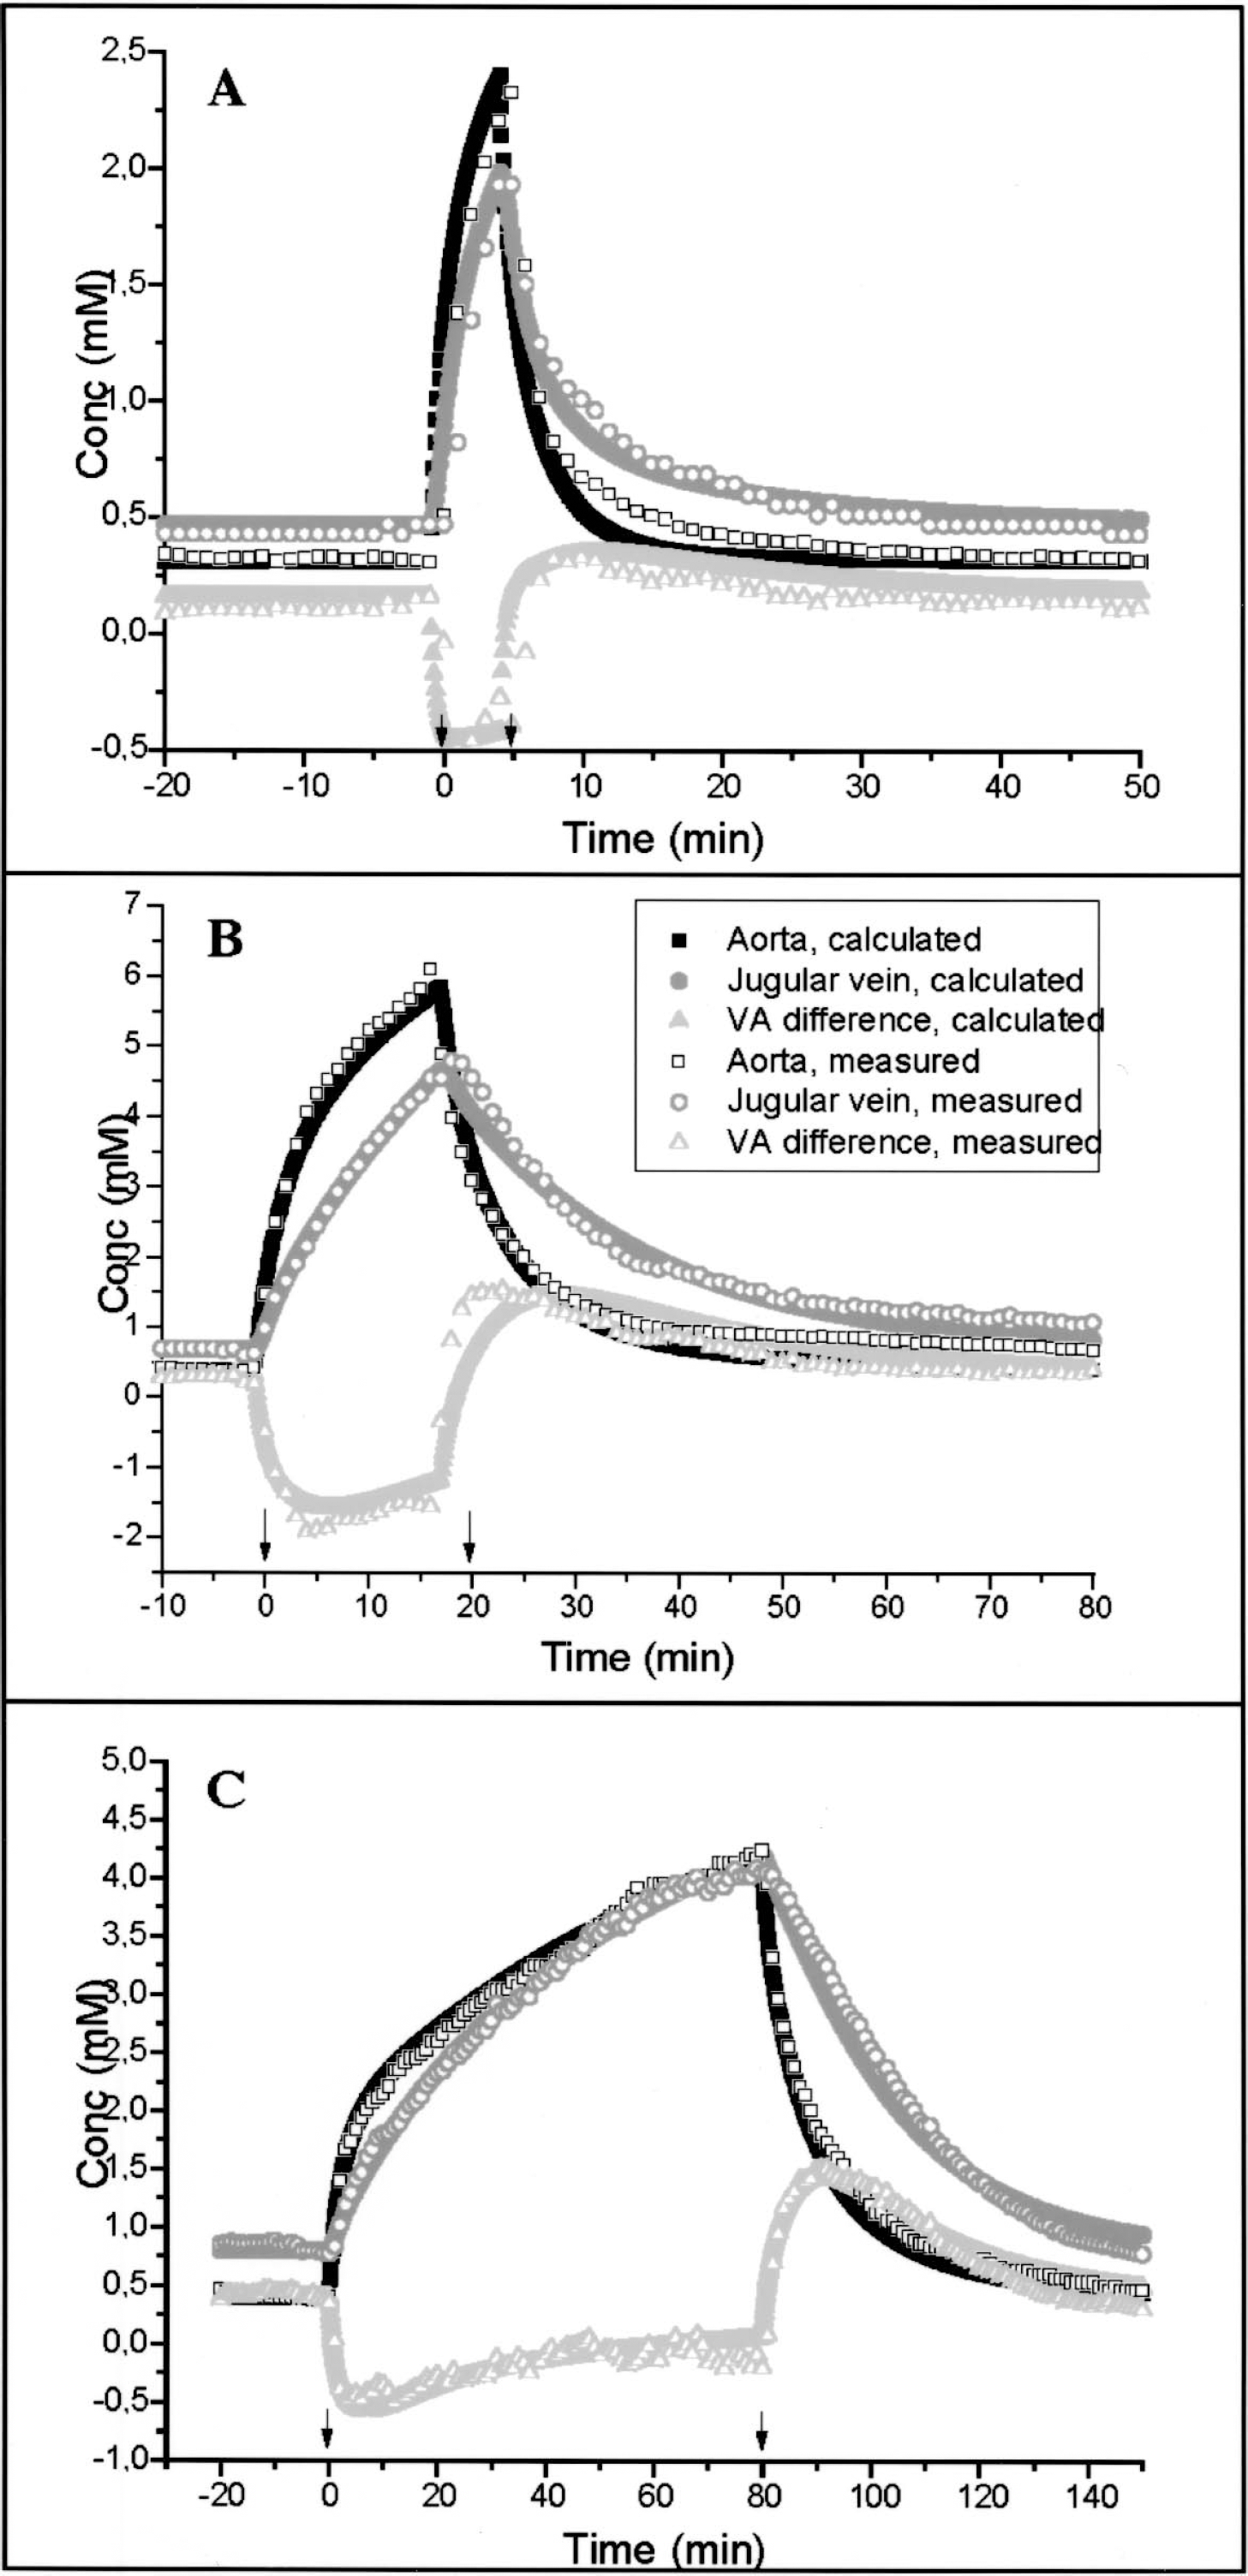
Parameters used for the mathematical description of the lactate infusion experiments
Besides the experiment-related parameters (e.g., infusion time), only the model-related parameters τ2, τ3 and R0 differ slightly between experiments.
For the calculation of the distribution volume, we approximate BFtot = 10 mL/min.
Then, using the same parameters as for the 18-minute infusion experiment, and the calculations as mentioned in the Materials and Methods section: Next we use the same parameters for the 18-minute infusion experiment and the method to calculate the distribution volumes are described. We find that each of the defined distribution volume rises to its saturation value with its own characteristics rise time τk (Fig. 4). The saturation levels are as follows: reservoir 0: 10.3 mL, reservoir 1: 0.24 mL, reservoir 2: 17.5 mL, and reservoir 3: 19.6 mL. The position of monitor B in the jugular vein measures the sum of the outfluxes of reservoirs 1 and 2. Because reservoir 1 represents only a very small distribution volume as compared to reservoir 0, the experimental points, measured with the model-independent AUC method, essentially measure the distribution volume of the reservoir 0. Because both Yk, and the average of the ingoing and outgoing fluxes, are proportional to the infusion rate, the distribution volume does not depend on infusion rate; therefore, the 80-minute infusion is also incorporated.
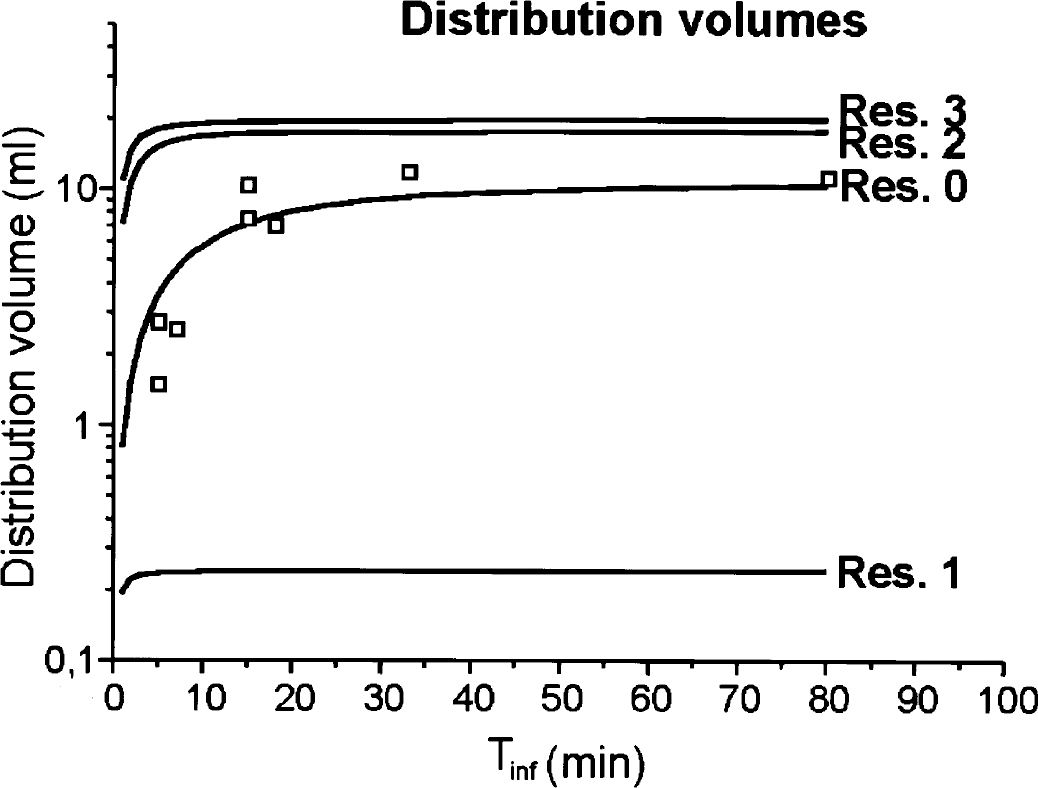
The modeled distribution volumes in relation to the infusion time (solid lines), and the calculated distribution volume from the measured area under the curve (AUC) (open squares). We find that each of the defined distribution volumes rise to their saturation value with its own characteristic rise time τk. The saturation levels are the following: reservoir 0, 10.3 mL; reservoir 1, 0.24 mL; reservoir 2, 17.5 mL; reservoir 3, 19.6 mL. The brain, represented by reservoir 1, has a distribution volume of 24% per gram tissue. The position of monitor B in the jugular vein measures the sum of the outfluxes of reservoirs 1 and 2. Because reservoir 1 represents only a very small distribution volume as compared to reservoir 0, the experimental points, measured with the model-independent AUC method, essentially measure the distribution volume of reservoir 0.
As described in our mathematical model, the blood flow is calculated as the reciprocal of ScaleB. For our modeled experiments, this gives a blood flow of 5.1 mL/min (5-minute infusion), 3.4 mL/min (18-minute infusion), and 3.9 mL/min (80-minute infusion).
DISCUSSION
Some methodologic aspects
For a thorough discussion on the potential of the monitoring methodology, we refer to our previous publication (Leegsma-Vogt et al., 2003). For details concerning specificity, sensitivity, and speed of the lactate and glucose detection, we refer to earlier reports (Kaptein et al., 1997; Rhemrev-Boom, 1999; Tiessen et al., 1999, 2001; Leegsma-Vogt et al., 2001; Savenije et al., 2003). Elevated lactate levels as found in our study are within physiologic range found during exercise in humans (Ide et al., 2000) and rats (Fregosi and Dempsey, 1984).
After the lactate infusion, both arterial and venous glucose concentrations are significantly elevated, although the VA glucose difference is not significantly changed. This increase in blood glucose may be caused by gluconeogenesis from lactate by the liver (Bouzier et al., 2000; Brooks, 2000).
Lactate infusion can disturb the acid–base balance (Hood and Tannen, 1998) and cerebral blood flow (CBF). High lactate may initially cause a low blood pH, followed by an alkalization (Gladden and Yates, 1983). Above an infusate pH of 4.4, alkalization predominates (Gladden and Yates, 1983); optimal respiration may reduce the alkalization. Alkalosis could decrease lactate production (Buchalter et al., 1989), clearance (Hetenyi Jr. et al., 1988), and transport across the BBB (Oldendorf et al., 1979). The effect of lactate on CBF is in our opinion unresolved: lactate infusion showed a 20% increase in CBF in normal control subjects (Stewart et al., 1988), whereas another study found no significant effect of lactate on CBF in nonpanicking patients or control subjects (Reiman et al., 1989). Halothane probably does not influence lactate metabolism directly (Johnstone et al., 1976; Becker, 1990), but cerebral metabolism is reduced during halothane anesthesia (Sibson et al., 1998; Alkire et al., 1999; Attwell and Laughlin, 2001), and CBF increased (Verhaegen et al., 1992; Kuroda et al., 1997; Linde et al., 1999; Paut and Bissonnette, 2001). Possible effects of lactate infusion on, for example, lactate production, clearance, or CBF will be equal in the aorta and jugular vein, because the brain is unable to expand in volume, and all jugular blood is forced via the probed jugular vein as one jugular vein is ligated. Thus, possible physiologic changes do not influence the VA results. The parameters of our computational model are apparently independent of the lactate infusion time. Therefore, we conclude that the kinetic parameters are independent of physiologic changes caused by the lactate infusion.
The jugular vein carries blood from extracerebral tissue, such as the facial muscles and the front limb, as well. During anesthesia, these contributions to metabolism are small compared to those of the brain; however, the distribution volume of the extracerebral tissue cannot as easily be ignored. Our model calculates the percentage cerebral and extracerebral lactate distribution. Evidence that the brain contributes to jugular venous lactate was reported previously, because jugular lactate was affected by acute brain injury (Leegsma-Vogt et al., 2001).
Lactate kinetics
By using a mathematical method, the arterial and venous infusion curves of lactate were satisfactorily described. With this method we can reasonably fit the increasing and decreasing phase of the lactate curve during and after lactate infusion.
There have been other attempts to model lactate kinetics, after lactate infusion (Connor et al., 1982) and exercise (Zouloumian and Freund, 1981; Freund and Zouloumian, 1981; Oyono-Enguelle et al., 1989; Freund et al., 1990), describing the ascending and descending lactate curve after lactate infusion (Connor et al., 1982), or only the recovery period (Zouloumian and Freund, 1981; Freund and Zouloumian, 1981; Oyono-Enguelle et al., 1989; Freund et al., 1990) after exercise. Although the recovery period can be quite simply fitted by two exponential elimination curves [unpublished results, and (Zouloumian and Freund, 1981; Freund and Zouloumian, 1981; Oyono-Enguelle et al., 1989; Freund et al., 1990)], and is explained as the exchange and removal of lactate by the body (Connor et al., 1982; Freund et al., 1989; Chiolero et al., 1999), the incorporation of the ascending lactate curve in a mathematical model requires a different approach. Connor et al. (1982) modeled the arterial lactate curve by assuming two compartments for lactate, one representing a blood compartment with a Sink, the other being a reversible lactate-exchanging compartment. In our model, however, we incorporated both arterial and venous lactate curves, and created a more physiologic model by including various discrete compartments. We separately described the brain and the extracerebral tissue, and distinguished between the lungs, which are in series with the blood flow through the heart, and the other parallel placed organs. The Sink represents the elimination of lactate from the body, which mainly takes place in the liver via MCT1 or MCT2 transporters (Naylor et al., 1984; Jackson et al., 1997; Halestrap and Price, 1999), but also the kidney, the myocardium, and skeletal muscle may utilize lactate (Freyschuss and Strandell, 1967; Spitzer, 1974; Gladden and Yates, 1983; Naylor et al., 1984; Buchalter et al., 1989). Also, a small Sink could be placed in the brain compartment.
The parameters that allowed description of the concentrations of lactate during the lactate infusion curves are quite similar between the three example experiments. In the other four experiments, essentially the same parameters were found (results not shown). Besides differences in experiment-related parameters (e.g., infusion time), there are differences in the rise/decay time of the organs and lungs (τ2 and τ3), the fraction of lactate passing through reservoir 0 (R0), and the scale factors for the aorta (ScaleA) and jugular vein (ScaleB). The stability of the system-related physiologic parameters (thus not infusion related) over various infusion times is an indication for the consistency of the computational model.
From our model, we can calculate the blood flow at monitor B (the jugular vein). Our modeled experiments revealed a blood flow between 3.4 and 5.1 mL/min, which is in the same range but somewhat higher than the blood flow calculated under anesthesia [1.5 mL · g−1 · min−1, averaged from (Verhaegen et al., 1992; Linde et al., 1999)], as reported in Leegsma-Vogt et al. (2003). Considering we modeled lactate kinetics, the blood flow calculations fit remarkably well, again indicating the consistency and applicability of our model. The calculated higher blood flow may indicate that the jugular blood in our experiments is not exclusively derived from the brain.
Our model allows us to better describe lactate kinetics, and explains the delayed release of lactate from the head into the jugular vein. We initially tried to model the efflux of lactate from the brain with solely a cerebral compartment (reservoir 1), but this did not fit well for the longer infusion times. Adding the extracerebral head-compartment (reservoir 0) solved this problem, indicating that the lactate uptake by extracerebral tissue becomes more important during longer infusion times. The higher fraction of lactate passing through reservoir 0 in the two experiments with longer infusion times (18 and 80 minutes) illustrates the increasing importance of extracerebral tissue during extended infusions. The significance of reservoir 0 was also found from the modeled and calculated distribution volumes. The amount of lactate distributed in the head increases with infusion time, resulting in a distribution volume that exceeds the cerebral volume, implying that lactate is distributed into other tissue in the head as well. Because the animal is under anesthesia, and muscles, for example, are at rest, the blood flow through the brain is relatively large as compared to the rest of the head. This suggests that lactate is first selectively dispersed in the brain, and then in other tissue. Thus, when the infusion time is very short, most if not all lactate would distribute in the brain. With a saturation level of 0.24 mL in reservoir 1, we suggest that lactate can be dispersed into 24% per gram brain volume.
In our previous paper (Leegsma-Vogt et al., 2003), we concluded that lactate does not replace glucose as a cerebral metabolic substrate, and that there is hardly any net lactate use by the brain because 89% of the lactate moving into the brain during infusion is released afterwards. It was suggested that the 11% lactate taken up by the brain is either not metabolized, or if metabolized, not used for energy consumption (e.g., converted to alanine). However, this should not be interpreted as suggesting that there is no (small) cerebral metabolism for lactate (Leegsma-Vogt et al., 2003). Although our lactate kinetics model appeared possible without including a cerebral Sink, a better fit was created by including a cerebral Sink, indicating that part of the lactate uptake found in our previous study could indeed be used as a metabolic substrate. In this case, a fraction of about 40% of the lactate may disappear via such a cerebral sink. The lactate entering the brain via the circulation may be used for intracerebral trafficking and metabolism of lactate (Pellerin et al., 1998; Pellerin and Magistretti, 2003), when excitatory transmission (Attwell and Laughlin, 2001) requires a high energy demand. It should, however, again be emphasized that such accumulated lactate does not necessarily replace glucose as an energy substrate. This is in particular not possible when intracerebral levels of lactate become high relative to those in the blood circulation. In that case, at least a portion of lactate formed in astrocytes as the result of high glutamate transmission may leave the brain essentially unmetabolized.
In conclusion, a detailed model of lactate kinetics during and after lactate infusion is described. The model is compatible with the existence of a lactate exchange compartment in the rat brain. Such lactate exchange implies that excessive lactate may leave the brain, whereas during high blood levels, lactate accumulates in the brain. The cerebral distribution volume of lactate is approximately 24%, and probably may be confined to astroglia. Lactate exchange is not an exclusive property of the brain: lactate pools are present in many other organs and tissue as well, and are dependent on bi-directional transporters of lactate.