
Abstract
A microfluidic system for the enrichment of biological particles, operating on the principle of dielectrophoresis (DEP), is presented. Through the use of a unique manifestation of DEP, contactless DEP (cDEP), this system illustrates the potential to sidestep the common trade-off between sample throughput and selectivity without the need of a complicated fabrication process. The ability to concentrate particles from a sample fluid is validated experimentally through the concentration of 2-μm polystyrene beads and live THP-1 human leukemia cells from a heterogeneous media solution. Finite element analysis of the electric field within the microfluidic channel of the device allows for the determination of effective experimental parameters and accurate predictions of a particle's trajectory through the device. The concentration of particles combined with a fabrication procedure conducive to mass production makes cDEP an attractive alternative to current sample enrichment technologies.
Introduction
The selective separation of target particles from a sample solution is an indispensable step in many laboratory processes. 1 Sensitive analysis procedures, especially those in the biomedical field, often require a concentration procedure before any analysis is performed. Several methods to perform this concentration have been arisen, including density gradient-based centrifugation or filtration, 2 fluorescent and magnetic activated cell sorting, cell surface markers, 3 and laser tweezers. 4 Although each of these techniques is unique in its inherent advantages and disadvantages, all are forced to compromise between high sample throughput and highly specific isolation. The more selective of these techniques often requires extensive sample preparation before being performed. If the automation of laboratory analysis procedures is to be facilitated, a concentration technique capable of high sample throughput and highly specific concentration is critical.
Dielectrophoresis (DEP), or the motion of a particle because of its polarization in a nonuniform electric field, has shown great potential as a method for sample concentration. 5,6 Typically, sample concentration through DEP involves the placement of an array of interdigitated electrodes under a microfluidic channel through which the sample fluid passes. This electrode array creates a nonuniform electric field in the channel with which the passing cells or microparticles interact. DEP-based concentration techniques benefit from the fact that particles are isolated based on their physical characteristics, allowing these techniques to be extremely specific without extensive sample preparation.
Microdevices using interdigitated electrode arrays have proven the technique to be a viable method to rapidly and reversibly isolate cells and microparticles from a solution. Examples of the successful use of DEP include the separation of human leukemia cells from red blood cells in an isotonic solution 7 and the entrapment of human breast cancer cells from blood. 8 DEP has additionally been found effective to separate neuroblastoma cells from HTB glioma cells 9 ; to isolate cervical carcinoma cells 10 and K562 human chronic myelogenous leukemia cells 11 ; and to separate live yeast cells from dead cells. 12
Unfortunately, by requiring the fabrication of an electrode array within the microfluidic channel, traditional DEP does not lend itself to mass fabrication techniques, such as injection molding. Insulator-based DEP (iDEP) seeks to simplify the fabrication required to perform DEP-based concentration to facilitate more widespread usage. iDEP relies on the presence of insulating structures in the microfluidic channel to create nonuniformities in the electric field necessary for DEP. 13,14 These insulating structures are typically patterned in the same process as the microfluidic channel itself; thus, iDEP naturally lends itself to mass production systems, such as injection molding and hot embossing. 15 iDEP has been demonstrated in combination with other forms of on-chip analysis, such as impedance detection, 16 to form fully integrated systems.
Although iDEP provided an excellent solution to the complex fabrication required by traditional DEP devices, it is difficult to use for biological fluids. The high electric field intensity used by iDEP produces undesirable results, such as joule heating, bubble formation, and electrochemical effects, when the sample solution is of high conductivity. 17 In addition, the electrode placement at the channel inlet and outlet necessitates the presence of large reservoirs at these locations to mitigate electrolytic effects. These reservoirs have the negative consequence of re-diluting the sample after it has passed through the region of concentration, further complicating the extraction of a sample for off-chip analysis. For DEP to truly represent an attractive alternative to traditional sample-concentration techniques, it must be devoid of these negative influences on the sample and yet retain a simplified fabrication process.
A third manifestation of DEP, contactless DEP (cDEP), uses the simplified fabrication processes of iDEP yet lacks the problems associated with the electrode—sample contact. 18 cDEP relies on reservoirs filled with highly conductive fluid to act as electrodes and provide the necessary electric field. These reservoirs are placed adjacent to the main microfluidic channel and are separated from the sample by a thin barrier of a dielectric material as shown in Figure 1H. The application of a high-frequency electric field to the electrode reservoirs causes their capacitive coupling to the main channel, and an electric field is induced across the sample fluid. Similar to traditional DEP, cDEP exploits the varying geometry of the electrodes to create spatial nonuniformities in the electric field. However, by using reservoirs filled with a highly conductive solution, rather than a separate thin-film array, the electrode structures used by cDEP can be fabricated in the same step as that of the rest of the device; hence, the process is conducive to mass production. 18

(A—F) Schematic of the fabrication process. Steps A through D are followed only once in clean room to create a master stamp. Steps E and F are repeated to produce an indefinite number of experimental devices out of clean room and in lab. (G) SEM image of the silicon wafer mold at the trapping zone. (H) Color image of the fabricated device. The main and side channels were filled with dyes to improve imaging.
A cDEP device is presented that demonstrates the enrichment abilities and rapid fabrication advantages of the cDEP technique. A microfluidic device was fabricated by creating a polydimethylsiloxane (PDMS) mold of a silicon master produced by a single-mask photolithographic process. This device has shown the ability of cDEP to separate live cells from dead, 19 a powerful capability of the DEP systems. 20 24
To demonstrate the concentration abilities of cDEP, this microfluidic device was used to enrich THP-1 human leukemia cells and 2-μm polystyrene beads from a background media. The device exhibited the ability to concentrate THP-1 cells through positive DEP and 2-μm beads through negative DEP. This is the first cDEP microfluidic device presenting negative DEP. Furthermore, the use of a silicon master stamp allows for the large-scale reproduction of the device. These experiments illustrate that the use of cDEP as an expedited process for sample concentration and enrichment may have an immense impact in biomedical and homeland security applications, where rapid accurate results are extremely valuable.
Theory
The time-average DEP force acting on a spherical particle exposed to a nonuniform electric field is described as follows 1,5,6,25 :

where ɛ

where  and
and  are the particle and the medium complex permittivities, respectively. The complex permittivity is defined as follows:

where ɛ is the permittivity, à is the conductivity,

where
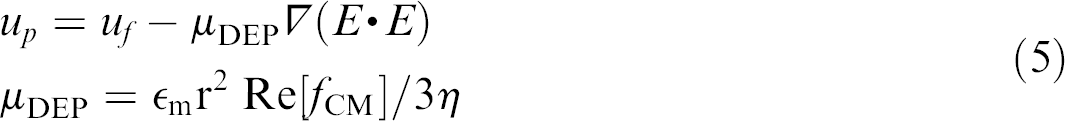
The aforementioned equations are valid for spherical microparticles; however, others have demonstrated that similar equations can be attained for other geometries, for example, cylindrical particles. 26 In addition, researchers have used elegant shell models to determine an effective and equivalent complex conductivity for a particle consisting of several layers, for example, a cell. 27,28
The DEP force on a particle may be positive or negative depending on the relationship of the applied frequency with the particle's DEP crossover frequency. DEP crossover frequency is the frequency at which the real part of the CM factor is equal to 0 and is given by 1,29
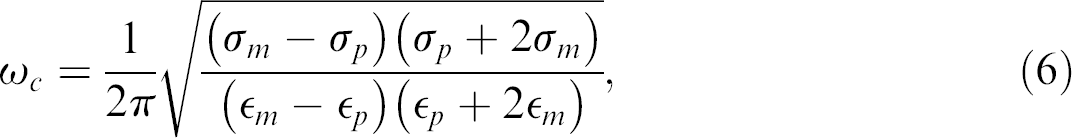
where ω
Methods
Microfabrication
Deep reactive ion etching (DRIE) was used to etch a < 100 > silicon wafer to a depth of 50 μm (Fig. 1A–D) to form the master stamp. Oxide was then grown on the silicon master using thermal oxidation and removed using hydrofluoric acid to reduce surface “scalloping” caused by the DRIE process. This variation in the surface can greatly inhibit the removal of the cured mold from the stamp.
Liquid PDMS used for the molding process was composed of PDMS monomers and a curing agent in a 10:1 ratio (Sylgrad 184; Dow Corning, Midland, MI). The mixture was degassed in a vacuum for 15 min. The degassed PDMS liquid was then poured onto the silicon master and cured for 45 min at 100 °C (Fig. 1E). The solidified PDMS was removed from the mold, and fluidic connections to the channels were punched with 15-gauge blunt needles (Howard Electronic Instruments, El Dorado, KS). Cleaned glass microscope slides and the PDMS replica were bonded (Fig. 1F) after exposure to air plasma for 40 s in a plasma cleaner (PDC-001, Harrick Plasma, Ithaca, NY). An SEM image of the trapping zone of the device replica on the silicon master is shown in Figure 1G. Figure 1H shows the fabricated device at the zone of trapping. The main and electrode channels were filled with yellow and blue dyes, respectively, to improve imaging of the fluidic structures. A schematic with dimensions is presented in Figure 2. The thickness of the PDMS barrier between the side channels and the main channel is 20 μm.

(A) A PDMS mold from a silicon master stamp containing multiple microfluidic devices. (B) Two-dimensional schematic of the device with straight main channel used in this study. The channel depth is 50 μm.
Cells/Beads and Buffer
Live samples of THP-1 human leukemia monocytes were washed twice and resuspended in the buffer we prepared (8.5% sucrose [wt./vol.], 0.3% glucose [wt./vol.], and 0.725% [wt./vol.] RPMI) 30 to achieve 106-cells/mL concentration. The electrical conductivity of the buffer was 130 μS/cm and was measured with a Mettler-Toledo SevenGo pro conductivity meter (Mettler-Toledo, Inc., Columbus, OH) to ensure that its conductivity was 130 μs/cm. These cells were observed to be spherical, with a diameter of ∼ 13 μm when in suspension.
Carboxylate-modified polystyrene microspheres (Molecular Probes, Eugene, OR) having a density of 1.05 mg/mm3 and diameters of 2 and 10 μm were used at a dilution of 2:1000 from a 2% by weight stock suspension. Bead suspensions were sonicated between steps of serial dilution and before use. The background solution was deionized water with a conductivity of 86 μs/cm.
Live THP-1 cells were stained using cell trace calcein red-orange dye (Invitrogen, Eugene, OR). The stained cell sample and the 10-μm beads sample were mixed in a ratio of 1:1.
Experimental Setup
The microfluidic devices were placed in a vacuum jar for 30 min before experiments to reduce problems associated with priming. Pipette tips inserted in the punched holes were used as reservoirs to fill the side channels with phosphate buffered saline (PBS). Pressure-driven flow was provided in the main channel using a microsyringe pump. Inlet holes punched along the main channel of the device were connected to syringes through Teflon tubing (Cole-Parmer Instrument Co., Vernon Hills, IL). Once the main channel was primed with the cell suspension, the syringe pump was set to 1 mL/h, steadily decreasing the flow rate to 0.02 mL/h (20 μL/h) equivalent to a velocity of ∼ 550 μm/s. This flow rate was maintained for 1 min before experiments. An inverted light microscope equipped with color camera (DFC420, Leica DMI 6000B; Leica Microsystems, Bannock-burn, IL) was used to monitor the cells flowing through the main channel. High-frequency electric fields were provided by a wideband, high-power amplifier and transformer combination (Amp-Line Corp., Oakland Gardens, NY), and signal generation was accomplished using a function generator (GFG-3015; GW Instek, Taipei, Taiwan).
Numerical Modeling
The electric field distribution and its gradient ▽
Results
Numerical modeling was used to determine relevant experimental conditions, such as applied voltage and frequency. Experimental values for the voltage and frequency must be chosen to provide sufficient DEP force on the target particles without exceeding the dielectric breakdown voltage of the PDMS barriers (280 V for a 20-μm barrier). Because of the capacitive properties of the thin PDMS barrier between the side channels and the main channel, the induced electric field inside the main channel is strongly dependent on the frequency and the applied voltage. Hence, a minimum frequency is required to provide a strong gradient of the electric field with respect to a specific voltage for microparticle manipulation. A 70-Vrms sinusoid at 300 kHz was found to provide significant DEP force in the microfluidic channel without damaging the device. This excitation signal was applied to the top two electrodes (electrodes 1 and 2 in Figure 2), and the bottom two electrodes were grounded (electrodes 3 and 4 in Figure 2). The electric field intensity surface plot in the main channel of the device at the experimental parameters is shown in Figure 3A. It is important to note that the electric field intensity does not reach 0.1 kV/cm, which is not strong enough to kill cells through irreversible electroporation. Electroporation is a phenomenon that increases the permeabilization of the cell membrane by exposing the cell to an electric field. 31 33 In irreversible electroporation, permanent pores open up in the cell membrane, which leads to cell death. 32,34

(A) Electric field intensity (V/m) surface plot. (B and C) The gradient of the electric field squared (▽(E·E)) (kg2mC−2S−4) surface plot. V1 = V2 = 70 Vrms at 300 kHz and V3 = V4 = ground.
The trapping regions and the cell's trajectory through the microfluidic device can be predicted using the numerical modeling, as DEP cell manipulation is strongly dependent on the gradient of the electric field. The highest gradient of the electric field is estimated to appear at the edges of the side channels, as shown by the numerical results found in Figure 3B. However, there is still a sufficient gradient of the electric field at the middle of the channel to manipulate the microparticles. To clarify this, the same numerical results for the gradient of the electric field surface plot, but with a different scale bar, are shown in Figure 3C.
The DEP force acts on the cell/microparticle in both x and y directions. The gradient of the

Numerical results: (A) Line plot of the
The effect of varying the electrode configuration on the gradient of the electric field along the centerline of the main channel was also investigated. Four different configurations with the same applied voltage and frequency were studied, and the results are shown in Figure 5. The DEP effects caused by having electrodes 1 and 2 charged and electrodes 3 and 4 grounded (case 1) are similar to the configuration with electrodes 1 and 4 charged and electrodes 2 and 3 grounded (case 3). The same can be said for the cases with electrodes 1, 2, and 4 charged (case 2) and electrode 3 grounded or electrode 1 charged and electrode 2 grounded (case 4). The surface plot of the gradient of the electric field with respect to these four cases of the electrode configurations is shown in Figure 5B.

The gradient of the electric field intensity along the centerline of the main channel for different electrode configurations. The electrodes are charged with 70 Vrms and 300 kHz in the side channels in all cases. Case 1: charged electrodes are in channels 1 and 2, and ground electrodes are in channels 3 and 4; case 2: charged electrodes are in channels 1, 2, and 4, and ground electrodes are in channel 3; case 3: charged electrodes are in channels 1 and 4, and ground electrodes are in channels 2 and 3; and case 4: single charged electrode in channel 1 and single ground electrode in channel 2.
These numerical results indicate that the electrode configuration has a substantial effect on the gradient of the electric field and the resulting DEP cell manipulation. A benefit of this analysis is that one may change the cell/particle manipulation strategy by changing the electrode configurations. For example, the configuration used in case 4 (electrodes on just one side of the main channel) can deflect the target cell/particle trajectory in the main channel, so that it leads to a specific reservoir.
The validity of the numerical modeling was confirmed by demonstrating the system's ability to concentrate particles through both positive and negative DEP. Live THP-1 cells were observed to be trapped efficiently because of positive DEP force at

Experimental results: bright field image of live THP-1 cells shown here 30 s after applying the electric field (
The selectivity of the device to differentiate two different particles with almost the same size was also examined through separation of THP-1 cells from 10-μm beads. The THP-1 cells were observed to be trapped at 70 Vrms and 300 kHz, and the 10-μm beads went through the main channel without significant DEP disturbance (Fig. 7). However, to increase the trapping efficiency, the voltage and/or frequency of the applied signal should be increased in such a way that the particles passing through the middle of the channel experience strong DEP effect. At these higher voltage/frequencies, we observed that both cells and beads close to the channel walls were trapped, reducing the device's selectivity. We attribute this effect to the nonuniform gradient of the electric field across the main channel and between the side channels.

Experimental results: selective trapping of live THP-1 cells (red) from a mixture also containing 10-μm polystyrene beads (blue). THP-1 live cells were stained using cell trace calcein red-orange dye. (A) Cells and beads are moving from right to left because of pressure-driven flow. (B) THP-1 cells are trapped by means of dielectrophoresis, and beads are passing through the trapping zone. Charged electrodes are in channels 1 and 2 (
Particle concentration through negative DEP was displayed using 2-μm beads suspended in deionized water at

Experimental results: trapping 2-μm beads suspended in DI water (
Discussion
The use of a straight channel in this design has several advantages over more complicated configurations. The trajectory of a particle, without DEP influence, is easily predicted, and the lack of detailed features simplifies production and replication of the devices. This same lack of complicated features in the channel helps to mitigate fouling effects caused by cell trapping. However, it should be noted that the DEP effect may be reduced significantly at the middle of the channel for wider channels. One method of addressing this negative effect is to use insulating structures inside the main channel. These structures distort the electric field and provide a sufficient gradient for DEP manipulation of cells passing through the center of the channel. These types of designs may help to increase the throughput and trapping efficiency of cDEP devices.
The device presented in this article exhibited the concentration of microparticles at specific trapping regions within the device during the application of an electric field. The removal of this electric field allows the trapped cells to flow from the device at an increased concentration, and these cells may be diverted to a separate reservoir off chip. This “trap and release” concentration strategy can also be incorporated with on-chip analysis systems by diverting the concentrated group of cells into a side channel, as has been illustrated with iDEP. 16
Forthcoming generations of cDEP devices may also use a “chip and manifold” configuration relying on disposable injection molded “chips” inserted into a reusable manifold containing the necessary fluidic and electrical connections. This arrangement would allow metal electrodes in the manifold to be reused for thousands of experiments while shifting the manufacturing burden to the replication of inexpensive fluidic chips. This use of polymer chips manufactured through hot embossing has been demonstrated previously for iDEP. 16
Conclusion
A microfluidic system was presented that illustrates the great potential for DEP-based concentration of biological particles without negative effects on the sample, extensive sample preparation, or complicated fabrication procedures. Numerical modeling revealed the flexibility of this system's multiple electrode configurations to divert the particles into a desired trajectory, and the device showed the ability to concentrate microparticles through both positive and negative DEP. By relying on the particle's electrical properties to accommodate enrichment, cDEP should be able to achieve a high degree of specificity without extensive sample preparation.
The potential for batch fabrication illustrated in this work, combined with the high performance of the resulting devices makes cDEP an attractive candidate for preconcentration processes in areas where both rapid and highly accurate results of analyses are required.
Acknowledgments
This work was supported in part by the Institute for Critical Technology and Applied Science (ICTAS). The authors acknowledge Erin A. Henslee and Joseph D. Mock for their technical support.
Competing Interests Statement: The authors certify that they have no relevant financial interests in this manuscript.