
Abstract
Aptamers are oligonucleotides that can bind to various non-nucleic acid targets, ranging from proteins to small molecules, with a specificity and an affinity comparable with those of antibodies. Most aptamer-based detection strategies require modification on the aptamer, which could lead to a significant loss in its affinity and specificity to the target. Here, we report a generic strategy to design aptamer-based optical probes. An unmodified aptamer specific to the target and a fluorogenic competitor complementary to the aptamer are used for target recognition and signal generation, respectively. The competitor is a hairpin oligonucleotide with a fluorophore attached on one end and a quencher attached on the other. When no target is present, the competitor binds to the aptamer. However, when the target is introduced, the competitor will be displaced from the aptamer by the target, thus resulting in a target-specific decrease in fluorescence signal. Successful application of this strategy to different types of targets (small molecules and proteins) and different types of aptamers (DNA and RNA) has been demonstrated. Furthermore, a thermodynamics-based prediction model was established to further rationalize the optimization process. Because of its rapidness and simplicity, this aptamer-based detection strategy holds great promise in high-throughput applications.
Introduction
Aptamers are oligonucleotides that can bind tightly and specifically to various molecular targets ranging from proteins to small molecules. 1 Aptamers are usually isolated from combinatorial oligonucleotide libraries by the Systematic Evolution of Ligands by Exponential Enrichment process, 2 –4 but natural aptamers also exist. 5,6 In terms of the affinity and specificity to the molecular target, aptamers are comparable with antibodies. Moreover, because of the nucleic acid nature of aptamers, they offer certain advantages over antibodies, such as low cost, high stability, and easy to label. This makes aptamers promising candidates for applications where antibodies are routinely used. 7,8 Many different strategies to design aptamer-based optical probes have been developed. To generate the target-specific optical readout, most strategies require either sequence alteration 9 –11 or labeling 12 –19 of aptamers. Implementation of these strategies often involves a laborious aptamer-specific optimization process because even slight modifications on aptamers could lead to a significant loss in their affinity and specificity. 20 –22 Recently a few label-free design strategies, which use either photoactive polymer 23 or DNA-intercalating dyes 24 –26 to report the aptamer-target recognition event, have been demonstrated. Although no modification on aptamers is necessary in these strategies, their multiplex and in situ detection capabilities are limited.
Therefore, we recently developed a generic design strategy for aptamer-based optical probes, which does not require any modification on aptamers and is also suitable for multiplex or in situ detection. 27 In this design strategy (Fig. 1), an unmodified aptamer specific to the target and a competitor complementary to the aptamer serve as the molecular recognition and signal transduction elements, respectively. The competitor is a molecular beacon 28 oligonucleotide, which consists of a loop complementary to the aptamer and two complementary stems. A fluorophore is attached to one stem, and a corresponding quencher is attached to the other stem. In the absence of the target, the aptamer will bind to the competitor, which keeps the competitor in the “open” configuration where the fluorophore is away from the quencher, thus emitting a strong fluorescence. In the presence of the target, the aptamer will bind to the target, which allows the competitor to assume the “closed” configuration where the fluorophore is in the close proximity to the quencher, therefore leading to a decrease in the fluorescence. Recently, a strategy that uses an unmodified aptamer, a molecular beacon with the sequence of the loop same to that of the aptamer, and a short scrambled DNA sequence complementary to both the aptamer and the molecular beacon loop was reported. 29 Because of the similarity between this signal-on strategy and our signaloff one, both strategies have some shared advantages over most other existing ones. On one hand, compared with the strategies requiring modifications on the aptamer, 9 –19 these two strategies eliminate the lengthy optimization process to preserve the affinity and specificity of the aptamer. On the other hand, compared with the label-free strategies where the reporting molecules lack the selectivity against specific aptamers, 23 26 these two strategies are suitable for the multiplexing detection because different reporting molecules can be conjugated to the molecular beacons specific to the different aptamers.

Schematic representation of a design strategy for aptamer-based optical probes. An unmodified aptamer specific to the target and a competitor complementary to the aptamer are used. The competitor is a hairpin oligonucleotide with a fluorophore attached on one end and a quencher attached on the other. When there is no target, the competitor binds to the aptamer. However, on introduction of the target, the competitor is displaced from the aptamer by the target, thus leading to a target-specific decrease in the fluorescence signal.
Materials and Methods
Probe Design
For the strategy in Figure 1 to be successful, binding between the competitor and the aptamer should be strong enough so that formation of the competitor—aptamer complex will be more favorable than that of the competitor self-structure in the absence of the target but not too strong because otherwise the competitor will not be able to be displaced from the aptamer by the target. Therefore, the sequence of the competitor must be carefully selected. Instead of a pure trial-and-error experimental approach, a more rational approach is taken in designing the competitor sequence. A thermodynamic model is established to verify that a design is thermodynami-cally feasible before the experimental test. The similar approach has been used in a few studies to optimize the probe design for nucleic acid detections. 30,31 In our thermodynamic model, various reactions, including the formation of the aptamer—target complex, the aptamer—competitor complex, and the self-structure and self-dimer of both aptamer and competitor, are considered.


where A is the aptamer, AA is the self-dimer of the aptamer, Ah is the self-structure of the aptamer, T is the target, AhT is the aptamer—target complex, C is the competitor, AC is the aptamer—competitor complex, CC is the self-dimer of the competitor, and Ch is the self-structure of the competitor.
The equilibrium equations for the above reactions are as follows:
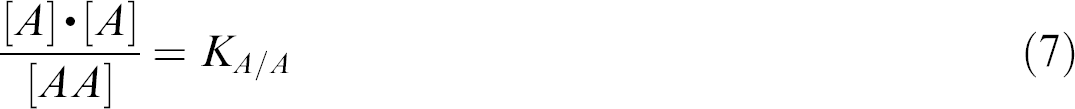
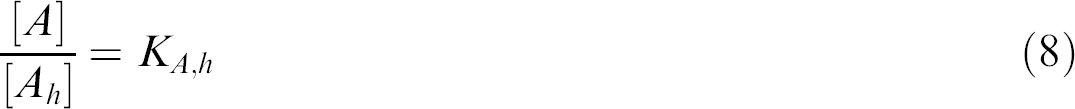
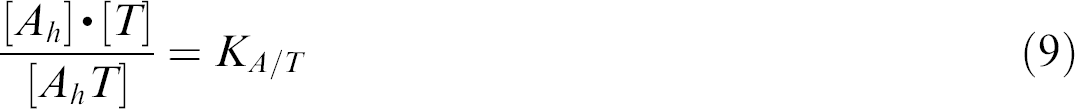
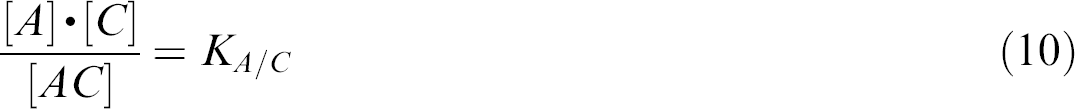
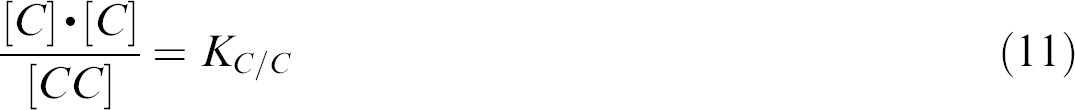
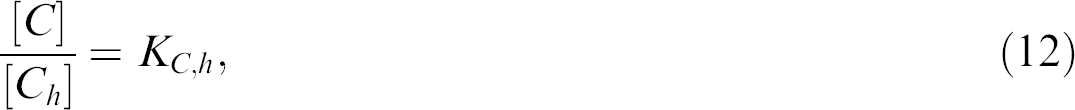
where [X] is the concentration of X (X = A, AA, Ah, T, AhT, C, AC, CC, and Ch ) at equilibrium and KA/A , KAh , KA/T , KA/C, KC/C , and KC,h are dissociation constants of AA, Ah, AhT, AC, CC, and Ch , respectively.
The mass balance equations of A, T, and C are given by:


where [X] T is the total concentration of X (X = A, T, and C). The Eqs. (7)-(15) form a closed system of equations about [A], [AA], [Ah ], [T], [AhT], [C], [AC], [CC], and [Ch ].
Except KA/T , which is found from the literature, other dissociation constants are determined from:


where R is the universal gas constant (8.314 J/K/mol), T is the absolute temperature in kelvin, and ΔGA/A , ΔGA,h , ΔGA/C , ΔGC/C , and ΔGC,h are the change of Gibbs' free energy during the formation of AA, Ah, AC, CC, and Ch. These Gibbs' free energy changes can be calculated based on the nearest neighbor (NN) model 32 with tools such as RNAstructure 33,34 and mfold. 35,36 Once all the constants are determined, the performance of a competitor design can be predicted by numerically solving the set of Eqs. (7)-(15) with Matlab (MathWorks, Natick, MA).
The above thermodynamic model helps to determine whether a certain design of the competitor, when displaced by the target, will transit from the “open” configuration to the “closed” configuration. To generate a dramatic change in the optical readout accompanying the transition, the following nonthermodynamic factors are also considered in designing the competitor.
The distance between the fluorophore and the quencher when the competitor is in the “open” configuration. Because the three aptamers used in our study (Table 1)havearelatively weak affinity to their targets, only the competitor with shorter loop or longer stems will satisfy the thermodynamic consideration. In this case, when the competitor binds to the aptamer, the fluorophore could still be brought close to the quencher by the long flexible stems. Therefore, the shared-stem molecular beacon competitors, where along with the loop, one stem is also complementary to the aptamer, are designed. An alternative way to increase the distance between the fluorophore and the quencher in the “open” competitor is to add a stretch of irrelevant nucleotides in the loop of the competitor, such as one design of the competitor C2 in Table 1.
Position of the fluorophore on the competitor. The fluorescence of the conjugated fluorophore is sensitive to the local environment. To prevent the fluorophore to be quenched by guanine, 37 the fluorophore should not be attached to the stem with a terminal guanine. To minimize the effect of the aptamer structure on the fluorophore 38 when the competitor hybridizes with the aptamer, attachment of the fluorophore to the nonshared stem is usually preferable.
Sequences of the aptamer and the competitor

IabFQ = Iowa Black FQ dark quencher; 6-FAM = 6-carboxyfluorescein. Underlined normal fonts represent the nonshared stem, underlined italics fonts represent the shared stem, and strikethrough bold fonts represent the part of the loop that is not complementary to the aptamer.
Experimental Details
Results and Discussion
Detection of Thrombin and ATP
To demonstrate the feasibility, the design strategy was first applied to detect thrombin, a key serine protease that has been linked to the prevalent diseases including cardiovascular diseases 39 and cancers. 40 Generally speaking, detection with a low-affinity recognition element tends to be more difficult than that with a high-affinity recognition element. However, to examine whether our design strategy works for the more challenging cases, we purposely chose the 15-nt antithrombin DNA aptamer, 41 whose affinity is 20–50 fold lower than that of another antithrombin DNA aptamer. 42 With the help of the thermodynamic model, a 17-nt competitor oligo with 6-carboxyfluorescein at 5′ and Iowa Black FQ quencher at 3′ was designed and tested. In the experiment, an equal molar ratio of the aptamer and the competitor was first mixed and preannealed, followed by addition of the samples containing different concentrations of thrombin. Figure 2 shows the fluorescence intensity observed after the samples were incubated with the probes for half an hour. Compared with the sample that contains no thrombin, the samples with thrombin have a lower fluorescence intensity, which indicates that thrombin displaces the competitor from the aptamer, thus allowing the competitor to take the quenched hairpin configuration. The higher the concentration of the thrombin, the lower the fluorescence intensity. This concentration-dependent decrease in the fluorescence intensity can be used to quantify the thrombin in unknown samples. To examine the specificity, the nonspecific protein bovine serum albumin (BSA) was introduced. Compared with the specific target thrombin at the same concentration, the nonspecific BSA results in only a nominal decrease of fluorescence.

Detection of human α-thrombin based on an antithrombin DNA aptamer. Experiments were carried out with 0.8 μM competitor and aptamer in the buffer containing 5 mM KCl, 1 mM MgCl2, 0.1 mM EDTA, and 10 mM Tris (pH 8.0).
To examine the applicability of our design strategy for nonprotein targets, we then applied it to detect the small molecule ATP. Two anti-ATP aptamers were used in our study. One is a 27-nt DNA aptamer, 43 and another is a 40-nt RNA aptamer. 44 Competitors were designed for the two aptamers, respectively. Figure 3 shows the experimental results of using the two aptamers and their corresponding competitors to detect the ATP. Both aptamer—competitor pairs were able to detect ATP with high sensitivity and specificity. This demonstrated the general applicability of the design strategy in Figure 1 to different types of targets (protein and nonprotein) and different types of aptamers (DNA and RNA).

Detection of ATP: (A) Based on an anti-ATP DNA aptamer. (B) Based on an anti-ATP RNA aptamer. Detection was performed in with 0.2 μM competitor/aptamer (300 mM NaCl, 5 mM MgCl2, 0.1 mM EDTA, and 10 mM Tris; pH 8.0). The competitor design Cl was used in A.
Thermodynamics-Assisted Optimization
On one hand, this design strategy greatly simplifies the optimization process by using an unmodified aptamer for target recognition and a molecular beacon competitor for signal transduction. On the other hand, in this design strategy, both target recognition and signal transduction are thermodynamics-driven processes, and therefore, it is possible to further rationalize the optimization process with a thermodynamics-based prediction model.
Before using the thermodynamic model represented by Eqs. (7)-(15) to guide the optimization process, its validity and accuracy were first evaluated. Figure 4A compares the experimental result and the prediction result for the anti-ATP DNA aptamer-competitor C1 pair. To facilitate the comparison, the experimental data are presented in terms of normalized fluorescence change 1—I/I [T] = 0, where I is the fluorescence intensity in the presence of the target and I [T] = 0 is the fluorescence intensity in the absence of the target, and the predication data are presented in terms of normalized change of the competitor-aptamer complex (AC) concentration 1-[AC]/[AC][T] = 0, where [AC] is the concentration of AC in the presence of the target and [AC][T] = 0 is the concentration of AC in the absence of the target. It can be seen that the prediction result does not completely agree with the experimental one, and however, the shape of the experimental and predication curves is similar. This implies that the prediction model is at least qualitatively valid.

Validity of the thermodynamic model: (A) Comparison of the experimental result and the thermodynamic prediction. (B) Effects of the constants on the thermodynamic prediction. 0.2 μM of the anti-ATP DNA aptamer and the competitor Cl were used in both experiments and predictions.
Considering the qualitative similarity between the experimental and numerical curves, the inaccuracy of the constants used in the predication could be an important reason for the discrepancy between the experimental result and the prediction. Therefore, the dependence of the predication result on the thermodynamic constants was investigated (Fig. 4B, Table 2). There are six constants involved in the prediction model Eqs. (7)-(15): the dissociation constants of the aptamer-target complex (KA/T ) and the Gibbs' free energy change during the formation of the aptamer-competitor complex (ΔGA/C ), the self-structure of the competitor (ΔGC,h ), the self-dimer of the aptamer (ΔGA,h ), the self-dimer of the competitor (ΔGC/C ), and the self-dimer of the aptamer (ΔGA/A ). For the anti-ATP DNA aptamer, the KA/T was reported to be 6 ± 3 μM. 43 Replacing the KA/T used in the original predication 6 μM (black curve) by 3 μM (blue curve), the difference between the predication and the experiment is decreased by ∼ 50%. The Gibbs' free energy changes ΔG estimated based on the NN model are generally quite accurate. Estimation from different online tools, such as RNAstructure and mfold, could be slightly different in some cases. However, even a slight difference in ΔG could lead to a significant change of the predication result because each 1 kcal/mol difference in the ΔG will cause a ∼ 5.4 time change in the corresponding dissociation constant. ΔG for different reactions has different effects on the predication result. As shown in Figure 4B, a 10% decrease in the magnitude of ΔGA/C (red curve) leads to a dramatic change of the prediction results compared with the original prediction (black curve); nevertheless, a 10% increase in the magnitude of ΔGC/C (magenta curve, which is overlapped with the black curve) and ΔGA/A (data not shown) causes almost no change. Therefore, when overestimated or underestimated, the constants that have a significant effect on the prediction results, including ΔGC,h , ΔGA/C , ΔGA,h , and KA/T , are more likely to be responsible for the discrepancy between the experimental result and the prediction. For ΔGA,h of the aptamer self-structure, only the secondary structure of the aptamer was considered here based on the assumption that the secondary structure is much more stable than other high-order structures. This could result in a significant underestimation of ΔGA,h because the well-defined three-dimensional structure of the aptamer, which is critical for the aptamer to recognize the specific target with a high affinity, 45 could be more stable than the secondary structure. Currently, an accurate estimation on the ΔG for the high-order structure of the aptamer can only be experimentally determined. 46 Although it is possible to further improve the accuracy of the predication model by considering the factors discussed in the above, the simple yet still semiquantitative predication model presented here is sufficient for the purpose of guiding the optimization.
Constants used for the predications in Figure 4B
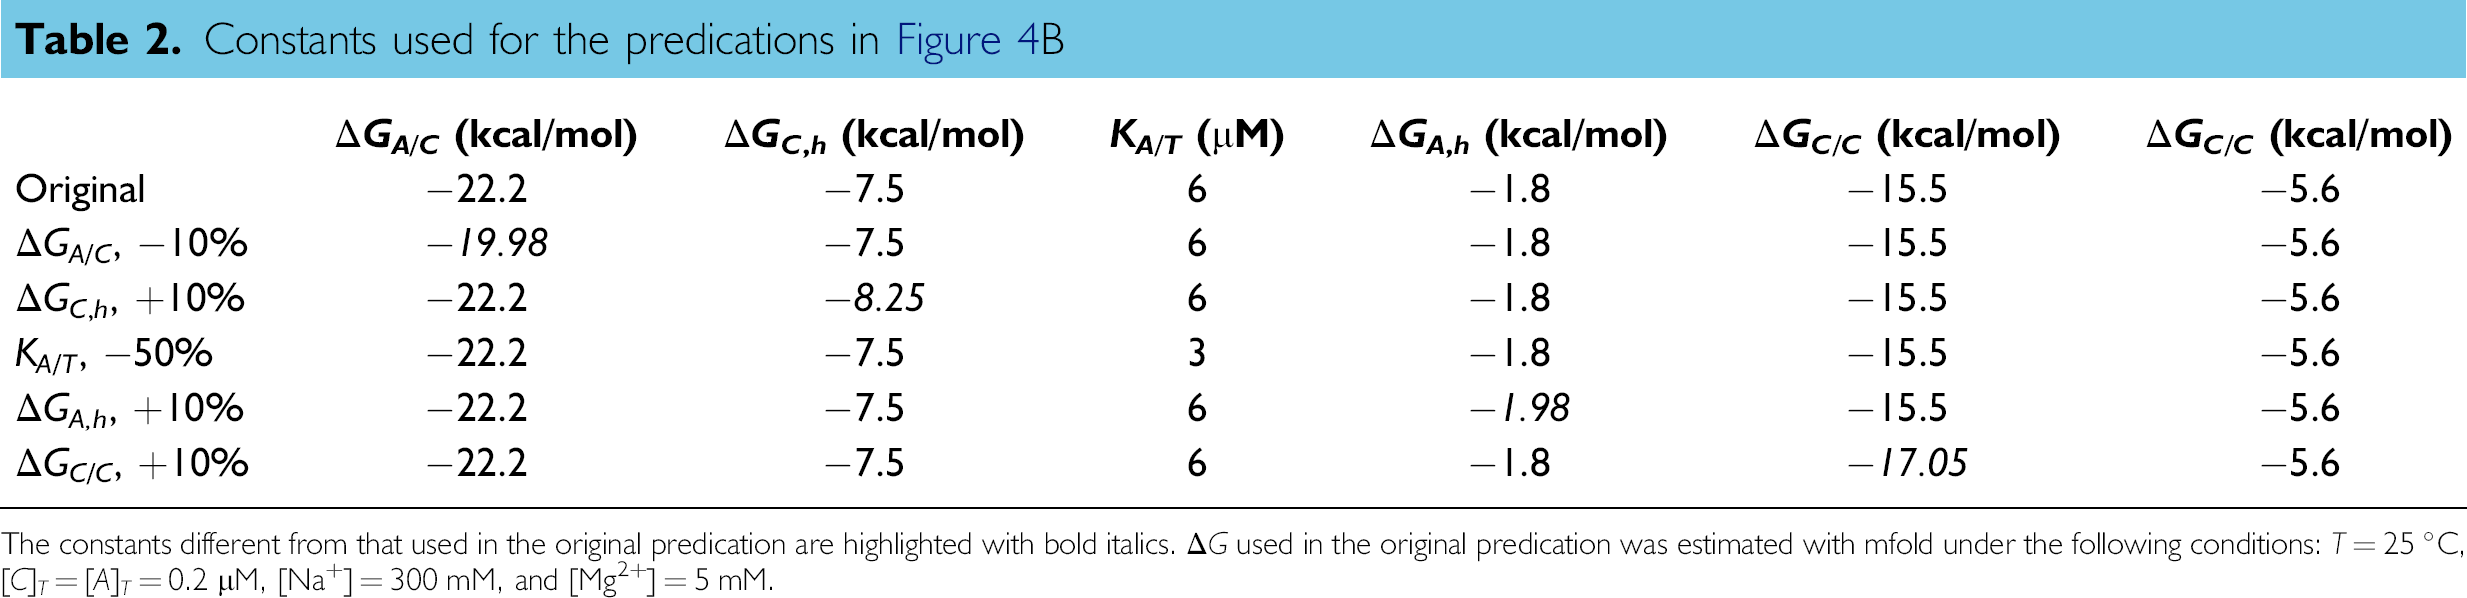
The constants different from that used in the original predication are highlighted with bold italics. ΔG used in the original predication was estimated with mfold under the following conditions: T = 25 °C, [C]T = [A] T = 0.2 μM, [Na+] = 300 mM, and [Mg2+] = 5 mM.
In Figure 5, the prediction model was used to compare the two designs (C1 and C2) of the competitor for the anti-ATP DNA aptamer. C1 and C2 differ in both ΔGA/C (−22.2 vs −16.8 kcal/mol) and ΔGC,h (−7.5 vs −4.6 kcal/mol). Therefore, the stability of the competitor-aptamer complex and the competitor self-structure is higher for C1 than C2. Figure 5A shows the normalized change in the concentration of the aptamer-competitor complex [AC] when varying concentration of the target is present. The normalized [AC] change reflects the normalized fluorescence change. The saturation is reached at the lower target concentration with C2, which indicates that C2 has a smaller dynamic range but a higher sensitivity compared with C1. In addition to the normalized [AC] change, the absolute level of [AC], which reflects the fluorescence intensity, is also an important consideration when comparing different designs. Generally, the higher the fluorescence intensity, the higher the signal-to-noise ratio of the fluorescence measurements. As shown in Figure 5B, use of the design C2 is expected to lead to a poorer signal-to-noise ratio because of the lower fluorescence intensity. To verify whether the comparison made between C1 and C2 with the prediction model is valid, both C1 and C2 were tested in the experiment. As shown in Figure 5C, the normalized fluorescence change is significantly higher at the low target concentration range with C2 than with C1, which indicates that limit of detection with C2 is better than that with C1. As implied by the error bar in Figure 5C, the variation of fluorescence measurements has a larger effect on C2, which is because of the relatively weaker fluorescence intensity (Fig. 5D). The observation in the experiment generally agrees with the predication, and this proves that optimization of the competitor design based on the thermodynamic predication is valid.

Effects of the competitor design: (A, B) experimental and(C, D) prediction results. 0.2 μM of the anti-ATP DNA aptamer and the competitor C1 or C2 were used in both experiments and predictions.
Furthermore, the thermodynamics-based predication model can also be used to optimize the experimental conditions. One such example is shown in Figure 6. The predication shows that the lower the concentration of the aptamer and the competitor, the lower the absolute [AC](Fig. 6B) but the higher the normalized [AC] change (Fig. 6A). The same trends were observed in the experiment (Fig. 6C,D). Therefore, the predication model can be used to find out the optimal concentration of the aptamer and the competitor for a certain circumstance. Besides the concentration of the aptamer and the competitor, other experimental conditions that can be reflected in the thermodynamics-based predication model, such as temperature and buffer composition, can also be optimized in a similar way.

Effects of the probe concentration: (A, B) experimental and (C, D) prediction results. The anti-ATP RNA aptamer and the competitor were used in both experiments and predictions.
Conclusion
We developed a generic design strategy to detect non-nucleic acid targets with an unmodified aptamer and a fluorogenic competitor, which was partially complementary to the aptamer. First of all, compared with most of the design strategies where extensive optimization is necessary to preserve the affinity and specificity of the modified aptamer, elimination of modification on aptamers greatly simplifies the implementation of the design strategy. This has been demonstrated with different types of non-nucleic acid targets (small molecules and proteins) but also with different types of aptamers (DNA and RNA). Second, compared with the label-free design strategies, which use nonselective dye to generate the optical output and thus suffer from limited applicability in multiplex detection, the current strategy allows different dyes to be used to monitor different targets and has the capability to simultaneously detect multiple targets. Third, the thermodynamics-based predication model enables the rational optimization on not only the probe design but also the experimental conditions.
Because of the rapidness and simplicity in developing and performing the detection assay, the design strategy holds promising potential in many high-throughput applications. For a particular application, the design strategy should be optimized to satisfy the corresponding requirements on various aspects such as sensitivity, specificity, and detection time. If a high sensitivity is required, the sensitivity could be improved by using high-affinity aptamer, changing the sequence and the dye—quencher pair of the competitor, and/or optimizing the probe concentration and the buffer composition. If a high specificity is needed, the major sources of non-specificity in the detection environment should be carefully identified and minimized. If a fast detection is desired, optimization could be carried out on binding kinetics between the aptamer and the competitor (e.g., tune the length and GC contents of loop and stems in the molecular beacon competitor) and/or the binding kinetics between the aptamer and the target (e.g., manipulate the length of incubation time during in vitro selection cycle).
Acknowledgments
This work was supported by National Institutes of Health (NIDCR/NIH U01 DE017790) and College of Engineering, University of Miami (startup funds of NL).
Competing Interests Statement: The author certifies that he has no relevant financial interests in this manuscript.