
Abstract
When a gaseous bubble in liquid is excited by acoustic waves, it oscillates (expands and shrinks) at the wave frequencies and generates strong vortical flows around it, the so-called cavitational microstreaming. This article describes the development of a micropumping principle using cavitational microstreaming. The key idea is to place a capillary tube vertically above an oscillating bubble to collect the upward microstreaming flow. When the bubble is excited at its resonance frequency, it oscillates with surface undulations (surface wave mode) and pumps water through the tube. The performance of this pumping mechanism is experimentally studied using millimeter and microscale bubbles. The flow rate and generated pressure are measured in a variety of conditions. The measured results indicate that the present pump falls into the category of moderate-flow-rate and low-pressure type pumps. The present pump operates without physical connections or electrical wiring to the bubbles, implicating potential applications as implantable micropumps in many lab-on-a-chip type systems.
Introduction
Development of microelectromechanical systems has had a great impact in microfluidics, miniaturizing macroscale fluid operations and thus realizing various automated handheld systems for biomedical and homeland security applications. In these systems, commonly required fluid operations are pumping, 1,2 mixing, 3 –5 valving, 6 separating, 7,8 collecting, 9,10 and so on. Among these, micropumping may be the most critical and important as more than several hundred journal articles concerning micropumping have been published since the micropump was introduced in 1990. 11 At the be ginning of the microfluidics era, the main focus of micropump research was on reciprocating displacement type micropumps with moving actuators. Having an analogy with moving boundaries, such as pistons in macroscale pumps, deformable microscale plates or membranes are miniaturized for the moving boundary components to generate high pressure. As a result, the pumping principle is essentially based on pressure-driven flows. Depending on the actuation principle of microplates or membranes, these reciprocating displacement type micropumps can be subcategorized: piezoelectric disk actuator, 11,12 electrostatic force, 13,14 thermopneu-matic force, 15,16 shape memory alloy, 17 electromag-netic, 18 electrowetting, 19 and so on.
Although the above displacement type pumps can be used for a variety of fluids, the pressure-driven pumping methods may not be efficient in cases at the microscale because the pressure drop in the flow passage is inversely proportional to the fourth power of the hydraulic diameter. As alternatives to the pressure-driven method, attention has been drawn to harnessing other dominant forces in the microscale, which were typically considered negligible in many macroscale applications. Such dominant forces include surface tension (thermocapillary and electroca-pillary 20,21), electrohydrodynamic forces, 22,23 electroosmotic flows, 24 magnetohydrodynamic forces, 25,26 and acoustic forces. 27 In the past few decades, characterization and development of these pumping principles have significantly advanced. Recently, some of these alternative methods have been proven efficient even in real-world applications. Among many, the most important advantage of these pumping principles is that they do not necessarily require moving parts, resulting in simple fabrication. In general, however, the applicability of the various principles is limited to particular fluids and conditions, as opposed to pressure driving, which can be used for virtually all types of fluids.
This article describes a novel micropumping principle using acoustically excited oscillating microbubbles. This pumping method harnesses the cavitational microstreaming flow generated by oscillating bubbles (Fig. 1). When the frequency of oscillation is close to the bubble resonance frequency, the induced flow patterns are generally similar to the toroidal vortical structure shown in Figure 1A: nearly straight flows directly above the bubble's apex and circulating flows at either side of the bubble's apex. The key idea in the present pumping principle is to confine and collect the linear flow near the bubble apex into a flow passage, such as a capillary tube (Fig. 1B). This pumping principle is different from the one developed by the group of Tsai and Lin 28 in which thermal generation and elimination of bubbles in a diffusernozzle-connected chamber generate pumping. They used bubble motion to generate pumping similar to that produced by physical membranes. To prove the present idea, a capillary tube is placed near the top of an oscillating bubble, and the flow rate and pressure drop in the capillary tube are measured. In the following sections, the detailed experimental setup and the testing results will be presented. The first idea and some preliminary results for a proof of the concept were presented in the 2007 Micro Total Analysis System conference. 29 Most recently, Tovar and Lee 30 reported pumping and mixing using multiple oscillating bubbles trapped in a microfabricated coplanar chip.

(A) General description of streamlines of the cavitational microstreaming flow. The bubble is acoustically excited at its resonance frequency using the PZT actuator underneath the substrate. As a result, vortical flows are generated around the bubble. (B) The key concept of the present pumping principle is to collect only upward flows in the cavitational microstreaming into a capillary tube.
Experimental Setup
Figure 2 shows the experimental setup in which a capillary tube is situated above the bubble's apex. A plastic rectangular parallelepiped reservoir (poly vinyl chloride, 30 × 20 × 20 mm) is filled with deionized water. To provide the acoustic waves, a ring-shaped bulk piezo actuator (Omega Piezo Technologies Inc., State College, PA; PZT-5; outer diameter 25 mm, inner diameter 10 mm, thickness 3 mm) is directly attached to the base of the water reservoir using Scotch double-sided tape. A parylene-coated glass plate (10 × 10 × 1 mm) is placed on the bottom of the reservoir. The parylene layer (a few micrometers thick) is coated using a vapor deposition process (Specialty Coating System, Indianapolis, IN). An air bubble is injected on the plate using a micropipette. Because of the hydrophobicity of the parylene layer on the plate, the bubble sticks to the substrate with a contact angle of approximately 90°. Without the hydrophobic layer, the bubble would have a tendency to easily detach from the plate because of buoyancy forces. In the present bubble sizes and conditions, the lifetime of the bubble is more than a couple of hours. For more details, refer to Chung et al. 31 A sinusoidal voltage is generated by a function generator (33220A; Agilent Technologies, Santa Clara, CA), amplified by a power amplifier (PZD700; Trek, Medina, NY), and applied to the piezo actuator.

Illustration of the experimental setup: (A) experimental schematic and (B) camera, testing section, and three-dimensional traversing system.
The piezo actuator generates sinusoidal acoustic waves that pass through the plastic chamber and the glass substrate and reach the water medium. The frequency of the sine wave is set at the resonance frequency of the bubble in most of the experiments. The resonance frequency f b of the bubble can be roughly predicted based on Minnaert's 32 equation:
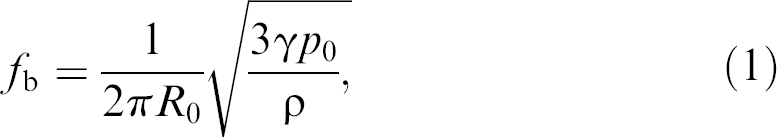
where p denotes the mass density of the surrounding liquid, γ is the specific heat ratio of the gas, p 0 is the steady-state pressure, and R 0 is the steady-state bubble radius. This equation is valid only for suspended spherical bubbles. It may be derived by comparing the kinetic energy of the liquid with the maximum internal energy of the gas within the bubble under the assumptions of negligible heat flow and negligible surface tension. For air bubbles in water in the standard condition, the equation may be reduced to the form: f b • R o ≈ 3 m/s. 33 However, because this equation is developed for spherical bubbles suspended in a medium, not hanging bubbles on the surface in the present experiment, it is only used to roughly predict the resonance frequency in this experiment. The actual resonance frequency is experimentally determined by adjusting the frequency in 10-Hz increments. The frequency corresponding to the largest oscillation amplitude of the bubble is the resonance frequency. During this process, images captured from regular-or high-speed cameras are used. For example, when the bubble diameter a is between 1 and 2 mm, the excitation frequency ranges between 2 and 6 kHz.
To collect the linear, vertical flows above the bubble apex, a capillary tube is held in place directly above the bubble's apex using a three-dimensional traversing system (Fig. 2). This system allows an accurate (3-μm resolution) control of the distance between the bubble and the tube inlet. In this configuration, the resonance frequency of the bubble is slightly lower than that in the case without the capillary tube because the tube disturbs the overall cavitational streaming flow around the bubble. In particular, in case that the tube is placed laterally off the bubble center to some degree, it is found that the resonance frequency significantly changes and thus the collected flow becomes weaker.
To visualize the flow and measure the flow rate in the tube, microparticles (green fluorescent polymer microspheres, 1% solids; Duke Scientific Corp.) are initially seeded in the water medium. The diameter of the particles is 10μm, which is small enough to trace the flow without slip but large enough to provide clear and bright images for flow tracing. Because the particle density (1.05 g/cm3) is similar to the water density, the particles are suspended during the experimental periods. To minimize any disturbance on the flow or movement of the bubble, the particle population is maintained within the proper range of 5–10 particles per 1μL. To measure the flow rate in the tube, the seeded particles are traced far downstream of the tube inlet where the flow becomes a fully developed laminar pipe flow. Assuming that the velocity profile across the tube cross section is parabolic, the flow rate is inferred after time-averaging the maximum velocity of the particles in the tube as measured from the particle tracing images.
While the bubble is oscillating, its shape and oscillating mode are observed using a high-speed digital camera (Phantom v7.3, Wayne, NJ). Videos can be recorded at up to 100,000 frames/s, fast enough to capture up to 25 frames during one period of 4 kHz acoustic actuation. High frame rates limit the exposure time of each frame, so the pictures will be dimmer. The intensity of the light entering the camera needs to be increased to provide clear pictures at high frame rates. A halogen lamp (Osram Enh, 250 W) is used to provide the high-intensity light source. Because of the large amount of water in the chamber and the short exposure time, the temperature increase resulting from the light source was not noticeable.
Results and Discussion
Initial Condition and Bubble Shape
Figures 3A-1, A-2, and A-3 illustrate the top and side views of a 1.6-mm bubble when excited at 3.5, 4.0, and 4.4 kHz, respectively, with no capillary tube above the bubble. The pictures are taken at 32,700 frames/s using the high-speed digital camera. At 4.0 kHz, the bubble oscillation is most prominent with surface undulations, the so-called surface wave mode. This frequency is regarded as the resonance frequency in this configuration. 34,35 In the top view, the bubble has 11 undulation cycles along its circumference and 5 undulation cycles in the side view. Figure 3A-4 shows how the bubble interface oscillates in the time domain. The displacement of the bubble interface is measured at a slightly higher position than the three-phase contact line where the first anti-node in undulation is placed. The contact line of the bubble is considered to be a node in undulation. In Figure 3A-4, the oscillation amplitude is ±54μm, which corresponds to ±3.3% as compared with the averaged bubble diameter a = 1.6 mm. When the bubble is oscillated, the average bubble diameter is 2% larger than the initial diameter because the bubble spreads out. At the frequencies of 3.5 and 4.4 kHz, the oscillation amplitude is much smaller than that at the resonance frequency of 4.0 kHz. In addition, the oscillation mode is not surface wave mode but is closer to the axisymmetric mode.

(A) With no tube installed, high-speed images of bubble oscillation under various acoustic waves. The 1.6-mm bubble oscillates at 3.5 (A-1), 4.0 (A-2), and 4.4 kHz (A-3). The oscillation amplitude is maximum at the frequency of 4.0 kHz. (A-4) Time trace of the bubble diameter at the position of the first anti-node from the substrate in undulation in (A-2) case. (B) With a tube installed, the bubble (a = 1.6 mm) with the tube installed is excited at four different actuation frequencies of 3.2 (B-1), 3.5 (B-2), 3.7 (B-3), and 4.0 kHz (B-4). (B-5) Time trace of the bubble diameter at the position of the first anti-node from the substrate in undulation in the case of 3.7-kHz excitation.
When a tube (inner diameter 1 mm) is placed above the bubble, it is observed that the resonance frequency of the bubble becomes lower than that in the case without the tube. This means that the proximity of the tube disturbs the bubble oscillation. Figure 3B shows bubble oscillations at four different actuation frequencies, 3.2, 3.5, 3.7, and 4.0 kHz, with a tube installed. The maximum oscillation is found at the frequency of 3.7 kHz, which is slightly lower than the resonance frequency (4.0 kHz) in the absence of the tube. More interestingly, the main frequency component in the bubble oscillation is two times larger than the actuation frequency, which means that the bubble is oscillating most prominently at the second harmonic. However, similar to the previous case without the tube, the oscillation amplitude is set at around ±54μm (±3.3% compared with the average bubble diameter, 1.6 mm). Unless mentioned, the oscillation amplitude is set at this level in most of the following experiments.
Pumping Test with Contact Line in Tube
As shown in Figure 4, to see if the oscillating bubble generates pumping, the inlet of a straight capillary tube (inner diameter D is 1 mm) is located above the bubble in the water, whereas the tube outlet is exposed to the atmosphere (Fig. 4A). The distance between the inlet and the substrate surface Δ is 0.6 mm, and the bubble base diameter a is 1.5 mm. The capillary rise because of the hydrophilicity of the inner wall is measured at 4 mm (the water column is held by surface tension at the contact line at the top water surface in the tube). When the bubble is oscillated at the resonance frequency, 4 kHz (Fig. 4B,C), the change in the meniscus curvature at the tube outlet and a slight rise (0.035 mm) of the water level in the tube are observed. Furthermore, the bubble becomes slightly flattened in the presence of acoustic excitation and tube. This experiment clearly shows a pressure generation from the oscillating bubble. However, the generated pressure is not strong enough to advance the contact line at the tube outlet. The contact angle hysteresis at the contact line comes into play as a strong resistance. In more preliminary, qualitative experiments in the straight tube configuration (0.5 < D/a < 1), we consistently observed pressure generation with no meniscus advancement (data not shown)

Pressure generation by the oscillating bubble. (A) Experimental setup of bubble pump. A straight capillary tube is placed vertically above the oscillating bubble to collect upward flows in the cavitational microstreaming. (B) Before acoustic excitation. (C) During acoustic excitation, the curvature of the top meniscus in the tube decreases with a slight increase in water height, showing the excited bubble generating a pressure.
Flow Pumping without Contact Lines in Tube
As shown in the previous section, the generated pressure is not strong enough to move the contact line. To see any flow pumping in the absence of the contact line, the tube outlet is extended to reach the water reservoir using a U-type capillary tube (10 cm) (Fig. 5A) with the right end of the tube placed above the oscillating bubble. Note in this configuration that both ends of the U tube are immersed in the same reservoir and the tube is filled with water so that there is no contact line along the tube. For flow visualization in the tube, microparticles are seeded in the water. From the sequential images shown in Figure 5C, it is evident that the oscillating bubble pumps the liquid through the capillary tube. Based on the average particle speed U and the tube's inner diameter D, the Reynolds number of the tube flow (Re = UD/v) is calculated to be 0.6, at which the flow would be a fully developed Poiseuille flow ∼ 0.04D downstream from the tube inlet. Here, v is the kinematic viscosity of the fluid.

Flow generation by bubble oscillation. (A) Experimental setup of bubble pump. The inlet of the U tube is placed above the oscillating bubble, whereas the outlet is immersed in the water reservoir. As a result, there is no contact line in the tube. (B) Configuration of the tube inlet and bubble. The bubble diameter is 1.6 mm, and the tube's inner diameter is 1.5 mm. (C) Particles are seeded and traced to measure the flow velocity and the flow rate in the tube. The measured flow rate in the tube is 0.24μL/s.
In this pumping method, many parameters such as the tube diameter D and the distance Δ between the tube inlet and substrate affect the flow rate. Figure 6A shows the flow rate (velocity) versus the tube's inner diameter, D. The data are averaged from three experiments, and the data scattering because of tube misalignment is less than 20%. As D increases, the flow velocity in the tube decreases. This is attributed to the fact that the larger tubes may collect circulating flows from the cavitational microstreaming around the bubble, which does not contribute to the vertical flow velocity. As a result, the flow rates are comparable in all the three tube diameters, even though the pressure resistance for the larger tube diameters becomes smaller. It is expected that the flow rate with smaller tubes may not be significantly higher than the results in Figure 6A because the flow resistance through the smaller tube becomes higher. Therefore, the optimum tube diameter in terms of the flow velocity is expected to be about half of the diameter of the bubble.
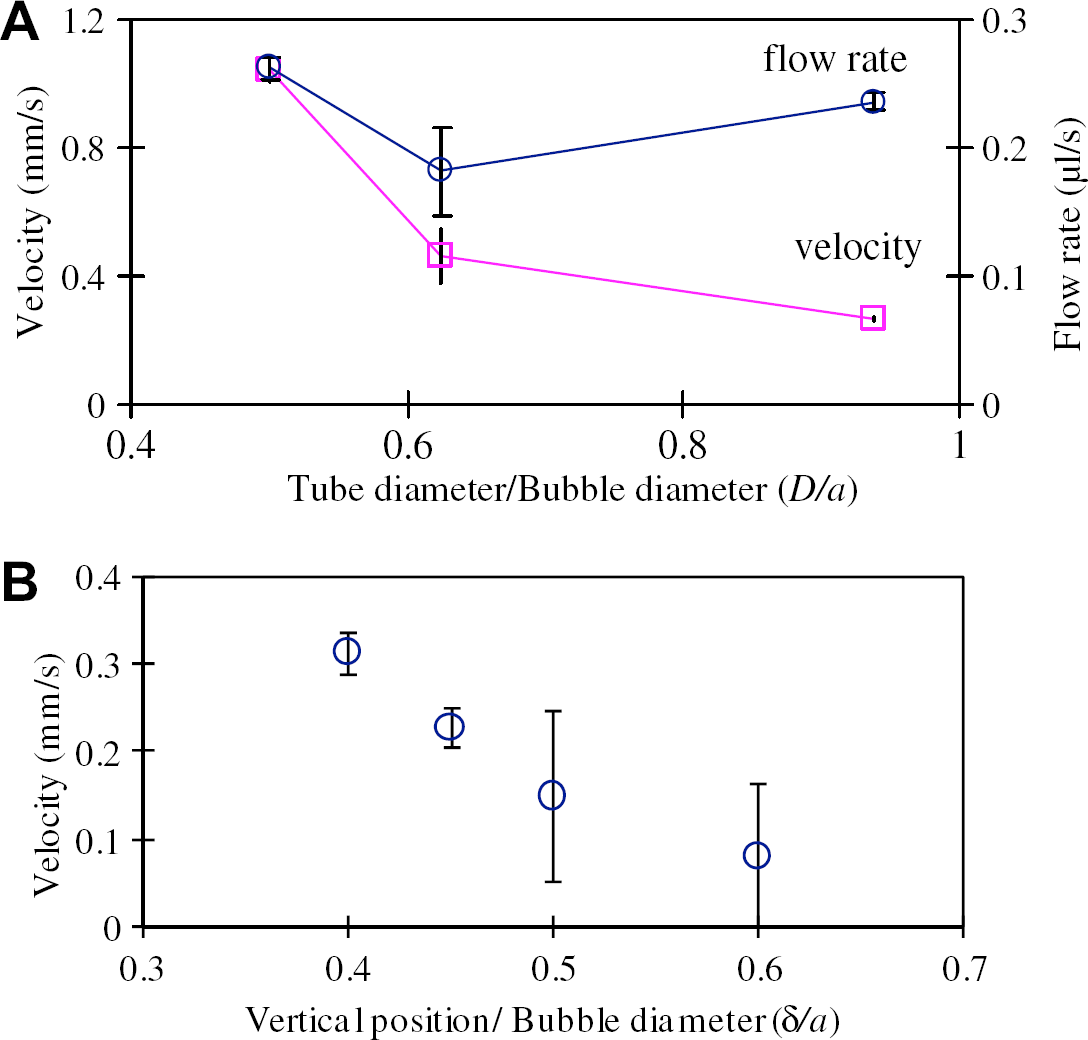
(A) The effect of the inner diameter of the tube on the pumping velocity and flow rate. In all cases, bubbles are in contact with the tube inlet rim. (B) The effect of the vertical position of the tube inlet (Δ) on the pumping velocity. When Δ/a = 0.4 (the bubble is in contact with the tube rim), the velocity is maximum.
The effect of the distance Δ (defined as the distance between the substrate and the tube inlet) on the flow velocity is also studied (Fig. 6B). As the distance Δ increases, the velocity monotonically decreases. This is in agreement with the fact that the strength of the cavitational microstreaming flow becomes significantly weaker as the distance from the bubble surface increases. However, it is not confirmed quantitatively that effects of D/a and Δ/a shown in Figure 6 would be similarly applicable to the generated pressure in the straight tube configuration.
Dependence of Flow Rate on Back Pressure
To study the dependence of the flow rate on the pressure load at the tube outlet, the downstream pressure load should be precisely controlled within the pressure range that the present micropump can generate. However, because the present pressure generation is not high, it is not easy to precisely change the pressure load in the range. So, a new method is devised to continuously change the downstream pressure load within the entire range of the pressure that the micropump can generate. As shown in Figure 7, a U-type capillary tube is used, the two ends of which are immersed in two separate reservoirs. The bubble is placed underneath the left end (inlet) of the U tube in the left reservoir, whereas the right end (outlet) is submersed in water in the right reservoir. The U tube is completely filled with water, and the hydrostatic pressure at the inlet and outlet creates a flow until equilibrium is reached. As a result, the water levels in both the reservoirs are the same before bubble excitation. The excitation frequency is set to obtain the maximum flow rate after aligning the inlet of the tube with the bubble. As the bubble is excited, the water level of the left reservoir becomes lower, whereas the water level of the right reservoir becomes higher because the oscillating bubble pumps water from the left reservoir to the right reservoir. As time goes on, the flow rate in the tube gradually decreases because of the higher water level in the right reservoir, that is, higher pressure load in the downstream reservoir. Finally, the flow stops when the pressure load becomes equal to the maximum pressure the oscillating bubble can generate. In this case, the bubble pump operates under a continuously changing outlet pressure. By measuring the flow rate at a given time, the dependence of the flow rate on the back pressure can be obtained. When the bubble excitation is turned off, the flow is reversed (i.e., the flow returns from the right back to the left reservoir), and the water levels in both reservoirs are equalized again. The inner diameter D of the capillary tube is 1.5 mm, the bubble base diameter a is 1.8 mm, the applied excitation frequency is 2.7 kHz, the length of the tube is 12 cm, and the distance between the inlet and the substrate surface Δ is 0.6 mm. The horizontal cross-sectional area of the reservoirs is 29 × 66 mm2.
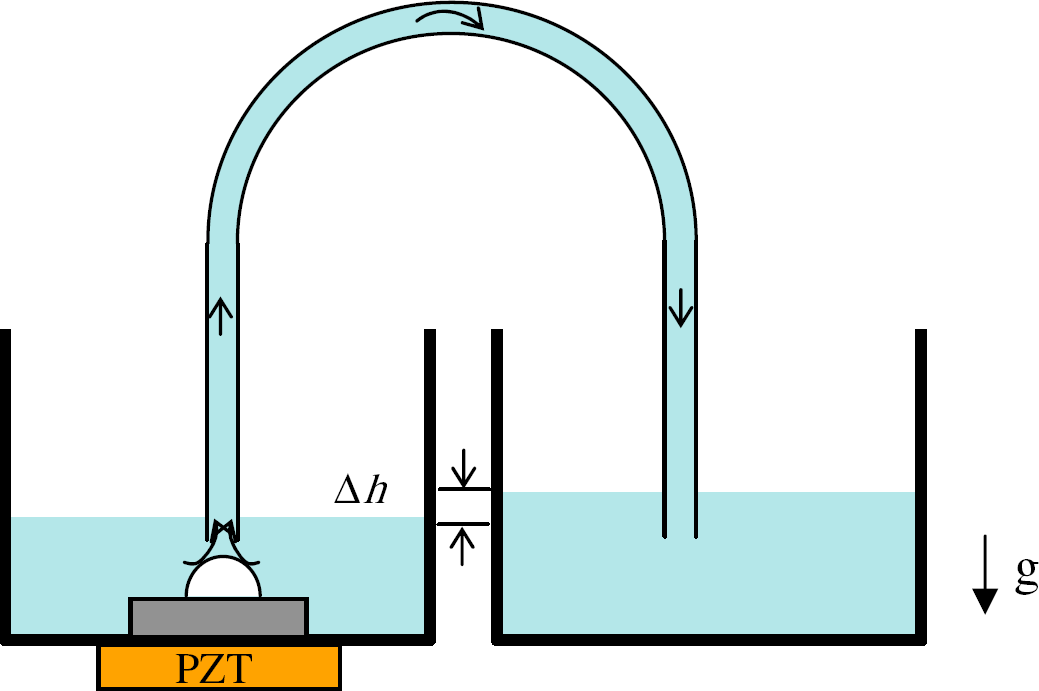
Configuration for studying the dependence of the back pressure on the flow rate.
The dependence of the flow rate on the outlet pressure is shown in Figure 8. Time integration of the flow rate measured from the tracing particle provides the total volume that is pumped from the left to right reservoirs. The water level difference between the reservoirs can be inferred from the total volume at a given time. As a result, the outlet pressure load can be calculated from the water level difference. In this pressure load calculation, the contribution by the contact angle hysteresis on the reservoir walls is not taken into account because the area of the reservoirs is very large. Initially, the flow rate is maximum, close to ∼0.6μL/s, because the water level difference is zero. At subsequent times, the water level pressure increases and causes a decrease in the flow rate. It takes approximately 7–10 min for the flow rate to decrease to zero. At zero flow rate, the maximum back pressure is about 1 Pa. The trend in Figure 8 is very similar to the typical performance curve of pumps and, more specifically, classifies the present pump as a low-pressure, moderate-flow-rate type pump. 36
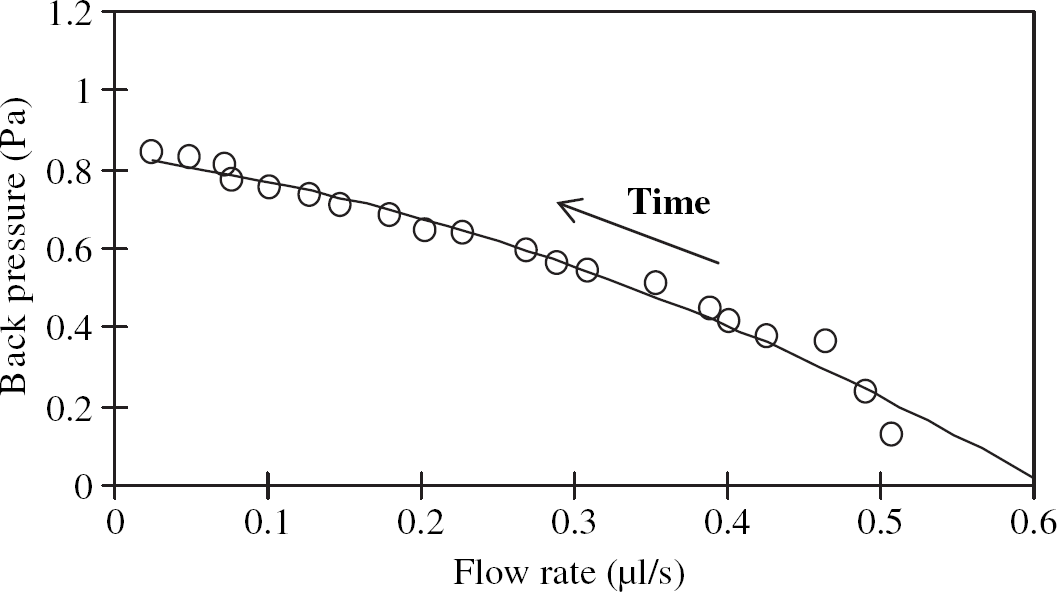
Dependence of the flow rate on the back pressure. The trend is similar to the typical performance curve of other type pumps. The solid line is curve-fitted from the data using a second-order polynomial.
Pumping with Micron-Size Bubbles
Pumping is investigated using a micron-size bubble. Interestingly, pumping becomes significantly stronger as the bubble size decreases. Figure 9 shows a U tube experimental setup similar to that in Figure 5 and particle tracing results in the U tube. The main difference from the setup in Figure 5 is that the bubble diameter is 400μm and the tube's inner diameter is 300μm, much smaller than the previous millimeter scale. The maximum velocity in the tube is measured at 5.3 mm/s, about five times faster than the millimeter scale pump. The corresponding pressure load along the tube is calculated to be about 250 Pa, significantly higher than that with the millimeter-size bubbles. In addition, when a straight tube was used instead of the U tube, it was observed that the contact line at the straight tube outlet was moved by bubble pumping (results not shown here). The mechanism responsible for this significantly enhanced pumping performance is not clearly understood. It is speculated that this may be because of different modes of flow pattern. We are investigating in depth this phenomenon with flow field measurements. Nonetheless, it implies that the present pumping method may be more feasible in applications involving microscale pumping devices.

Flow generation using a micron-sized bubble. (A) Experimental setup. (B) Configuration of the tube inlet and bubble. The bubble diameter is 400μm, and the tube inner diameter is 300μm. (C) Particles are seeded and traced to measure the flow velocity and the flow rate in the tube. Streak lines of the particles are visible. The measured maximum velocity is 5.3 mm/s, and the corresponding flow rate in the tube is 0.19μL/s under the pressure load of 253 Pa.
Concluding Remarks
When a gaseous bubble is excited by an acoustic wave, it oscillates in harmony with the wave and generates strong vortical flows, the so-called cavitational microstreaming. In this article, a new micropumping method using oscillating bubbles is developed and studied experimentally. The key idea in this pumping method is the installation of a capillary tube above the oscillating bubble to collect the linear, vertical microstreaming flow into the capillary tube.
First, using a high-speed camera, oscillation mode of the millimeter-size bubble is identified as surface wave mode where the bubble surface undulates with several nodes and antinodes. When the capillary tube is placed above the bubble, the bubble oscillates in a similar surface wave mode, except that the second component is more prominent than the fundamental frequency. On bubble oscillation, it is observed that the height of the water level in the open-ended tube rises, showing a pumping pressure generation. However, there is no contact line movement in the tube because of the low strength of the pressure generation. In the absence of the contact line in the tube, continuous-flow pumping is generated by the oscillating bubble. The effects of the capillary diameter and the distance between the bubble and the capillary inlet on the flow rate are experimentally studied. The flow velocity monotonically decreases as the tube diameter increases and also as the distance increases.
To characterize the dependence of the pumping flow rate on the outlet pressure load, the outlet pressure is continuously changed using two reservoirs that are connected through a U-type capillary tube. One end of the U tube is placed above the oscillating bubble in the first reservoir, whereas the other end of the U tube is open and immersed in the second reservoir. As water is pumped by the oscillating bubble, the water level in the first reservoir lowers, whereas the water level in the second reservoir rises. As a result, the oscillating pump experiences the continuously increasing outlet pressure during operation. By measuring and time-integrating the flow rate in the tube, the water level difference and thus the outlet pressure are calculated. It is shown that the dependence of the flow rate on the outlet pressure is very similar to conventional performance curves of other types of pumps. The present millimeter-scale bubble pump can reach a flow rate of ∼0.6μL/s and can generate a pressure of ∼1 Pa.
The present bubble pumping is evaluated using a micron-size bubble (400μm diameter) and a microcapillary U tube (300 mm inner diameter), as shown in Figure 9. Streak lines of the particles are visible (Fig. 9C). From the particle tracing, the pumping velocity is measured to be ∼5 mm/s under the pressure load of ∼250 Pa. These results imply that the present pumping mechanism may become more efficient as the device scale decreases. However, more in-depth studies are required for a better understanding of microscale pumping.
The present pumping principle requires neither mechanically moving parts nor complex wiring for signal and power inputs. To activate pumping, acoustic waves from an external acoustic transducer (including the currently existing and popular ultrasonic transducers for ultrasound imaging) can be wirelessly applied to the target locations.
Acknowledgment
This work is, in part, supported by the National Science Foundation (ECCS-0601470, ECCS-0725525, and CMMI-0730460) grants.
Competing Interests Statement: The authors certify that all financial and material support for this research and work are clearly identified in the manuscript